Article

Dynamic Evolution, Spatial Differences, and Driving Factors of China’s Provincial Digital Economy

1
School of Geography Science, Nanjing Normal University, Nanjing 210023, China
2
Jiangsu Center of Collaborative Innovation in Geographical Information Resource Development and Application, Nanjing 210023, China
*
Author to whom correspondence should be addressed.
Sustainability 2022, 14(15), 9376; https://doi.org/10.3390/su14159376
Submission received: 10 July 2022 / Revised: 28 July 2022 / Accepted: 28 July 2022 / Published: 31 July 2022

Abstract

:
The digital economy is critical to national economic growth and high-quality economic development. It is theoretically and practically significant to measure the development level and spatial differences in the digital economy to promote the construction of a digital China. This study constructed a digital economy evaluation index and analyzed the dynamic evolution, spatial differences, and driving factors of China’s provincial digital economy from 2011 to 2020 using a spatial Markov chain, the Dagum Gini coefficient, and geographical detector methods. The results demonstrated that China’s provincial digital economy grew from 2011 to 2020. The spatial distribution of the digital economy was high in eastern provinces and municipalities such as Beijing, Shanghai, Guangdong, Jiangsu, and Zhejiang, and low in central and western provinces and autonomous regions. The probability of upward transfer in developing China’s provincial digital economy was greater than that of preserving the original state, and China’s provincial digital economy has great potential for development. A region with a medium-high level in the digital economy is more likely to achieve high-level development when neighboring regions are characterized by a medium-high or high level of digital economy development, as the spillover effects from the neighbors may be strongly favorable and the region takes advantage of its developed surroundings. There were significant spatial differences in the development of China’s provincial digital economy, caused primarily by inter-regional differences. The spatial differentiation of China’s provincial digital economy was caused by the interaction of multiple factors, led by economic conditions and R&D expenditure.

1. Introduction

In 2016, the “G20 Digital Economy Development and Cooperation Initiative” referred to the digital economy as a series of economic activities with digital knowledge and information as key production factors and the modern information network as an essential carrier. The digital economy is relevant to transforming the industrial structure and developing the economy.
In recent years, the Chinese government has promulgated a series of policies aimed at vigorously promoting the construction of digital infrastructure, the development of the digital industry, and accelerating the construction of a digital China. “The Outline of the 14th Five-Year Plan for National Economic and Social Development of the People’s Republic of China and the Outline of Vision 2035” (“Outline”) once again highlights the need for and importance of accelerating the development of the digital economy. The “14th Five-Year Plan for Digital Economy Development” issued by the State Council of China establishes a blueprint for developing the digital economy with clear instructions. According to the “Digital China Development Report (2020),” the total value of China’s digital economy has jumped to second place in the world, and the digital economy has played an important role in China’s national economy.
The development of the digital economy has promoted the in-depth integration and development of digital elements and multiple industries in the national economy, and digital technology has accelerated the flow of social resources, which enables the rapid development of the real industrial economy and promotes profound changes in production and lifestyle. However, China’s digital economy is now facing a challenging situation of unbalanced and uncoordinated development. Therefore, studying the dynamic evolution, regional differences, and driving factors of the digital economy is highly relevant to bridging the “digital divide,” improving the overall development of the digital economy, and accelerating the construction of “Digital China.”
Scholars have conducted extensive, in-depth research on the digital economy in recent years, focused primarily on three aspects:
  • Development level of the digital economy [1]. Some scholars have conducted multi-scale measurement research on the digital economy, such as national [2,3], provincial [4], and municipal [5,6]. Compared with foreign digital economy measurement index systems, China’s digital economy measurement has the characteristics of a late start, differentiated measurement indicators, diversified data sources, and strong application of big data [7].
  • Socio-economic effects of the digital economy. Scholars have studied the impact of the digital economy on the real economy [8], resource allocation [9], industrial transformation [10], urban immigration integration [11], total factor productivity [12], energy transition [13], carbon emission performance [14], employment structure [15], high-quality green development [16], and resource consumption [17], finding that the digital economy can promote productivity improvement [18], industrial structure optimization [19], high-quality economic development [20,21,22], and regional sustainable development [23], and that it has an “inverted U-shaped” impact on carbon emissions [24].
  • Driving force of the digital economy. Factors such as financial technology, economic growth, foreign investment, government support, labor resources, industrial structure, urban hierarchy, and information infrastructure have promoted significant growth of China’s digital economy [25,26,27]. Furthermore, there are differences in the driving factors of digital economy development in different regions [28].
This study contributes to the literature in several ways. First, previous studies have focused primarily on the impact of the digital economy from the perspective of economics, with very few studies examining the spatial differences and dynamic evolution of the digital economy from the perspective of geography. In this study, we analyzed the spatial and temporal evolution and spatial differences in China’s provincial digital economy.
Second, the indicator system constructed by previous studies cannot fully reflect the characteristics of the digital economy. Some indicators closely related to the digital economy have rarely been used, such as the number of patents in the digital economy, the number of employees in the digital industry, and the digital inclusive finance index. In this study, we constructed an evaluation indicator system closely related to the digital economy.
Third, most previous studies were based on cross-sectional rather than panel data. The data were relatively out-of-date, which limited examining the development status of China’s digital economy. Therefore, we conducted this study based on the panel data from 2011 to 2020, aiming to provide up-to-date empirical evidence of the digital economy in China.
Fourth, most previous studies used the coefficient of variation [29] and Theil index [30,31] to analyze the spatial differences in the digital economy. However, the Theil index cannot be used to analyze the spatial differences between any two regions, and the coefficient of variation cannot diagnose the sources of the spatial differences. Furthermore, previous studies ignored the influence of spatial correlation on the dynamic evolution of the digital economy. Therefore, in this study, we used the Dagum Gini coefficient and spatial Markov chain method to examine the spatial differences, sources, and dynamic evolution of the digital economy at the provincial level in China.
Finally, most previous studies on the spatiotemporal distribution and spatial differences in the development level of the digital economy were based on the digital economy index released by Tencent Research Institute in 2016. However, the index has some shortcomings including the short time span, single spatial scale, complex index system, and inability to repeat verification. There are relatively few studies on the construction of the digital economy indicator system, which is not conducive to the development of theories related to the digital economy. The evaluation index system for the development level of the digital economy constructed in this study is highly universal and is suitable for evaluating the development level of the digital economy at different scales such as national, regional, provincial, and municipal.
How can the development level of China’s digital economy be measured scientifically? Is there a “digital divide” in China’s provincial digital economy? What are the driving factors for the spatial differentiation of China’s provincial digital economy? How can the spatial differences in the digital economy be narrowed? All of these questions need to be further studied. Therefore, the main aim of the research is to reveal the spatial-temporal distribution, dynamic evolution, and driving force of China’s provincial digital economy. In this study, a digital economy evaluation index system was constructed, and digital economy measurement research was conducted based on the panel data on China’s provinces from 2011 to 2020. The Dagum Gini coefficient, spatial Markov chain, and geographic detectors methods were used to analyze the regional differences, dynamic evolution, and driving factors of the digital economy.

2. Materials and Methods

2.1. Construction of an Index System and Data Resources

So far, scholars have not formed a unified evaluation index system for the digital economy. In this study, we constructed a digital economy evaluation index system from four dimensions: Infrastructure, industrial scale, innovation capability, and inclusive finance based on relevant research [32,33] (Table 1).
First, the development of the digital economy requires the support of digital infrastructure, including the Internet. The number of broadband Internet users per 10,000 people and mobile phone users per 10,000 people were used to denote the infrastructure construction of the digital economy.
Second, the development and expansion of the digital economy industry require employees with rich digital knowledge and skills and steady growth of telecommunications business volume. In this study, we used two indicators to measure the industrial scale of the digital economy: (1) Per capita telecom business volume and (2) the proportion of the number of employees in the computer service, information transmission, and software industry among the total number of employees in society.
Third, innovation is the core competitiveness measure of the digital economy’s development. In this study, we used the number of digital economy patents to represent the innovation capacity of the digital economy. According to the seven key industries of the digital economy mentioned in the Outline, we searched the Patent Retrieval and Analysis System of The State Intellectual Property Office of China for the number of patents related to cloud computing, big data, Internet of Things (IoT), industrial Internet, blockchain, artificial intelligence, virtual reality, and augmented reality applied by each administrative unit from 2011 to 2020.
Finally, because of the continuous integration of China’s digital economy with other industries in recent years, e-commerce, online payment, and smart finance have developed rapidly. However, traditional government statistics cannot reflect the development level of digital finance. Therefore, we introduced the Peking University Digital Financial Inclusion Index of China (PKU-DFIIC) into this study based on relevant research [34]. PKU-DFIIC is based on Ant Group’s massive user data and has the advantages of horizontal and vertical comparison, large data volume, comprehensive indicators, and strong innovation.

2.2. Data

Because significant data were missing before 2011, 2011–2020 was used as the research period. Given the significant unavailability of data in Hong Kong, Macao, and Taiwan, the study area was China’s 31 provinces, municipalities, and autonomous regions (collectively referred to as “provinces”). Data on the total telecom business volume and year-end mobile phone users per 10,000 people were collected from the China Statistical Yearbook (2012–2021), and data on the digital economy patent were collected from the patent retrieval website of the State Intellectual Property Office on 29 January 2022 (http://pss-system.cnipa.gov.cn/). PKU-DFIIC was derived from the digital financial research center of Peking University on 7 February 2022 (https://tech.antfin.com/research/data) [35]. Resident population data were collected from the Chinese Journal of Population and Employment Statistics Yearbook 2020. The numbers of employees in information transmission, computer service, and software industries were collected from the Statistical Yearbooks from the 31 provinces.

2.3. Methods

2.3.1. Comprehensive Evaluation Method

Firstly, the range standardization method was used to eliminate the influence of dimensionality, and then we used the entropy weight method to calculate the weight of each index, which has the advantages of wide application, a clear principle, simple operation, and objectivity. Finally, we used the weighting method to analyze the development level of the digital economy in China’s provinces. The formulae are as follows:
A i j = X i j min ( X i j ) max ( X i j ) min ( X i j )
P i j = A i j i = 1 n A i j
e j = ( 1 / ln ( n ) ) i = 1 n P i j ln ( P i j )
w j = 1 e j j = 1 m ( 1 e j )
F = j = 1 m w j × A i j
where X i j and A i j represent the original and normalized values, respectively. P i j denotes the proportion of the ith province in the jth index. e j , w j , and F denote the information entropy, the weight of the jth index, and the digital economy development level, respectively.

2.3.2. Spatial Markov Chain

A spatial Markov chain can be used to calculate the transfer probability of provincial digital economy development types. It considers spatial correlation and incorporates a spatial lag factor into the model, overcoming the limitations of the traditional Markov chain [36,37,38]. We divided the development level of the digital economy into four types. We also transformed the N-order matrix of the traditional Markov chain into four N-order matrices to describe the precise probability that the digital economy development level of a particular province was transferred from i to j and from t to t + 1 when the digital economy development level of the neighboring region was at different development levels [39].

2.3.3. Daugm Gini Coefficient

The Dagum Gini coefficient can be used to analyze the inter- and intra-regional differences and the sources of spatial differences in China’s provincial digital economy [40]. The overall spatial difference formula of the digital economy is as follows:
G = j = 1 k h = 1 k i = 1 n j r = 1 n h | y j i y h r | 2 n 2 y ¯
The Formula of Gini coefficient in region j is:
G j j = i = 1 n j r = 1 n j | y j i y j r | 2 n j 2 y j ¯
The Gini coefficient between regions j and h is:
G j h = i = 1 n j i = 1 n h | y j i y h r | n j n h ( y j ¯ + y h ¯ )
where j and h are the regions, i and r are the provinces within regions, n is the number of provinces, and y ¯ is the mean value of the development level of the digital economy. The contribution rate of regional differences in the digital economy can be divided into two parts, namely the contribution rate of intra-regional differences G W and that of inter-regional differences, and the latter is divided into two parts, namely G n b and G t . The former refers to the net contribution rate of differences between different regions and the latter refers to the contribution rate of the intensity of trans-variation (cross-overlapping items of digital economy development levels between different regions).
The calculation formulae for the contribution rate are as follows:
G w = j = 1 k G j j Q j s j
G n b = j = 2 k h = 1 j 1 G j h D j h ( Q j s h + Q h s j )
G t = j = 2 k h = 1 j 1 G j h ( 1 D j h ) ( Q j s h + Q h s j )
where Q j is the ratio of the number of provinces in region j to 31, and s j is the ratio of the development level of the digital economy in provinces in region j to the sum of the development level of the digital economy in 31 provinces. D j h is the relative development of the digital economy between regions j and h. The value of D j h ranges from 0 to 1, and 1 D j h denotes the intensity of trans-variation.

2.3.4. Geographical Detectors

Geographic detectors can examine factors affecting spatial differentiation, including four detectors such as factor detectors. A factor detector can calculate the degree to which an explanatory variable explains the variable. The formulae are as follows:
S S W = h = 1 L N h σ h 2
S S T = N σ 2
q = 1 S S W S S T
where h = 1, 2, … L denotes the classification of driving factors and σ h 2 and σ 2 represent the variance of the driving factor classification and that of China’s provincial digital economy, respectively. SSW and SST denote the within sum of squares and the total sum of squares, respectively. The value of q ranges from 0 to 1. The larger the value of q, the stronger the explanatory ability. The smaller the value, the weaker the explanatory ability. In this study, a factor detector was used primarily to analyze the leading driving factors of spatial differentiation of China’s provincial digital economy in different years, and an interactive detector was used to distinguish the interaction types of different driving factors [41].
Because the explanatory variables of geographic detectors are required to be type rather than numerical variables, it is necessary to convert explanatory variables into type variables. First, we standardized all explanatory variables so that the data range after standardization was 0–1. Then, we tried a variety of classification methods, such as the quantile method, the natural break method, and the equal spacing method. We found that the equal spacing method, which divided the explanatory variables into 10 categories, had the largest q value, that is, the equal spacing method had the best performance. We arranged the values of each explanatory variable in ascending order: [0–0.1], (0.1–0.2], (0.2–0.3] … (0.8–0.9], and (0.9–1] and assigned values of 1, 2, 3 …9, and 10.

3. Results

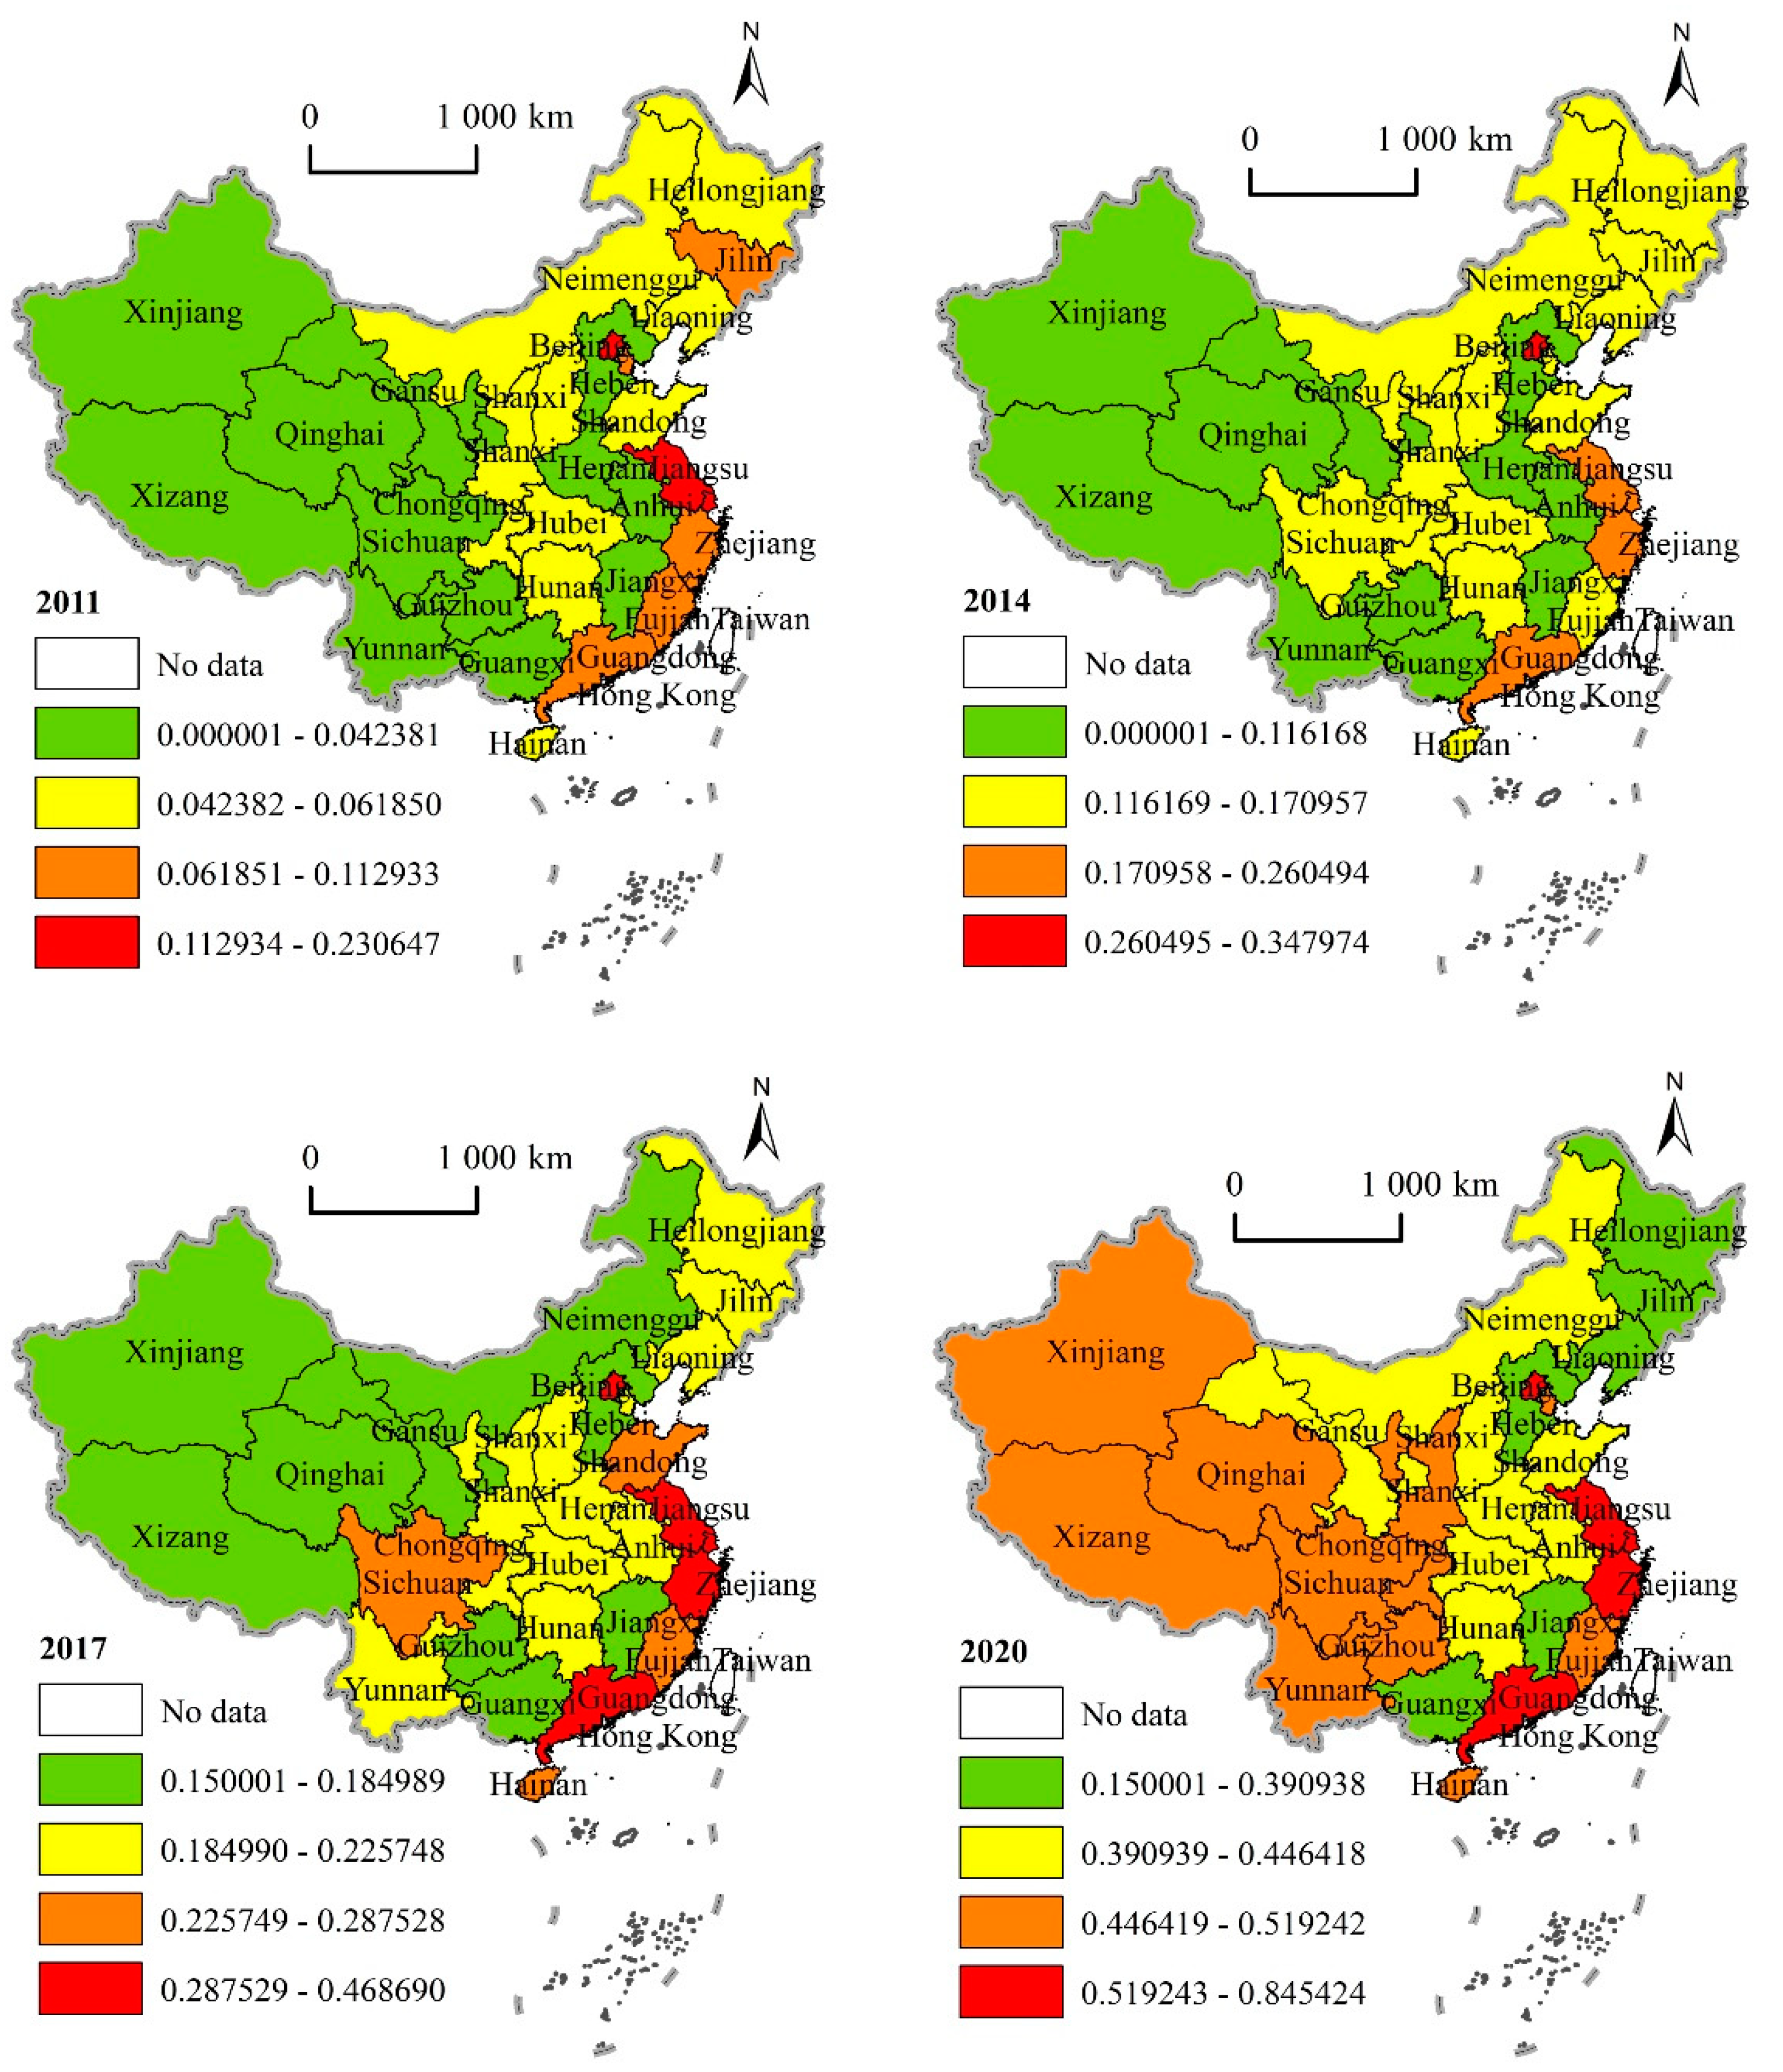
3.1. Temporal and Spatial Evolution of Digital Economy in Provincial China

First, we standardized the original data, used the entropy method to calculate the weight of the digital economy indicators, and used a comprehensive evaluation method to measure the development level of the digital economy in 31 provinces from 2011 to 2020. ArcGIS10.2 software was used to map the digital economy at the provincial level in China in 2011, 2014, 2017, and 2020 (Figure 1). The mean value of China’s provincial digital economy increased from 0.06 in 2011 to 0.49 in 2020, indicating that China’s provincial digital economy developed rapidly.
China’s provincial digital economy has exhibited a spatial distribution pattern of “high in the eastern provinces and low in the western and central provinces.” In 2011, the digital economy of Beijing was the most developed (0.23), followed by Shanghai (0.16), Jiangsu (0.15), and Zhejiang and Guangdong (0.11). The digital economy development level of 23 provinces was below the average (0.06), with Guizhou being the lowest (0.02). In 2014, the digital economy of Beijing was the most developed (0.35), followed by Shanghai (0.26), Guangdong (0.21), Zhejiang (0.20), and Jiangsu (0.19). The digital economy development level of 22 provinces was below the average (0.14), with Hebei being the lowest (0.09). In 2017, Beijing had the most developed digital economy (0.47), followed by Guangdong (0.42), Shanghai and Zhejiang (0.35), and Jiangsu (0.34). The digital economy development level of 22 provinces was below average (0.23), with Xizang at the lowest level of the digital economy (0.15). In 2020, Beijing had the most developed digital economy (0.85), followed by Guangdong (0.79), Zhejiang (0.73), Jiangsu (0.71), and Shanghai (0.67). The development level of the digital economy in 18 provinces was below the average (0.49), with Guangxi at the lowest level of the digital economy (0.17).

3.2. Spatial Differences in China’s Provincial Digital Economy

Table 2 presents the Dagum Gini coefficients of intra- and inter-regional differences in China’s provincial digital economy. The overall Gini coefficient of China’s provincial digital economy development decreased from 0.34 in 2011 to 0.14 in 2020, indicating that the overall spatial difference of China’s provincial digital economy declined and that the “digital divide” exhibited a bridging effect. The mean Dagum Gini coefficients of the digital economy within the eastern, central, and western regions were 0.19, 0.06, and 0.09, respectively. The intra-regional differences in the eastern region decreased from 0.29 to 0.15, in the central region from 0.16 to 0.04, and in the western region from 0.18 to 0.08, indicating that the intra-regional differences in the digital economy decreased from 2011 to 2020.
There were also significant differences in the development level of the digital economy among regions, with an inter-regional difference pattern of “east-west regional difference > east-central regional difference > central and western regional difference.” The inter-regional differences decreased from 2011 to 2020, with the Gini coefficient decreasing from 0.48 to 0.17 between the east and west regions, from 0.39 to 0.20 between the east and central regions, and from 0.20 to 0.10 between the central and west regions. The inter-regional net difference was the largest contributor to the spatial differences in China’s provincial digital economy (66.31%), followed by intra-regional differences (24.73%) and the intensity of trans-variation (8.95%).
Two primary interventions have caused the decline in intra- and inter-regional differences. First, China unveiled a series of reform and innovation measures—the development of the western region, the revitalization of the northeast, the rise of the central region, targeted poverty alleviation, and rural revitalization—that improved the digital economy infrastructure in the central and western regions. Moreover, collaboration and paired assistance between eastern and western regions have narrowed the inter-regional differences in China’s provincial digital economy [42]. Second, the Chinese government issued regional integration policies, including Yangtze River Delta integration, and the coordinated development of Beijing, Tianjin, and Hebei is vital to promoting regional digital economy coordinated development and narrowing the intra-regional differences in China’s provincial digital economy.

3.3. Dynamic Evolution of China’s Provincial Digital Economy

GeoDa software was used to calculate the Global Moran’s I of China’s provincial digital economy, demonstrating that it was significantly positive from 2011 to 2020, revealing that China’s provincial digital economy had spatial agglomeration, and the development of the local digital economy was influenced by neighboring provinces. Therefore, a spatial Markov chain was used to analyze the type of evolution of the provincial digital economy [43,44,45,46]. We classified 0–25%, 25–50%, 50–75%, and 75–100% of the development level of the digital economy as low, medium-low, medium-high, and high, respectively [47]. The calculation results of the spatial Markov chain passed the significance level test of 0.01, verifying that the development of the digital economy in provinces was influenced by neighboring provinces.
The results of the spatial Markov Chain transition probability matrix are presented in Table 3. When the spatial lag factor was low, the probabilities of local remaining low, medium-low, and medium-high levels were 0.097,0.208, and 0.125, and the probabilities of moving to a higher level were 0.903, 0.792, and 0.813. When the spatial lag factor was medium-low, the probabilities of local remaining low, medium-low, and medium-high were 0.111, 0.045, and 0.174, and the probabilities of moving to a higher level were 0.889, 0.955, and 0.783. When the spatial lag factor was medium-high, the probabilities of local remaining low, medium-low, and medium-high were 0.353, 0.087, and 0, and the probabilities of transferring to a higher level were 0.647, 0.913, and 1. When the spatial lag factor was high, the probabilities of local maintaining low, medium-low, and medium-high were 0, 0.333, and 0.091, and the probabilities of transferring to a higher level were 1, 0.667, and 0.909. Therefore, when the local digital economy was low, medium-low, and medium-high in period t, regardless of whether the spatial lag factor was low, medium-low, medium-high, or high, the probabilities of local transferring to a higher level in period t+1 were higher than that of preservation of the original state. These findings indicate that China’s provincial digital economy tends to transfer to a higher level, and China still has great potential and space for the development of the digital economy.
Furthermore, when the local was low and the spatial lag factors were low, medium-low, medium-high, and high, the probabilities of the local digital economy transferring from low to a higher level were 0.903, 0.889, 0.647, and 1, respectively, indicating that regions with a less-developed digital economy were less likely to be path-independent when neighboring regions were characterized by a high level of digital economy development. Besides, when the local digital economy was medium-high and the spatial lag factors were low, medium-low, medium-high, and high, the probabilities of a local transition from medium-high to high were 0.813, 0.783, 1, and 0.909, respectively. These findings indicate that the digital economy in a region is more likely to achieve high-level development when neighboring regions are characterized by a medium-high or high level of digital economy development. The positive spillover effect of the digital economy from the developed neighbors helps to promote the high-level development of the local digital economy. Therefore, it is necessary to acknowledge the radiation effect and the driving effect of high-level digital economy regions on neighboring regions and promote the regional collaborative development of the digital economy [48].

3.4. Driving Factors of Spatial Differentiation of China’s Provincial Digital Economy

Based on relevant research [25,26,27,28], we selected the influencing factors of spatial differences in the digital economy concerning economic development, foreign investment, financial support, labor resources, R&D expenditure, and industrial structure (Table 4). We also analyzed the driving factors of the digital economy using the geographic detectors method. The reasons for the selection of influencing factors were as follows.
There is a positive correlation between economic growth and the digital economy. The more developed the region, the more support it provides for developing the digital economy, and the more funds it can invest in the infrastructure construction of the digital economy and digital technology R&D. Economically developed provinces have prominent advantages in attracting digital technology, digital economy management experience, digital economy industries, and excellent employees. Therefore, this study used regional per capita GDP to represent economic development conditions.
Foreign investment can help introduce advanced digital economy management experience, promote digital technology innovation, and facilitate the flow of digital factors, the latter of which is a crucial driving force for the growth of the digital economy. Therefore, this study used foreign direct investment as a share of GDP as the influencing factor.
Financial support from the government is an important factor affecting the development of the digital economy. For example, the government can create a supportive policy environment for digital economy development, establish a digital economy industrial park, attract investment in digital science and technology enterprises, and provide enterprises with financial support and preferential tax policies. Consequently, fiscal spending as a share of GDP was used to measure government financial support.
Employees with advanced digital concepts and technical skills represent the core competitiveness to promote the development of the digital economy and the necessary conditions for the digital industry to maintain lasting innovation. The development of the digital economy has a high demand for high-level talent, so we used the number of college students per 10,000 people as the influencing factor.
The development of the digital economy is driven by high and new technology, and an increase in R&D expenditure improves the independent technology innovation ability of the digital economy—fundamentally solving the problem that key technologies are controlled by others and enhancing the core competitiveness of the digital economy. In this study, the proportion of R&D expenditure in GDP was used as the influencing factor.
Of the three major industries, digital resources have the greatest impact on the tertiary industry. Smart hotels, mobile payments, e-commerce, artificial intelligence, cloud computing, cloud offices, and other emerging digital formats are the products of the connection between the tertiary industry and digital resources. The proportion of the output value of the tertiary industry in the GDP can reflect the advancement of the regional industrial structure to a certain extent, so in this study, we used this indicator to represent the industrial structure.
The results of driving forces of spatial differentiation in the digital economy are presented in Table 5. The mean values of q of PGDP and RD from 2011 to 2020 were 0.816 and 0.774. Most years passed the significance level test, indicating that economic conditions and R&D expenditure were the leading factors for the spatial differentiation of China’s provincial digital economy.
With the extensive and in-depth penetration of digital elements and various fields, industrial digital transformation has become a development trend. The digital economy has been characterized by broad coverage, deep integration, rapid development, and deep influence, so its influencing factors are increasingly complicated. Foreign direct investment, financial support, labor resources, and industrial structure are not significant influencing factors of spatial differentiation in the digital economy.
The interaction detector was used to analyze the interaction relationship among six driving factors in different years. As presented in Table 6, there were differences in the leading interaction factors of digital economy development from 2011 to 2020. The interaction types among the six driving factors were bi-factor enhancement and nonlinear enhancement. The former refers to the fact that the q value of the interaction factor of any two variables was greater than the maximum of their respective q values, that is, q ( X i X j ) > m a x   ( q X i , q X j ) . The latter refers to the fact that the q value of the interaction factor of any two variables was greater than the sum of their respective q values, that is, q ( X i X j ) > q X i + q X j . Therefore, the nonlinear enhancement has a stronger explanatory ability for the spatial differentiation of the digital economy than the bi-factor enhancement.
The q values of the interaction factors between economic conditions and foreign direct investment in 2011–2012 and 2014 were the largest, and the interaction type was bi-factor enhancement: q ( P G D P F D I ) > m a x   ( q P G D P , q F D I ) , indicating that the interaction of economic conditions and foreign direct investment has a greater effect on improving the development level of the digital economy in the region than the independent effect of any factor. In 2013 and 2015, the q values of the interaction factor between economic development and industrial structure were the largest, and the interaction type was a bi-factor enhancement. The q values of the interaction factors between economic conditions and labor resources in 2016 and 2018 and between economic conditions and R&D expenditure in 2017 were the largest, and the interaction type was a bi-factor enhancement. The q values of the interaction factors between R&D expenditure and labor resources in 2019–2020 were the largest, and the interaction type was a nonlinear enhancement in 2020, q ( L R R D ) > q L R + q R D , indicating that a region may develop much faster than other regions when increasing labor resources and R&D expenditure simultaneously.
These findings contribute to a better understanding of the driving factors and mechanisms of the digital economy at the academic level. Moreover, on a practical level, these findings enlighten us that the development of the digital economy in China’s provinces is the result of the interaction of multiple driving factors. To promote the development of the digital economy of a region, we must comprehensively consider various driving factors, improve the economic conditions and financial support, increase foreign investment, labor resources, and R&D expenditure, and adjust the industrial structure.

4. Conclusions and Discussion

4.1. Conclusions

The results demonstrated that China’s provincial digital economy grew rapidly from 2011 to 2020, but there was a vast “digital divide” in different provinces. Beijing’s digital economy was the most developed, followed by Guangdong, Shanghai, Jiangsu, and Zhejiang provinces, and the digital economy in western and central China was relatively low. The intra-regional differences in the digital economy among provinces in eastern China were the greatest, followed by those in western China and central China. The inter-regional digital economy differences between eastern China and western China were the largest, followed by those between eastern China and central China and between central China and western China. The spatial differences in China’s provincial digital economy were caused predominantly by inter-regional differences. During the research period, the spatial disparity of China’s provincial digital economy declined, consistent with the research conclusions of Sheng, B. and Liu, Y.Y. [49].
China’s provincial digital economy had spatial agglomeration, and the development of the local digital economy was influenced by neighboring provinces. Unlike previous research conclusions, we found that, regardless of the level of the digital economy in the neighboring region, the probability of upward transfer of the digital economy in China’s provinces was greater than that of preservation of the original state, with a hierarchical transition phenomenon. China’s provincial digital economy still has great potential for development, and regions with a less-developed digital economy are less likely to be path-independent when neighboring regions are characterized by a high level of digital economy development, and the digital economy in a region is more likely to achieve high-level development when neighboring regions are characterized by a medium-high or high level of digital economy development. The spillover effect from developed neighbors helps to promote the high-level development of the local digital economy.
Unlike previous research conclusions, we found that the leading driving factors of China’s provincial digital economy from 2011 to 2020 were economic conditions and R&D expenditure. The spatial differentiation of China’s provincial digital economy resulted from the interaction of multiple factors, and any two driving factors had a bi-factor or nonlinear enhancement relationship.

4.2. Discussion

Based on these findings, several suggestions are proposed to narrow inter-regional and intra-regional differences in the digital economy, improve the overall development of the digital economy, and speed up the construction of a “digital China.”
First, spatial differences are evident in China’s provincial digital economy, primarily from inter-regional differences, followed by intra-regional differences. Therefore, to bridge the “digital divide,” we should first narrow the differences among China’s three regions, strengthen intra- and inter-regional cooperation in the digital economy, encourage digital industry transfer from the eastern region to the central and western regions, from strong provinces to weak provinces, and from cities to villages, and promote the flow of digital elements within and between regions.
Second, there was a spillover effect from China’s provincial digital economy. Therefore, it is necessary to fully acknowledge the positive spillover effect of strong provinces in the digital economy on neighboring areas, encourage them to pass on digital economy development experience to neighboring areas, and accelerate the improvement of a trans-regional joint training mechanism for digital economy industry talents. Furthermore, it is essential to unleash the value potential of China’s digital economy, bridge the digital divide between different regions, groups, and industries, and reshape the new pattern of digital economy development.
Finally, economic conditions and R&D expenditure were the leading driving factors of digital economy development. Therefore, to narrow the “digital divide,” it is necessary to optimize the allocation of monetary funds, increase the investment in digital technology R&D, and address the shortcomings and bottlenecks of key digital technologies. It is also vital to vigorously support and cultivate IoT, big data, cloud computing, and other industries [50], provide digital economy-related industries with more financial support and resources [51,52], and improve the innovation capacity of the digital economy [53].
The scientific contributions of the research results mainly include two aspects. On the one hand, in this study, we have built an evaluation index system for the development level of the digital economy, enriching the research on the digital economy, and contributing to the development of theories related to the digital economy. Furthermore, we have revealed the spatial differences and spatial correlations characteristics of the development levels of the digital economy in China’s provinces, providing a theoretical basis for the optimization of the spatiotemporal pattern of the digital economy and government decision-making, which will help promote the coordinated regional development of China’s digital economy. On the other hand, based on research findings, we make some suggestions that will help to contribute Chinese wisdom and propose Chinese solutions to narrowing regional digital economic development differences and bridging the digital divide.

Author Contributions

Conceptualization, R.L. and N.Z.; methodology, R.L.; software, R.L.; validation, R.L. and N.Z.; formal analysis, R.L.; investigation, R.L.; resources, R.L.; data curation, R.L.; writing—original draft preparation, R.L.; writing—review and editing, R.L.; visualization, R.L.; supervision, N.Z.; project administration, N.Z.; funding acquisition, N.Z. All authors have read and agreed to the published version of the manuscript.

Funding

This research was funded by the National Natural Science Foundation of China, grant number 41671140 and the Graduate Research and Practice Innovation Program in Jiangsu Province, grant number 1812000024547.

Data Availability Statement

Publicly available datasets were analyzed in this study. PKU-DFIIC data can be found here: [https://tech.antfin.com/research/data].

Acknowledgments

We thank Philip Papefor editing the English text of a draft of this manuscript.

Conflicts of Interest

The authors declare no conflict of interest.

References

  1. Xu, X.C.; Zhang, M.H. Research on the scale measurement of China’s digital economy—Based on the perspective of international comparison. China Ind. Econ. 2020, 36, 23–41. [Google Scholar]
  2. Zhang, B.C.; Shen, K.Y. Quantitative evaluation and characteristics of the development readiness in digital economy for the Belt and Road countries. Shanghai J. Econ. 2018, 38, 94–103. [Google Scholar]
  3. Qi, J.Y.; Ren, Y.D. The development level of host country’s digital economy and China’s outward foreign direct investment: A study of 43 countries along the Belt and Road. Int. Econ. Trade Res. 2020, 36, 55–71. [Google Scholar]
  4. Zhang, X.L.; Wu, T.T. Research on spatial differentiation pattern of China’s Provincial Digital Economy Development. World Surv. Res. 2019, 32, 34–40. [Google Scholar]
  5. Liu, C.M.; Yin, X.; Wang, L.S. Research on the spatial imbalance and distributional dynamic evolution of digital economy in China. Forum Sci. Technol. China 2020, 36, 97–109. [Google Scholar]
  6. Chen, Z.Q.; Wei, Y.; Shi, K.F.; Zhao, Z.Y.; Wang, C.X.; Wu, B.; Qiu, B.W.; Yu, B.L. The potential of nighttime light remote sensing data to evaluate the development of digital economy: A case study of China at the city level. Comput. Environ. Urban Syst. 2022, 92, 101749. [Google Scholar] [CrossRef]
  7. Xu, Q.Y.; Shan, Z.G.; Ma, C.J. A survey of the research on the measurement index system of digital economy at home and abroad. World Surv. Res. 2018, 31, 52–58. [Google Scholar]
  8. Jiang, S.; Sun, Y.X. An empirical study on the effect of digital economy on real economy. Sci. Res. Manag. 2020, 41, 32–39. [Google Scholar]
  9. Cong, Y.; Yu, B.Y. The influence of digital economy on the efficiency of Chinese labor force resource allocation. Theory Pract. Financ. Econ. 2020, 41, 108–114. [Google Scholar]
  10. Li, C.F.; Li, D.D.; Zhou, C. The mechanism of digital economy driving transformation and upgrading of manufacturing: Based on the perspective of industrial chain restructuring. Commer. Res. 2020, 63, 73–82. [Google Scholar]
  11. Zou, J.; Deng, X.J. To inhibit or to promote: How does the digital economy affect urban migrant integration in China? Technol. Forecast. Soc. Chang. 2022, 179, 121647. [Google Scholar] [CrossRef]
  12. Pan, W.R.; Xie, T.; Wang, Z.W.; Ma, L.S. Digital economy: An innovation driver for total factor productivity. J. Bus. Res. 2022, 139, 303–311. [Google Scholar] [CrossRef]
  13. Shahbaz, M.; Wang, J.D.; Dong, K.Y.; Zhao, J. The impact of digital economy on energy transition across the globe: The mediating role of government governance. Renew. Sustain. Energy Rev. 2022, 166, 112620. [Google Scholar] [CrossRef]
  14. Zhang, W.; Liu, X.M.; Wang, D.; Zhou, J.P. Digital economy and carbon emission performance: Evidence at China’s city level. Energy Policy 2022, 165, 112927. [Google Scholar] [CrossRef]
  15. Wu, B.Z.; Yang, W.G. Empirical test of the impact of the digital economy on China’s employment structure. Financ. Res. Lett. 2022, 49, 103047. [Google Scholar] [CrossRef]
  16. Ma, D.; Zhu, Q. Innovation in emerging economies: Research on the digital economy driving high-quality green development. J. Bus. Res. 2022, 145, 801–813. [Google Scholar] [CrossRef]
  17. Pouri, M.J. Eight impacts of the digital sharing economy on resource consumption. Resour. Conserv. Recycl. 2021, 168, 105434. [Google Scholar] [CrossRef]
  18. Wang, K.K.; Wu, G.B.; Zhan, G.J. Has the development of the digital economy improved production efficiency? Economist 2020, 32, 24–34. [Google Scholar]
  19. Shen, Y.H.; Huang, H. Research on influence of digital economy level on industrial structure optimization and upgrading of manufacturing industry: Based on panel data of Zhejiang Province from 2008 to 2017. Sci. Technol. Manag. Res. 2020, 40, 147–154. [Google Scholar]
  20. Zhao, T.; Zhang, Z.; Liang, S.K. Digital economy, entrepreneurship, and high-quality economic development: Empirical evidence from urban China. J. Manag. World 2020, 36, 65–76. [Google Scholar]
  21. Ning, C.S. Research on the multidimensional impact of digital economy on high-quality economic development based on the three-dimensional perspective of quality, efficiency and power. Guizhou Soc. Sci. 2020, 41, 129–135. [Google Scholar]
  22. Jing, W.J.; Sun, B.W. Digital economy promotes high-quality economic development: A theoretical analysis framework. Economist 2019, 31, 66–73. [Google Scholar]
  23. Yang, Q.H.; Ma, H.Z.; Wang, Y.Y.; Lin, L. Research on the influence mechanism of the digital economy on regional sustainable development. Procedia Comput. Sci. 2022, 202, 178–183. [Google Scholar] [CrossRef]
  24. Li, Z.G.; Wang, J. The dynamic impact of digital economy on carbon emission reduction: Evidence city-level empirical data in China. J. Clean. Prod. 2022, 351, 131570. [Google Scholar] [CrossRef]
  25. Zhong, Y.X.; Mao, W.S. Spatial differentiation of digital economy and its influencing factors in the Yangtze River Economic Belt. J. Chongqing Univ. Soc. Sci. Ed. 2020, 26, 19–30. [Google Scholar]
  26. Liu, J.; Yang, Y.J.; Zhang, S.F. Research on the measurement and driving factors of China’s digital economy. Shanghai J. Econ. 2020, 40, 81–96. [Google Scholar]
  27. Chen, X.H.; Teng, L.; Chen, W. How does FinTech affect the development of the digital economy? evidence from China. N. Am. J. Econ. Financ. 2022, 61, 101697. [Google Scholar] [CrossRef]
  28. Wang, B.Y.; Tian, J.F.; Chen, L.S.; Hao, F.L.; Han, H.; Wang, S.J. Spatial differentiation of digital economy and its influencing factors in China. Sci. Geogr. Sin. 2018, 38, 859–868. [Google Scholar]
  29. Wu, L.Y. Research on the measurement of development level of digital economy in the Yangtze River Economic Belt. Anhui Univ. Financ. Econ. 2021. [Google Scholar] [CrossRef]
  30. Yang, L.M.; Chen, L.P. Diversity and regional pattern evolution in the development of digital economy in South Asia. Asia-Pac. Econ. Rev. 2021, 37, 65–73. [Google Scholar]
  31. Wang, J.; Zhu, J.; Luo, Q. Research on the measurement of China’s digital economy development and the characteristics. J. Quant. Tech. 2021, 38, 26–42. [Google Scholar]
  32. Chen, X.Y.; Miao, Z.L. Spatial distribution of digital economic growth dynamics and regional income. Acta Geogr. Sin. 2021, 76, 1882–1894. [Google Scholar]
  33. Xu, W.X.; Zhou, J.P.; Liu, C.J. The impact of digital economy on urban carbon emissions: Based on the analysis of spatial effects. Geogr. Res. 2022, 41, 111–129. [Google Scholar]
  34. Chen, J. Research on the impact of digital inclusive finance on the development of real Economy—An empirical study based on provincial panel data. Manag. Adm. 2021, 39, 153–158. [Google Scholar]
  35. Guo, F.; Wang, J.Y.; Wang, F.; Kong, T.; Zhang, X.; Chen, Z.Y. Measuring China digital financial inclusion index compilation and spatial characteristics. China Econ. Q. 2020, 19, 1401–1418. [Google Scholar]
  36. Wang, Y.F.; Yuan, D.C. Research on the temporal and spatial evolution pattern of carbon efficiency in Chinese cities and optimization. Ecol. Econ. 2022, 38, 93–100. [Google Scholar]
  37. Li, Z.J.; Guan, W.H.; Wu, Q.Y.; Pu, Y.X. The temporal and spatial trend of China’s regional consumption level since the Reform and Opening up. J. Geo-Inf. Sci. 2014, 16, 746–753. [Google Scholar]
  38. Mu, X.Q.; Guo, X.Y.; Ming, Q.Z.; Hu, C. Dynamic evolution characteristics and driving factors of tourism ecological security in the Yellow River Basin. Acta Geogr. Sin. 2022, 77, 714–735. [Google Scholar]
  39. Li, Z.J.; Jiang, Y.X.; Qin, X.F. Local quality of place drives the spatio-temporal evolution pattern of China’s urban creative ability in the new era. Sci. Geogr. Sin. 2020, 40, 1812–1821. [Google Scholar]
  40. Dagum, C. A new approach to the decomposition of the Gini income inequality ratio. Empir. Econ. 1997, 22, 515–531. [Google Scholar] [CrossRef]
  41. Wang, J.F.; Xu, C.D. Geodetector: Principle and prospective. Acta Geogr. Sin. 2017, 72, 116–134. [Google Scholar]
  42. Liu, Y.J.; Tang, J.X. Spatio-temporal evolution characteristics and influencing mechanism of green development efficiency of tourism industry in China. J. Nat. Resour. 2022, 37, 681–700. [Google Scholar] [CrossRef]
  43. Mo, H.B.; Wang, S.J. Spatio-temporal evolution and spatial effect mechanism of carbon emission at county level in the Yellow River Basin. Sci. Geogr. Sin. 2021, 41, 1324–1335. [Google Scholar]
  44. Hu, S.L.; Jiao, S.T.; Zhang, X.Q. Spatio-temporal evolution and influencing factors of China’s tourism development: Based on the non-static spatial Markov chain model. J. Nat. Resour. 2021, 36, 854–865. [Google Scholar] [CrossRef]
  45. Fang, Y.L.; Huang, Z.F.; Wang, F.; Li, J.L. Spatiotemporal evolution of provincial tourism efficiency and its club convergence in the Chinese Mainland. Prog. Geogr. 2018, 37, 1392–1404. [Google Scholar]
  46. Liu, H.J.; Guo, L.X.; Qiao, L.C.; Shi, Y. Spatial-temporal pattern and dynamic evolution of logistic efficiency in China. J. Quant. Tech. 2021, 38, 57–74. [Google Scholar]
  47. Wang, J.; Du, G.J. The spatial difference and dynamic evolution of green innovation in China’s cities. Chin. J. Popul. Sci. 2021, 35, 74–85. [Google Scholar]
  48. Yan, Y.; Zhang, W. Regional disparity and dynamic evolution of distribution of high-quality urban development in Yangtze River Economic Belt. Resour. Environ. Yangtze Basin 2022, 31, 259–272. [Google Scholar]
  49. Sheng, B.; Liu, Y.Y. Research on the measurement and spatial characteristics of China’s digital economy. Nanjing J. Soc. Sci. 2022, 33, 43–54. [Google Scholar]
  50. Li, X.H. New features and the formation mechanism of new growth drivers of digital economy. Reform 2019, 35, 40–51. [Google Scholar]
  51. Sun, Y.; Fan, J.; Liu, H.C.; Zhao, T.Y. Spatial and temporal pattern of digital technology innovation and its influencing factors in the Yangtze River Delta. Econ. Geogr. 2022, 42, 124–133. [Google Scholar]
  52. Wen, J.; Yan, Z.J.; Cheng, Y. Digital economy and upgrading regional innovation capacity. Inq. Econ. Issues 2019, 40, 112–124. [Google Scholar]
  53. Liu, F.; Yu, M.Y. Coupling coordination analysis of digital industrialization and industrial digitization in the Yangtze River Economic Belt. Resour. Environ. Yangtze Basin 2021, 30, 1527–1537. [Google Scholar]
Figure 1. The spatial and temporal distribution of the provincial digital economy in China.
Sustainability 14 09376 g001
Table 1. Evaluation indicators of digital economy.
DimensionIndex (Unit)CalculationAttributeWeight
Digital
infrastructure
The number of broadband Internet users per 10,000 people (people)Total number of broadband Internet users/resident population+0.0735
The number of mobile phone users per 10,000 people (people)Total number of mobile phone users/resident population+0.0537
Digital
Industry
scale
Per capita telecom business volume (Yuan)Total telecom service/resident population+0.3503
The proportion of the number of employees in the computer service, information transmission, and software industry among the total number of employees in the society (%)Number of persons employed in information transmission, computer services and software/total number of persons employed in society × 100+0.1475
Number of patents in key industries of digital economy (Number)Total number of patent applications for seven key digital economy industries+0.2328
Digital Inclusive financeCoverage breadth/+0.0574
Usage depth/+0.0476
Digitization level/+0.0371
Table 2. Source and contribution rate of regional disparity of digital economy.
YearOverall
Spatial
Differences
Intra-Regional
Differences
Inter-Regional
Differences
Contributing Rate (%)
EastMiddleWestEast-MiddleEast-WestMiddle-WestGwGnbGt
20110.340.290.160.180.390.480.2024.2670.325.41
20120.250.230.090.100.310.360.1123.8070.725.48
20130.190.190.070.080.250.280.0823.8770.076.06
20140.170.190.060.060.220.250.0724.7168.826.47
20150.160.180.040.070.220.240.0624.4667.038.51
20160.180.180.030.080.230.270.0823.4170.076.52
20170.160.170.020.080.220.240.0623.7568.008.25
20180.160.170.040.100.210.220.0826.4260.2913.29
20190.140.160.030.090.200.180.0826.3260.0813.60
20200.140.150.040.080.200.170.1026.3357.7415.93
Mean0.190.190.060.090.240.270.0924.7366.318.95
Table 3. The spatial Markov Chain transition probability matrix of digital economy from 2011 to 2020.
Spatial Lag FactorLocal Digital Economy
t/t + 1LowMedium-LowMedium-HighHigh
LowLow0.0970.3230.5160.065
Medium-low0.0000.2080.2500.542
Medium-high0.0000.0630.1250.813
High0.0000.0000.0001.000
Medium-lowLow0.1110.1110.5560.222
Medium-low0.0000.0450.2730.682
Medium-high0.0000.0430.1740.783
High0.0000.0000.0001.000
Medium-highLow0.3530.1760.2940.176
Medium-low0.0000.0870.4780.435
Medium-high0.0000.0000.0001.000
High0.0000.0000.0001.000
HighLow0.0000.3330.5000.167
Medium-low0.0000.3330.3330.333
Medium-high0.0000.0000.0910.909
High0.0000.0000.0001.000
Table 4. Influencing factors of the development of the digital economy.
VariablesInfluencing FactorsIndicators (Units)
PGDPEconomic conditionGDP per capita (Yuan)
FDIForeign investmentForeign direct investment as a share of GDP (%)
FSFinancial supportFiscal spending as a share of GDP (%)
LRLabor resourcesThe number of college students per 10,000 people (People)
RDR&D expenditureThe proportion of R&D expenditure in GDP (%)
ISIndustrial structureThe proportion of the output value of the tertiary industry in the GDP (%)
Table 5. Results of factor detection.
VariablesPGDPFDIFSLRRDIS
20110.846 ***0.3430.1830.731 *0.750 **0.638
20120.884 ***0.3400.1710.4700.760 *0.653
20130.842 ***0.2440.1780.6190.771 **0.712
20140.891 ***0.2600.2050.6820.808 **0.724
20150.877 ***0.1840.2310.5730.835 ***0.666
20160.830 ***0.2510.2590.239 0.880 ***0.526
20170.758 **0.2590.2500.2140.800 **0.486
20180.856 *0.1600.2500.2010.7660.444
20190.6720.2340.1750.2650.805 *0.479
20200.7030.2040.2190.1670.5700.403
Mean of q0.8160.2480.2120.4160.7740.573
Rank156423
Note: *** means p < 0.01, ** means p < 0.05, * means p < 0.1.
Table 6. Results of interaction detection.
YearLeading
Driving Factor
Value
of q
Interaction Type of
the Leading Driving Factor
The Number of Interactions
for Each Type of Interaction
2011PGDP∩FDI0.982Bi-factor enhancementBi-factor enhancement (15)
2012PGDP∩FDI0.982Bi-factor enhancementBi-factor enhancement (15)
2013PGDP∩IS0.970Bi-factor enhancementBi-factor enhancement (15)
2014PGDP∩FDI0.975Bi-factor enhancementBi-factor enhancement (15)
2015PGDP∩IS0.967Bi-factor enhancementBi-factor enhancement (15)
2016PGDP∩LR0.974Bi-factor enhancementBi-factor enhancement (14);
Nonlinear enhancement (1)
2017PGDP∩RD0.975Bi-factor enhancementBi-factor enhancement (11);
Nonlinear enhancement (4)
2018PGDP∩LR0.922Bi-factor enhancementBi-factor enhancement (12);
Nonlinear enhancement (3)
2019LR∩RD0.889Bi-factor enhancementBi-factor enhancement (13);
Nonlinear enhancement (2)
2020LR∩RD0.960Nonlinear enhancementBi-factor enhancement (10);
Nonlinear enhancement (5)
Publisher’s Note: MDPI stays neutral with regard to jurisdictional claims in published maps and institutional affiliations.

