Article

Spatial Expansion and Correlation of Urban Agglomeration in the Yellow River Basin Based on Multi-Source Nighttime Light Data

School of Geographical Sciences, Shanxi Normal University, Taiyuan 030024, China
*
Author to whom correspondence should be addressed.
Sustainability 2022, 14(15), 9359; https://doi.org/10.3390/su14159359
Submission received: 30 May 2022 / Revised: 21 July 2022 / Accepted: 27 July 2022 / Published: 30 July 2022
(This article belongs to the Section Health, Well-Being and Sustainability)

Abstract

:
The Chinese government proposed a major national strategy for ecological protection and high-quality development in the Yellow River Basin. The Framework of the Plan for Ecological Protection and High-Quality Development of the Yellow River Basin proposes building a dynamic development pattern characterized by “one axis, two regions and five poles” in the Yellow River Basin with high-quality and high-standard urban agglomerations along the Yellow River. The urban agglomeration is the economic growth pole of the Yellow River Basin and the main carrier of the population and productivity. This study integrates DMSP/OLS (Defense Meteorological Satellite Program/Operational Linescan System) and NPP/VIIRS (Suomi National Polar-Orbiting Partnership/Visible Infrared Imaging Radiometer Suite) night light remote sensing data from 2000 to 2020 and uses methods such as spatial expansion measurement, the center of gravity offset, urban primacy, and the gravity model to study the spatial expansion and correlation characteristics of five urban agglomerations. The results show that: (1) From 2000 to 2020, urban agglomeration in the Yellow River Basin continued to expand, and the area increased by 6.4 times. The total amount of nighttime lights in the city presents a spatial distribution pattern that is high in the east and low in the west. (2) The expansion centers of the five major urban agglomerations all shifted. The centers of gravity of the Shandong Peninsula urban agglomeration, the Jiziwan urban agglomeration of the Yellow River, the Guanzhong Plain urban agglomeration, and the Lanzhou–Xining urban agglomeration all shifted westward, while the center of gravity of the Central Plains urban agglomeration shifted to the southeast. (3) Qingdao, Zhengzhou, Xi’an and Lanzhou are the primate cities of the four urban agglomerations of the Shandong Peninsula, Central Plains, Guanzhong Plain, and Lanzhou–Xining, respectively. The primate city in the Jiziwan urban agglomeration of the Yellow River was changed from Taiyuan to Yinchuan and then to Yulin. (4) The density of the gravitational network of the urban agglomeration in the Yellow River Basin and the distribution of the maximum gravitational line show the spatial differentiation characteristics of being dense in the east and sparse in the west.

1. Introduction

More than half of the world’s population now lives in towns and cities, and the size of the world’s urban population will increase to approximately 8.6 billion [1]. With rapid population increases, there is an urgent need to understand how urban land areas expand to accommodate more people. However, the dynamics of urban expansion and the modes of urban sprawl remain uncertain in different urban agglomerations [2]. In addition, urban planners and decision makers must understand local land-use changes and their driving forces for decision making. Therefore, it is particularly essential to quantify the annual expansion of urban agglomerations.
The term urban agglomeration was first proposed in developed countries with rapid urbanization. This term was defined as a concentration of urbanized areas that had a higher concentration of population, urban functions, and urban landscape [3]. A number of studies about American urban agglomeration before the 1990s had to provide scientific references to optimize the urban development guidelines [4,5]. Urban agglomerations in developing countries have attracted worldwide attention after the 1990s because Asian urban agglomerations appeared and developed rapidly [6,7,8]. As the largest developing country, urbanization in China showed amazing speed compared to the evolution path of urban agglomerations in Western countries [9,10]. In recent years, research on urban agglomerations in China has focused on carbon emissions [11], ecological service value [12], pollution control [13], economic development [14], and urban expansion [15]. The studied areas have mostly been urban agglomerations in eastern China. At the same time, urban expansion patterns in China exhibit different characteristics in terms of regional distributions. By recognizing regional urban expansion patterns, we can help urban sustainable development planning to develop scientifically. Compared to the urban agglomerations in eastern China, the urban agglomerations along the Yellow River experience many kinds of problems, such as low-quality development, uneven development, a weak radiation effect, and unreasonable economic structure [16]. Some studies have only focused on urban agglomerations in terms of their resource utilization efficiency [17], environmental pollution and ecological protection [18], high-quality development paths and assessments [19], and industrial economic development [20]. There is still a lack of research on the spatial clustering of cities and relationships among cities under urban agglomerations along the Yellow River. Our research can make up for this deficiency.
Previous studies have described the urban expansion of official Chinese cities using statistical yearbooks [21]. The yearbooks have long been the basic channel for understanding urban expansion in China. However, this dataset is not an objective way to observe the Chinese city system, and its data quality has been criticized for its availability and objectivity. Therefore, we cannot fully understand Chinese urban expansion using the statistical yearbooks. Aside from the statistical yearbooks, remote sensing images provide a better way to understand urbanization patterns and urban expansion [22]. However, research based on remote sensing images requires a lot of field observation; thus, remote sensing images cannot be easily applied to study urban expansion in all cities. Therefore, an alternative approach to understanding urban expansion from various dimensions with fewer field data is urgently needed. Nighttime light (NTL) data have provided opportunities for quantitative urban studies [23]. NTL data have been found to correlate well with urban expansion [24,25], economic activity [26], gross domestic product (GDP) [27,28,29], poverty [30], income [31], and human pressure on ecosystems [32]. They are particularly useful for estimating urban expansion at fine spatial scales, estimating changes in urban land cover over time, and estimating urban expansion in areas with poor or no reporting of urban land cover [33], all of which are key features of this research. For example, NTL data were applied to urban research and can intuitively reflect the spatial distribution of a city [34,35]. In addition, the built-up areas and development process of urbanization were analyzed using NTL data [36,37].
Here, we evaluated the spatial expansion and relationships among cities under urban agglomerations along the Yellow River using nearly two decades of NTL data. Specifically, we examined (a) how cities under urban agglomerations along the Yellow River expand over time and (b) what relationships exist among cities under urban agglomerations along the Yellow River. This study can provide useful information on the patterns of urban expansion. Additionally, analyzing the relationships among cities under urban agglomerations can help us develop a better understanding of urban sustainable development planning.

2. Research Area, Materials and Methods
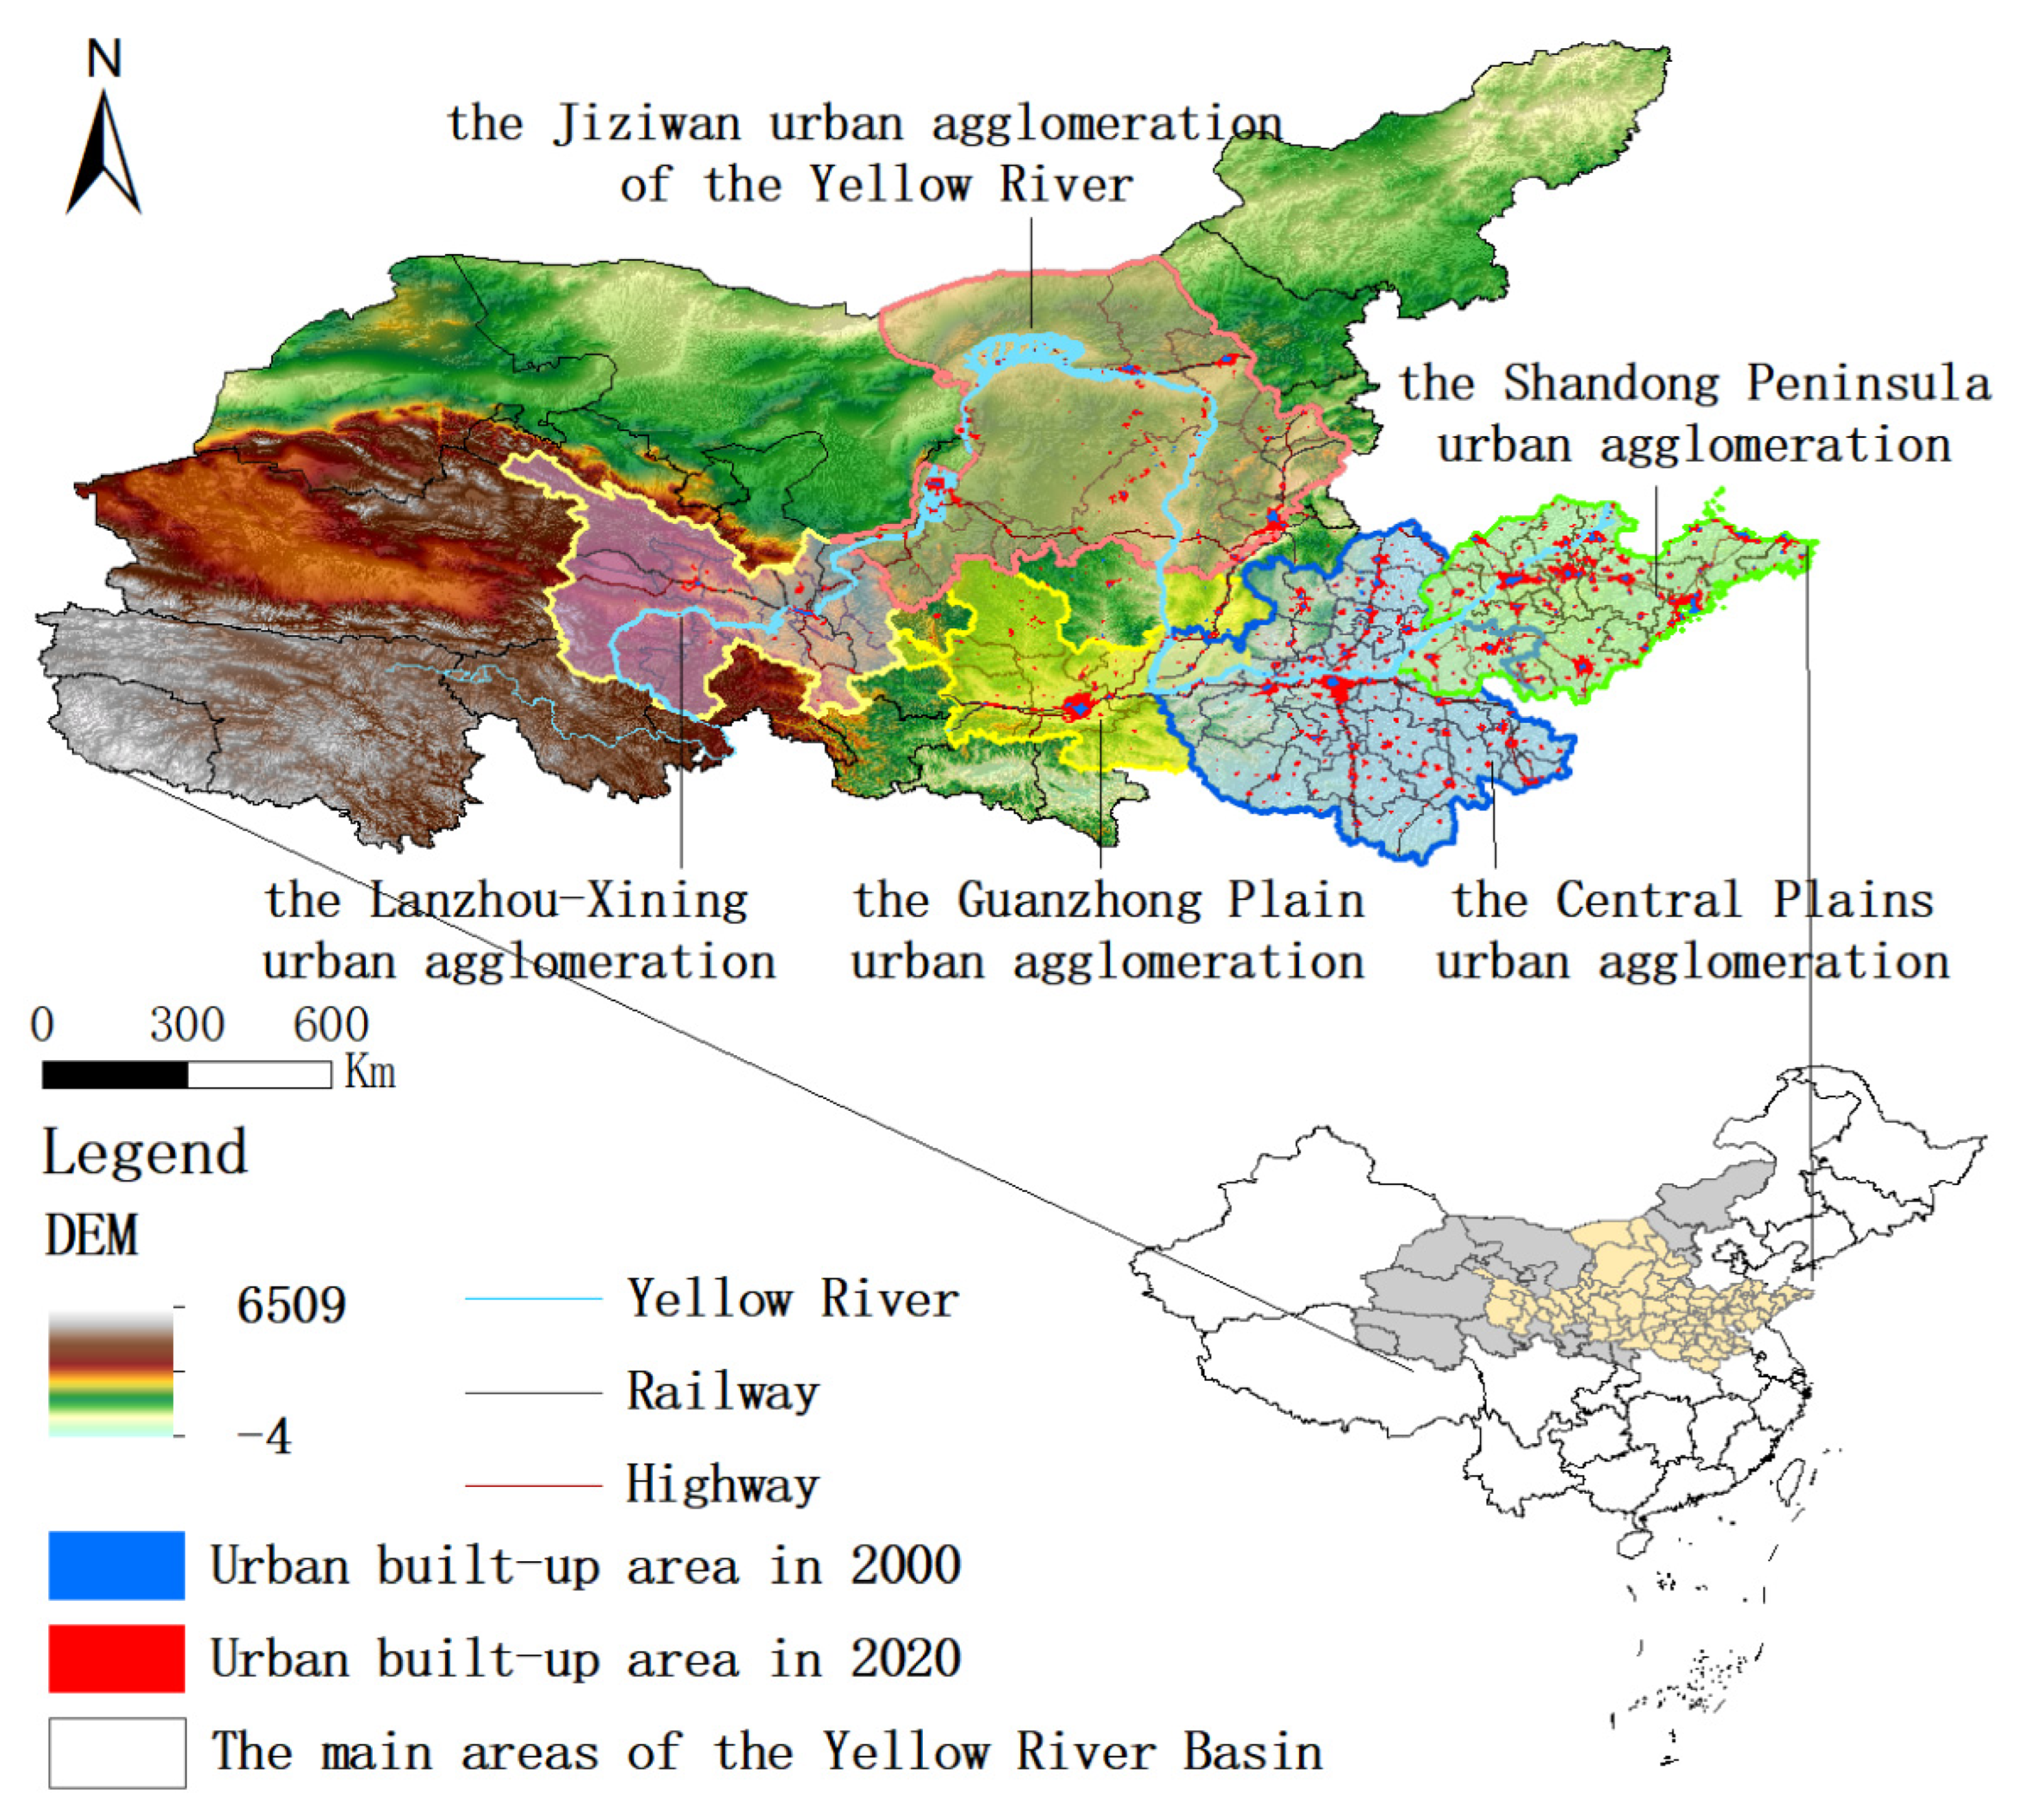
2.1. Research Area

The Framework of the Plan for Ecological Protection and High-Quality Development of the Yellow River Basin proposes to build a dynamic development pattern involving “one axis, two regions, and five poles” in the Yellow River Basin, and to promote the rational flow and efficient agglomeration of factors between regions [38]. The “five poles” are the five major urban agglomerations in the Yellow River Basin (Figure 1). Its land area only accounts for 41.15% of the main body of the Yellow River Basin, but the total population accounts for 91.2% of the basin, and the regional GDP accounts for 93.01%. In addition, the general public budget revenue, the total retail sales of consumer goods, and the number of patent authorizations account for more than 90% of the total in the basin. It is the main carrier for driving regional economic development, the strategic core area for the economic development of the Yellow River Basin, and the lifeblood of the economic development of the basin [16].

2.2. Data Sources and Research Methods

2.2.1. Data Source and Processing

DMSP/OLS (Defense Meteorological Satellite Program/Operational Linescan System) and NPP/VIIRS (Suomi National Polar-Orbiting Partnership/Visible Infrared Imaging Radiometer Suite) NTL data from the National Geophysical Data Center (https://www.ngdc.noaa.gov/eog/dmsp/ (accessed on 6 December 2021)) were used in this study. They cannot be directly compared and analyzed because these data come from different remote sensing detectors, and there are differences in the images’ characteristics. Therefore, a harmonized, consistent dataset of nighttime lights needed to be produced [39,40]. After this, the DMSP/OLS annual data were preprocessed and corrected using methods such as mutual correction, intra-annual fusion, and inter-annual correction. NPP/VIIRS monthly data should be aggregated into annual data. The annual data then needed to be denoised. Their coordinate system needed to be synchronized, and their resolution needed to be reprojected. Based on the data captured by both detectors in 2012 and 2013, sensitivity analysis was performed on the data from the coincident year. The optimal fitting parameters were fitted from this analysis. According to the fitted optimal parameters, the NPP/VIIRS annual data were generated and fitted to the DMSP/OLS data, and the synthetic DMSP dataset of the long-term series from 2000 to 2020 was obtained. The boundary data from the administrative divisions were obtained from the National Basic Geographic Information Center of China (http://www.ngcc.cn/ngcc/ accessed on 6 December 2021).

2.2.2. Research Methods

  • Measurement of the Expansion of the Urban Built-up Area
The threshold method [41] was used in this study, and the DN (digital number) value of 50 was taken as the range threshold of the urban built-up area. The spatial expansion characteristics of the urban agglomerations were analyzed by using expansion speed and expansion intensity [42].
V = ( U A i + n U A i ) / n
S = [ ( U A i + n U A i ) / n ] / U A i × 100 %
In these formulas, V represents the expansion speed, S represents the expansion intensity, UAi and UAi+n represent the urban built-up area’s patch area in the beginning and end years of the study period, respectively, and n represents the difference between the beginning and the end years.
2.
Center of Gravity’s Offset Distance and Offset Speed
The position of the gravity center was the weighted average of the coordinates of the total amount of city lights in the study area. The change in the expansion center of gravity in the urban agglomeration can be obtained according to the coordinate change using the coordinates of the center of gravity to calculate the moving distance during the study period. Its movement speed can be calculated based on the center of gravity’s offset distance and the research time span [43].
Δ D = ( X A X B ) 2 + ( Y A Y B ) 2 X = i = 1 n T L i x i / i 1 n T L i Y = i = 1 n T L i y i / i 1 n T L i
V d = Δ D / ( A B )
In this formula, (X, Y) represents the longitude and latitude coordinates of the expansion center of the urban agglomeration, respectively. TL represents the total light value of each city in the urban agglomeration, and xi and yi represent the coordinates of the center point of the built-up area of each city. n represents the number of cities, ΔD represents the offset distance of the center of gravity, Vd represents the moving speed of the center of gravity, and A and B represent the start and end years of the research period, respectively.
3.
Law of the Primate City
The primate city is generally the growth pole of the region. According to its development and changes, whether the structure of the urban agglomeration is reasonable or not can be judged [44]. The total amount of city lights can represent the comprehensive strength of the city. We can use it to obtain the primate city and to analyze the scale and hierarchical structure of the five major urban agglomerations in the Yellow River Basin.
S i = T L 1 / T L 2
In the formula, Si represents the urban primacy of a certain urban agglomeration, and TL1 and TL2 represent the total number of specific NTL data in the first and second cities, respectively. When Si > 2, it means that the primate city of the urban agglomeration has a strong force in the region. When 1 ≤ Si ≤ 2, it means that the structure of the first and second cities of the urban agglomeration is more reasonable. When Si is closer to 1, it means that the scale of the first and second cities is similar, and the urban agglomeration shows a dual-core development model.
4.
Gravity Model
The law of universal gravitation can be used to characterize the connection rate and attraction degree between cities [45].
G i j = K Q i Q j D i j 2
In the formula, Gij represents the degree of connection between the two cities. K is 1, which is the gravitational constant, and Q represents the quality of the city. This study selects the total amount of NTL data in each city to represent the quality of the city. Dij represents the distance between the two cities.
5.
Spatial Analysis
According to Equations (1), (3) and (6), specific values such as the speed of urban agglomeration expansion, the center of gravity, and inter-city attraction are obtained. Using ArcGIS software for spatial analysis, thematic maps reflecting the spatial distribution of each index are made.
The temporal characteristics of the spatial expansion of the urban agglomeration in the Yellow River Basin are divided into four periods: 2000–2005, 2005–2010, 2010–2015, and 2015–2020. Using the expansion speed as an indicator in ArcGIS software, the urban expansion speed is divided and displayed using the natural breaks classification method.
We used ArcGIS software to draw out the gravity center’s offset route map of each urban agglomeration to analyze the spatial law of its movement.
We selected the data of 2000, 2010 and 2020 to analyze the degree of correlation between cities in the urban agglomeration of the Yellow River Basin. By using the natural breakpoint method in ArcGIS, the correlation network of different gravitational degrees was divided into five levels. The degree of correlation from strong to weak corresponds to levels I–V.

3. Results and Analysis

3.1. Analysis of the Spatial Expansion Characteristics of Urban Agglomerations

3.1.1. Temporal Characteristics of the Spatial Expansion of Urban Agglomerations

From 2000 to 2020, the urban scale of the five major urban agglomerations in the Yellow River Basin expanded by about 6.4 times. The expansion speed and expansion intensity of urban agglomerations fluctuated significantly. For the expansion speed (Figure 2), the urban agglomeration of the Central Plains and the Shandong Peninsula had a faster expansion speed compared with other urban agglomerations for a long time. From 2000 to 2005, the Shandong Peninsula urban agglomeration, the Central Plains urban agglomeration, the Guanzhong Plain urban agglomeration, and the Jiziwan urban agglomeration of the Yellow River maintained a certain speed of growth. From 2005 to 2010, the growth rate of the Shandong Peninsula urban agglomeration and the Central Plains urban agglomeration dropped. From 2010 to 2020, all urban agglomerations showed a steady increase in scale, among which the Shandong Peninsula urban agglomeration and the Central Plains urban agglomeration increased significantly in terms of expansion speed. After 2010, the expansion rate of the Central Plains urban agglomeration exceeded that of the Shandong Peninsula urban agglomeration. The Lanzhou–Xining urban agglomeration expanded slowly during 2000–2020 but maintained a relatively stable increase. The overall urban agglomeration mainly showed an expansion trend, but some cities within the urban agglomeration experienced shrinkage after 2005. Shrinking cities were mainly distributed in the Lanzhou–Xining urban agglomeration and the Jiziwan urban agglomeration of the Yellow River.
The expansion intensity of five major urban agglomerations all increased significantly from 2000 to 2005, at above 10% (Table 1). At that time, the Guanzhong Plain urban agglomeration and the Jiziwan urban agglomeration of the Yellow River were particularly obvious. From 2005 to 2010, urban construction gradually tended to be rationalized. The Shandong Peninsula urban agglomeration, the Central Plains urban agglomeration, the Guanzhong Plain urban agglomeration, and the Jiziwan urban agglomeration of the Yellow River dropped rapidly in terms of spatial expansion intensity, while the Lanzhou–Xining urban agglomeration maintained a relatively stable expansion intensity. From 2010 to 2015, the expansion intensity of urban agglomerations in the Central Plains increased significantly, while the expansion intensity of other urban agglomerations in the Yellow River Basin tended to be stable. From 2015 to 2020, the expansion intensity of the Shandong Peninsula urban agglomeration increased from 5.91% to 12.83%, and the expansion intensity of the Lanzhou–Xining urban agglomeration increased slightly. The expansion intensity of the urban agglomeration in the Central Plains, the urban agglomeration in the Guanzhong Plain, and the Jiziwan urban agglomeration of the Yellow River all showed a slight decline.

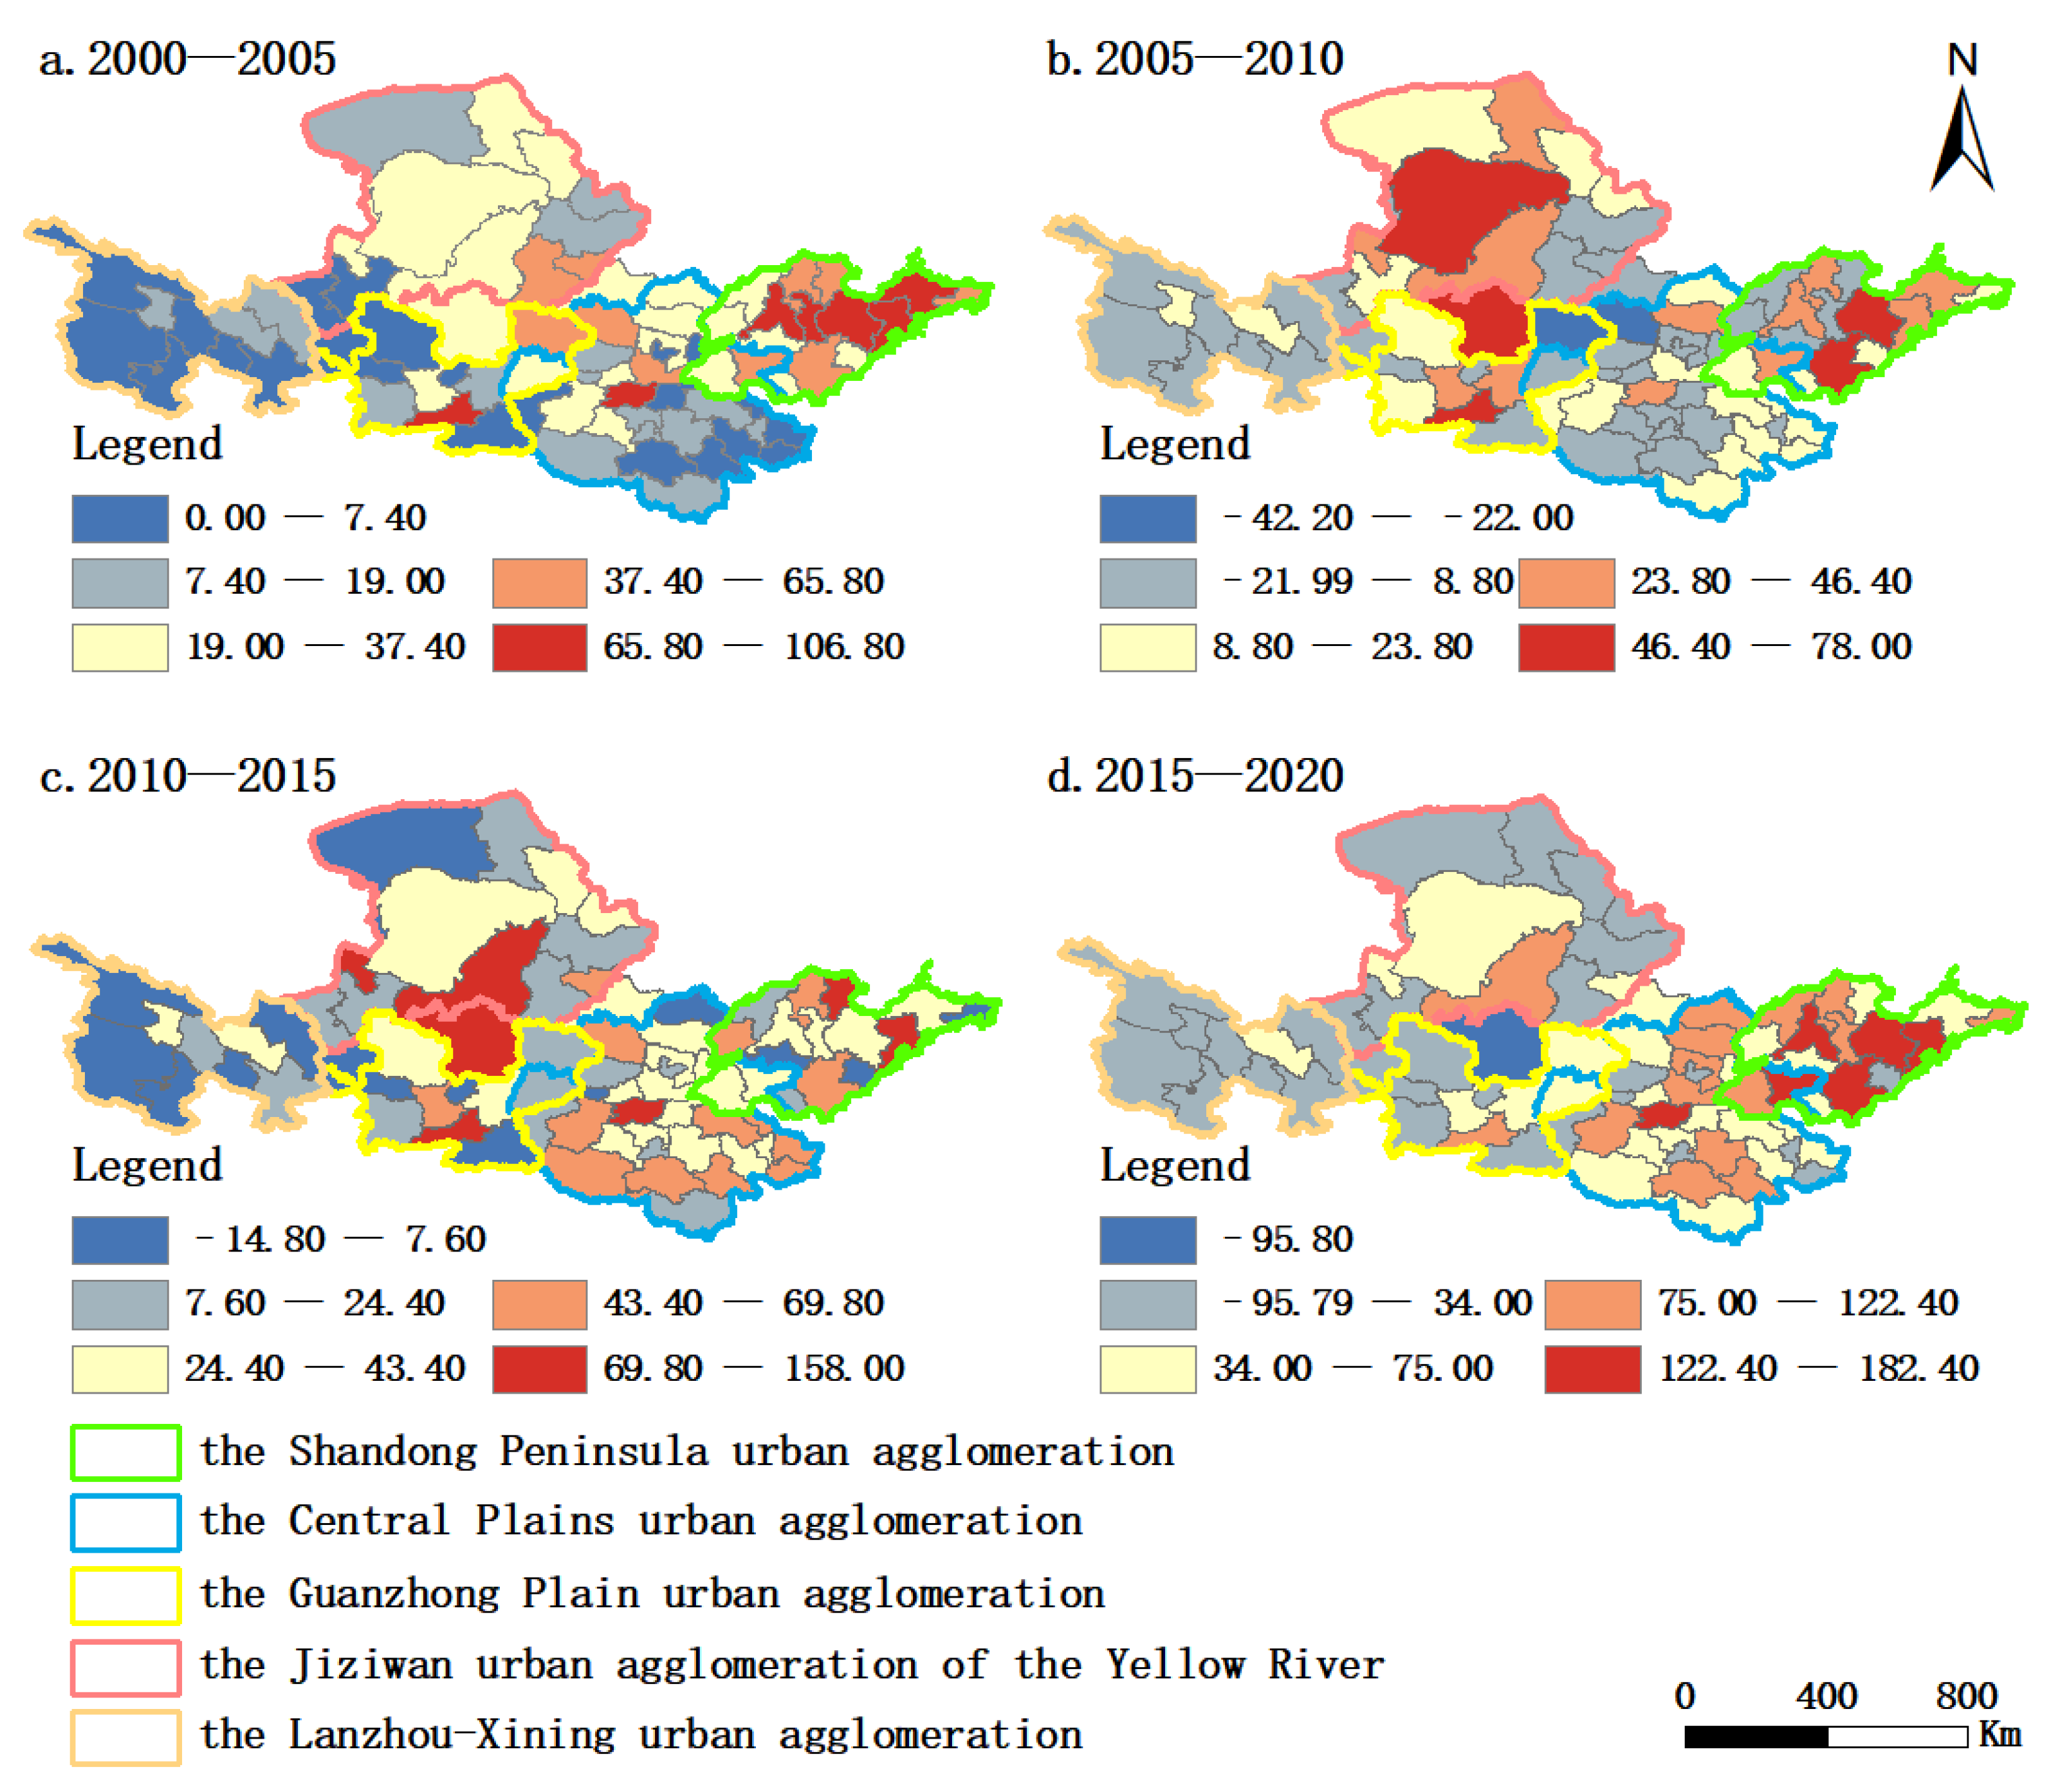
3.1.2. Spatial Characteristics of Urban Expansion in Urban Agglomerations

The total amount of urban lights in the Yellow River Basin showed explicit spatial distribution (Figure 3). The high-value areas of total light were located in the central and eastern urban agglomeration in the Yellow River Basin. The low-value area was mainly located in the mountainous plateau area. From the perspective of the urban agglomeration scale, the high-value areas of total lighting were mainly distributed in the Shandong Peninsula urban agglomeration and the Central Plains urban agglomeration, and the low-value areas were mainly distributed in the Guanzhong Plain urban agglomeration, the Jiziwan urban agglomeration of the Yellow River and the Lanzhou–Xining urban agglomeration. From the perspective of the city scale, the cities with high total lights in the eastern region mainly included Jinan, Qingdao, Weifang, and Linyi, and the cities with high light values in the central and western regions mainly included provincial capitals such as Zhengzhou, Xi’an, and Taiyuan.

3.2. Gravity Center Offset Analysis

According to Equations (3) and (4), it is necessary to select the total DN value of urban lights to represent the degree of urban development and calculate it as a weight value to obtain the regional center of gravity of the urban agglomeration. This calculation result is different from the simple geometric center, and its position change can intuitively reflect the change in the focus direction of urban agglomeration expansion (Figure 4).

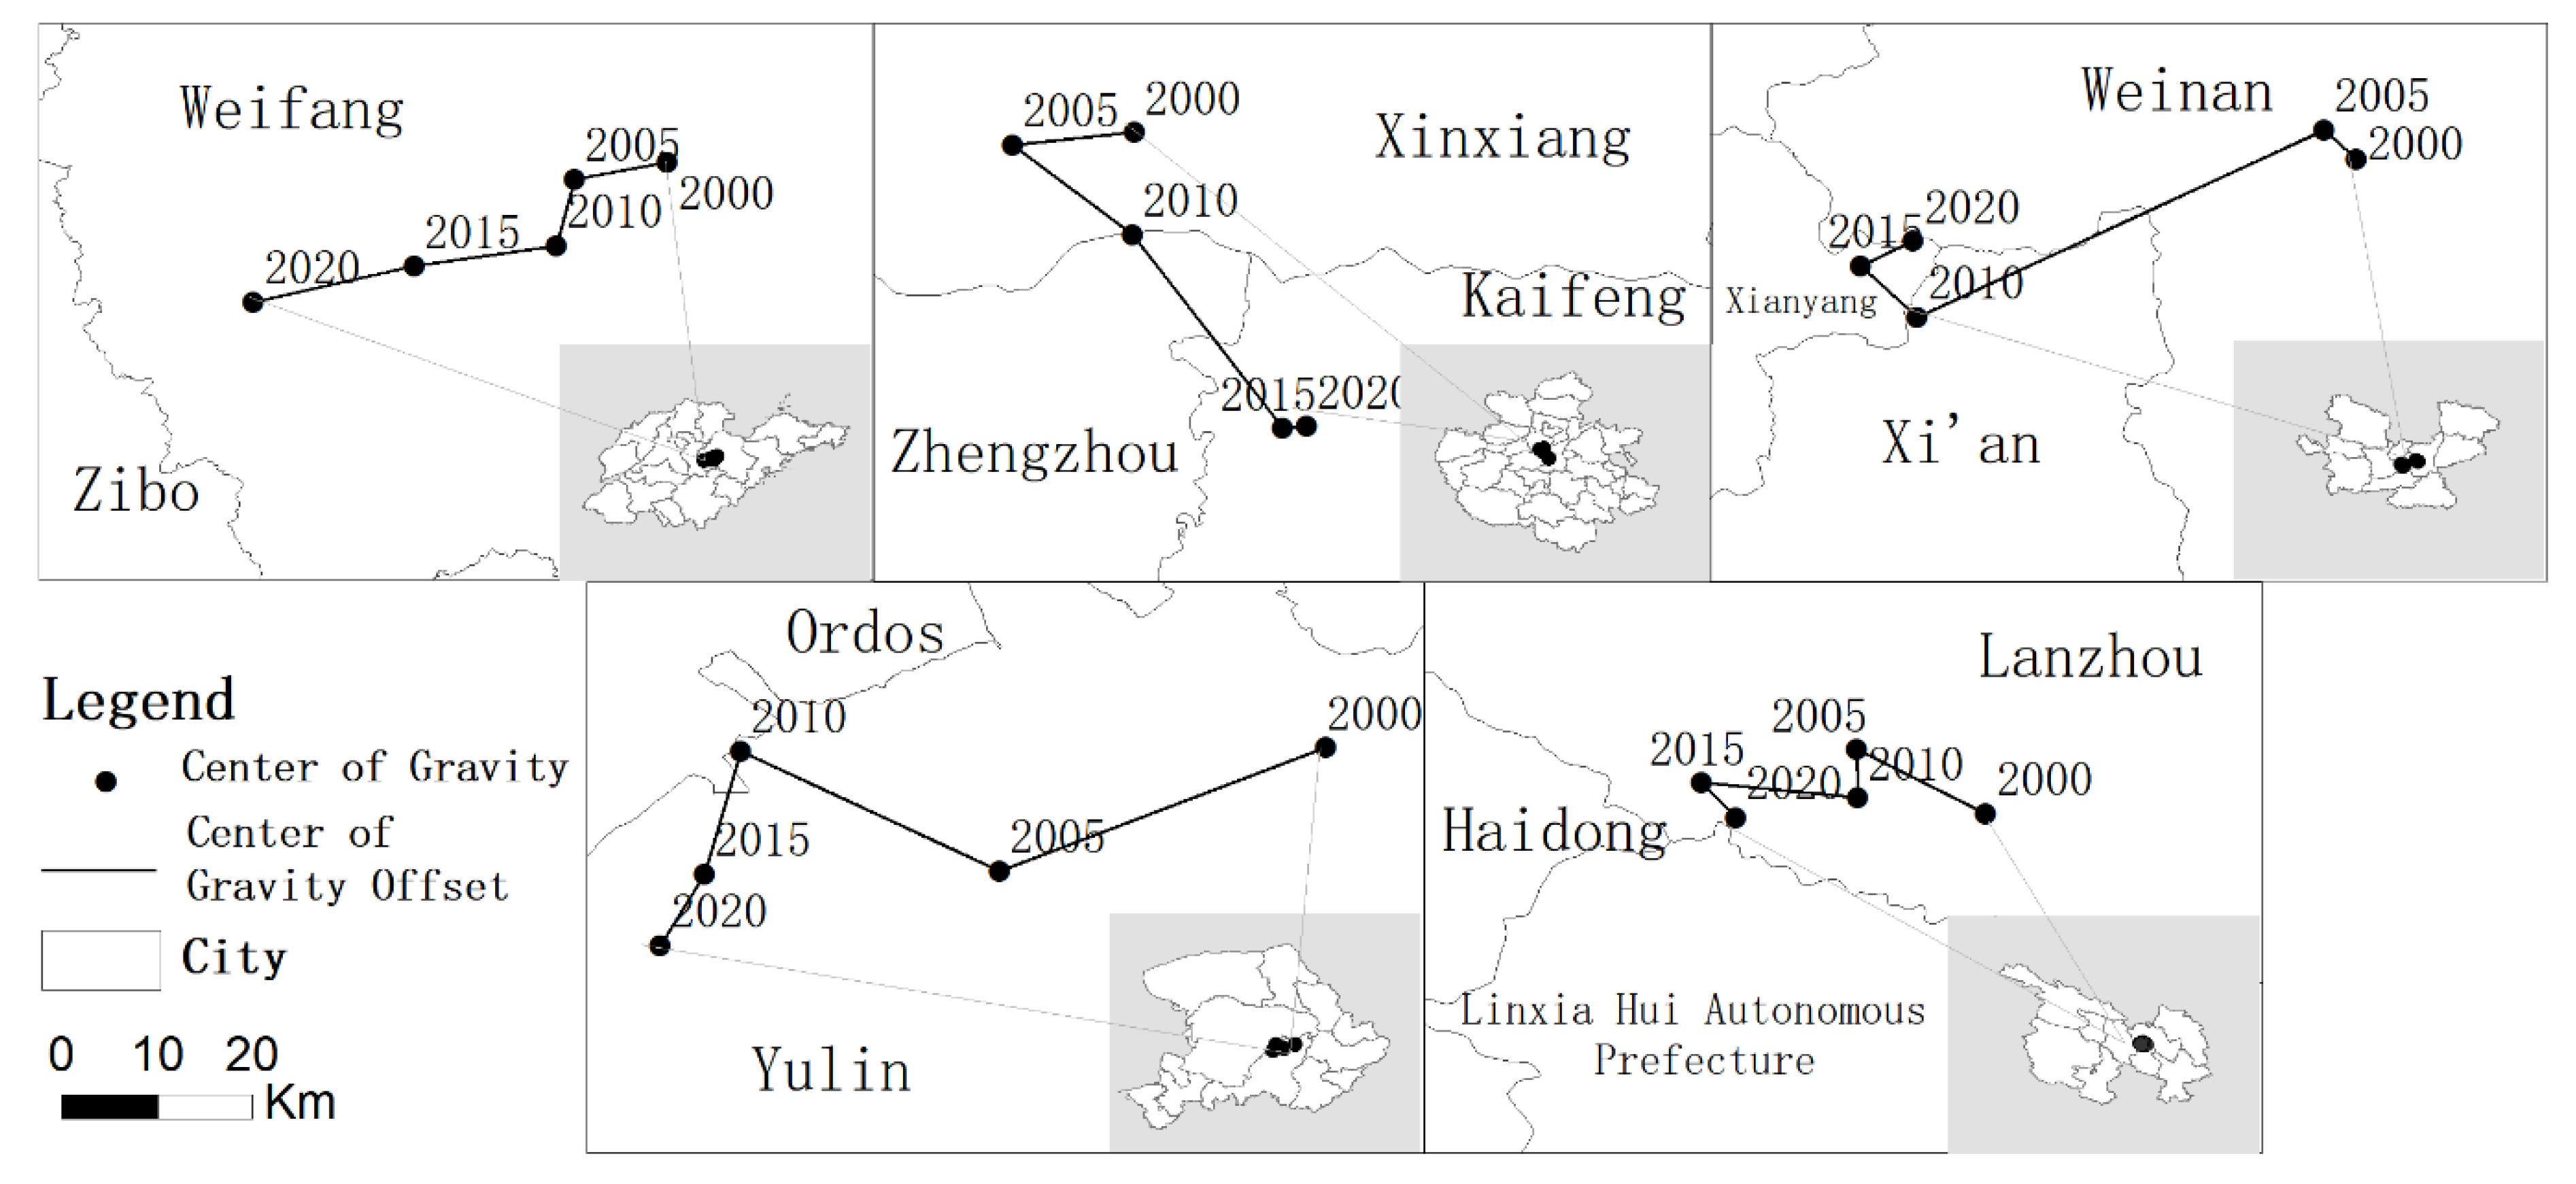
3.2.1. Changes in the Position of the Gravity Center of the Urban Agglomeration

The position of the gravity center was the weighted average of the coordinates of the total amount of city lights. Our results show that the gravity center of the Shandong Peninsula urban agglomeration, the Jiziwan urban agglomeration of the Yellow River, and the Lanzhou–Xining urban agglomeration were always located in the same city during the study period. The gravity center of the Central Plains urban agglomeration and the Guanzhong Plain urban agglomeration changed three times from 2000 to 2020. The gravity center of the Shandong Peninsula urban agglomeration was in the western part of Weifang City. The gravity center of the Jiziwan urban agglomeration of the Yellow River was located in the northern part of Yulin City. The gravity center of the Lanzhou–Xining urban agglomeration was located in the southwestern part of Lanzhou. The gravity center of the Central Plains urban agglomeration changed from Xinxiang to Zhengzhou and then moved to Kaifeng, which is generally located in the north of the regional geometric center. The gravity center of the Guanzhong Plain urban agglomeration shifted from Weinan to Xi’an and then to Xianyang in the past two decades.

3.2.2. The Shifting Direction and Distance of the Gravity Center

For the shifting direction of the gravity center, the gravity center of the Shandong Peninsula urban agglomeration, the Jiziwan urban agglomeration of the Yellow River, and the Guanzhong Plain urban agglomeration shifted to the southwest. The gravity center of the Central Plains urban agglomeration mainly shifted to the southeast. The gravity center of the Lanzhou–Xining urban agglomeration finally shifted westward, but the migration process fluctuated greatly, with the gravity center swinging back and forth in the northwest and southeast directions. From the perspective of the offset distance and speed of the expansion of the urban agglomeration, in the past two decades, the Jiziwan urban agglomeration of the Yellow River had the longest offset distance and the fastest moving speed, followed by the Guanzhong Plain urban agglomeration. The shifting distance of the gravity center of the Lanzhou–Xining urban agglomeration was the shortest, the speed was the slowest, and the fluctuation was the smallest.

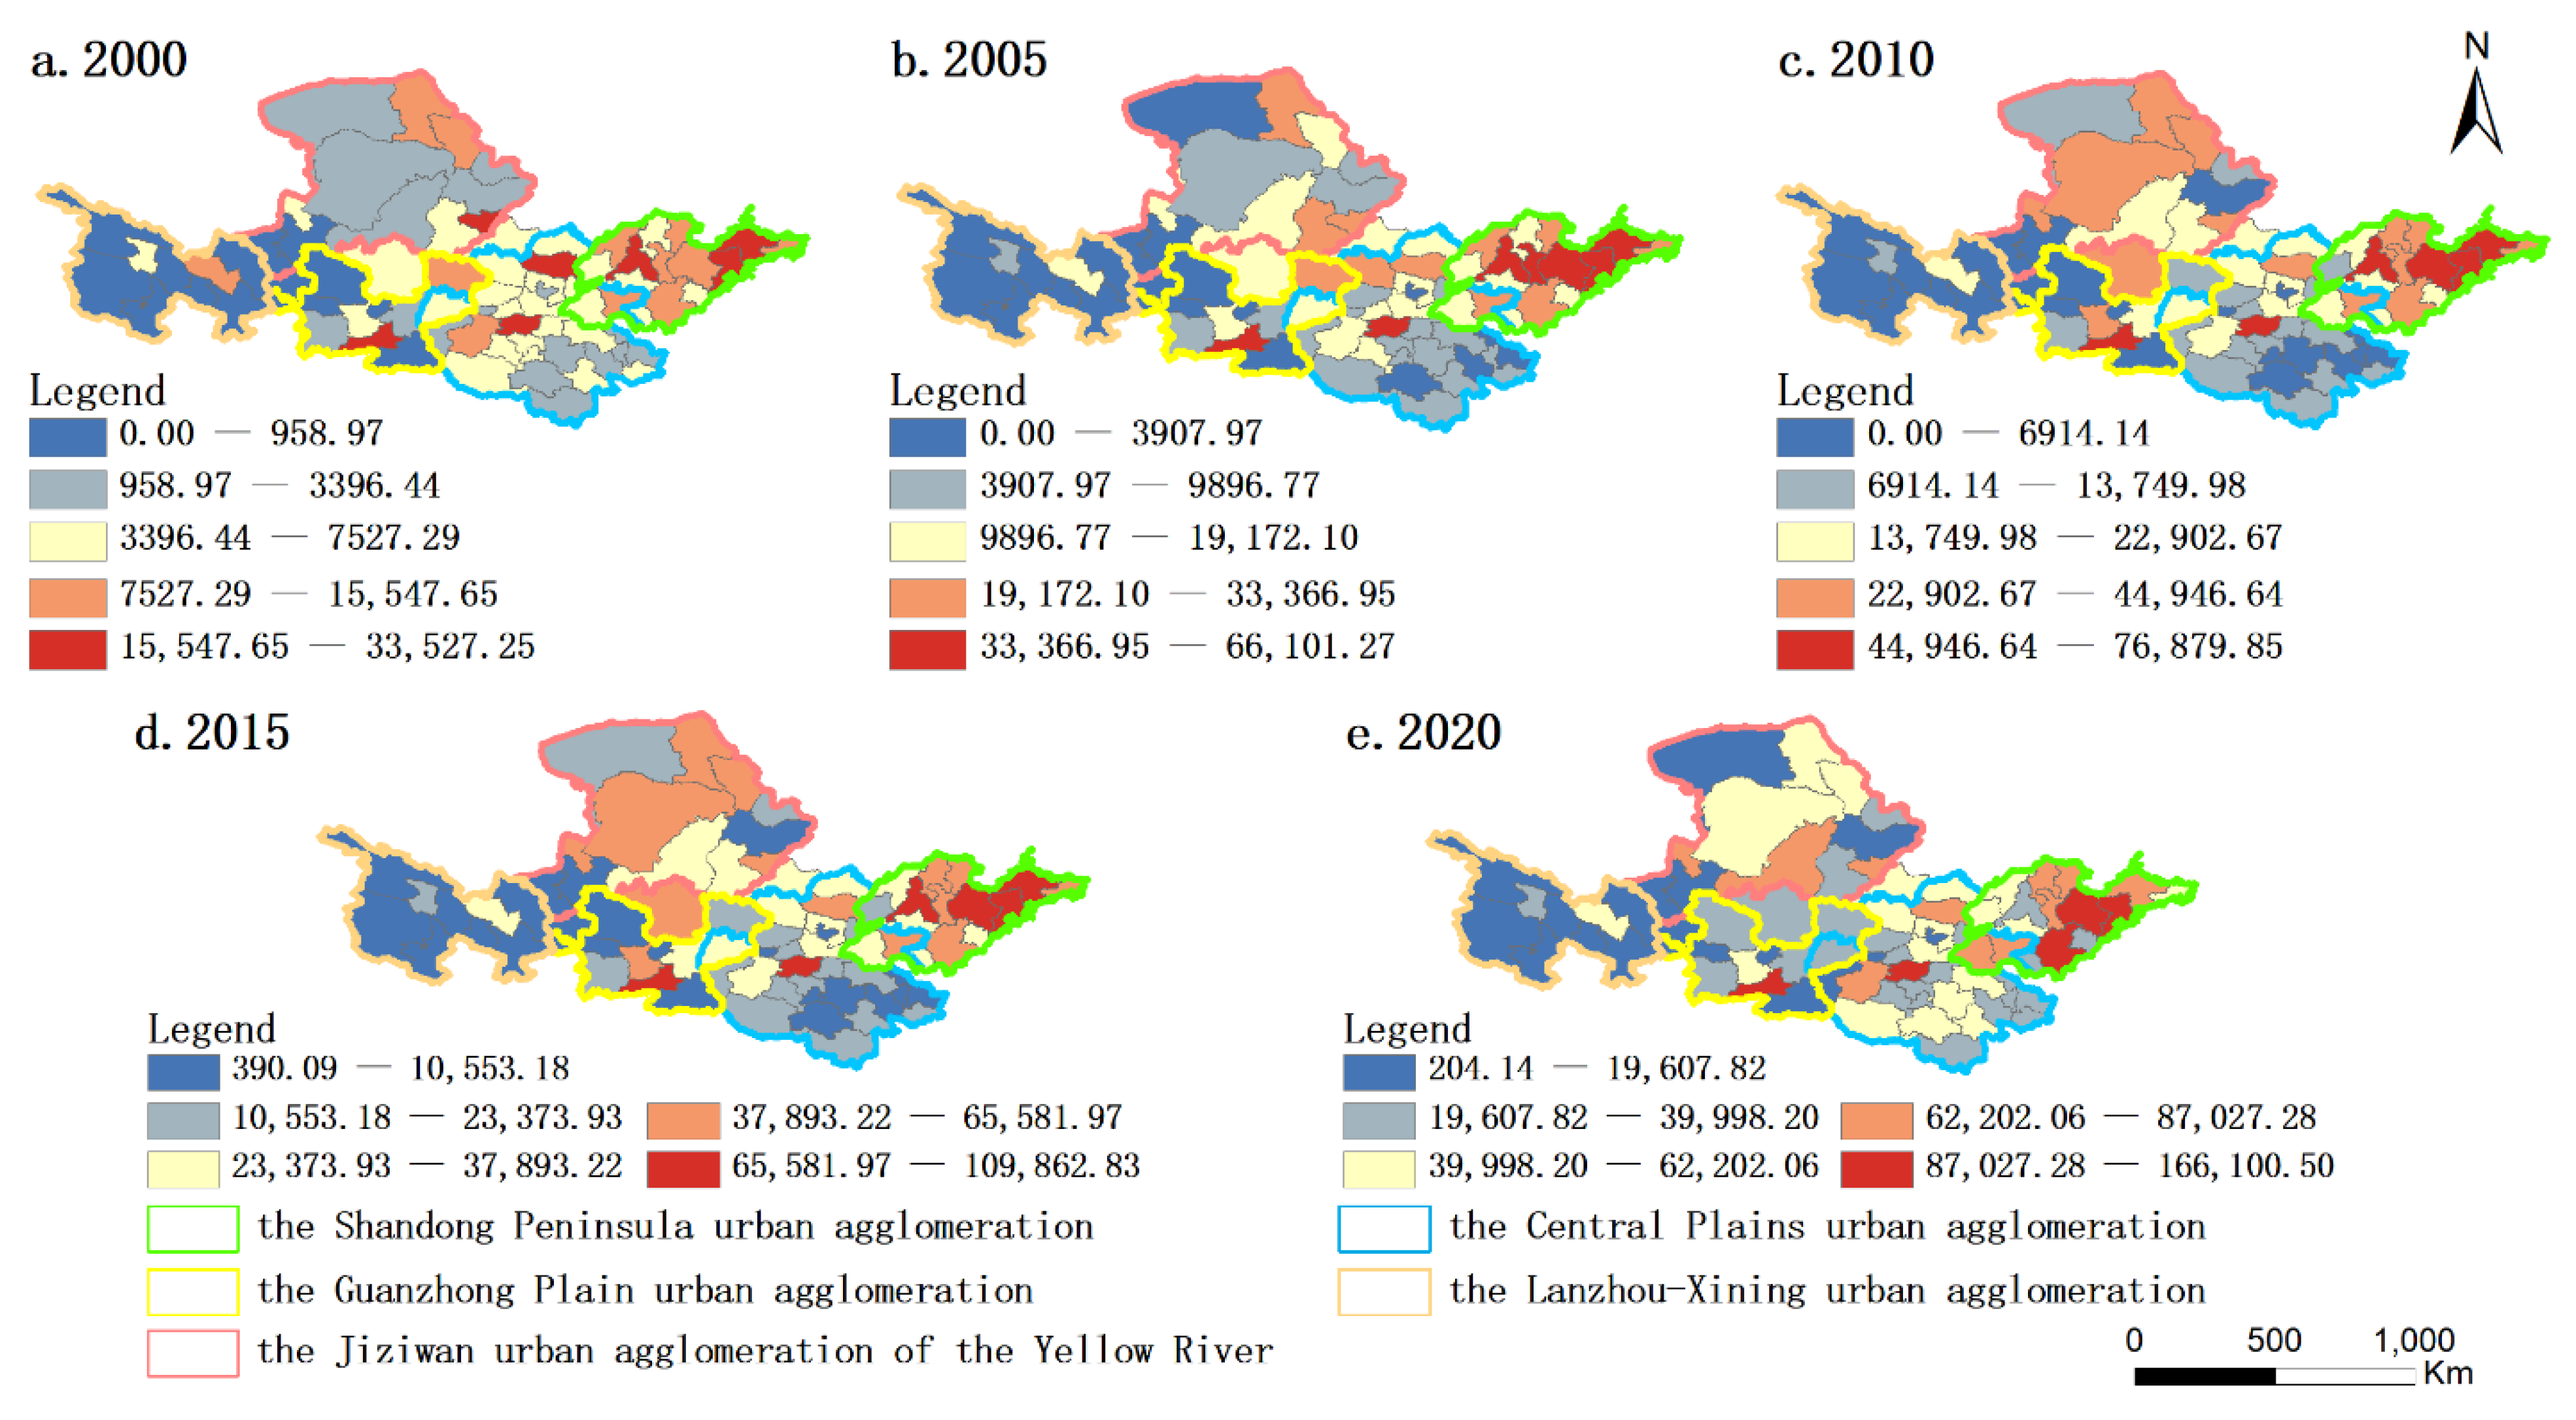
3.3. Characteristics of the Scale and Hierarchy Structure within each Urban Agglomeration

The scale-level structure is an important manifestation of the spatial expansion characteristics of urban agglomerations. Based on the ability of night light data to characterize the comprehensive strength of the city, this paper uses the total night light intensity of the city to analyze the urban scale and hierarchical structure of the urban agglomeration in the Yellow River Basin.
The primate city remained unchanged in the Shandong Peninsula, Central Plains, Guanzhong Plain, and Lanzhou–Xining urban agglomerations from 2000 to 2020. The primate cities in those regions were Qingdao, Zhengzhou, Xi’an and Lanzhou, respectively (Table 2). In 2000, Lanzhou had the greatest primacy, followed by Xi’an, Qingdao, and Zhengzhou. In 2020, Zhengzhou had the greatest primacy, followed by Xi’an, Lanzhou, and Qingdao. The primacy of Zhengzhou showed an increase from 2000 to 2020. The primacy of Xi’an fluctuated between 1.99 and 2.60. The primacy of Lanzhou decreased from 2.6 in 2000 to 1.59 in 2020. The primacy of Qingdao showed a decrease from 2000 to 2020. However, the primate city in the Jiziwan urban agglomeration was Taiyuan in 2000, 2005 and 2010, Yinchuan in 2015, and Yulin in 2020. In the past, Qingdao had the lowest first place, with a value close to 1. The Shandong Peninsula urban agglomeration was a dual-core development model driven by both Qingdao and Jinan. The Lanzhou–Xining urban agglomeration was also a dual-core development model. The scale and structure of the Shandong Peninsula urban agglomeration and the Guanzhong Plain urban agglomeration were not reasonable enough. The Jiziwan urban agglomeration of the Yellow River did not form an obvious core area.

3.4. Spatial Correlation Characteristics of Urban Agglomerations

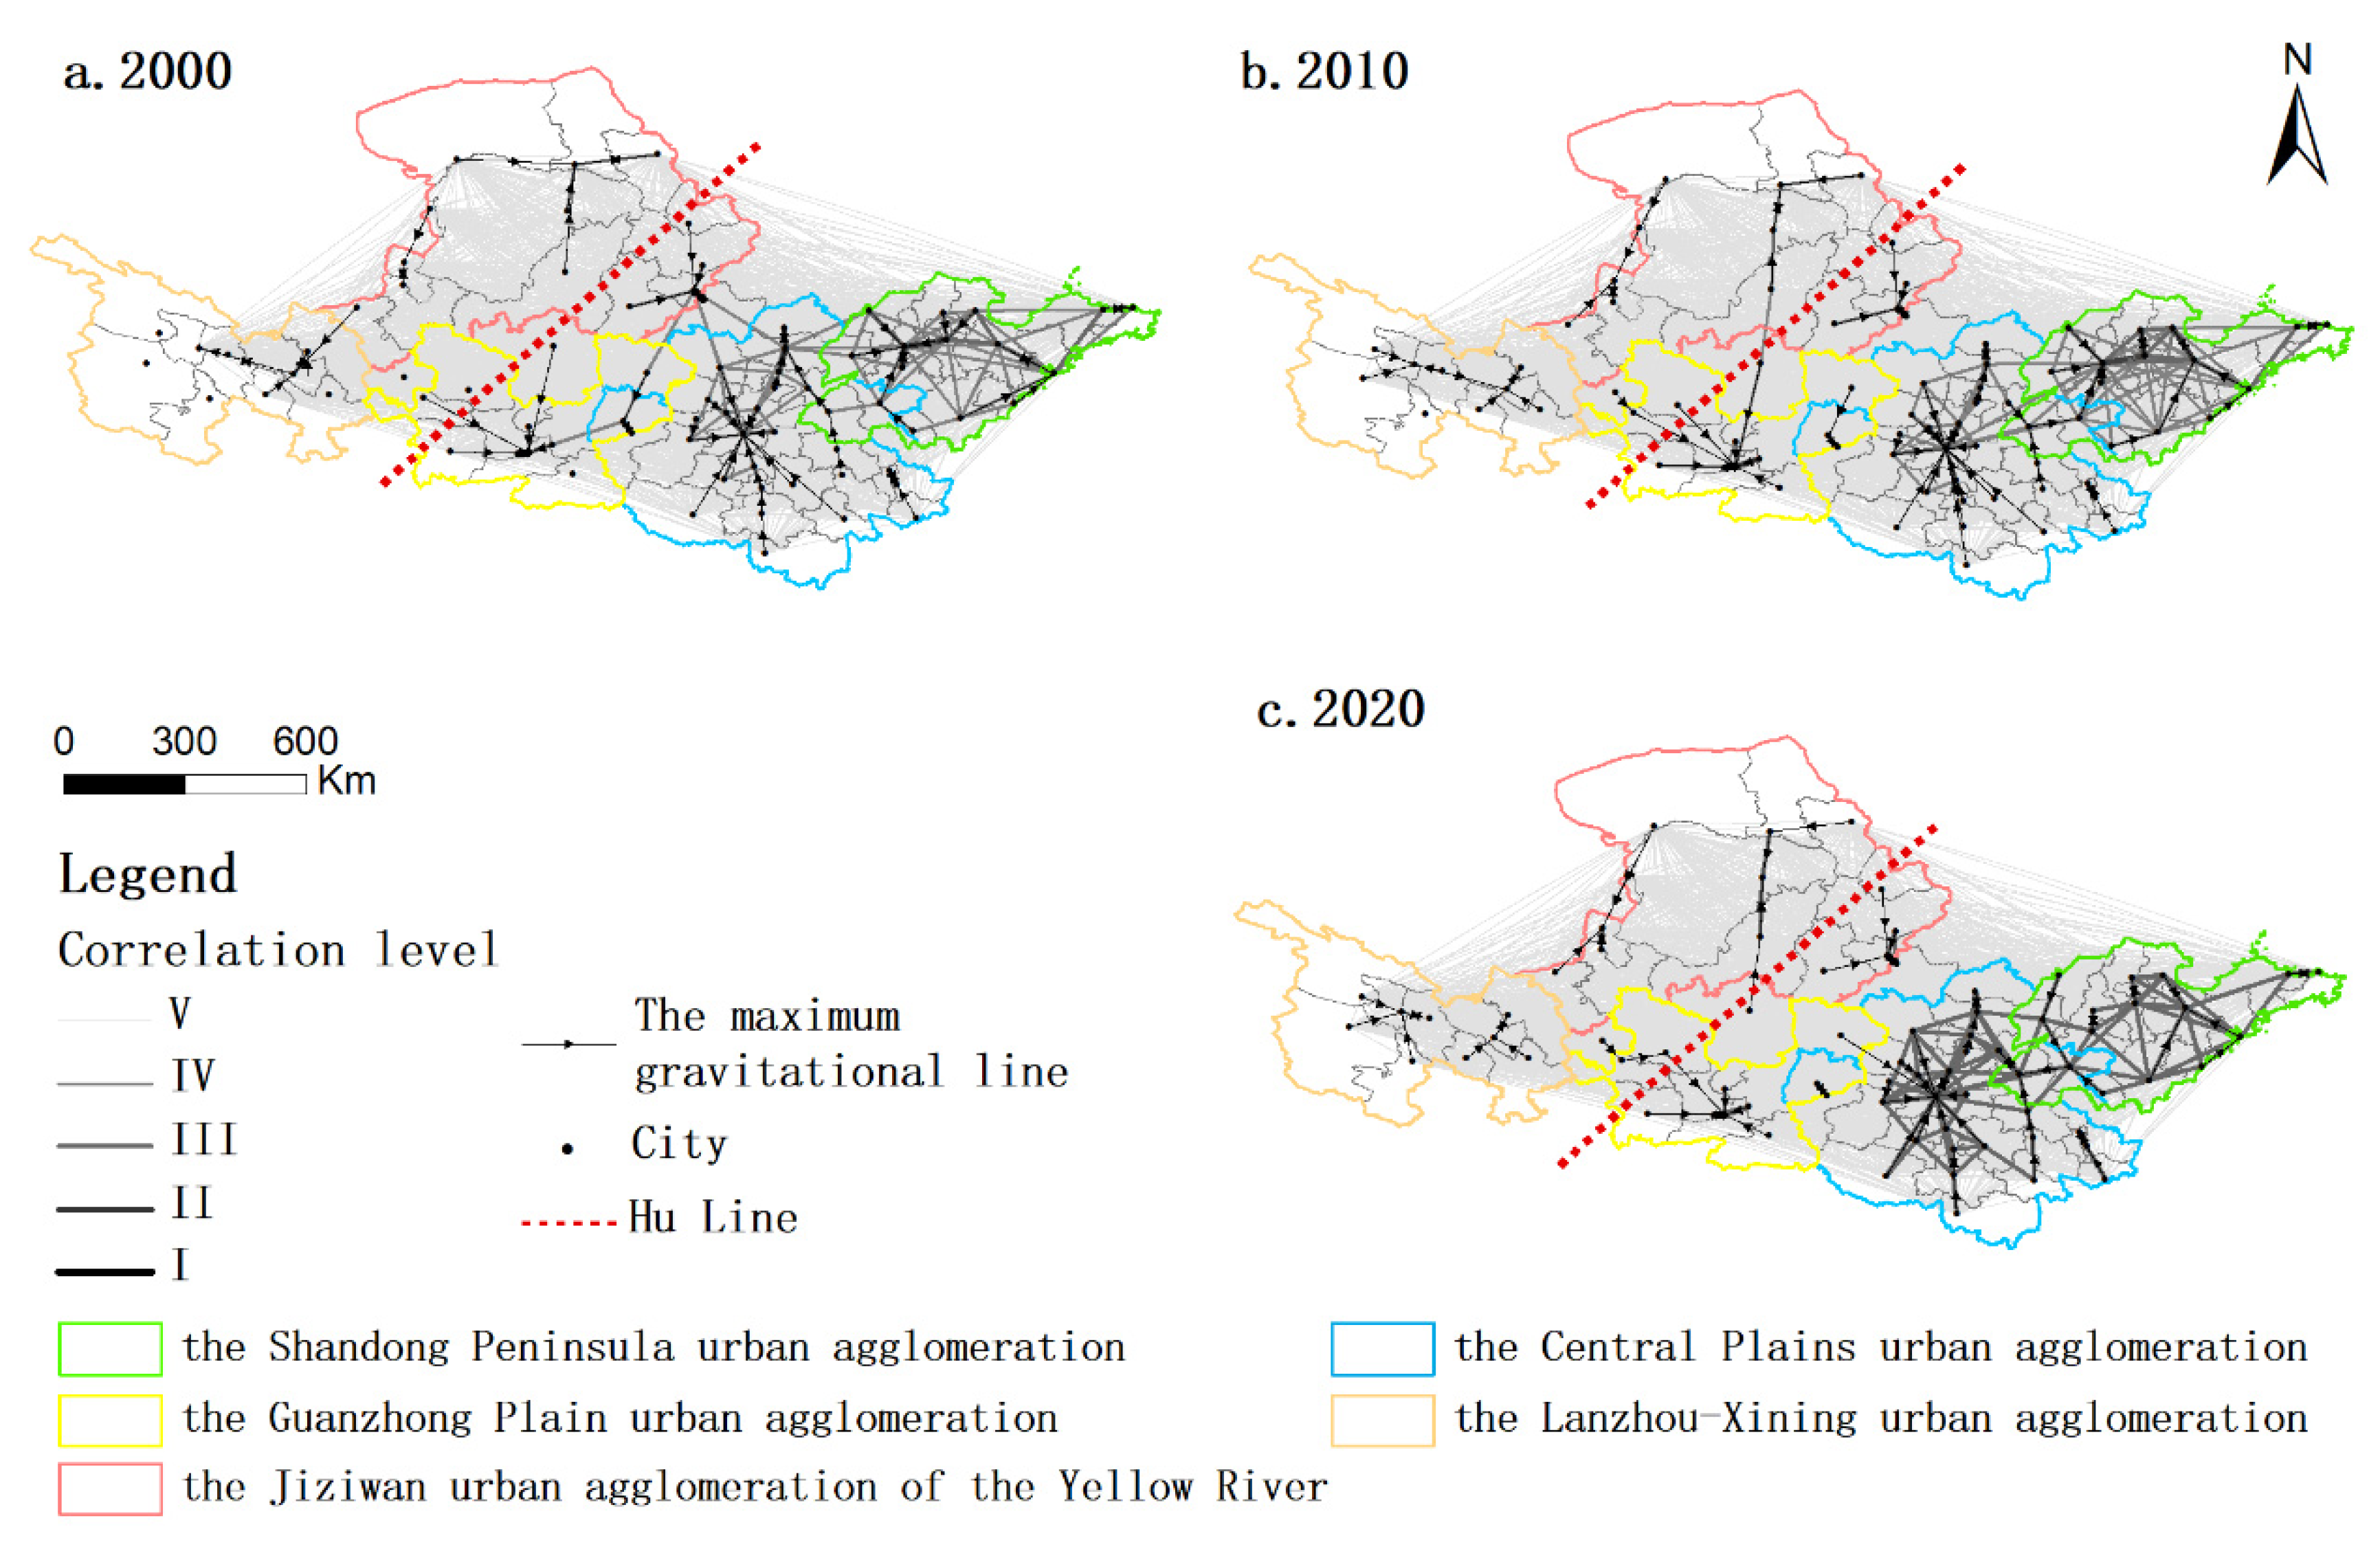
3.4.1. Spatial Distribution of Correlation Levels of Urban Agglomerations

According to Equation (6), it can be concluded that the urban spatial association network in the urban agglomeration in the Yellow River Basin increases with time, from 2551 pairs in 2000 to 3003 pairs in 2020. The number of IV and V contacts is increasing. The magnitude of changes in the location of associations at levels I–III is small, indicating that the number of urban spatial associations in the Yellow River Basin urban agglomeration has increased, but the change in the pattern of mutual associations is small.
The southeast of the study area showed stronger correlations than the northwest (Figure 5). The areas with strong urban connections were mainly located in the Shandong Peninsula urban agglomeration and the Central Plains urban agglomeration, followed by the Guanzhong Plain urban agglomeration and the Jiziwan urban agglomeration of the Yellow River. The Lanzhou–Xining urban agglomeration had the weakest degree of inter-city connection, and the connection was relatively loose.

3.4.2. Spatial Distribution Characteristics of Maximum Gravitational Lines

The maximum gravitational line between cities forms a relatively stable combination structure in space. It can be divided into two attraction modes: one is the gravitational effect of the core city on the surrounding cities, and the other is the mutual gravitational effect between cities with adjacent geographical locations and comparable economic development. The core city Zhengzhou was the most attractive city in the Central Plains urban agglomeration. Zhengzhou was the growth pole city with the widest radiation range and the largest radiation area among the five major city clusters in the Yellow River Basin. The largest gravitational lines in the Guanzhong Plain urban agglomeration were concentrated in Xi’an. The largest gravitational lines in the Lanzhou–Xining urban agglomeration were concentrated in Lanzhou and Xining. The distribution of the largest gravitational lines in the Jiziwan urban agglomeration of the Yellow River was special: the western parts of the urban agglomeration were attracted by several major cities, and they were distributed in strips along the Yellow River. The attractiveness of cities in the middle of the urban agglomeration has changed over time. After 2010, resource-based cities Yulin and Ordos became more attractive. By 2020, the largest gravitational line in the central area of the urban agglomeration pointed to these two cities. Taiyuan in the east showed a radiating and driving effect on cities in northwest Shanxi.

4. Discussion

4.1. Discussion on the Expansion and Correlation of Urban Agglomerations

Our results showed a rapid expansion of urban agglomeration in the Yellow River Basin. This can be attributed to the higher rates of urban population growth in the Yellow River Basin [46]. However, compared with the research results of Sun et al. [42], the overall expansion rate of urban agglomerations in the Yellow River Basin is lower than the national level. The expansion of urban agglomeration in the Yellow River Basin is a geographically uneven process. The expansion rate and intensity are different among the urban agglomerations in the Yellow River Basin. This is due to uneven opportunities and dualism, including the household registration system, family planning, public resource allocation, and the land system [22]. The Central Plains and Shandong Peninsula urban agglomerations showed a faster expansion rate, while the Guanzhong Plain urban agglomeration, the Jiziwan urban agglomeration, and the Lanzhou–Xining urban agglomeration expanded slowly. Because the urban expansion rate is always linked to the economic status of the area [47], the Central Plains and Shandong Peninsula urban agglomerations have thriving economic activity since they are mainly distributed in east China. The economic activity of the Guanzhong Plain urban agglomeration, the Jiziwan urban agglomeration, and the Lanzhou–Xining urban agglomeration was relatively weak. There are many differences in the expansion rate and intensity of urban agglomerations across different periods. For instance, urban agglomerations expanded rapidly from 2000 to 2005 because this period witnessed overall urban expansion in China and fast GDP growth [48]. In addition, the western development strategy contributed to the economic development and human settlement activities in the western region. This policy also led to the expansion of urban agglomerations in the Yellow River Basin [49]. From 2005 to 2010, the expansion of urban agglomerations became reasonable because the local government focused on the actual needs of the region, prepared plans, and sought profit [47]. This situation also led to negative growth in some cities in the past. From 2010 to 2015, the strategy for the rise of the central region contributed to the expansion of the Central Plains urban agglomeration. From 2015 to 2020, the expansion intensity of urban agglomeration was slight, which may be associated with a sufficient built-up area.
The amount of NTL data of the urban agglomeration in the Yellow River Basin shows a large difference between the eastern and western regions. This result is consistent with the results obtained by Long et al. [22] using statistical data, POI data, and NTL data. The study area presents a step-like topography with complex terrain in the northwest and the flattened region in the southeast. Along with the upstream, midstream, and downstream of the Yellow River, the main landforms are mountains, plateaus, and plains, respectively (Figure 1). Cities with a high total NTL are mainly distributed downstream of the Yellow River, with gentle terrain. These areas are important agricultural areas and provide favorable conditions for the rapid development of cities. In the midstream and upstream of the Yellow River, most cities are located in the mountainous region and expanded relatively slowly. Due to the limitation of terrain and resources, the conditions for large-scale development and construction in this area are insufficient. Therefore, urban expansion progresses at a relatively slow rate. In addition to being affected by geographical conditions, the scale of cities is also affected by factors such as the economic development level, traffic accessibility, resource availability and policies. The Central Plains urban agglomeration and Shandong Peninsula urban agglomeration show stronger vitality in economic activity than other urban agglomerations. Zhengzhou, the core city of the Central Plains urban agglomeration, is the largest transportation hub city in the Central Plains. Most cities in the Shandong Peninsula urban agglomeration occupy favorable coastal conditions, with a high degree of external development and a relatively developed economy. Xi’an, the core city of the Guanzhong Plain urban agglomeration, has a long history of construction, developed transportation and great economic development conditions. The development of Yulin and Ordos relies on their rich mineral resources in the urban circle of the Jiziwan urban agglomeration. The Lanzhou–Xining urban agglomeration develops slowly due to its weak economic and transportation foundations.
The gravity center of the Shandong Peninsula urban agglomeration, the Jiziwan urban agglomeration, and the Lanzhou–Xining urban agglomeration were located in a city from 2000 to 2020. This result suggested relatively balanced economic development in these regions. The gravity center of the Central Plains urban agglomeration and the Guanzhong Plain urban agglomeration changed in three cities from 2000 to 2020. This result suggests the imbalanced economic development in these regions. The shifting distance and direction of the gravity center can also reflect the geographically uneven process of urban expansion. The shifting distance reflected a large difference in the speed of urban expansion in urban agglomeration, while the shifting direction of the gravity center represented the accelerated economic development in that direction. We applied the center of gravity shift to the study of urban agglomeration. It can grasp the development trend of urban agglomerations, predict the expansion direction of built-up areas, and at the same time, provide theoretical reference for urban construction.
The primacy of cities showed the hierarchical structure of the urban agglomerations. Zhengzhou’s primacy ratio was less than 2 from 2000 to 2010, and after 2015, the primacy increased to more than 2. This result indicated that Zhengzhou’s urban development was increasingly driving the economic development of the Central Plains urban agglomeration. It had strong attraction and cohesion to various elements in the urban agglomeration. Xi’an had a higher primacy in the study period, at only slightly lower than 2 in 2005. This result could be related to the slow development of secondary cities in the Guanzhong Plain urban agglomeration. The primacy of Lanzhou showed a decreasing trend. This is because Xining developed rapidly from 2000 to 2020. A mode of dual-core development dominated in the Lanzhou–Xining urban agglomeration. The primate city in the Jiziwan urban agglomeration changed three times from 2000 to 2020. This result can be attributed to a similar economic growth rate among cities in the Jiziwan urban agglomeration.
The spatial correlation in the Yellow River Basin increased from 2000 to 2020. This was related to the economic development and increased population. The pattern of spatial correlation in the Yellow River Basin urban agglomeration showed a similar pattern with the division of the study area with Hu’s Line [50]. The pattern of spatial correlation between cities was not only affected by their distance and geographical location but was also affected by their economic activity. The Shandong Peninsula urban agglomeration and the Central Plains urban agglomeration have a relatively high degree of development in terms of their economy, society and population. Therefore, these two urban agglomerations had a strong ability to radiate and drive each other. The Guanzhong Plain urban agglomeration, the Jiziwan urban agglomeration of the Yellow River, and the Lanzhou–Xining urban agglomeration have also developed in the past two decades, especially the expansion of the core cities in the region. However, the development of its surrounding areas is relatively slow. Therefore, there were weak connections in these urban agglomerations. Gravity model has applied physical methods to urbanism and characterized the connections between different cities. The city association network can be obtained by this method. At the same time, calculating the maximum gravitational line can reflect the influence of the city more intuitively. Our findings are consistent with the results obtained by Si et al. [51] using the Moran I spatial correlation test. However, our results are more intuitive than the Moran I method. The interaction between urban agglomerations in the Yellow River Basin still needs to be strengthened. The spatial spillover effect of eastern urban agglomerations is weak. The leading role of the core cities in the western urban agglomerations on the surrounding cities needs to be strengthened.

4.2. Discussion on the Proposals for the Coordinated Development of Urban Agglomerations

Through the research, it was found that the urban agglomeration in the Yellow River Basin has differences between the east and the west in terms of urban expansion and the influence of the primate city. The influence of the western core cities and their correlation with the eastern cities need to be strengthened. The eastern urban agglomeration should develop in a balanced way to avoid a polarization phenomenon in which one city is the strongest. In further research, it can be analyzed from the perspective of urban landscape patterns or combined with other data to obtain more comprehensive results.
The research on the urban network in the Yellow River Basin has been deepened, which can provide a certain theoretical basis for the major national strategies for ecological protection and high-quality development in the Yellow River Basin. For the future construction of the urban agglomeration in the Yellow River Basin, it is necessary to pay attention to the coordinated development within the urban agglomeration and among the urban agglomerations while continuing to promote urbanization. The Lanzhou–Xining urban agglomeration in the west, due to its fragile ecological environment, vast land and sparse population, and lagging urbanization development, should rely more on the innovation-driven and rational planning of space and the efficient use of resources to promote urban development. The energy-based Jiziwan urban agglomeration of the Yellow River mainly relies on mineral resource-related industries to drive urban development. It is necessary to try green transformation and at the same time pay attention to pollution control to achieve the goal of high-quality development. The Guanzhong Plain urban agglomeration and the Central Plains urban agglomeration are located in the plains and are strategic development centers in the central and western regions. In the future, these two regions should continue to improve the overall development level and promote the development and growth of other secondary small- and medium-sized cities other than the provincial capital cities. The Shandong Peninsula urban agglomeration will still play its leading role in the development of the watershed in the future. Compared with other mature urban agglomerations in the country, its technological innovation capability and core competitiveness are not outstanding enough. In the future, it is still necessary to enhance the comprehensive competitiveness of the whole country. Only by formulating individualized development strategies according to the actual conditions of different urban agglomerations can the coordinated development of urban agglomerations in the whole basin be realized as soon as possible.

5. Conclusions

This study utilizes multi-source nighttime light remote sensing data to characterize urban space. The evolution law of cities and urban agglomerations in time and space is summarized using the methods of spatial expansion measurement, the center of gravity offset, city primacy, and the gravity model to explore the expansion and correlation of the five major urban agglomerations in the Yellow River Basin. The spatial and temporal characteristics of urban expansion in the Yellow River Basin urban agglomeration are as follows: the speed and intensity of the spatial expansion of the five major urban agglomerations in the Yellow River Basin have increased, and the scale of cities has expanded significantly, and the expansion speed and intensity have shown obvious fluctuations due to the influence of policies and development laws. From a spatial point of view, the overall distribution pattern of urban lighting is high in the east and low in the west.
The shifting law of the gravity center of the five major urban agglomerations is as follows: Generally speaking, in the past 20 years, the gravity center of the Shandong Peninsula urban agglomeration, the Jiziwan urban agglomeration of the Yellow River, and the Guanzhong Plain urban agglomeration have all shifted to the southwest, and the center of the Central Plains urban agglomeration has moved to the southeast. The center of gravity of the Lanzhou–Xining urban agglomeration has mainly shifted to the west, the migration process fluctuates greatly, and the center of gravity swings back and forth in the northwest and southeast directions.
The characteristics of the primacy of urban agglomerations are as follows: From 2000 to 2020, Qingdao, Zhengzhou, Xi’an and Lanzhou have been the primate cities in the four urban agglomerations of Shandong Peninsula, Central Plains, Guanzhong Plain, and Lanzhou–Xining. Due to the low level of the Jiziwan urban agglomeration of the Yellow River, the primate city in the region changed from Taiyuan to Yinchuan and then to Yulin.
The characteristics of the spatial correlation of urban agglomerations in the Yellow River Basin are as follows: The spatial distribution of the gravitational network is dense in the southeast and sparse in the northwest. The Shandong Peninsula urban agglomeration and the Central Plains urban agglomeration have a strong degree of urban connection, followed by the Guanzhong Plain urban agglomeration and the Jiziwan urban agglomeration of the Yellow River. The Lanzhou–Xining urban agglomeration has the weakest degree of interconnection. The greatest gravitational lines of cities all point to growth pole cities and core cities. Eastern core cities are more attractive than western core cities.

Author Contributions

Conceptualization, Z.Z. and Y.L.; methodology, Y.L.; software, Y.L.; validation, Z.Z.; formal analysis, Z.Z. and Y.L.; investigation, Y.L.; resources, Z.Z.; data curation, Y.L.; writing—original draft preparation, Y.L.; writing—review and editing, Z.Z. and Y.L.; visualization, Y.L.; supervision, Z.Z.; project administration, Z.Z.; funding acquisition, Z.Z. All authors have read and agreed to the published version of the manuscript.

Funding

This research was funded by Shanxi Provincial Department of Education Project Shanxi Yellow River “5G+” Tourism Planning Research, grant number HH202005.

Institutional Review Board Statement

Not applicable.

Informed Consent Statement

Not applicable.

Data Availability Statement

Not applicable.

Acknowledgments

We express our gratitude to the anonymous reviewers and editors for their professional comments and suggestions.

Conflicts of Interest

The authors declare no conflict of interest.

References

  1. United Nations. World Population Prospects: The 2017 Revision; United Nations Department of Economic and Social Affairs, Population Division: New York, NY, USA, 2017. [Google Scholar]
  2. Gong, J.; Hu, Z.; Chen, W.; Liu, Y.; Wang, J. Urban expansion dynamics and modes in metropolitan Guangzhou, China. Land Use Policy 2018, 72, 100–109. [Google Scholar] [CrossRef]
  3. Geddes, P. Cities in Evolution: An Introduction to the Town-Planning Movement and the Study of Cities; Williams and Norgate: London, UK, 1915. [Google Scholar]
  4. Huang, J.G.; Lu, X.X.; Sellers, J.M. A global comparative analysis of urban form: Applying spatial metrics and remote sensing. Landsc. Urban Plan. 2007, 82, 184–197. [Google Scholar] [CrossRef]
  5. Doxiadis, C.A. The emerging great lakes magalopolis. Proc. IEEE 1968, 56, 402–424. [Google Scholar] [CrossRef]
  6. Rondinelli, D.A. The crisis of urbanization in Asia: Finding alternatives to megalopolitan growth. J. Soc. Political Econ. Stud. 1985, 10, 69–86. [Google Scholar]
  7. Kanemoto, Y.; Tokuoka, K. Proposal for the standards of metropolitan areas of Japan. J. Appl. Reg. Sci. 2002, 7, 1–15. [Google Scholar]
  8. McGee, T.G. Eurocentrism in geography: The case of Asian urbanization. Can. Geogr. 1991, 35, 332–344. [Google Scholar] [CrossRef]
  9. Fang, C.; Yu, D. Urban agglomeration: An evolving concept of an emerging phenomenon. Landsc. Urban Plan. 2017, 162, 126–136. [Google Scholar] [CrossRef]
  10. Wang, C.P.; Wang, H.W.; Li, C.M.; Dong, R. Analysis of the spatial expansion characteristics of major urban agglomerations in China using DMSP/OLS images. Acta Ecol. Sin. 2012, 32, 942–954. [Google Scholar] [CrossRef] [Green Version]
  11. Zeng, H.; Shao, B.; Bian, G.; Dai, H.; Zhou, F. Analysis of influencing factors and trend forecast of CO2 emission in Chengdu-Chongqing urban agglomeration. Sustainability 2022, 14, 1167. [Google Scholar] [CrossRef]
  12. Hu, P.; Li, F.; Sun, X.; Liu, Y.; Chen, X.; Hu, D. Assessment of land-use/cover changes and its ecological effect in rapidly urbanized areas—Taking pearl river delta urban agglomeration as a case. Sustainability 2021, 13, 5075. [Google Scholar] [CrossRef]
  13. Wang, J.; Zhong, Y.; Li, Z.; Fang, C. Temporal and spatial analysis of PM2.5 and O3 pollution characteristics and transmission in central liaoning urban agglomeration from 2015 to 2020. Sustainability 2022, 14, 511. [Google Scholar] [CrossRef]
  14. Wang, J.; Liu, H.; Peng, D.; Lv, Q.; Sun, Y.; Huang, H.; Liu, H. The county-scale economic spatial pattern and influencing factors of seven urban agglomerations in the Yellow River Basin—A study based on the integrated nighttime light data. Sustainability 2021, 13, 4220. [Google Scholar] [CrossRef]
  15. Huang, Q.; Liu, Y. The coupling between urban expansion and population growth: An Analysis of urban agglomerations in China (2005–2020). Sustainability 2021, 13, 7250. [Google Scholar] [CrossRef]
  16. Fang, C.L. Spatial organization pattern and high-quality development of urban agglomeration in the Yellow River Basin. Econ. Geogr. 2020, 40, 1–8. [Google Scholar]
  17. Zhu, X.M.; Wei, J.H.; Yang, H.J.; Wu, G.H. Evaluation and driving factor analysis of water resources utilization efficiency of urban agglomerations in the Yellow River Basin. Water Resour. Prot. 2022, 38, 153–159. [Google Scholar]
  18. Zhao, P.F.; Bai, Y.; Wang, P.; Wu, P.Q. Spatio-temporal characteristics of air pollutants in major urban agglomerations of the Yellow River Basin. Bull. Surv. Mapp. 2021, 10, 48–53. [Google Scholar]
  19. Ma, H.T.; Xu, X.F. High-quality development assessment and spatial heterogeneity of urban agglomeration in the Yellow River Basin. Econ. Geogr. 2020, 40, 11–18. [Google Scholar]
  20. Li, L.S.; Zhao, H.B.; Guo, F.Y.; Wang, Y. High-quality development spatio-temporal evolution of industry in urban agglomeration of the Yellow River Basin. Sci. Geogr. Sin. 2021, 41, 1751–1762. [Google Scholar]
  21. Li, H.; Wei, Y.; Liao, F.; Huang, Z. Administrative hierarchy and urban land expansion in transitional China. Appl. Geogr. 2015, 56, 177–186. [Google Scholar] [CrossRef]
  22. Long, Y.; Zhai, W.; Shen, Y.; Ye, X. Understanding uneven urban expansion with natural cities using open data. Landsc. Urban Plan. 2018, 177, 281–293. [Google Scholar] [CrossRef] [Green Version]
  23. Elvidge, C.; Baugh, K. Satellite inventory of human settlements using nocturnal radiation emissions: A contribution for the global toolchest. Glob. Change Biol. 1997, 3, 387–395. [Google Scholar] [CrossRef]
  24. Ma, T.; Zhou, Y.; Zhou, C.; Haynie, S.; Pei, T.; Xu, T. Night-time light de-rived estimation of spatiotemporal characteristics of urbanization dynamics using DMSP/OLS satellite data. Remote Sens. Environ. 2015, 158, 453–464. [Google Scholar] [CrossRef]
  25. Ch, R.; Martin, D.A.; Vargas, J.F. Measuring the size and growth of cities using nighttime light. J. Urban Econ. 2021, 125, 103254. [Google Scholar] [CrossRef] [Green Version]
  26. Florida, R.; Mellander, C.; Gulden, T. Global metropolis: Assessing economic activity in urban centers based on nighttime satellite images. Prof. Geogr. 2012, 64, 178–187. [Google Scholar] [CrossRef]
  27. Sutton, P.C.; Costanza, R. Global estimates of market and non-market values derived from nighttime satellite imagery, land cover, and ecosystem service valuation. Ecol. Econ. 2002, 41, 509–527. [Google Scholar] [CrossRef]
  28. McCord, G.C.; Rodriguez-Heredia, M. Nightlights and subnational economic activity: Estimating departmental GDP in paraguay. Remote Sens. 2022, 14, 1150. [Google Scholar] [CrossRef]
  29. Ivan, K.; Holobâcă, I.H.; Benedek, J.; Török, I. Potential of night-time lights to measure regional inequality. Remote Sens. 2020, 12, 33. [Google Scholar] [CrossRef] [Green Version]
  30. Elvidge, C.D.; Sutton, P.C.; Ghosh, T.; Tuttle, B.T.; Baugh, K.E.; Bhaduri, B.; Bright, E. A global poverty map derived from satellite data. Comput. Geosci. 2009, 35, 1652–1660. [Google Scholar] [CrossRef]
  31. Henderson, V.; Storeygard, A.; Weil, D.N. A bright idea for measuring economic growth. Am. Econ. Rev. 2011, 101, 194–219. [Google Scholar]
  32. Gao, M.; Piao, S.; Chen, A.; Yang, H.; Liu, Q.; Fu, Y.H.; Janssens, I.A. Divergent changes in the elevational gradient of vegetation activities over the last 30 years. Nat. Commun. 2019, 10, 2970. [Google Scholar] [CrossRef]
  33. Bruederle, A.; Hodler, R. Nighttime lights as a proxy for human development at the local level. PLoS ONE 2018, 13, e0202231. [Google Scholar] [CrossRef] [PubMed] [Green Version]
  34. Croft, T.A. Burning waste gas in oil fields. Nature 1973, 245, 375–376. [Google Scholar] [CrossRef]
  35. Croft, T.A. Nighttime images of the Earth from space. Sci. Am. 1978, 239, 86–98. [Google Scholar] [CrossRef]
  36. Liu, Z.; He, C.; Zhang, Q.; Huang, Q.; Yang, Y. Extracting the dynamics of urban expansion in China using DMSP-OLS nighttime light data from 1992 to 2008. Landsc. Urban Plan. 2012, 106, 62–72. [Google Scholar] [CrossRef]
  37. Ouyang, Z.; Lin, M.; Chen, J.; Fan, P.; Qian, S.S.; Park, H. Improving estimates of built-up area from night time light across globally distributed cities through hierarchical modeling. Sci. Total Environ. 2019, 647, 1266–1280. [Google Scholar] [CrossRef]
  38. Framework of the plan for ecological protection and high-quality development of the Yellow River Basin. Gaz. State Counc. People’s Repub. China 2021, 30, 15–35.
  39. Li, X.; Li, D.; Xu, H.; Wu, C. Intercalibration between DMSP/OLS and VIIRS night-time light images to evaluate city light dynamics of Syria’s major human settlement during Syrian Civil War. Int. J. Remote Sens. 2017, 38, 5934–5951. [Google Scholar] [CrossRef]
  40. Zheng, Q.; Weng, Q.; Wang, K. Developing a new cross-sensor calibration model for DMSP-OLS and suomi-NPP VIIRS night-light imageries. ISPRS J. Photogramm. Remote Sens. 2019, 153, 36–47. [Google Scholar] [CrossRef]
  41. Milesi, C.; Elvidge, C.D.; Nemani, R.R.; Running, S.W. Assessing the impact of urban land development on net primary productivity in the southeastern United States. Remote Sens. Environ. 2003, 86, 401–410. [Google Scholar] [CrossRef]
  42. Sun, H.; Li, X.M.; Liu, H. Spatial expansion and association research of chinese urban living activities based on DMSP/OLS and NPP/VIIRS. Resour. Dev. Mark. 2021, 37, 1427–1432. [Google Scholar]
  43. Li, Q.; Zheng, B.; Tu, B.; Yang, Y.; Wang, Z.; Jiang, W.; Yao, K.; Yang, J. Refining urban built-up area via multi-source data fusion for the analysis of dongting lake eco-economic zone spatiotemporal expansion. Remote Sens. 2020, 12, 1797. [Google Scholar] [CrossRef]
  44. Dzik, A.J. Nuuk, Greenland: Site, situation, and “The Law of the Primate City”. North. Rev. 2018, 48, 3–32. [Google Scholar] [CrossRef] [Green Version]
  45. Nie, Q.; Wu, J.J.; Yan, X.Y.; Liu, J.H.; Wang, J. Human migration patterns in China with the resume data. Mod. Phys. Lett. B 2019, 33, 14. [Google Scholar] [CrossRef] [Green Version]
  46. Güneralp, B.; Reba, M.; Hales, B.U.; Wentz, E.A.; Seto, K.C. Trends in urban land expansion, density, and land transitions from 1970 to 2010: A global synthesis. Environ. Res. Lett. 2020, 15, 044015. [Google Scholar] [CrossRef]
  47. Han, S.S. Urban expansion in contemporary China: What can we learn from a small town? Land Use Policy 2010, 27, 780–787. [Google Scholar] [CrossRef]
  48. Li, G.; Sun, S.; Fang, C. The varying driving forces of urban expansion in China: Insights from a spatial-temporal analysis. Landsc. Urban Plan. 2018, 174, 63–77. [Google Scholar] [CrossRef]
  49. Zhuo, C.; Deng, F. How does China’s Western development strategy affect regional green economic efficiency? Sci. Total Environ. 2018, 707, 135939. [Google Scholar] [CrossRef] [PubMed]
  50. Qi, W.; Liu, S.; Zhao, M.; Liu, Z. China’s different spatial patterns of population growth based on the “Hu Line”. J. Geogr. Sci. 2016, 26, 1611–1625. [Google Scholar] [CrossRef]
  51. Si, L.J.; Wang, C.Q. Regional economic disparity, dynamic evolution and convergence of urban agglomerations in China research based on nighttime light data of ten urban agglomerations. Shanghai J. Econ. 2021, 10, 38–52. [Google Scholar]
Figure 1. Schematic diagram of urban agglomeration in the Yellow River Basin. Drawing review number: GS (2021)5451.
Sustainability 14 09359 g001
Figure 2. Spatial expansion speed of each urban agglomeration in the Yellow River Basin. The solid legends indicate expansion velocity (km2/a). The hollow colored legends indicate the extent of the urban agglomeration.
Sustainability 14 09359 g002
Figure 3. Spatial distribution of the total NTL data in cities in the Yellow River Basin 2000–2020. Solid legends indicate total NTL. The hollow colored legends indicate the extent of the urban agglomeration.
Sustainability 14 09359 g003
Figure 4. Expansion and center of gravity shift of each urban agglomeration in 2000–2020.
Sustainability 14 09359 g004
Figure 5. Spatial and temporal differentiation of the spatial correlation of cities in the Yellow River Basin urban agglomeration. (The Hu Line is the connection between Heihe and Tengchong in China, and its function is to compare the population density of China).
Sustainability 14 09359 g005
Table 1. The expansion intensity of each urban agglomeration in the Yellow River Basin.
Urban AgglomerationsExpansion Intensity (%)
2000–20052005–20102010–20152015–2020
The Shandong Peninsula urban
agglomeration
28.15.015.9112.83
The Central Plains urban agglomeration21.624.8317.5715.81
The Guanzhong Plain urban
agglomeration
30.96.469.789.05
The Jiziwan urban agglomeration of the Yellow River28.928.919.568.28
The Lanzhou–Xining urban agglomeration15.2710.9112.5811.99
All urban agglomerations in the Yellow River Basin25.895.8610.5112.73
Table 2. The primacy ratio of cities in the Yellow River Basin urban agglomeration in 2000–2020.
Urban AgglomerationPrimate CityPrimacy Ratio
20002005201020152020
The Shandong Peninsula urban
agglomeration
Qingdao1.461.311.191.281.10
The Central Plains urban
agglomeration
Zhengzhou1.111.901.862.672.19
The Guanzhong Plain urban agglomerationXi’an2.401.992.602.302.10
The Jiziwan urban agglomeration of the Yellow RiverTaiyuan, Yinchuan, Yulin1.421.481.051.091.00
The Lanzhou–Xining urban
agglomeration
Lanzhou2.601.741.611.461.59
Publisher’s Note: MDPI stays neutral with regard to jurisdictional claims in published maps and institutional affiliations.

