Abstract
Rainfall severely impacts human mobility in urban areas and creates significant challenges for traffic management and urban planning. There is an urgent need to understand the impact of rainfall on residents’ travels from multiple perspectives. Taxi GPS data contains a large amount of spatiotemporal information about human activities and mobility in urban areas. For this study, we selected the central area of Zhuhai as the study area and used taxi data from August 2020 for the investigation. Firstly, we divided the taxi data into four scenarios, i.e., weekdays with and without rainfall and weekends with and without rainfall and analyzed and compared the trip characteristics for the different scenarios. Then, using the traffic analysis zone (TAZ) as the node and taxi flow between TAZs as edges, we constructed a network and compared the network indicators under the different scenarios. Finally, we used the Leiden algorithm to detect communities in different scenarios and compared the network indicators of the communities. The results showed that on days with rainfall, taxi flow and its spatial and temporal distribution pattern changed significantly, which affected transportation supply and demand. These findings may provide useful references for the formulation of urban transport policies that can adapt to different weather conditions.
1. Introduction
The study of human mobility can be used to capture spatiotemporal operational patterns in urban areas and to understand the complex relationship between human activity and the urban environment. This understanding plays an important role in various aspects, such as floating population access, traffic forecasting, urban planning, and epidemic modeling [1,2,3].
Traditional studies of human mobility usually adapt travel diary survey data, which are expensive and labour-intensive to obtain. However, because these data often have problems, such as a small sample size, a short time span, and slow update speed, they cannot thoroughly reflect the spatiotemporal regulation of urban group activities over time. Additionally, the accuracy of the data can also be questionable as a result of the subjectivity of the survey design and the interviewees. With the development of positioning and information and communication technologies (ICTs), humans have entered the era of big data. The proliferation of various sensors and positioning technologies makes it possible to collect large-scale and high-precision big data on human mobility in a long time sequence (such as mobile phone data, bus smart card data, and taxi data). These datasets contain abundant information about individual spatiotemporal activities, which contributes to understanding human mobility patterns at a more precise spatiotemporal level [4,5,6]. As one of the representative types of data on traffic and travel, taxi data have become an important basis for studies of human mobility patterns [7].
As a component of the human living environment, weather conditions have significant impacts on daily trips made by inhabitants [8,9,10,11]. Taking taxi travel as an example, the rainfall not only affects the demand for taxis but also leads to changes in the taxi flow between areas. Additionally, it is likely that changes in road conditions caused by rainfall affect driving speed, travel time, and choice of route during the taxi journey from passenger pickup to the destination. [12,13]. In brief, people’s travel is influenced by weather conditions, and their travel strategies usually vary significantly in different weather conditions [14,15]. As a result, understanding how weather impacts human travel patterns can contribute to improving the public transport service, and better satisfying the travel demands of passengers under different weather conditions [16].
Studies of human mobility patterns that consider weather factors generally focus on the field of transportation, usually analyzing several aspects, including traffic volume [17], the speed and density of traffic flow [18,19], and traffic jams [20]. In addition, weather changes make a big difference to vehicles, road conditions, driving behaviors (such as psychology, judgement, and reflection) and the riding environment [21].
When considering complex and changeable weather factors, current research mainly focuses on the association between different weather factors and human travel activities, such as the demand for and security of traffic travel under various weather conditions, including elevated temperatures, smog, and high winds [22,23]. These studies, for the most part, investigated the impact of weather factors on people’s travel behaviors using various modes of transportation from four perspectives: number of journeys, modes of travel, travel speed, and travel time [24,25,26,27,28]. In addition, many studies regard rainfall as having the most significant impact on people’s daily travel activities [29,30]. In particular, normal travel time is usually delayed, and elastic demand is restricted and decreased in rainstorm conditions, resulting in significant changes in the spatiotemporal distribution of traffic demand [31].
However, because they lack sufficient space-dependent visual representation, current research studies mainly focus on the overall statistical analysis and do not explore the characteristics of the spatiotemporal distribution of people’s travel activities under different weather conditions. Because weather conditions have several significant impacts on human travel patterns and their spatial differences, the scarcity of study in this field needs to be addressed, with particular regard to the significant spatial impact of two weather conditions, the spatial change of people’s travel behavior patterns, and their interplay [32]. As a result, analysis of the impacts of changes in weather conditions on people’s travel behavior patterns requires multiscale, comprehensive analysis and visual expression.
In addition, complex geospatial networks can combine statistics on the network index with a spatial analysis based on statistical analysis and spatial visualization of network characteristics [33,34]. Mobility network statistics can thus describe and evaluate how human mobility is distributed and developed on different scales. Therefore, these complex network-based analytical methods improve the understanding of urban mobility [35,36,37].
In this study, taking Zhuhai City, Guangdong Province, China as the study area, we combined geospatial complex networks with multiscale geospatial analysis to extend empirical research on human travel patterns by analyzing the impact of rainfall on human mobility. By dividing the taxi data into four scenarios: weekdays without rainfall, weekdays with rainfall, weekends without rainfall, and weekends with rainfall, we aimed to: (1) explore the feasibility of using taxi data to investigate human mobility in urban areas under rainfall conditions; (2) compare the differences in basic travel characteristics and explore the changes in the spatial distribution of trips in the different scenarios; and (3) quantitatively explore the impacts of rainfall on human mobility at the whole network and community network levels using the complex networks method.
2. Study Area and Data
2.1. Case Study: Zhuhai, China
This study was conducted in Zhuhai, China, which is in southern China and borders Macao to the south, with a total area of approximately 1736 km2. According to the seventh national population census conducted at the end of 2020, the residential population of Zhuhai was 2.44 million. Zhuhai consists of three districts (Xiangzhou, Doumen, and Jinwan) and five economic function districts (Hengqin, Gaoxin, Baoshui, Wanshan, and Gaolan). As the location of municipal government, Xiangzhou is the most flourishing district. In Zhuhai, the central part of Xiangzhou district is called the Zhuhai Central Area, and this represents the city center of Zhuhai. The central area occupies 153.15 km2 and has a population of 1.12 milion, which is 46.08 percent of the total residential population. The spatial map of Zhuhai and its central area is shown in Figure 1. In this study, we focused on human mobility in the central area.
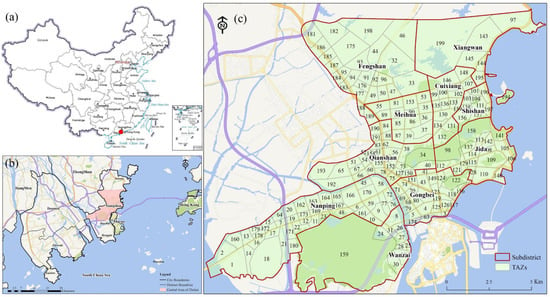
Figure 1.
(a) Location of the study area in China; (b) Location of the study area in Zhuhai City; (c) Overview of the study area-Zhuhai Central Area.
2.2. Data Source
To address our research questions and examine the association between human mobility and rainfall, three datasets from Zhuhai, China were used in this study. The first dataset was the weather conditions dataset, which consisted of one-hour measurements of weather conditions for two weather stations from the Meteorology Bureau of Zhuhai. Since drizzle and showers have minor effects on human mobility, this study defined days with rainfall as those with a total precipitation exceeding 25 mm and a duration of more than 6 h. Using this definition, we selected ten days with rainfall in August 2020, six weekdays and four days at weekends. In order to identify differences in human mobility on days with rainfall, twelve days without rainfall were also selected, half of which were weekdays and the other half at weekends. As shown in Figure 2, the daily precipitation in Zhuhai was plotted as a bar graph, and the dates of the four scenarios are represented by different colors.

Figure 2.
Zhuhai precipitation in August 2020 and the four scenarios.
The second dataset was taxi GPS trajectories for the same twenty-two days in August 2020. For study purposes, only the car IDs, pick-up and drop-off locations, and timestamps were considered (Table 1). The data covered trips taken by 2,165,106 passengers in 3284 taxis. Each trip represents a purposeful human movement from origin to destination. We used ArcGIS to calculate the TAZs (Traffic Analysis Zones) based on the pick-up and drop-off locations. In this sense, these trips can reflect spatial connections made through human movements and serve as edges to build spatial interaction networks.

Table 1.
Processed trip record data.
In order to analyze changes in human mobility using the complex network method, taxi OD points were integrated into different TAZs. Thus, the last dataset consists of the TAZ data for the central area, consisting of 199 vector polygons (Figure 1).
3. Methodology
This section presents the methodological framework proposed in this study. Figure 3 shows our framework, which consists of two major components. In the first component, we first calculated basic trip characteristics for different scenarios, such as trip distance and trip duration, and then analyzed the spatial distribution of the trip in the four scenarios using kernel density estimation. In the second component, we constructed the entire networks for the four scenarios, and from these we detected the mobility communities in order to investigate the impact of rainfall on human mobility by comparing the whole network and community network indicators.
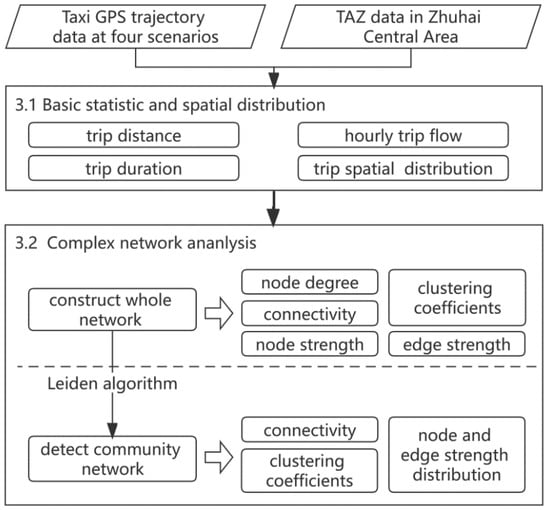
Figure 3.
Workflow of the analytical framework.
3.1. Basic Mobility Characteristics
As each trip is simplified to a vector , the basic trip patterns can be analyzed from the following two perspectives: Firstly, the properties of all trips, such as distance and duration, can be computed and the associated statistical distributions of the four scenarios are thus obtained. Trip distance and trip duration were calculated as follows:
Secondly, we used kernel density estimation to investigate the spatial distribution of the trips in the different scenarios. Kernel density estimation is a nonparametric method for estimating a density function from a random sample of data. The kernel density estimation was calculated as follows:
where is the bandwidth, is the number of discrete points in the bandwidth range, and is the kernel function.
3.2. Complex Network Analysis
3.2.1. Network Construction and Community Detection
To capture a holistic picture of the urban mobility network, we extracted the travel connection relationships between each pair of origin and destination (OD) TAZs and aggregated all the taxi trips to construct a weighted directed network. This is defined as , where contains all distinct visited TAZs, where n is the number of TAZs in the central area. The edge set contains all existing directed trips, where represents the directed flow between pairs of TAZs. is the weight of edge , which corresponds to the taxi trip flow of TAZs.
Urban mobility subnetworks were constructed using community detection. Community detection methods aim to identify partitions (structures composed of communities) which maximize the density of intragroup connections and thus find dense optimal subgraphs in large graphs. In other words, the community detection technique was used in our study to detect TAZs that had a higher quantity of interactions with each other than with the other TAZs, which means that people located in those TAZs have closer links with each other than those located elsewhere.
The Louvain method is a popular community detection algorithm that has the advantage of minimizing computation time [38]. However, it can yield arbitrarily badly connected communities. The Leiden technique is used to identify well-connected and locally optimal dynamic mobility communities in urban areas [39]. So, in this study, we used the Leiden technique to identify the dynamic urban mobility communities. This algorithm mainly consists of the following three phases: (1) local movement of nodes, (2) refinement of the partition, and (3) aggregation of the network based on the refined partition, using the nonrefined partition to create an initial partition for the aggregate network. For the network construction and analysis in this study, we used the Leidenalg package and the Python NetworkX package.
3.2.2. Statistical Indicators of Network
Degree, strength, connectivity, and clustering coefficient can be used to reflect the topology characteristics of the network. To further investigate the discrete characteristics of network indicator distribution, a standardized measure coefficient was used to represent the discrete characteristics of the network. By comparing the temporal changes of these indicator values in different weather conditions, we can obtain a better understanding of the impact of rainfall on network mobility.
Node degree is an important quantity that reveals the spatial heterogeneity of urban mobility [40]. Nodes with larger degrees represent more highly connected areas in the city. In a network, the degree of a node is the number of edges directly connected to the node, as shown in the following formula. In this study, it was the total number of passengers who were picked up or dropped off at a TAZ.
The strength of edge and node are two indicators for the analysis of the network flow. Edge strength represents the taxi flow in a specific direction between the two TAZs. Node strength is employed to generalize the degree measure of weighted networks, which is defined as the sum of the taxi flow on all edges associated with node . The calculation formula is as follows:
where represents one trip in this direction, and m is the total number of such trips.
The connectivity of the network is quantitatively calculated as follows:
where is the number of nodes and is the number of edges. A large indicates that the taxi connections between TAZs were relatively denser and, thus, the network had better overall connectivity.
Clustering coefficients include the local clustering coefficient and the average clustering coefficient. The local clustering coefficient of a node describes the likelihood that the neighbors of this node are also connected. If a node has a high local clustering coefficient value, this indicates local cohesiveness and a high tendency to form groups. For node , its local clustering coefficient is the fraction of the links that are present among the total possible links between its neighbors. There are several generalizations of clustering coefficient to weighted graphs, and the definition by [41] is a local node-level quantity. Its formula is
where is the strength of the node , are elements of the adjacency matrix, is the node degree, are the weights. The average clustering coefficient of all nodes, , can be applied to quantify the density of the entire network. The calculation formula is as follows:
Closeness centrality is tightly related to the notion of distance between nodes. It is calculated as the average of the shortest path length from the node to every other node in the network. The calculation formula is as follows:
where is the number of nodes in the network, and is the shortest path between nodes i and j. The larger the , the higher the node’s closeness centrality, and the better its connection with other nodes.
For any indicator x of the network, such as degree or strength, we use the standardized measure coefficient of variation to further investigate the discrete characteristics of network indicator distribution. The calculation formula is as follows:
where is the standard deviation and is the average value. In particular, the coefficient of variation is not affected by measurement scale and dimension.
4. Results
4.1. Basic Statistics and Spatial Distribution of Trip Data
To analyze the general distribution of trips in the different scenarios, average daily statistics of the total number of trips, trip duration, and trip distance of each taxi were calculated, as shown in Figure 4. In the figure, NRWD and RAWD represent weekdays without rainfall and weekdays with rainfall, respectively, and NRWE and RAWE represent weekends without rainfall and weekends with rainfall, respectively. These abbreviations have the same meaning in the diagram below.
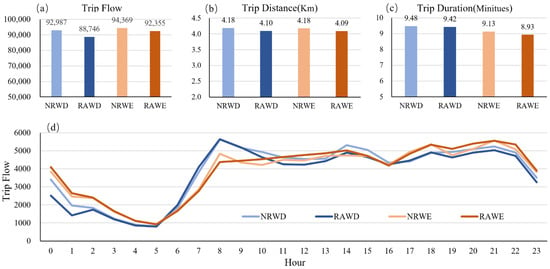
Figure 4.
Average daily statistics of taxi trip in the four scenarios. (a) Trip flow; (b) Trip distance; (c) Trip duration; (d) Hourly trip flow.
Overall, the average number of trips at weekends was slightly higher than on weekdays. As expected, in terms of weekdays, the number of trips on days with rainfall was obviously lower than on days without rainfall. This is likely to be because people canceled nonessential travel. By the same token, at weekends, there were also more taxi trips on days without rainfall than on days with rainfall. From Figure 4b, we can see that trip distance did not differ significantly between weekdays and weekends and was slightly higher on days without rainfall than on days with rainfall. Figure 4c shows that the trip duration at weekends was slightly reduced compared to weekdays.
The demand for taxis changes in time and space according to the travel needs of citizens. Figure 4d shows the hourly changes for the four scenarios; the x-axis indicates the time horizon of 24 h and the y-axis is the number of trips. On weekdays, three peaks can be observed: (1) a morning peak starting around 8 a.m., (2) an afternoon peak around 2 p.m., and (3) an evening peak starting around 8 p.m. During the first peak period, the trip flows were not affected by the rainfall. At the second and third peak hours, the taxi flow on days without rainfall was significantly higher than it was on days with rainfall. At weekends, the maximum trip flow occurred in the evening peak hours, in contrast to the maximum trip flow on weekdays which was during the morning peak hour.
To gain a better understanding of the patterns of taxi services, we further investigated the proportions according to different trip distances and durations, as shown in Figure 5. In general, the difference in the proportion of different distances and durations was not obvious. In Figure 5a, we can see that almost all trips were within 15 km and that 85 per cent of trips were within 7 km. Figure 5b shows that almost all trips took less than 35 min, with more than 85 percent taking less than 15 min.
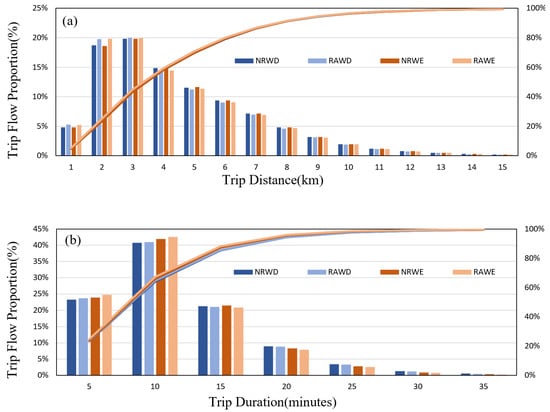
Figure 5.
(a) The proportional distribution of trip distance in the four scenarios; (b) The proportional distribution of duration in the four scenarios.
When comparing trip flow by distance on weekdays and weekends, the proportion for days with rainfall was higher than for days without rainfall when the distance was less than 3 km, and the result was reversed once the distance exceeded 3 km. Compared to the trip duration in Figure 5a, the average weekend duration was shorter than it was on weekdays, and the proportion that took less than ten minutes was greater on weekends. This may be related to the fact that travel needs on the weekends are mainly leisure and close to home.
To investigate the spatial patterns of taxi passengers in the four scenarios, we interpolated the daily average pick-up location in each scenario using the kernel density estimation method. Kernel density estimation can intuitively reflect the spatial distribution of taxi passengers in the different scenarios, and can also represent the changes by comparison of the density results.
As shown in Figure 6, we identified several identical hot spots, which represent the locations with high passenger flow in the four scenarios. The highest are located near Zhuhai Railway Station and Gongbei Port. On days with rainfall, the passenger density decreased, and some hot spot areas were not obvious. Hot spots such as Mingzhu Railway Station, Mingyang Plaza, and Huafa Plaza were not affected by rainfall on weekdays or weekends. Fuhuali Plaza was a significant hotspot on weekends without rainfall, but the hotspot disappeared on weekends with rainfall.
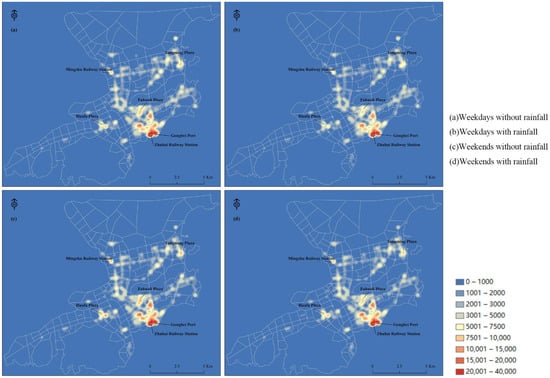
Figure 6.
Spatiotemporal comparison of kernel density interpolation results.
4.2. Complex Network-Based Analytical Indicators
4.2.1. Indicator Analysis of Whole Network
The network was constructed according to the taxi trajectory data for weekdays with rainfall, weekdays without rainfall, weekends with rainfall, and weekends without rainfall, respectively. Then, the complex network indicators introduced in 2.2 were calculated, as shown in Table 2.

Table 2.
The whole network indicators in four scenarios.
Compared to days without rainfall, the number of connections between TAZs (i.e., the number of network edges) decreased significantly during the corresponding period of days with rainfall, both on weekdays and at weekends. Additionally, the negative impact of rain at weekends was stronger than that on weekdays. On days without rainfall, the number of network edges (L) increased from weekdays to weekends, following the same trend as the average daily trip flow. However, there were fewer connections between TAZs on weekends with rainfall than on weekdays with rainfall compared to the average daily trip flow.
The change in the number of network edges affects the average degree of nodes <K>. <K> decreased as network edges decreased on days with rainfall. Overall, rainfall reduced the external contact of TAZs by 11.5% on weekdays and 15.4% on weekends. Similarly, the network connectivity (δ) of the network showed an obvious decline on days with rainfall. However, there was no significant change between weekdays and weekends. Finally, analysis of the average cluster coefficient C showed that it decreased on days with rainfall. The decrease in network edges due to rainfall reduced the connection density and the number of closed triplets between TAZs, thereby weakening the cluster connection between TAZs.
In terms of network strength, the node strength <S> and edge strength <W> of weekdays with and without rainfall, were lower than they were at weekends. As expected, days with rainfall had lower node strength than days without rainfall. Conversely, edge strength was intense on days with rainfall. That is, as the number of edges decreased on days with rainfall, the average edge strength was higher than it was on days without rainfall.
In terms of flow distribution, the coefficients of variation of node strength CV(S) on days with rainfall were higher than on days without rainfall both on weekdays and at weekends. When we compared this value for weekdays and weekends, the CV(S) did not change on weekdays with rainfall, whereas the value increased from weekdays to weekends on days with no rain. This means that the distribution of node strength on days with rainfall was more homogeneous compared to weekdays and weekends without rainfall. The same coefficient of variation of edge strength CV(W) on weekdays indicated that rainfall on weekdays had no effect on the heterogeneity of edge strength distribution, but rainfall on weekends had a significant effect on edge strength distribution.
In order to better compare the changes of various indicators on days with rainfall, we computed and visualized the indicators of each network node on weekdays and weekends. In terms of direct connection indicators, the spatiotemporal distribution of the difference in node degree K and local clustering coefficient Cw on the weekdays and weekends with rainfall is shown in Figure 7.
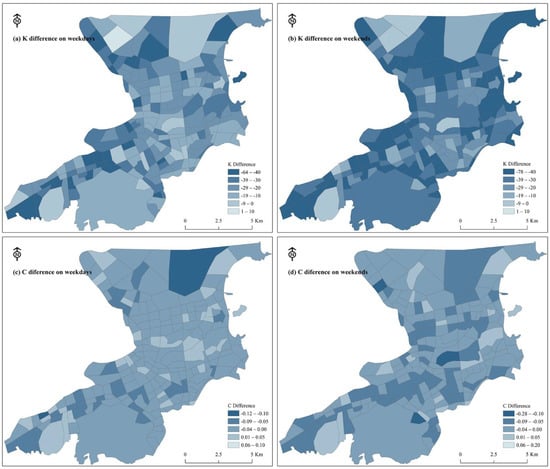
Figure 7.
Visualization of the difference between K and C.
The difference in TAZ degrees between weekdays and weekends with rainfall decreased significantly at most of the TAZ nodes, spatially in the periphery of the study area. This means that the number of travel connections between TAZs decreased because of rainfall. At weekends, the node degree decreased more than on weekdays. This means that the impact of rainfall on the number of travel connections between TAZs was minor on weekdays. The large areas of dark blue in Figure 7b indicate that TAZs in these locations reduced some unnecessary travel connections on weekends with rainfall. As shown in Figure 7, the local clustering coefficient of most TAZs did not change significantly on the weekdays. However, at weekends, the number of TAZs with lower C increased significantly, and the TAZs with weakened C showed the characteristics of a large weakening range. For the spatial distribution, although some TAZs with increased C could be found both on the weekdays and weekends, they were relatively uniform and in a mixed state.
To further investigate the connection between TAZs, the differences in node strength S and closeness centrality CC on days with and without rainfall were calculated. As shown in Figure 8, we found that regardless of whether it was a weekday or the weekend, the TAZs with the highest node strength decline were mainly concentrated in commercial areas such as Huafa, Fuhua, and Yangming Plaza. Only a few TAZ nodes with slightly poor traffic conditions increased in node strength on the days with rainfall. This means that on days with rainfall, people with strong travel needs may prefer taxis. On days with rainfall, the closeness centrality of TAZs decreased overall on weekdays and weekends, which means that rainfall weakened the indirect connectivity between TAZs.
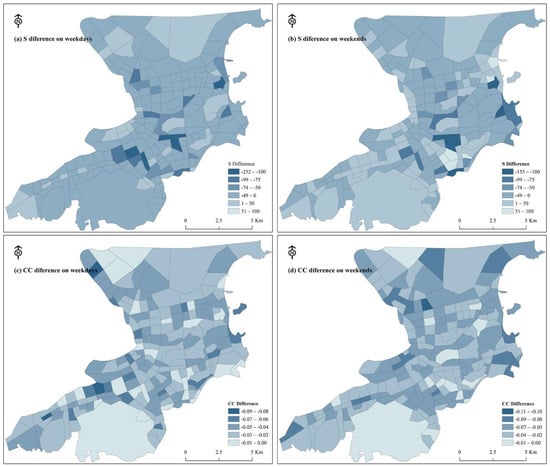
Figure 8.
Visualization of the difference between S and CC.
4.2.2. Indicators Analysis of Community Network
Using the Leiden algorithms, we detected network communities from the dataset of the four scenarios. As shown in Figure 9, four communities were detected on the weekdays and five communities were detected at the weekends, and different communities are visualized in different colors.
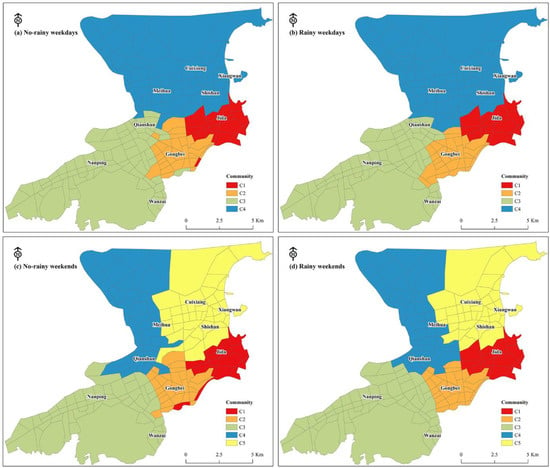
Figure 9.
The detected communities of the four datasets.
On weekdays, the spatial pattern of the four communities was very similar. The red community C1, where Jida is located, had an enclave in its southern area on days without rainfall. The blue community C2, consisting of Shishan, Xiangwan, Cuixiang, and Meihua, extended southwards on days with rainfall. On days without rainfall, there were a few enclaves between different communities, but on days with rainfall, the enclaves disappeared, and the pattern of each community was more concentrated.
Compared with weekdays with rainfall, the structures of communities change more on weekends with rainfall. The TAZ number of the yellow community clearly decreased. By absorbing a small part of the yellow community, the red community extended to the northwest and the blue community to the east. As for the weekdays, on weekends with rainfall, each community was more compact, with no enclaves.
To carry out a more detailed exploration at the community level, we calculated the network connectivity δ, the average clustering coefficient <C>, the coefficient of variation of node strength CV(S), and the coefficient of variation of edge strength CV(W) of these four community networks. The results are shown in Table 3.

Table 3.
The network indicators of communities of four scenarios.
On weekdays, with the exception of community C2, the network connectivity δ and average clustering coefficient <C> of all the communities decreased on days with rainfall, as shown in Table 2. This indicates that most communities had higher clustering characteristics on weekdays with rainfall. In addition, community C3, where Nanwan is located, exhibited the lowest clustering characteristics on weekdays both with and without rainfall. In terms of network flow, the CV(S) of node strength for all communities increased on days with rainfall, whereas the CV(W) of communities C3 and C4 differed from the overall trend. As can be seen from Figure 6, the traveler density in the C3 and C4 areas was relatively small, so the coefficient of variation of edge strength was lower on the days with rainfall.
At weekends, we found that the network structure was relatively unstable, and its connectivity was more affected by rainfall. As on weekdays, only the network connectivity δ of community C2 increased on weekends with rainfall. Additionally, it can be seen from Table 2 that the average clustering coefficient <C> of community C2 increased slightly on weekends with rainfall. This means that on the days with rainfall, the community network near Zhuhai Railway Station and Gongbei Port not only maintained high connectivity but also maintained high aggregation characteristics among the TAZs. On weekends with rainfall, the CV(S) and CV(W) tend to vary by communities. The CV(S) and CV(W) of communities C1 and C5 showed the same increasing trend on weekends with rainfall, but C4 was the opposite, with both showing decreasing trends.
5. Summary and Discussion
Urban China currently faces a low-level natural disaster in terms of rainstorms and flooding, which have a significant impact on travel. Based on taxi data in different scenarios, this study analyzed the impact of rainfall on residents’ travel using basic statistical analysis and complex network analysis, and conducted comparative analysis and detailed discussion from time and space dimensions.
This study benefits from the advantages of taxi data in terms of the large sample size, its accuracy, and its individual dimension. Acquiring the spatial–temporal characteristics of inhabitants’ travel on various days with rainfall can help us to further understand the impact of rainfall on travel in urban areas. In addition, it contributes to a deeper understanding of the interaction between residents’ daily travel and the complex geographic environment of cities and provides more detailed support for decision-making, planning, and management of urban transportation and land use systems.
However, this study also has some limitations in data and methods. For instance, it only discusses the impact of rainfall factors on residents’ travel based on taxi trajectory data, and the analysis is performed on a time scale of days. In the future, other travel data (such as smart card data and mobile signaling data) could be used for further investigation, and this could be analyzed in depth by hours (such as morning and evening peak or different hours of the day). In addition, our research defined days with rainfall as those with continuous rain for 6 h and an amount of rain greater than 25 mm. Only one month’s worth of data was used for the analysis. With the accumulation of data, it would be possible to thoroughly analyze the impact on human travel behavior at different levels of rainfall and extreme rainfall conditions. Moreover, rainfall has a certain spatial and temporal heterogeneity. This study did not analyze the travel impacts of changes in rainfall conditions within a day, such as how long the delayed impact of rainfall on travel lasted and what the conditions were for the recovery of mobility in different regions after rain. Neither did we consider what factors directly affected the recovery time for human mobility. In future work, we will use hourly rainfall data and analysis of travel characteristics to answer these questions. Finally, this study only focused on the impact of rainfall on residents’ travel, and the impact of other weather factors (such as temperature, relative humidity, and wind speed) could be considered in the future.
6. Conclusions
In this paper, we took the central area of Zhuhai as our research area, and based on taxi data, used basic statistics and complex network analysis methods to compare and analyze human mobility in four scenarios. The research conclusions are as follows:
- (1)
- Taxi GPS data are highly informative and exploitable in the field of human mobility analysis. Using the location and times at which passengers were picked up and dropped off in taxi trip GPS data, we can analyze activity levels across the city and the way people move around the city;
- (2)
- Rainfall has a reducing effect on trip flow whether on weekdays or at weekends, as well as on trip distance and trip duration, but has no significant impact on the appearance and duration of peak hours. From the spatial distribution of passengers, it is evident that rainfall has little effect on most hotspots, with the exception of a few commercial centers;
- (3)
- From the perspective of the whole mobility network, rainfall has a significant effect on the network indicators. For instance, the edges of the network and the average degree of nodes decreased significantly on days with rainfall. Node and edge strength in some commercial areas declined significantly on the days with rainfall;
- (4)
- There were more mobility communities were detected on weekends than on weekdays. The number of communities on weekdays and weekends did not change because of rainfall. For communities located in transportation hubs or port areas, the changes in network indicators were opposite to those of other communities.
Author Contributions
Conceptualization, P.G. and Y.S.; methodology, P.G.; formal analysis, P.G. and Y.S.; writing—original draft preparation, P.G. and Y.S.; writing—review and editing, Q.C., J.L. and Z.L. All authors have read and agreed to the published version of the manuscript.
Funding
This research was funded by the National Natural Science Foundation of China (Grant No. 41001022 and 41971306).
Institutional Review Board Statement
Not applicable.
Informed Consent Statement
Not applicable.
Data Availability Statement
Not applicable.
Acknowledgments
Special thanks to anonymous reviewers for their valuable comments. In addition, the authors gratefully acknowledge Jialing Wu, Ying Zhang, and Jie Liu for assisting with the data preparation.
Conflicts of Interest
The authors declare no conflict of interest. The funders had no role in the design of the study; in the collection, analyses, or interpretation of data, in the writing of the manuscript, or in the decision to publish the results.
References
- Xu, M.L.; Fu, X.; Tang, J.Y.; Liu, Z.Y. Effects of weather factors on the spatial and temporal distributions of metro passenger flows: An empirical study based on smart card data. Prog. Geogr. 2020, 39, 45–55. [Google Scholar] [CrossRef]
- Barbosa, H.; Barthelemy, M.; Ghoshal, G.; James, C.R.; Lenormand, M.; Louail, T.; Me-nezes, R.; Ramasco, J.J.; Simini, F.; Tomasini, M. Human mobility: Models and applications. Phys. Rep. 2018, 734, 1–74. [Google Scholar] [CrossRef] [Green Version]
- Lu, F.; Liu, K.; Chen, J. Research on Human Mobility in Big Data Era. J. Geo-Inf. Sci. 2014, 16, 665–671. [Google Scholar]
- Yang, X.P.; Fang, Z.X. Recent progress in studying human mobility and urban spatial structure based on mobile location big data. Prog. Geogr. 2018, 37, 880–889. [Google Scholar]
- Ding, L.F.; Fan, H.C.; Meng, L.Q. Understanding taxi driving behaviors from movement data. AGILE 2015, 2015, 219–234. [Google Scholar]
- Yuan, Y.H.; Raubal, M.; Liu, Y. Correlating mobile phone usage and travel behavior—A case study of Harbin, China. Comput. Environ. Urban Syst. 2012, 36, 118–130. [Google Scholar] [CrossRef]
- Kang, C.G.; Liu, X.; Xu, X.Y.; Kun, Q. Impact of Weather Condition on Intra-Urban Travel Behavior: Evidence from Taxi Trajectory Data. J. Geo-Inf. Sci. 2019, 21, 118–127. [Google Scholar]
- Zhan, G.; Wilson, N.H.W.; Rahbee, A. Impact of weather on transit ridership in Chicago, Illinois. Transp. Res. Rec. J. Transp. Res. Board. 2007, 2034, 3–10. [Google Scholar]
- Koetse, M.J.; Rietveld, P. The impact of climate change and weather on transport: An overview of empirical findings. Transp. Res. Part D Transp. Environ. 2009, 14, 205–221. [Google Scholar] [CrossRef]
- Mesbah, M.; Luy, M.; Currie, G. Investigating the lagged effect of weather parameters on travel time reliability. WIT Trans. Ecol. Environ. 2014, 191, 795–801. [Google Scholar]
- Syeed, K.; Bunker, J.M. Adverse weather effects on bus ridership. Road Transp. Res. 2015, 24, 44–57. [Google Scholar]
- Zhang, X.Q.; An, S.; Sheng, H.F. Discrete dynamic road network capacity under adverse weather. J. Harbin Inst. Technol. 2009, 41, 85–88. [Google Scholar]
- Gong, D.P.; Song, G.H.; Li, M.; Gao, Y.; Yu, L. Impact of rainfalls on travel speed on urban roads. J. Transp. Syst. Eng. Inf. Technol. 2015, 15, 218–225. [Google Scholar]
- Cools, M.; Moons, E.; Creemers, L.; Wets, G. Changes in travel behavior in response to weather conditions: Do type of weather and trip purpose matter? Transp. Res. Rec. J. Transp. Res. Board. 2010, 2157, 22–28. [Google Scholar] [CrossRef] [Green Version]
- Palma, D.A.; Rochat, D. Understanding individual travel decisions: Results from a commuters survey in Geneva. Transportation 1999, 26, 263–281. [Google Scholar] [CrossRef]
- Arana, P.; Cabezudo, S.; Peñalba, M. Influence of weather conditions on transit ridership: A statistical study using data from Smartcards. Transp. Res. Part A Policy Pract. 2014, 59, 1–12. [Google Scholar] [CrossRef]
- Keay, K.; Simmonds, I. The association of rainfall and other weather variables with road traffic volume in Melbourne, Australia. Accid. Anal. Prev. 2005, 37, 109–124. [Google Scholar] [CrossRef] [PubMed]
- Lin, L.; Ni, M.; He, Q.; Gao, J. Modeling the impacts of inclement weather on freeway traffic speed: Exploratory study with social media data. Transp. Res. Rec. J. Transp. Res. Board. 2015, 2482, 82–89. [Google Scholar] [CrossRef] [Green Version]
- Ma, F.M.; Liu, H. The Influence of Snow Weather Affects Fast Road Traffic Characteristics and It’s Countermeasures. Technol. Econ. Areas Commun. 2016, 18, 53–56. [Google Scholar]
- Theofilatos, A.; Yannis, G. A review of the effect of traffic and weather characteristics on road safety. Accid. Anal. Prev. 2014, 72, 244–256. [Google Scholar] [CrossRef]
- Ao, M.; Qu, R. Analysis of Influence of Meteorological Conditions on Road Traffic. Highw. Automot. Appl. 2011, 2, 58–62. [Google Scholar]
- Stern, E.; Zehavi, Y. Road safety and hot weather: A study in applied transport geography. Trans. Inst. Br. Geogr. 1990, 15, 102–111. [Google Scholar] [CrossRef]
- Edwards, J.B. Weather-related road accidents in England and Wales: A spatial analysis. J. Transp. Geogr. 1996, 4, 201–212. [Google Scholar] [CrossRef]
- Li, C.; Huang, Y.; Li, G.; Yi, C. Analysis of the influence of smog on the travel behavior. J. Xi’an Univ. Archit. Technol. 2015, 47, 728–733. [Google Scholar]
- Trépanier, M.; Agard, B.; Morency, J. Using smart card data to assess the impact of weather on public transport user behavior. In Proceedings of the Conference on Advanced Systems for Public Transit-CASPT12, Santiago, Chile, 23–27 July 2012; pp. 1–15. [Google Scholar]
- Tao, S.; Corcoran, J.; Rowe, F.; Hickman, M. To travel or not to travel: ‘Weather’ is the question. Modelling the effect of local weather conditions on bus ridership. Transp. Res. Part C Emer. Technol. 2018, 86, 147–167. [Google Scholar] [CrossRef]
- Singhal, A.; Kamga, C.; Yazici, A. Impact of weather on urban transit ridership. Transp. Res. Part A Policy Pract. 2014, 69, 379–391. [Google Scholar] [CrossRef]
- Stover, V.M.; Mccormack, E.D. The impact of weather on bus ridership in Pierce County, Washington. J. Public Transp. 2012, 15, 95–110. [Google Scholar] [CrossRef] [Green Version]
- Eisenberg, D. The mixed effects of precipitation on traffic crashes. Accid. Anal. Prev. 2004, 36, 637–647. [Google Scholar] [CrossRef]
- Kamga, C.N.; Yazici, M.A.; Singhal, A. Hailing in the rain: Temporal and weather-related variations in taxi ridership and taxi demand-supply equilibrium. In Proceedings of the Transportation Research Board Annual Meeting, Washington, DC, USA, 8–12 January 2013; Volume 13, p. 31. [Google Scholar]
- Su, Y.; Zhou, L.; Cui, A. Analysis of the influence of extreme weather on urban traffic. Transp. Enterp. Manag. 2016, 10, 6–9. [Google Scholar]
- Sui, T.; Corcoran, J.; Hickman, M.; Stimson, R. The influence of weather on local geographical patterns of bus usage. J. Transp. Geogr. 2016, 54, 66–80. [Google Scholar]
- Saberi, M.; Mahmassani, H.S.; Brockmann, D.; Hosseini, A. A complex network perspective for characterizing urban travel demand patterns: Graph theoretical analysis of large-scale origin–destination demand networks. Transportation 2017, 44, 1383–1402. [Google Scholar] [CrossRef]
- Zhong, C.; Arisona, S.M.; Huang, X.F.; Batty, M.; Schmitt, G. Detecting the dynamics of urban structure through spatial network analysis. Int. J. Geogr. Inf. Sci. 2014, 28, 2178–2199. [Google Scholar] [CrossRef]
- Xin, R.; Ai, T.; Ding, L.; Zhu, R.X.; Meng, L.Q. Impact of the COVID-19 pandemic on urban human mobility—A multiscale geospatial network analysis using New York bike-sharing data. Cities 2022, 126, 103677. [Google Scholar] [CrossRef] [PubMed]
- Cao, J.Z.; Li, Q.Q.; Tu, W.; Cao, Q.L.; Cao, R.; Zhong, C. Resolving urban mobility networks from individual travel graphs using massive-scale mobile phone tracking data. Cities 2021, 110, 103077. [Google Scholar] [CrossRef]
- Jia, T.; Cai, C.X.; Li, X.; Luo, X.; Zhang, Y.Y.; Yu, X.S. Dynamical community detection and spatiotemporal analysis in multilayer spatial interaction networks using trajectory data. Int. J. Geogr. Inf. Sci. 2022. [Google Scholar] [CrossRef]
- Blondel, V.D.; Krings, G.; Thomas, I. Regions and borders of mobile telephony in Belgium and in the Brussels metropolitan zone. Bruss. Stud. 2010, 42, 1–12. [Google Scholar] [CrossRef] [Green Version]
- Traag, V.A.; Waltman, L.; Van Eck, N.J. From Louvain to Leiden: Guaranteeing well-connected communities. Sci. Rep. 2019, 9, 5233. [Google Scholar] [CrossRef]
- Jacob, R.; Harikrishnan, K.P.; Misra, R.; Ambika, G. Measure for degree heterogeneity in complex networks and its application to recurrence network analysis. R. Soc. Open Sci. 2017, 4, 1–15. [Google Scholar] [CrossRef] [Green Version]
- Barrat, A.; Barthélemy, M.; Pastor-Satorras, R.; Vespignani, A. The architecture of complex weighted networks. Proc. Natl. Acad. Sci. USA 2004, 101, 3747–3752. [Google Scholar] [CrossRef] [Green Version]
Publisher’s Note: MDPI stays neutral with regard to jurisdictional claims in published maps and institutional affiliations. |
© 2022 by the authors. Licensee MDPI, Basel, Switzerland. This article is an open access article distributed under the terms and conditions of the Creative Commons Attribution (CC BY) license (https://creativecommons.org/licenses/by/4.0/).