1. Introduction
There is an ever-increasing demand for studying the mechanical damage evolution of rock slopes in seismic-active tectonic belts because the slope instability caused by earthquakes has great potential to threaten surrounding residents and industrial buildings following large earthquakes [
1,
2]. The damage of rock slope caused by earthquake shaking is primarily associated with the stiffness alteration of the near-surface material, and cumulative mechanical damage leading to failure [
3,
4].
It is, therefore, necessary to monitor on-site temporal varying mechanical properties of rock slopes during and after an earthquake; this strategy is essentially required for both landslide susceptibility assessment and the operational early-warning system [
5,
6].
As crustal rocks have a high level of heterogeneity, such monitoring remains challenging [
7] because the earthquake-induced damage, which is related to the weakening or softening of micro-cracks, can be understood at either macroscopic or mesoscopic scales when stress is applied by different shakings.
Therefore, conventional approaches based on monitoring surface deformation are not suitable to provide direct insight into the subsurface mechanical alterations of the rock slope due to the limited stress-sensitive detection associated with the varying shaking intesntity [
8].
Among the most recently developed geophysical methods [
9] which provide complementary ways to study subsurface activities of a slope, velocity change, which overcomes the limitations of geomorphic data, is one of the most important indicators to monitor the elastic behavior of the slope’s mechanical damage [
10].
In order to monitor a medium with its velocity change, one needs a reproducible source to emit elastic waves propagating in the medium at a regular time interval. This used to be exclusively achievable by expensive active source experiments (e.g., vibrators or explosions) using direct arrive waves [
11,
12]. However, it is difficult to accurately identify and analyze ballistic body-wave phases when the near subsurface of a rock slope exhibits strong heterogeneity and attenuation due to weathering. In addition, the extra stress perturbation induced by long-running active source(s) may also increase unexpected risks to the slope. Thus, traditional velocity change methods with active pulse-echo configuration become impractical in monitoring the slope damage evolution.
In the past decade, the established ambient noise correlation method (also known as ambient noise interferometry) offers an alternative way to reconstruct elastic green functions (also known as cross-correlation functions) propagating between two sensors by cross-correlating the continuous ambient noise [
13,
14]. Although it is still challenging to recover the ballistic parts at a shallow depth, it has been demonstrated that the reproducible multiple-scattered wavefields at a regular time interval could be reconstructed between sensor pairs in such a passive cross-correlation configuration. Thus, taking advantage of the sensitivity of multiple-scattering waves that have bounced repeatedly in the medium, it offers an exciting opportunity to observe
associated with the development of stiffness in a heterogeneous medium by using coda wave interferometry (CWI) [
15].
The promising method has been proved useful to solve problems at the tectonic scale in geosciences, and is applied to the study of landslides for both imaging and monitoring purposes [
16,
17,
18]. With the usage of high-frequency ambient noise, more recent studies enhanced the knowledge of the effect of seasonal fluctuations [
19], groundwater infiltration [
18], slow reconsolidation [
20], and fluidization [
21] on the slopes composed of clayey and/or volcanic deposits. Furthermore, some studies reported that a precursory velocity drop can be detected from several days to minutes prior to the failure of the landslide [
21,
22].
In contrast to the aforementioned slow evolution at a relative long-term timescale, earthquake-induced , which is comprised of transient co-seismic change and a subsequent post-seismic process, shows a more rapid and complex mechanical behavior.
Instantaneous
drop after large earthquakes followed by a slow recovery back to the pre-earthquake state was first observed around several active fault zone areas [
17]. Similar
behavior was occasionally reported in earthquake-induced slope instability studies. Bontemps et al. conducted a 3 y systematic investigation of
at a 1 d temporal resolution using a frequency band of 3–8 Hz on a clay/silt compound slide landslide at Maca, Peru [
23]. Despite 165 moderate earthquakes that (M 3.1 to 5.5) occurred over the study period within a ∼50 km radius distance of the slope, only two earthquake-induced co-seismic
drops with an amplitude of ∼2% and subsequent post-seismic recovery processes over a few months were observed where the earthquakes occurred at a distance less than 10 kM. More recently, [
24] conducted a similar observation with an improved technique on a typical rock slope in Southwest China. They tracked a ∼1% co-seismic
drop at a 1 h temporal resolution followed by a 14-day post-seismic logarithm recovery process caused by the M 5.7 earthquake at a distance of 200 km during the dry season. As a comparison, they also observed a weaker co-seismic
drop accompanied by a partial recovery process caused by the M 5.3 earthquake at an equivalent distance during the monsoon season.
Since only a few observations with limited slope typology documented ambiguous changes caused by moderate earthquakes, it still remains challenging to investigate the relationship between the behavior and the seismic shaking on the slope and its control factor for landslide susceptibility analysis; in particular, observing slopes’ during and after a large earthquake at a long distance and investigating the mechanism remains undocumented to date.
Here, we present new ambient noise data from the Pubugou rock slope in Southwest China. We focus on the co-seismic and post-seismic
changes on the slope due to the 2021 M 7.4 Maduo earthquake at a distance of 780 km. The remainder of the manuscript is organized as follows: In
Section 2, we present the context of the Pubgou rock slope, the data collection during the earthquake, and the processing methods. The major results are provided in
Section 3. In
Section 4, we discuss two possible mechanics induced by the earthquake and the implications for the future application. The conclusions are given in
Section 5.
2. Context and Methods
2.1. Study Site
Pubugou rock slope is situated in the middle of the Dadu River valley which is well characterized by the deep-seated bare bedrock alpine valley between the Sichuan Basin and the Tibetan Plateau [
24]. The mountainous region surrounded by densely distributed faults shows the active tectonic deformation as well as the intense and sustained seismicity.
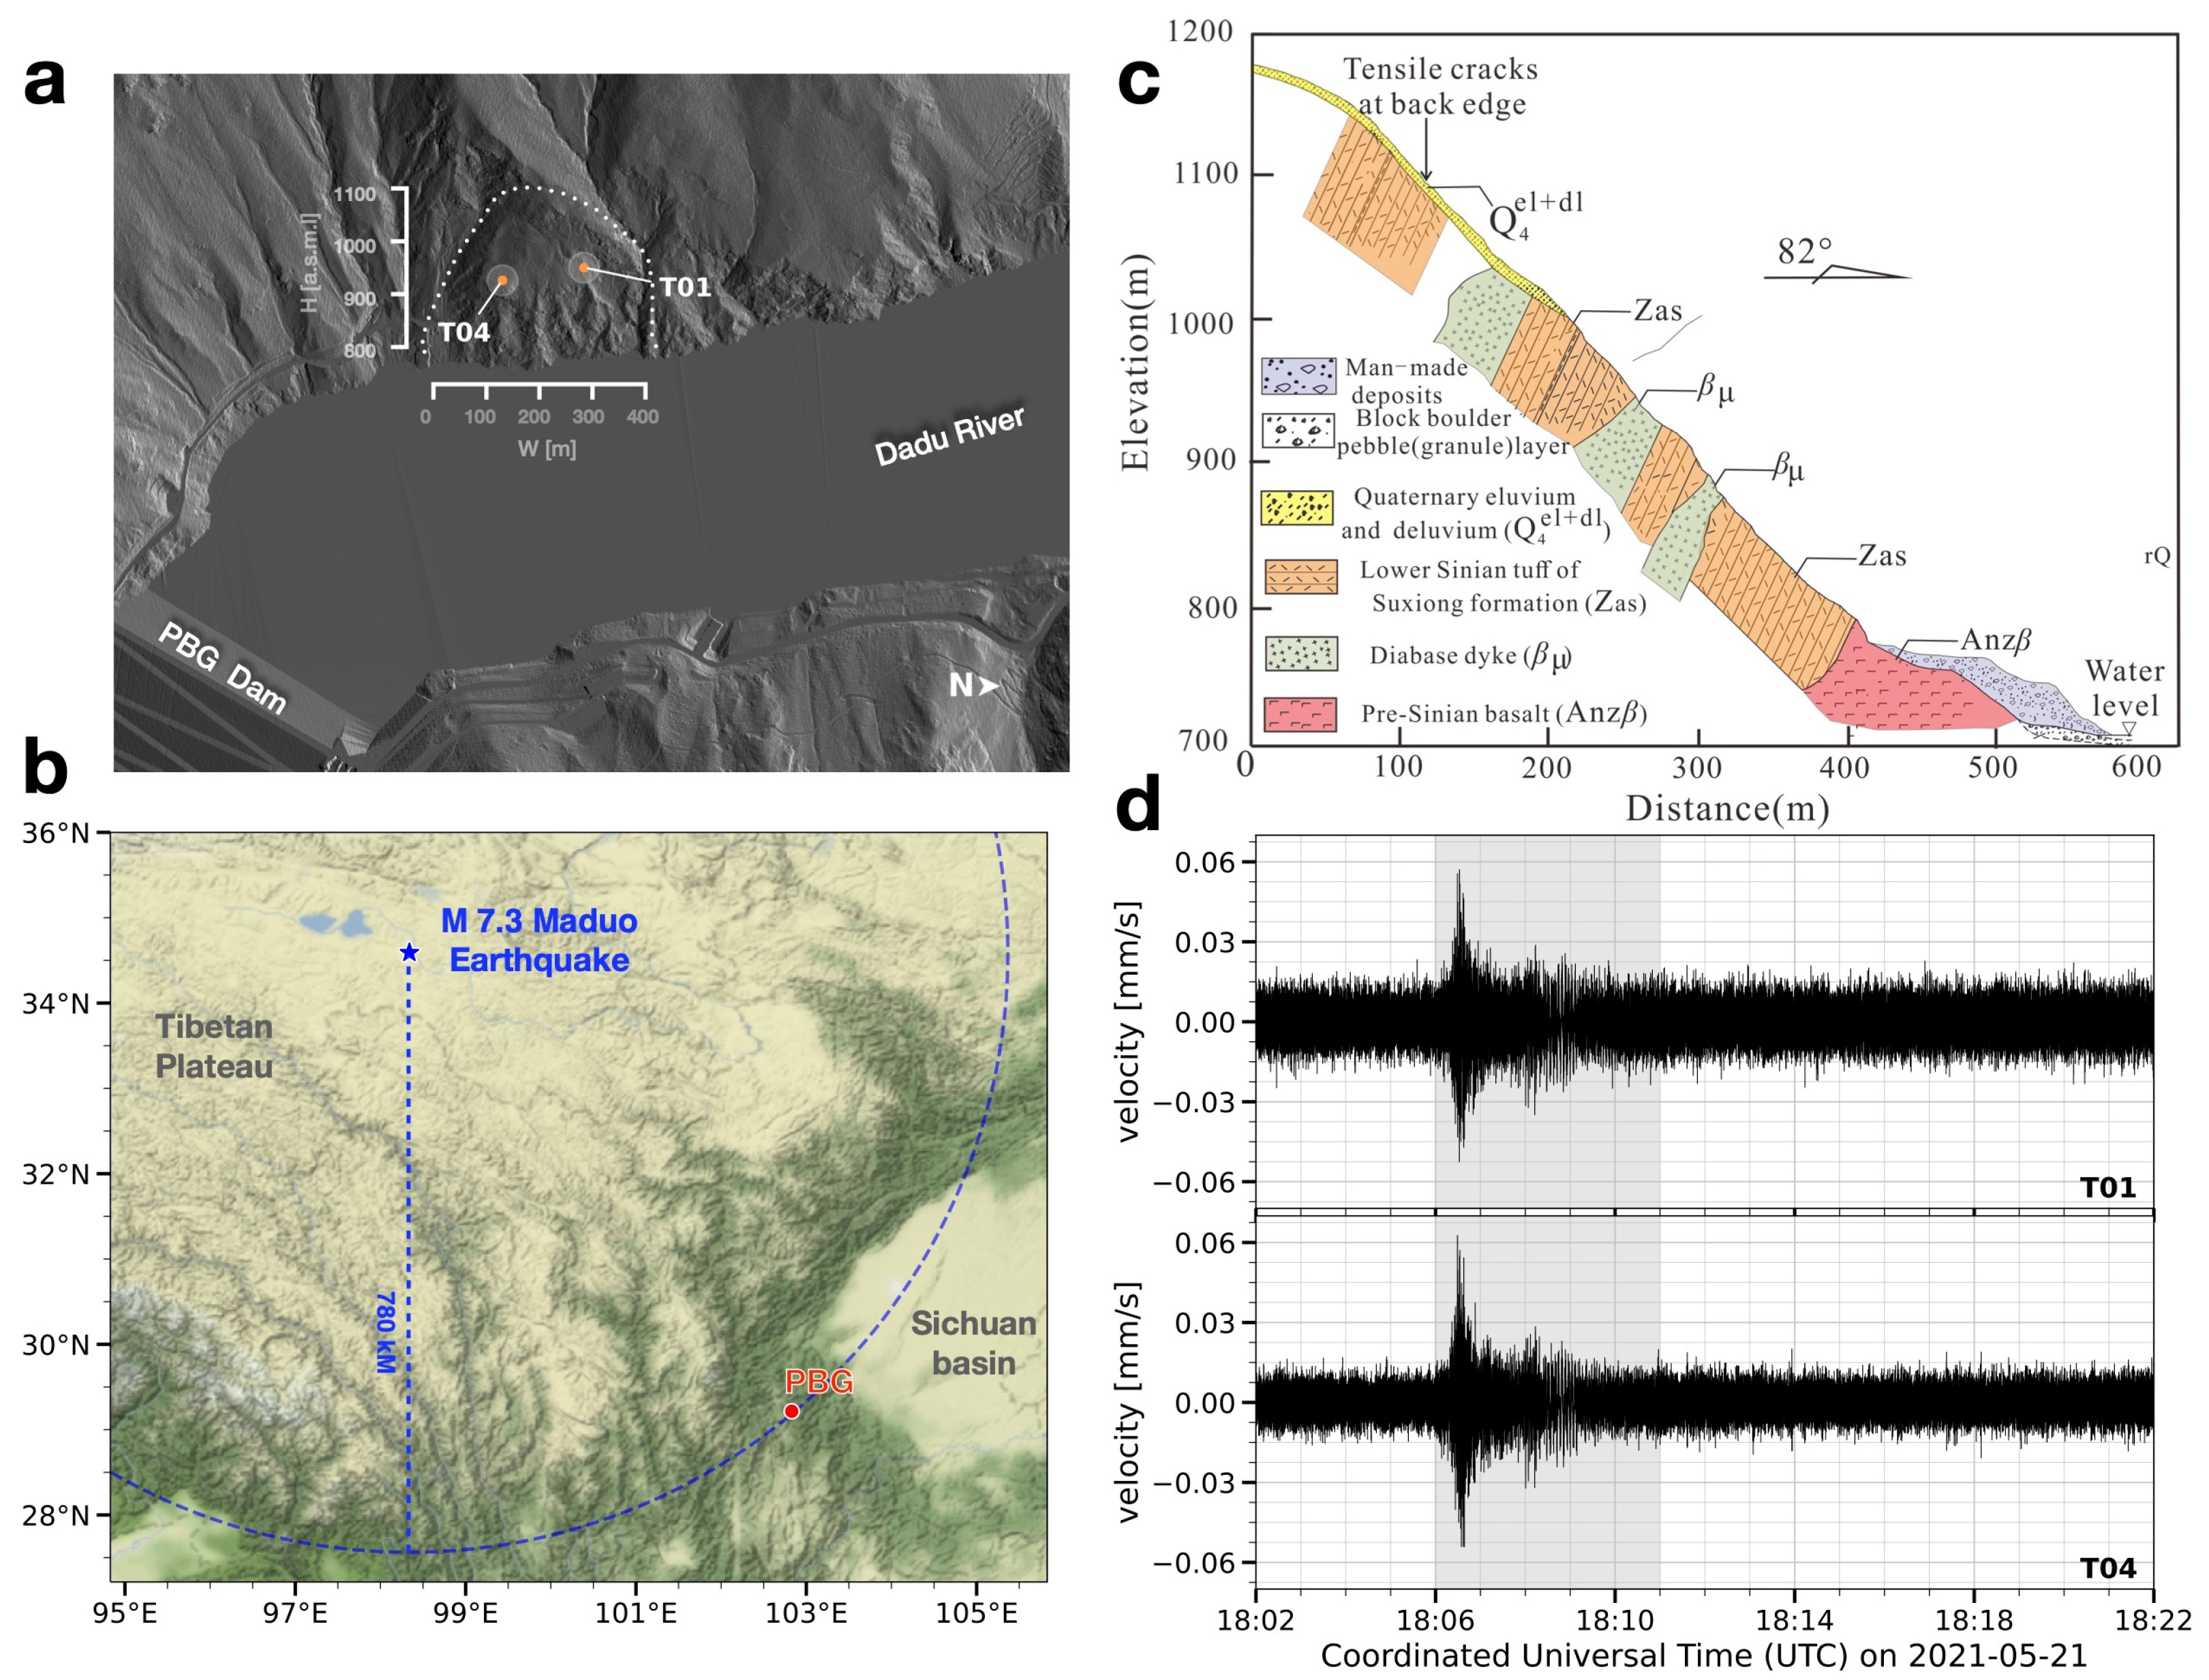
Figure 1a shows that the sub-aerial volumetric dimension of the east-facing rock slope is approximately 120,000 cubic meters with an average slope gradient of 45 degrees. The boundary of the slope is delineated by a dashed line. Two stations are indicated by orange points on the slope. The annual displacement rate of the slow-moving slope is approximate 3 mm/yr.
As illustrated in
Figure 1b, the rock slope is composed of the volcanic tuffaceous rocks with depth-varying weathering degrees, except for the gravel with partial clay (
) at a very shallow layer (<4 m). The intact volcanic rocks exist at a depth of ∼70 m of the slope without a well-defined rupture surface.
2.2. Instruments
We construct two stations (T01, T04) which are sheltered in small concrete huts on both sides of the slope. The inter-station distance is ∼157 m. Each station installs a 2 Hz three-component geophone sensor (ZF-2) with a sensitivity of 198 V/m/s. The two identical geophones are coupled firmly to the slope using cement and connected to the 24-bit data acquisition system (EDAS-24GN) for digitization at a sampling frequency of 100 Hz. The timing accuracy of the system is ∼50 ns by using an enhanced GNSS-based clock synchronization mechanism. The sampled ambient noise data are stored locally in 1 h long records and simultaneously transmitted to the cloud computing server via a mobile network.
We also install two bi-frequency global positioning system (GNSS) receptors on the roofs of both stations to measure the surface displacement along each side of the slope, respectively. In addition, an automatic weather station (AWS) on the east bank of the rock slope is operated to collect meteorological data.
Thus, an in situ monitoring campaign with a network of two seismic stations, two GPS stations, and one automatic weather station has been carried out since 2019.
2.3. Earthquake
On 21 May 2022, an M 7.4 earthquake with a focal depth of 17 km struck Maduo County, Guoluo Prefecture, Qinghai Province. We, hereafter, refer to it as the Maduo earthquake. The Maduo earthquake was a strong earthquake that occurred due to the combined effects of the northward movement of the Indian plate and uplift of the Tibetan Plateau [
25]. As illustrated in
Figure 1c, the hypocenter of the earthquake (indicated by the blue star) was 780 km away from the slope (red point). Despite the distance from the epicenter of the earthquake to the rock slope being approximately 780 km, they were both located in the boundaries of the Bayan Har block, which belongs to the northern and western margin of the Tibetan Plateau.
Figure 1d shows the waveforms of the vertical ground motions for the earthquake recorded at T01 and T04, respectively. We observe a weak earthquake-induced peak ground velocity with an average value of ∼
m/s on the slope.
2.4. Methods
Relative velocity change (
) is generally measured in two steps: (1) performing the cross-correlation computation between T01 and T04 to reconstruct the cross-correlation functions (
), and (2) computing the
by dephasing the
using the stretching technique [
26].
We note that the records are studied in the 2–20 Hz frequency range, which properly enables the wave penetration depths. We, hereafter, refer to the 2–20 Hz as the study frequency band unless a different frequency domain is noted elsewhere.
In the first step, before computing , the continuous records are normalized in the frequency domain between 2 and 20 Hz using the spectrum whitening method and then normalized in the time domain using the clipping method, with amplitudes exceeding three standard deviations.
The above pre-processing steps aim to enhance the spectrum amplitudes at the specific frequency band and balance the strong energy from different noise sources. We note that spectrum whitening is performed before clipping to preserve the phase information, because clipping induces non-physical non-linearity that would further be amplified by spectrum whitening.
The is further reconstructed by computing cross-correlations using the pre-processed 20 min long records where i is the temporal interval counter every 20 min. We evaluate the lag time t of the up to 14 s. We further average the causal and anti-causal parts of the .
In addition, to improve the CCFs stability, we applied a two-dimensional Wiener filter to enhance the SNR of the CCFs with a minimum filter order of 2 for both vertical (date axis) and horizontal (
waveform time axis) dimensions (2 × 2) [
27].
In the second step, we assume a homogeneous change in the velocity field, ; therefore, scales are linear with the lag time perturbation of the , resulting in a significant stretching or compression (phase shift) in the coda of the . It is worth noting that since are extracted from the pair-wise seismometers at a shallow depth, the propagation of wave packets with large amplitudes in the are considered to be Rayleigh waves. With an increased propagation time, the scattered Rayleigh waves exist in the coda of the .
Thus, we apply a stretching method to measure
. The method consists of a series of grid search over the distortion factor
that maximizes the coherence
in the similarity matrix (
between
and the stretched reference
:
As a first-order approximation, a homogeneous scales linearly with the distorted time-shift factor by maximizing : .
We use the single reference by averaging all over the whole investigated period. To obtain the stable results with significant multiple scattering, we use (1) all nine combinations of the obtained from three-component sensors that reflect the same material change and (2) a 10 s long time window starting at s and ending at s lapse time in the coda of . Here, the start time is chosen to exclude waves close to the receiver which is not well scattered, and the end time corresponds to the time where the amplitude of the cross-correlation functions fall below the noise level.
We estimate the
as the mean value of all nine measurements and estimate its uncertainty
as the mean value of all nine theoretical measurement errors, while each one is calculated using the following formula:
where
T is the inverse of the frequency bandwidth and
is the central frequency.
3. Results
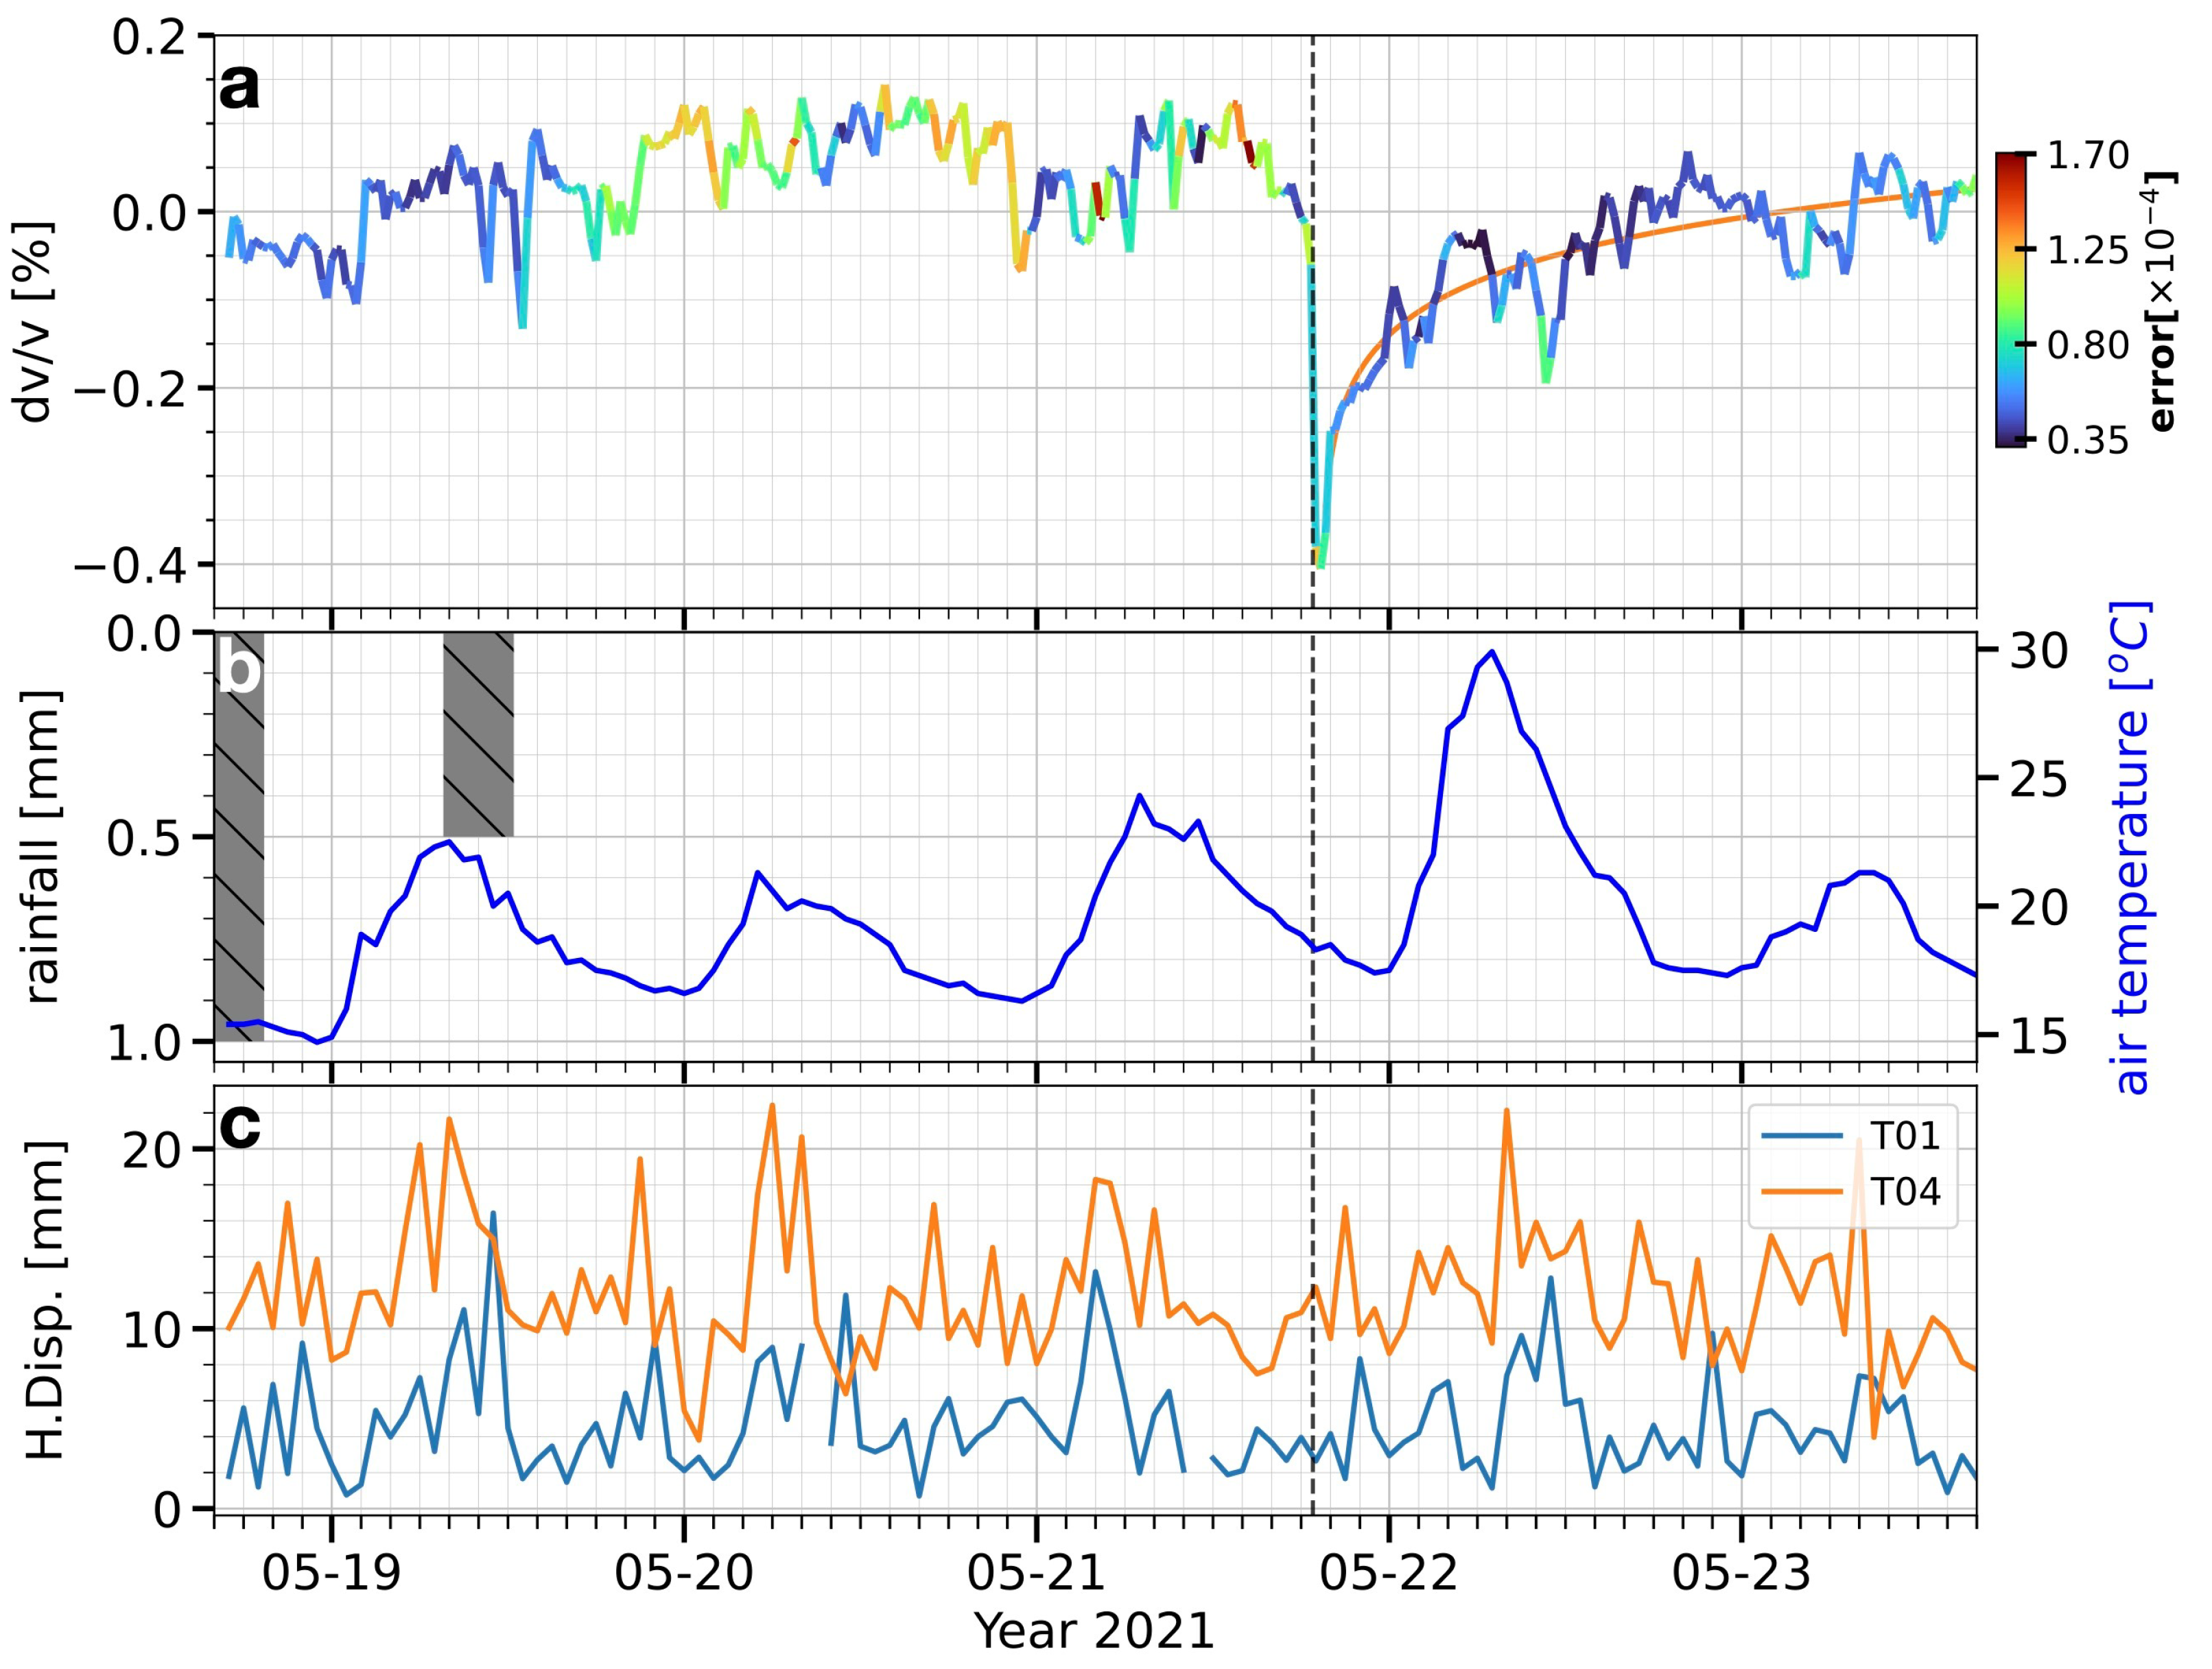
Figure 2 shows the time series of the velocity changes at 20 min temporal resolution, together with the air temperature, rainfall, and GNSS-based horizontal displacement observations at the 1 h temporal resolution, respectively. The vertical dashed line indicates the time of the 2021 M 7.4 Maduo earthquake occurrence.
We observe an instantaneous velocity decrease by −0.4% that is coincident with the M 7.6 Maduo earthquake. The starts to recover immediately after the earthquake. The subsequent recovery phase (an increase of the ) to the pre-earthquake state occurs during the following decade hours. The uncertainty is approximately , one order of magnitude smaller than the observed .
We observe a ∼±10 °C temperature change without precipitation before and after the earthquake. The air temperature induced a relative velocity change on the volcanic rocks of ∼
C [
10,
28,
29], approximately one order of magnitude smaller than the observed
; in addition, there was no rainfall-induced pore pressure change. We, thus, exclude the effect of environmental perturbations in the study due to its influence, as it is indeed small. Meanwhile, there was no reported nearby earthquake event(s) according to the earthquake catalog provided by the Sichuan Earthquake Administration. Therefore, we suggest that an instantaneous
v decrease following a logarithmic recovery process on the slope was caused by the 2021 M 7.4 Maduo earthquake at a distance of 780 kM.
The
evolution at different frequency bands allows to reveal depth-dependent co-seismic and post-seismic physical processes. We first filter
using five passbands. The central frequency
of the passbands are 4.5, 6.5, 8.5, 10.5, and 15 Hz, and the bandwidths are set as
f =
± 2.5 Hz, except for the highest
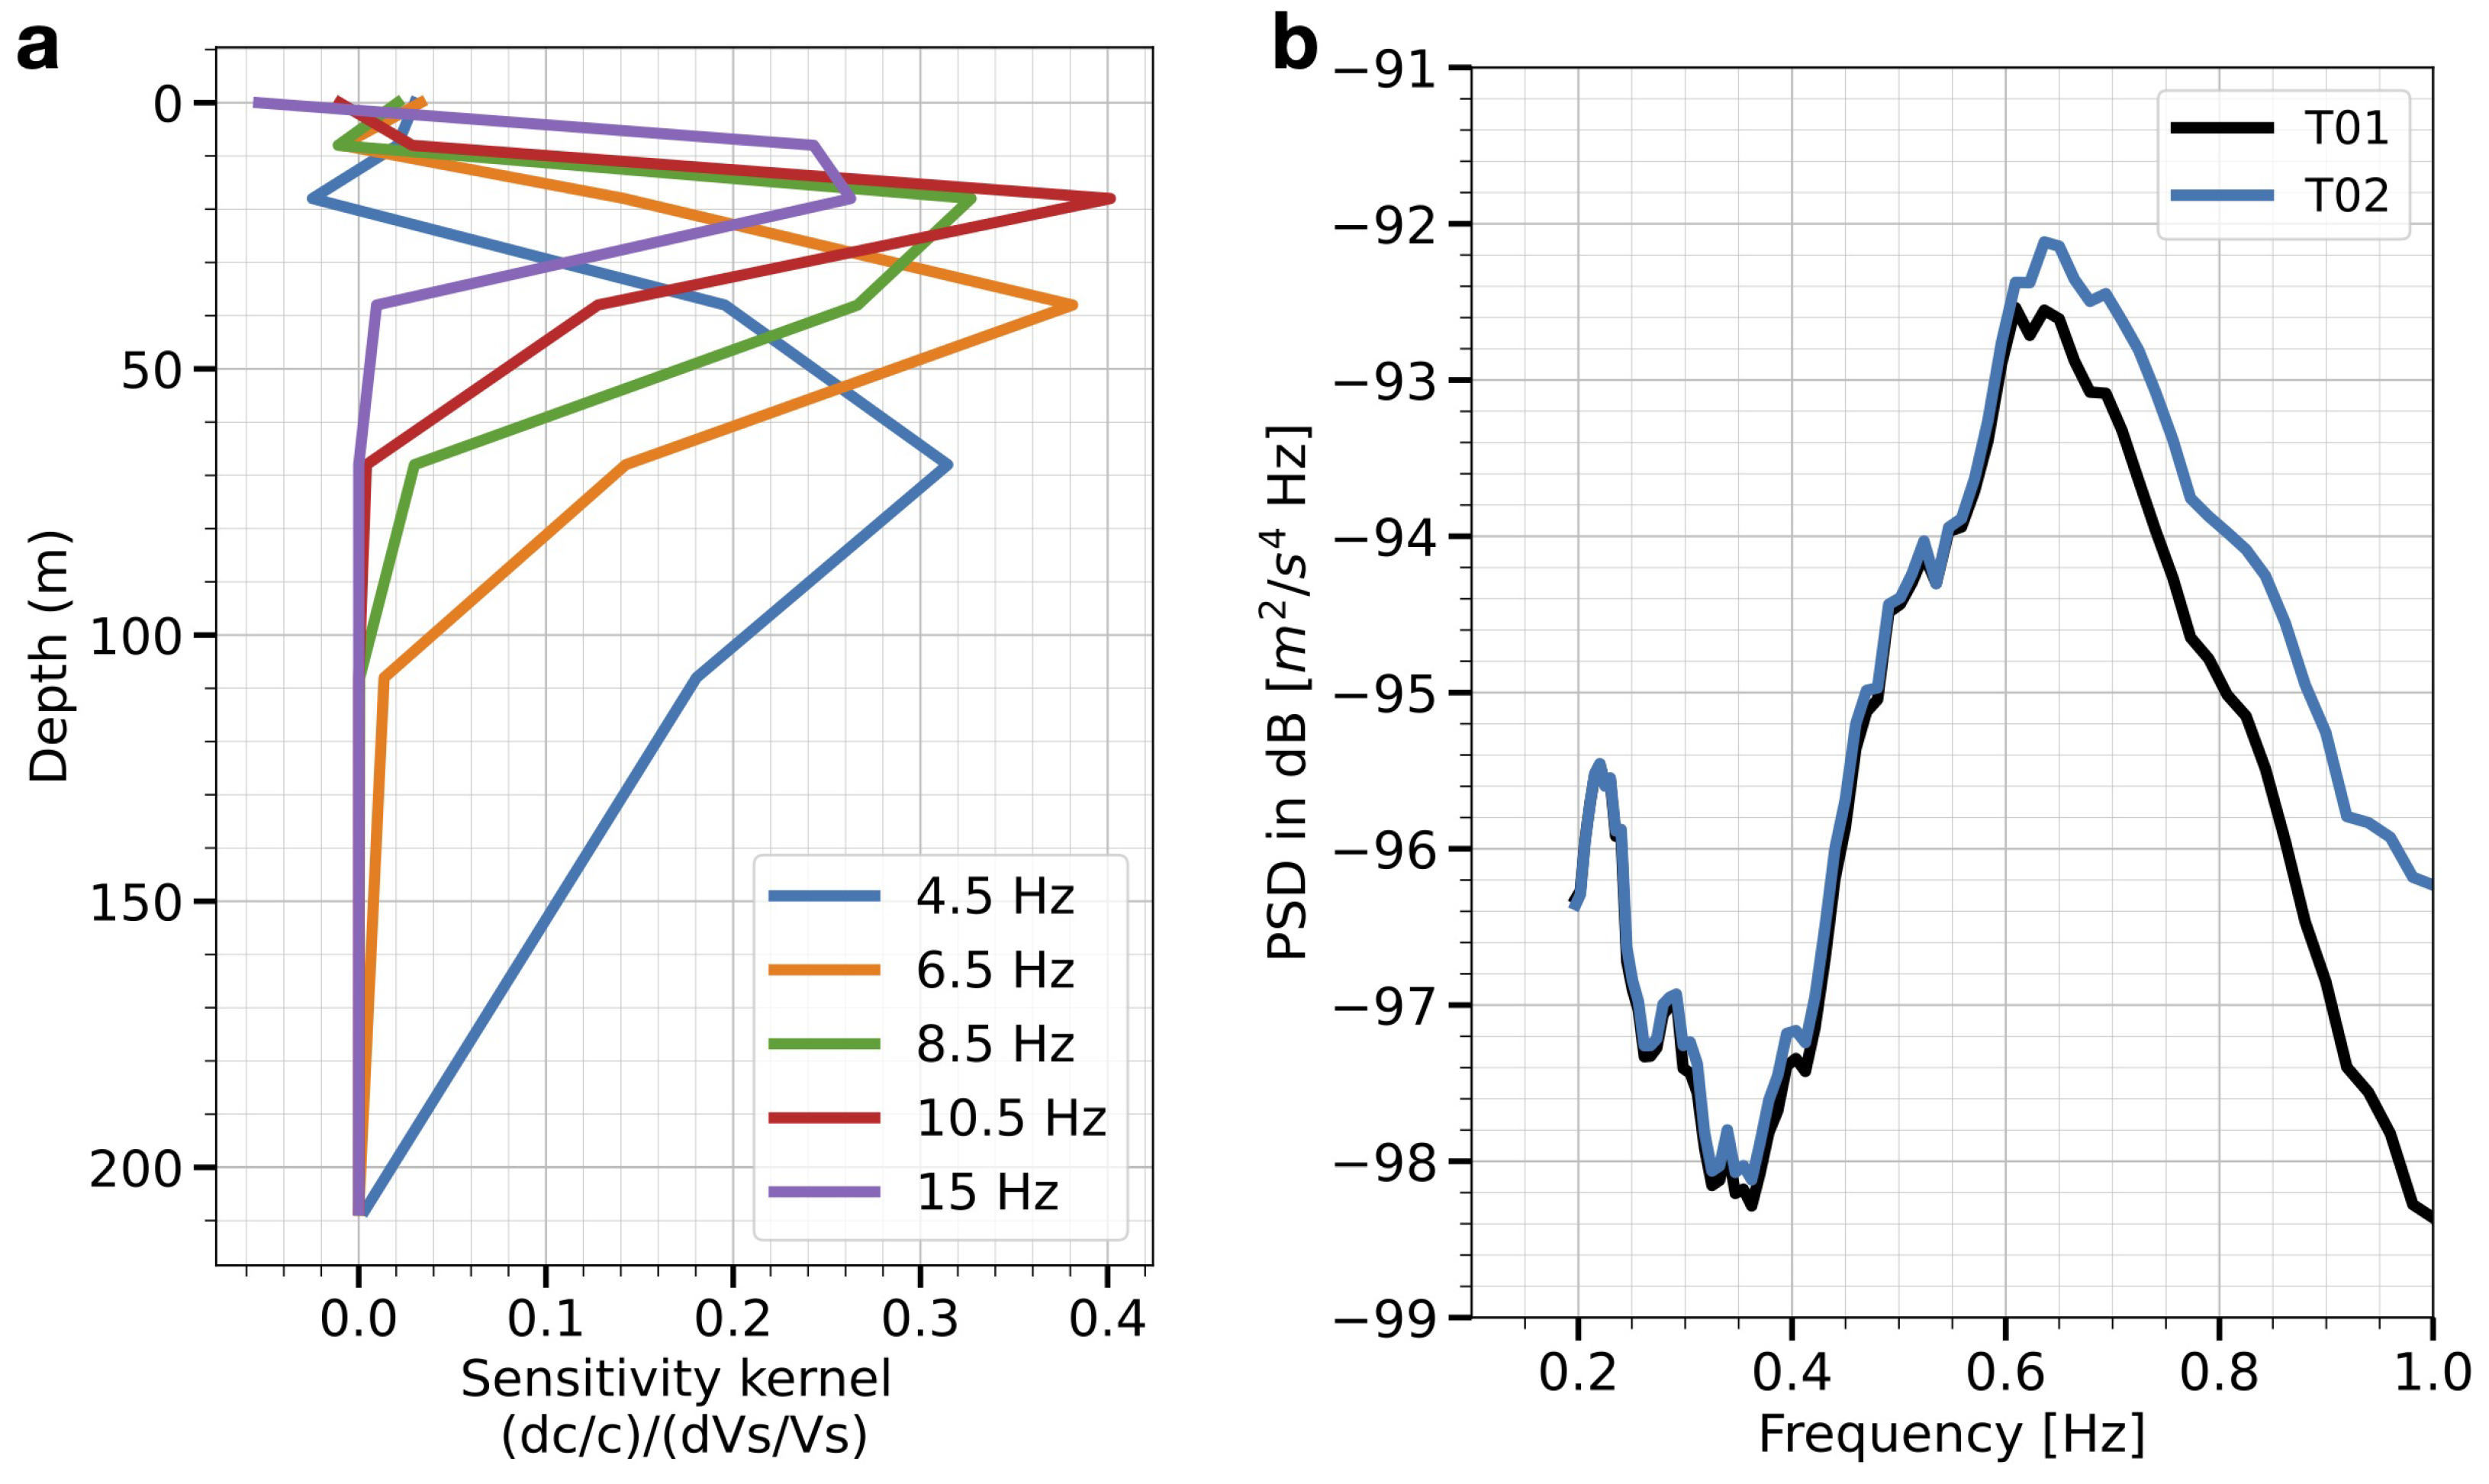
of 15 Hz with its bandwidth of ±5 Hz. We further calculate the depth-dependent sensitivity kernels of the fundamental mode Rayleigh waves in each center frequency of the passband using a simplified 1-D shear wave velocity model and the CPS330 software package [
30].
The result in
Figure 3a suggests that the center frequencies of 4.5, 6.5, 8.5, 10.5, and 15 Hz aresensitive to the depth of ∼70 m, ∼40 m, ∼25 m, ∼20 m and ∼10 m, respectively. In addition, the depth sensitivity in the study frequency band can be roughly ranged from a few meters down to approximately 200 m of the slope.
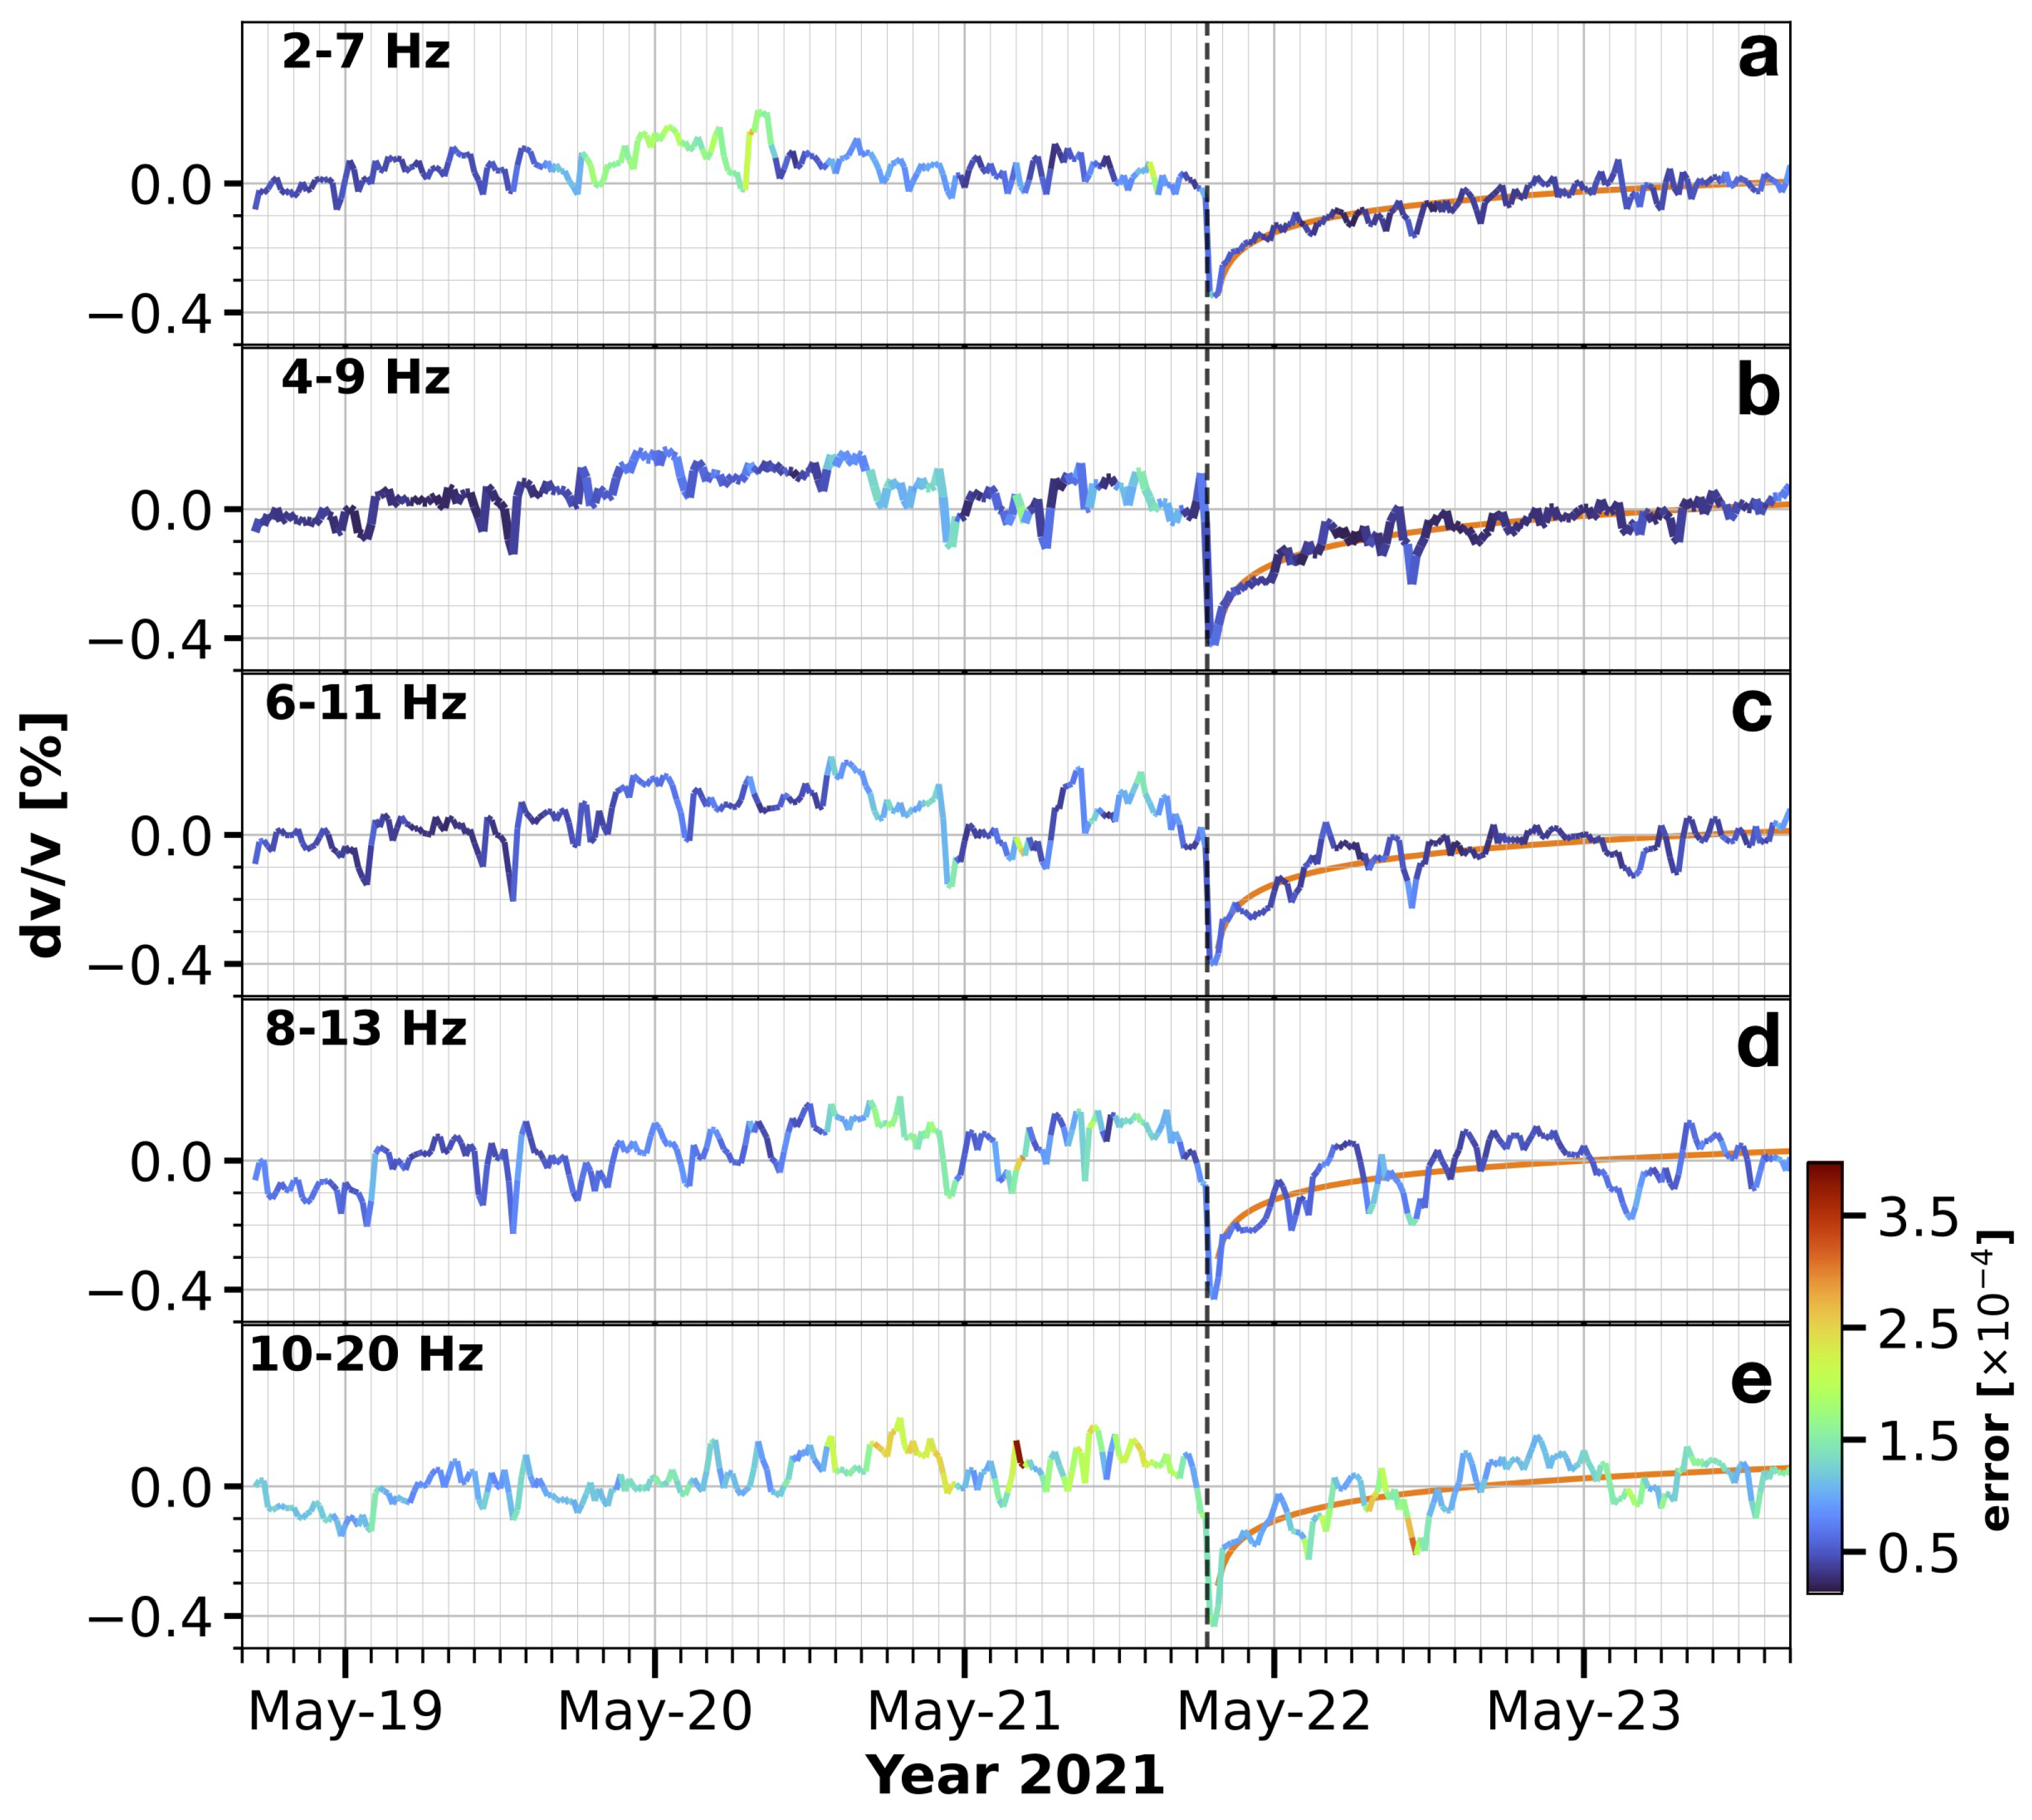
Figure 4 illustrates the measured
in each passband. The results show a similar co-seismic
decrease following a post-seismic logarithmic recovery behavior caused by the 2021 M 7.4 Maduo earthquake (marked by the vertical dashed line).
In order to compare co-seismic
decrease at different depths carefully, we measure the
drop in each passband by substracting the mean value of reference
(
) 45 h before the earthquake to the co-seismic
decrease (minimum value of
).
As a result, the overall drop is 0.41%.
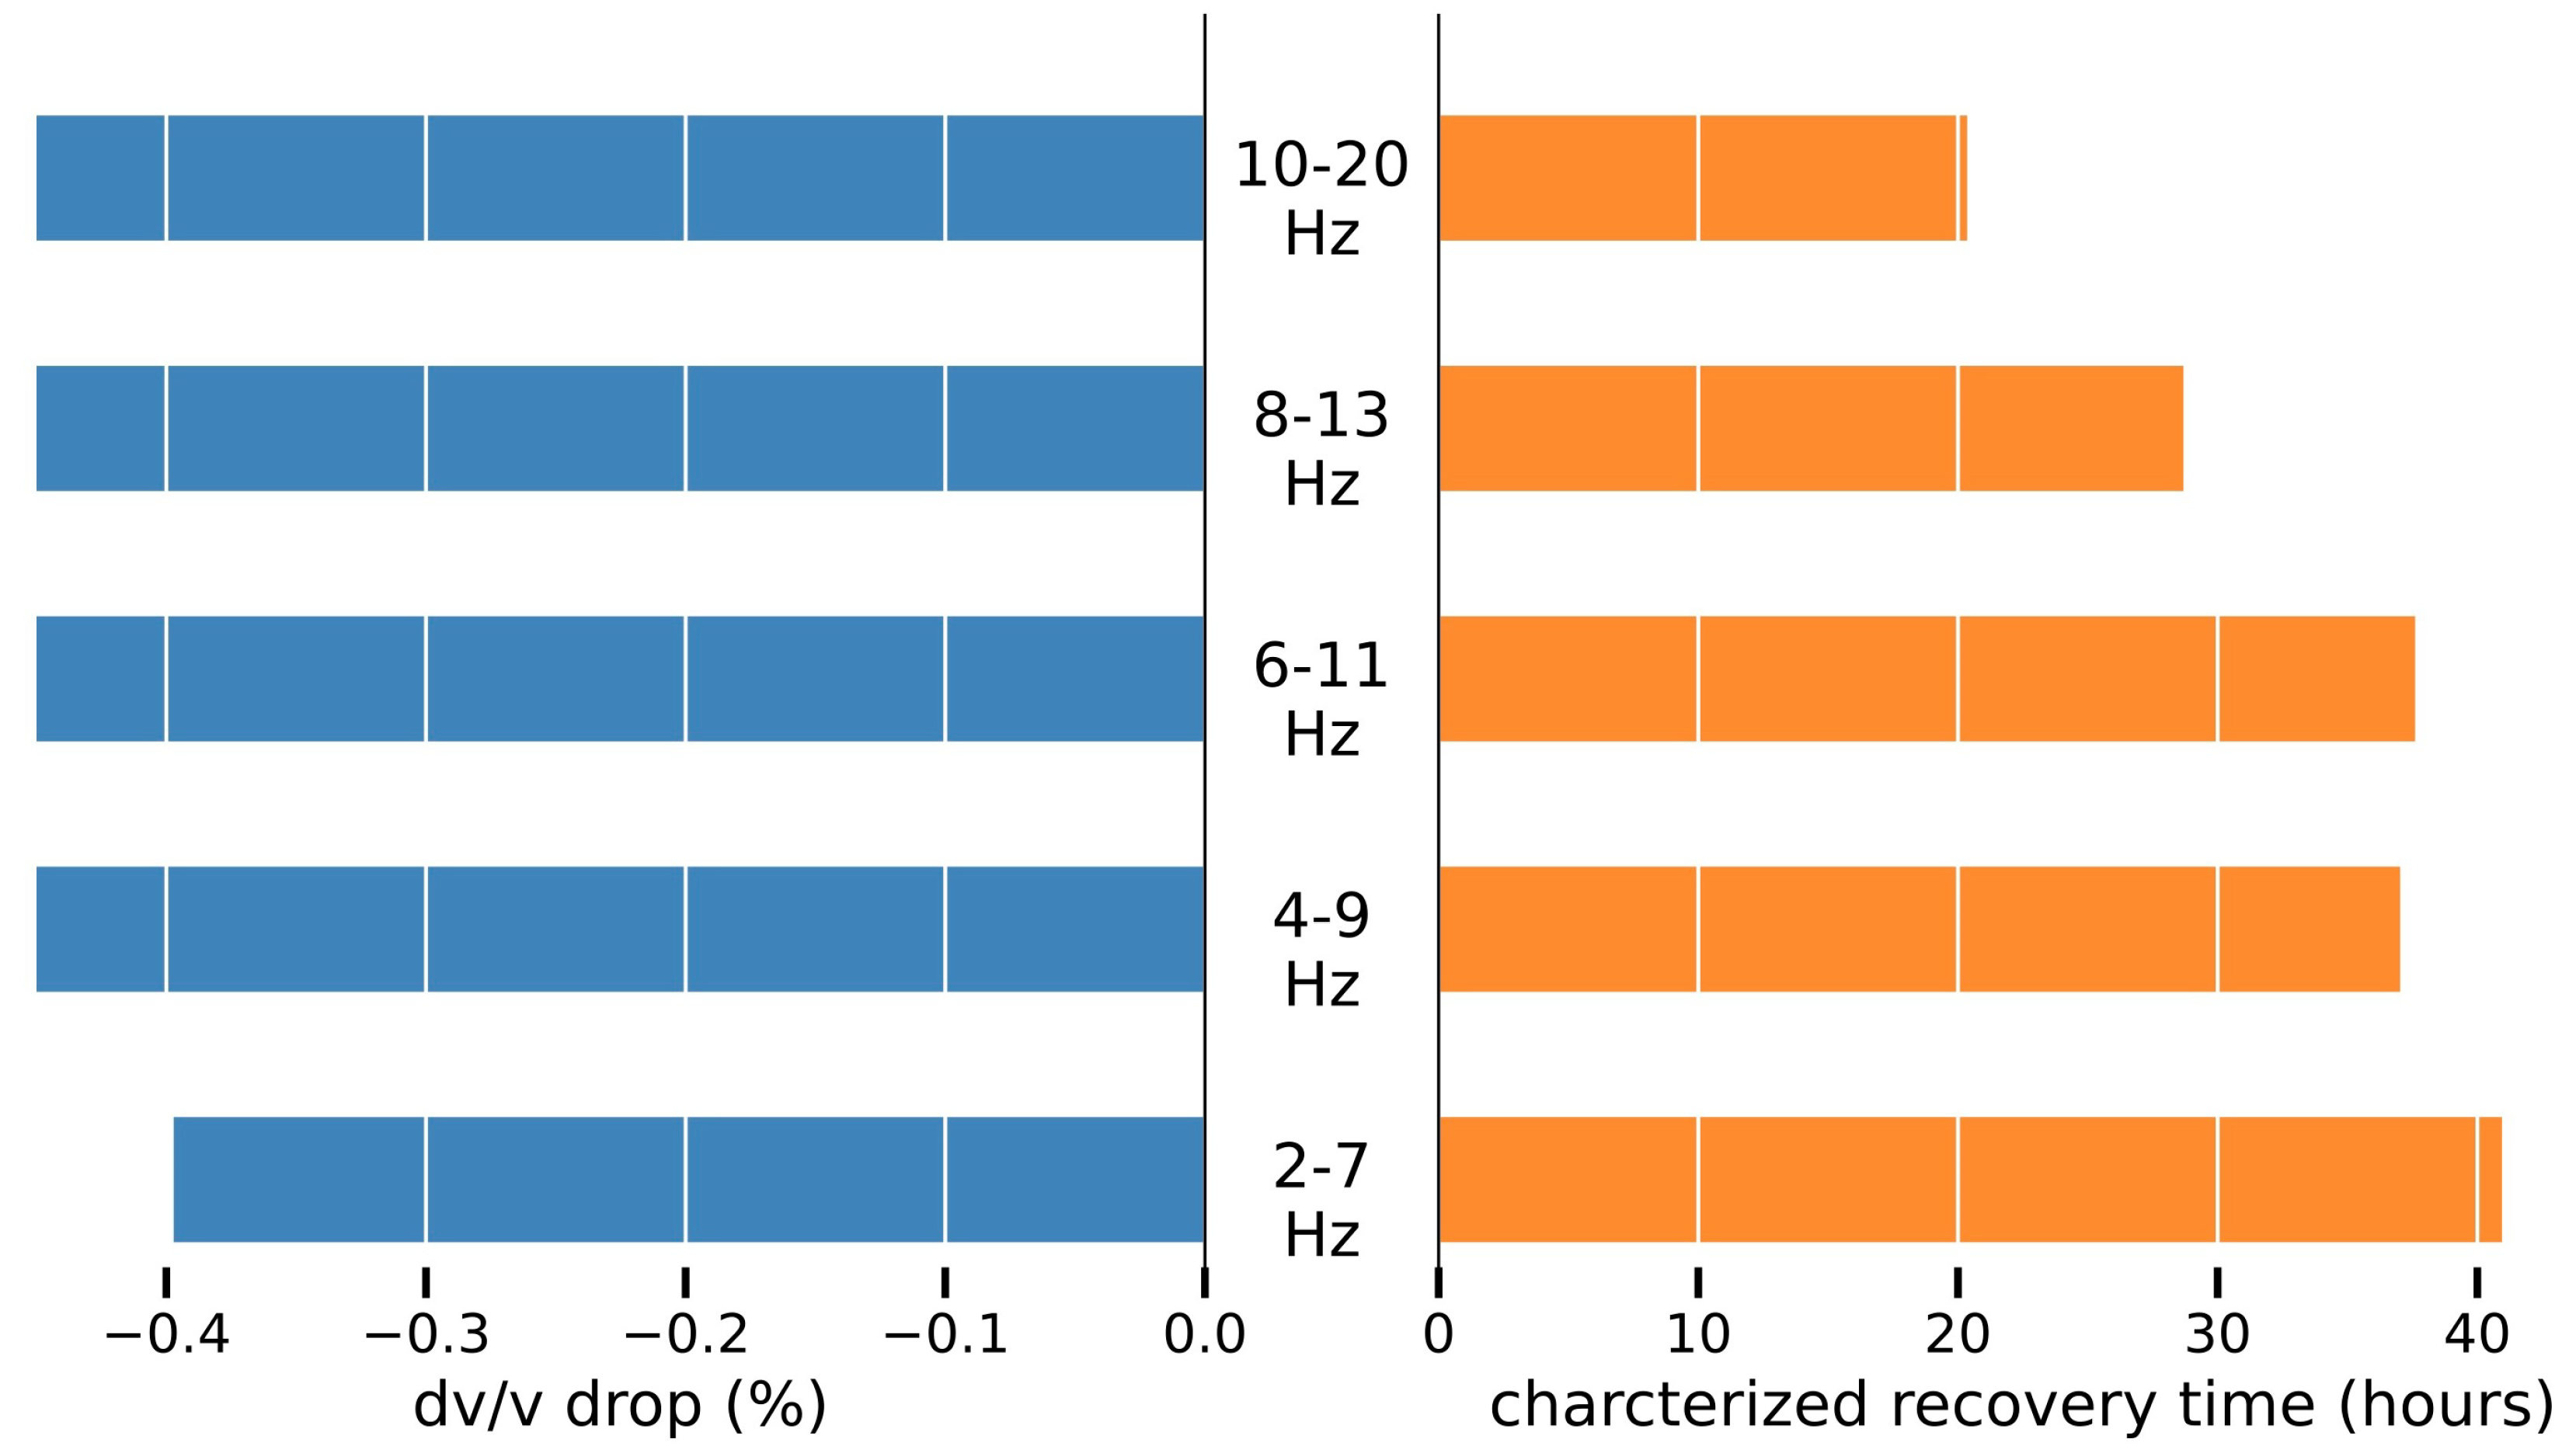
Figure 5 illustrates a roughly constant
drop of ∼0.45% in the passband from 6.5 to 15 Hz (blue bars). However, the
drop in the lowest center frequency of 4.5 Hz shows a smaller value of 0.39%. Combined with the depth analysis, we conclude that a simliar co-seismic
decrease (∼0.45%) occured at a depth above
70 m of the slope, while ∼15% smaller co-seismic
decrease occured below 70 m where the intact volcanic rocks exist.
We subsequently characterize the post-seismic recovery time at different depths by fitting the aftershock temporal evolution of
in each passband:
where
A is the extrapolated post-seismic
,
m is the slope of the logarithmic
dv/
v decay within time
t. The characterized recovery time in hours is
.
As illustrated in
Figure 2c and
Figure 4, the characterized post-seismic recovery
as a function of time is plotted on the orange line. Thus, the overall characterized recovery time in
Figure 2c is 31.39 h.
Figure 5 illustrates the characterized recovery time in the passband from 4.5 Hz to 15 Hz (orange bars). Generally, we observe that the characterized recovery time increases from 20.35 to 40.94 h, with the decrease of the central frequency from 15 to 4.5 Hz.
Compared with the drop in each passband, the characterized recovery time shows a more remarkable depth-dependent behavior due to the long-distance earthquake shaking.
We also note that the characterized recovery time at 8.5 Hz (37.02 h) is slightly shorter (1.5%) than that in 6.5 Hz (37.6 h). The depth-varying heterogeneity due to weathering of the slope at a depth between 25 and 40 m may be responsible for such abnormal characterized recovery time at different shallow depths.
4. Discussion
Previous studies [
10,
24] suggest that the damage mechanism of the slope associated with the earthquake is considered to originate mainly from earthquake-generated dynamic stress waves. Thanks to the strong co-seismic ground motion (PGV
m/s), it is able to cause reversible and/or irreversible damage of the slope at a distance range from tens to ∼200 km by observing
drop and subsequent recovery process [
23].
However, in this case, we observe that the long-distance earthquake-induced peak ground velocity on the slope is m/s, together with a non-anomalous displacement fluctuation during the period. It raises the question: why did the drop and recovery process still occur during and after the earthquake?
To improve the understanding of the damage evolution of the slope during and after the long-distant earthquake shaking, we explain the observed in situ behavior by two possible mechanisms.
The first possible explanation is the nonlinear elastic effect of the slope. Laboratory studies suggest that when a low-frequency oscillatory wave pumps into a geomaterial, stiffness loss appears instantaneously after the mechanically-induced conditioning [
31]. It is termed anomalous nonlinear fast dynamics (ANFD). After the pumping waves are removed, a logarithm healing time process associated with geomaterial’s stiffness towards its initial state takes place. This phenomenon is termed as slow dynamics (SD) [
32]. It is worth noting that the oscillatory pumping waves used in a laboratory are a series of low-amplitude vibrations with frequencies that are close to the material’s fundamental eigenmode, and the amplitude-induced strain levels are lower than
[
33].
Therefore, we first measure the frequency response on the slope excited by the long-distance earthquake. As illustrated in
Figure 1d, we use the 5 min long records of the earthquake-induced ground motions to compute a site response at the frequency domain by performing the seismic power spectral density analysis at two stations [
34]. The resulting spectra are then smoothed in a 1/32-octave average in the frequency domain. As illustrated in
Figure 3b, we observe the spectral peaks with equivalent amplitudes centered around 0.61 Hz and 0.64 Hz with respect to the stations.
Secondly, we evaluate the theoretical resonance frequency of the slope. We assume the stiffness of the slope’s tuffaceous rock is of ∼4.58 GPa and the density is approximately 2.4
. The resonance frequency of the slope can be evaluated using the following formula [
9]:
The calculated theoretical resonance frequency is approximately 0.63 Hz, which is very close to the in situ frequency response excited by the long-distance earthquake.
Thus, in analogy with the laboratory configuration, the rock slope may exhibit stiffness loss (ANFD) and recovery process (SD) because of the pumping seismic waves with regard to the characterized weak stress (strain) levels and low frequencies excited by the long-distance earthquake.
In comparison with the similar velocity drops (∼0.4%) at a center-meter scale, the recovery process on the slope spend more time (25–40 h or
s) than that in the laboratory experiments (∼0.5 h or
s) [
35].
Furthermore, assuming the nonlinear elastic mechanism dominates, we can estimate the earthquake-induced stress changes by using the quasistatic stress model rather than the dynamic one. As the Rayleigh wave velocity is close to the shear wave velocity, we use a shear wave velocity-dependent pressure model [
36] to estimate the stress change of the slope due to the earthquake:
The hydrostatic pressure (P) at the depth of 200 m is about 2.82 Pa. We estimate that a 0.4% co-seismic velocity drop at a depth of 200 m would require a quasistatic stress change of 112 kPa. As a result, the stress sensitivity is 3.5 .
The second possible mechanism is the transient pressure surge effect due to the seismic stress waves from the long-distant earthquake.
In seismology, it has been widely observed that weak seismic waves from distant earthquakes can abruptly change the states of natural geological systems and triggerearthquakes remotely in geothermal and/or volcanic environments [
37]. The stress amplitudes of the triggering passing waves are as low as the order of kilopascal. Despite severalcandidate hypotheses used to explain these phenomena, the underlying mechanism is still not well understood. Recently, a new mechanism has been discovered: when a seismic wave interacted with a fracture with fluid, the transient pressure surge by 2–3 orders of magnitude compared with the incident wave pressure [
38]; it has been verified through numerical modeling and a laboratory experiment [
38,
39]. It is worth noting that the transient pressure surge effect is a frequency-dependent phenomenon. The lower the frequency, the greater the stress change. It explains why frequency is more important than the PGV in remotely triggering natural disasters at long distances.
We notice that despite no rainfall producing fluid activities during the earthquake, water may still be stored in the micro-/macro-fractures within the slope body due to the precipitation 2–3 days before the earthquake. As a result, we speculate that the transient pressure surge effect may occur on the slope due to the low frequency earthquake. Since the PGV is approximate 6
m/s, the earthquake-produced dynamic stress
on the slope can be estimated using the following equation:
Assuming
GPa and
m/s, the
is approximately 183 Pa. Considering the amplification factor due to the pressure surge effect, the maximum dynamic pressure change on the slope may reach 183 kPa and the stress sensitivity is approximately
. It is a similar stress sensitivity compared to the one evaluated by using the first model and has been evaluated in a previous study [
24].
Finally, we discuss the implications of our observation for on-site application. The results suggest that it is possible to observe and characterize nonlinear elastic properties of the slope under weak stress change using ambient noise interferometry with high temporal resolution and high stress sensitivity. As laboratory experiments suggest that the nonlinear elastic properties are more sensitive to the damage of the geomaterial, it has the potential to quantitatively characterize the slope weakness in terms of velocity changes by monitoring the co-seismic drop and post-seismic relaxation process and further facilitate the structural health assessment of slopes on a regional scale using weak seismic shaking in a non-destructive way in future.
In addition, the emerging observation is based on the established methods by using continuous seismic data in seismology, which have been more broadly recognized as a valuable source of information about geomorphic processes.
Despite that the technique is still at an incipient stage in this field, the use of seismic data and monitoring techniques to study damage evolutions of the subsurface medium excited by earthquakes at the distance from to kilometers has opened a new window into a wide range of applications, from studying influences of geo-mechanical loadings to deploying the practical early-warning system of natural disasters.
Depending on the study site, the following instrumental, as well as the technical suggestions, may be helpful to improve the monitoring system: (1) accurate synchronization, (2) sufficient low instrumental self-noise, (3) knowledge of the available ambient noise (in space, azimuth, and frequency content) and (4) improving the time resolution.
5. Conclusions
This article demonstrates that relative velocity changes associated with the 2021 M 7.4 Maduo earthquake can be observed on the rock slope at a distance of 780 km with a 20 min resolution using ambient seismic interferometry. With the knowledge of the frequency-dependent sensitivity at depths, the significant findings are as follows:
(1) We observe an instantaneous ∼0.41% co-seismic decrease on the slope. Compared with a 0.39% decrease below 70 m, the decrease of 0.45% is larger at depth above ∼70 m of the slope;
(2) We observe a characterized ∼31.39 h logarithmic recovery process of towards its pre-earthquake state that occurred after the earthquake. The characterized recovery time increases from 20.35 to 40.94 h with the decrease in the central frequency from 15 to 4.5 Hz;
(3) We discuss possible mechanisms by modeling stress changes and evaluating the stress sensitivity of the method. A potential in situ application is also discussed to improve the understanding of subsurface geological risks under diverse seismic shaking.
The findings presented here support the idea that distant earthquakes can also affect the mechanical evolution of the rock slope. The observation underlines the importance of the slope’s reversible rigidity drop and the recovery process induced by the distant earthquake which has the potential to facilitate the damage assessment of slopes non-destructively. The analysis has considerable implications both for the short-term impact of earthquakes and for the temporal-critical landslide early-warning system. Finally, this study helps to better understand landslide forcing mechanisms under diverse seismic loadings.
