3.2.1. Post-Earthquake Traffic Flow Prediction Based on Building Characteristics
The post-earthquake traffic flow, which is used to simulate post-earthquake traffic conditions, varies significantly due to changes in post-earthquake travel demand. In this study, the post-earthquake traffic flow was predicted based on the surrounding building characteristics; it comprises two parts: (1) post-earthquake origin-destination (OD) prediction and (2) allocation of traffic flow.
- (1)
Post-Earthquake OD Prediction
Post-earthquake OD prediction is primarily used to evaluate the total vehicle production (P) and total vehicle attraction (A) in the traffic zone after an earthquake.
Floor area per capita is a critical factor considered during building design, and to a certain extent, the area of a building is directly proportional to the population within. Therefore, according to building characteristics (etc. function and area) in each traffic zone and in accordance with relevant planning standards [
32], the population data were reverse deduced in this study to achieve OD prediction.
The specific steps of this process are as follows:
Step 1: Calculate the area of the buildings with different function types in each traffic zone, .
Step 2: Calculate the resident population in the buildings with different function types in each zone,
, according to Equation (9):
where
is the floor area per capita, the value of which can be referred to in
Table 3.
Step 3: Modify the travel rate (TR) and attraction rate (AR) of the various buildings after the earthquake.
Using research conducted by the China Academy of Urban Planning and Design and the Beijing Transportation Institute [
33], the regular population travel rate and population attraction rate for different types of buildings were summarized and sorted as shown in
Table 4.
After an earthquake, the urban functional structure will be damaged to a certain extent. Therefore, the importance of different functional buildings in the city will change, as will travel demand and travel times; these factors should be reflected in the change in traffic flow. For example, the attraction rate of commercial sites providing consumption and entertainment will be considerably reduced, as will the traffic generated by going to work, school, and other activities. Conversely, storage land, hospitals, government offices, and residential buildings will see a significant increase in attraction rates. Therefore, the travel and attraction rates of different types of buildings should be modified, as shown in
Table 5.
Step 4: Calculate the total traffic production,
, and traffic attraction,
, in each zone as follows:
where
and
are the population travel rate and population attraction rate, respectively, of building type
j.
Step 5: Calculate the vehicle production,
, and vehicle attraction,
, for each zone as follows:
where
k is the proportion of vehicle travel among traffic travel modes in the region. According to the statistical data describing resident travel modes in Beijing in 2010 [
34], travel by car accounted for 80% of travel; thus,
k = 0.8. It is worth noting that the value of
k should be determined based on the post-earthquake traffic travel mode. The fact that Beijing’s traffic model was used in this study and there was a lack of earthquake data in Beijing means that the
k mentioned in this study does not consider the changes in travel modes after the earthquake.
- (2)
Allocation of Traffic Flow
The primary purpose of traffic flow allocation is to study where the traffic generated by traffic zones will flow to and where the attraction comes from so that the traffic flow between traffic zones can be assigned for each road.
In this study, traffic flow was predicted based on the gravity model [
35] which can be used to allocate traffic flow between zones according to the inverse relationship between the travel volume and the impedance of the zones (such as time and distance), as well as the proportional relationship between the AR and the TR. This study employed TransCAD (transportation planning software) to achieve this purpose.
The user-optimized equilibrium (UE) model [
36] was used to allocate traffic flow, and its mathematical optimization model is given by Equation (14):
where
rs represents the “OD pair” corresponding to any two traffic zones and
h represents the total number of roads between these two zones. Constraint 1 represents the flow conservation where the sum of the travel path flow,
fh, of any
rs must be equal to the traffic flow,
q, between zones. Constraint 2 mandates that the traffic value allocated to any lane between any two zones cannot be negative. Constraint 3 indicates that the road section flow in the output result is a statistical value expressed as the sum of all traffic flows passing through the road section.
The UE model is typically solved using the Frank–Wolf algorithm [
37]. The core of this algorithm employs linear programming to approach a nonlinear programming problem step by step. It begins at the initial point, then takes the optimal step size as the search scope and the fastest descending direction as the forward direction to determine the starting point of the next iteration. This process is repeated to gradually approach the optimal solution and obtain the traffic flow in each section.
3.2.2. Traffic Simulation Considering Road Traversability
The traffic simulation considering road traversability after an earthquake was primarily undertaken in this study to simulate the vehicle behaviors in the presence of road obstructions and to analyze the interactions between vehicles and the traffic environment. Therefore, micro-level traffic simulation technology was employed to analyze post-earthquake vehicle behaviors considering road traversability. This simulation comprises two modules: (1) setting road conditions and (2) building the simulation model.
- (1)
Setting Road Conditions
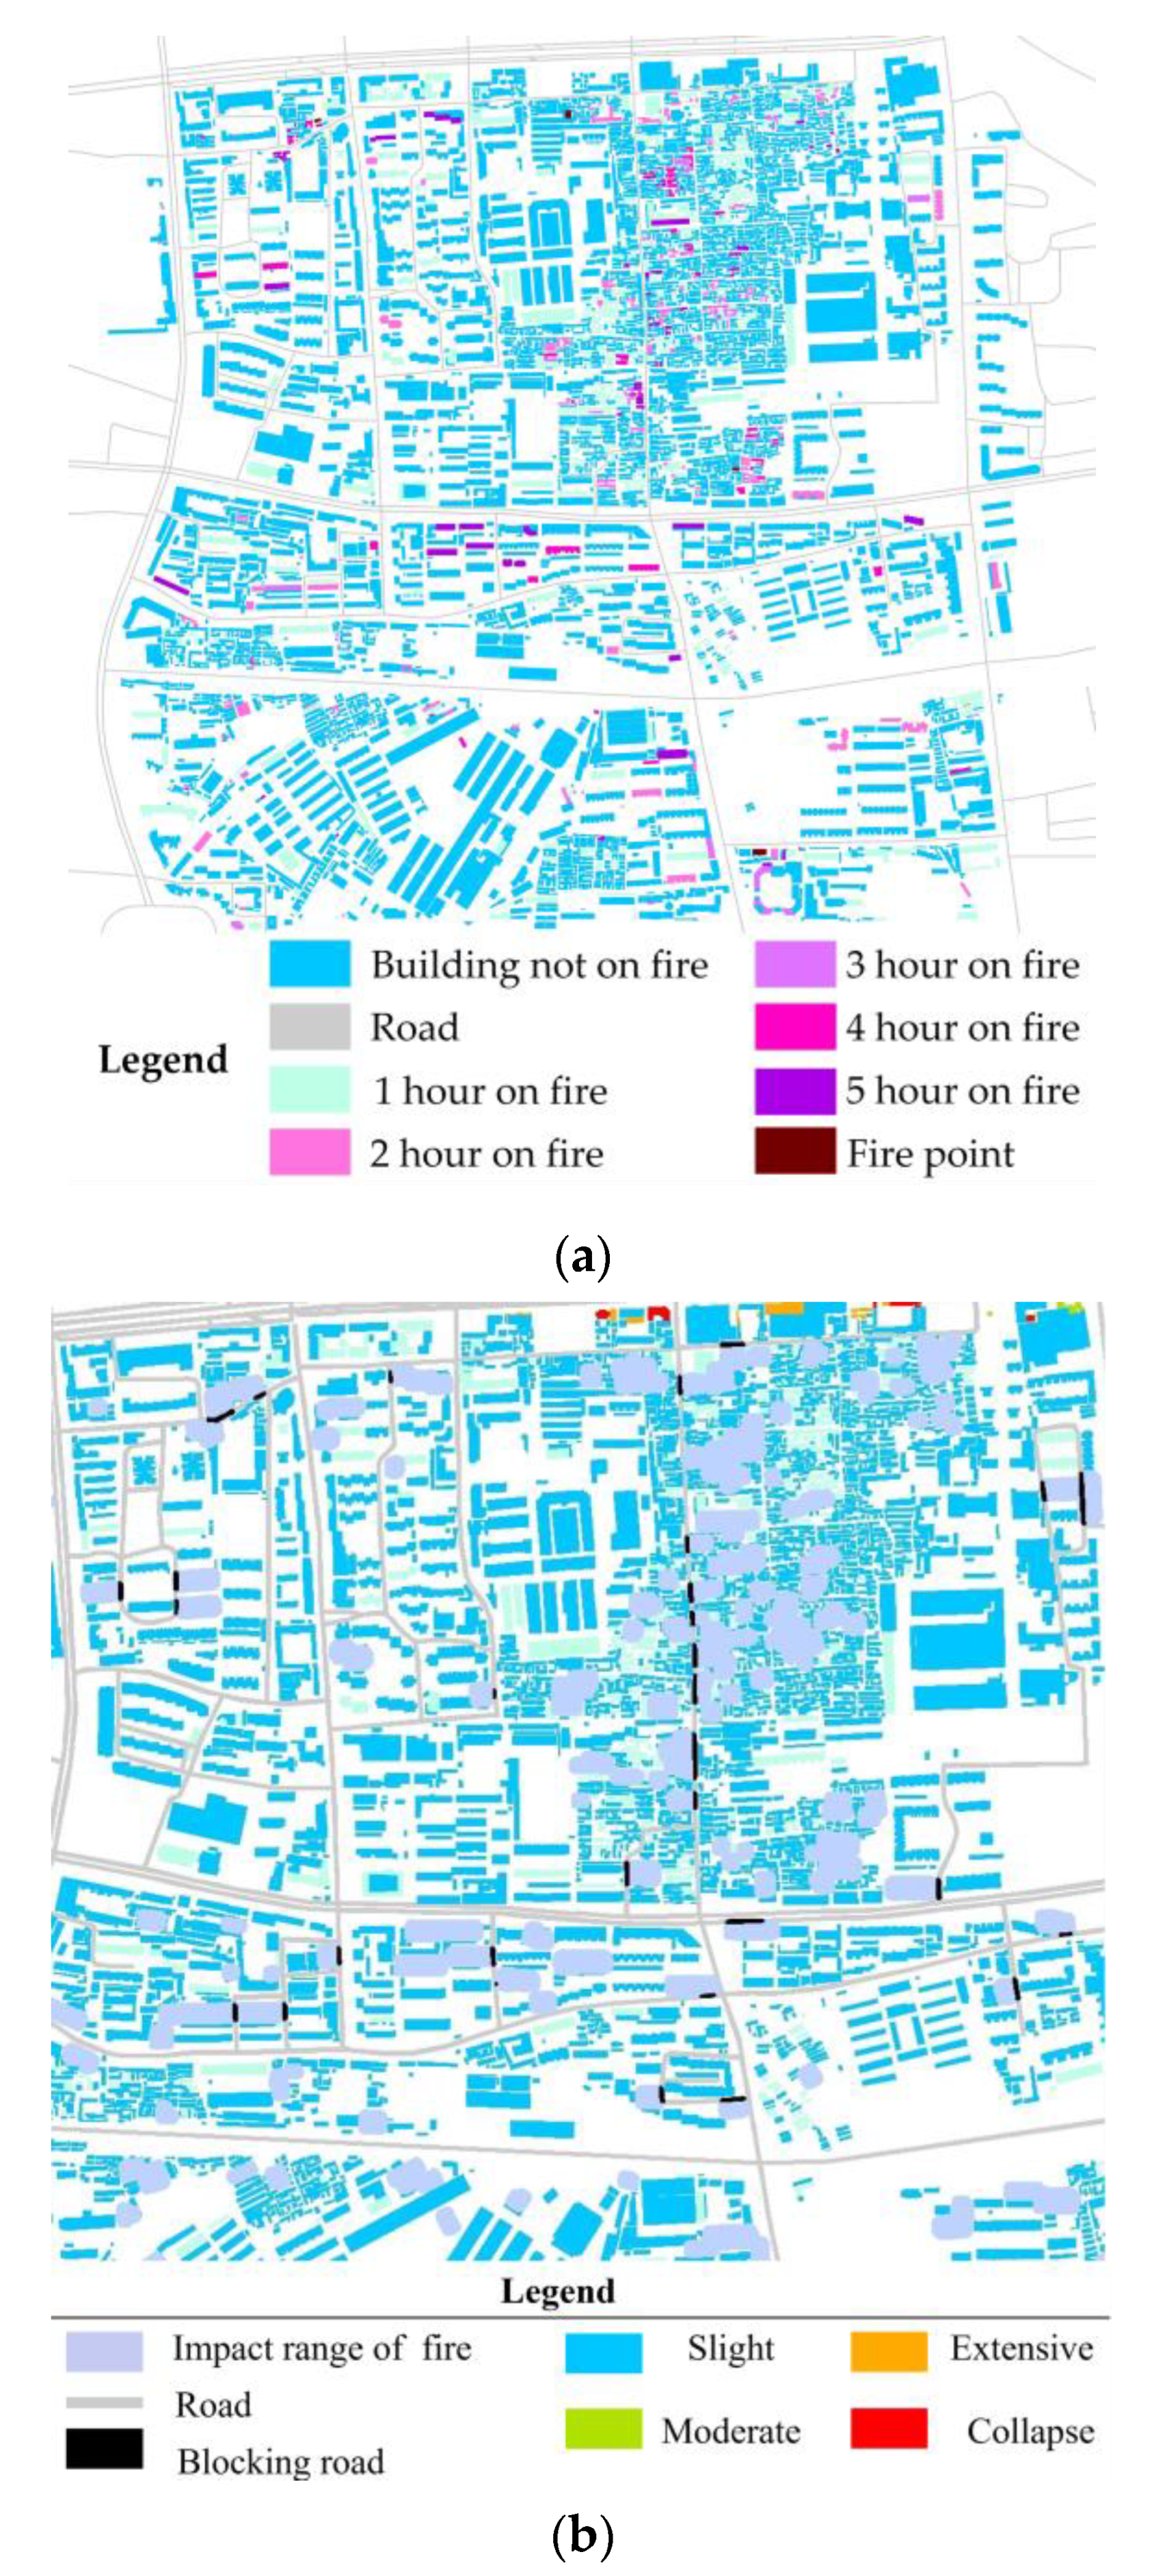
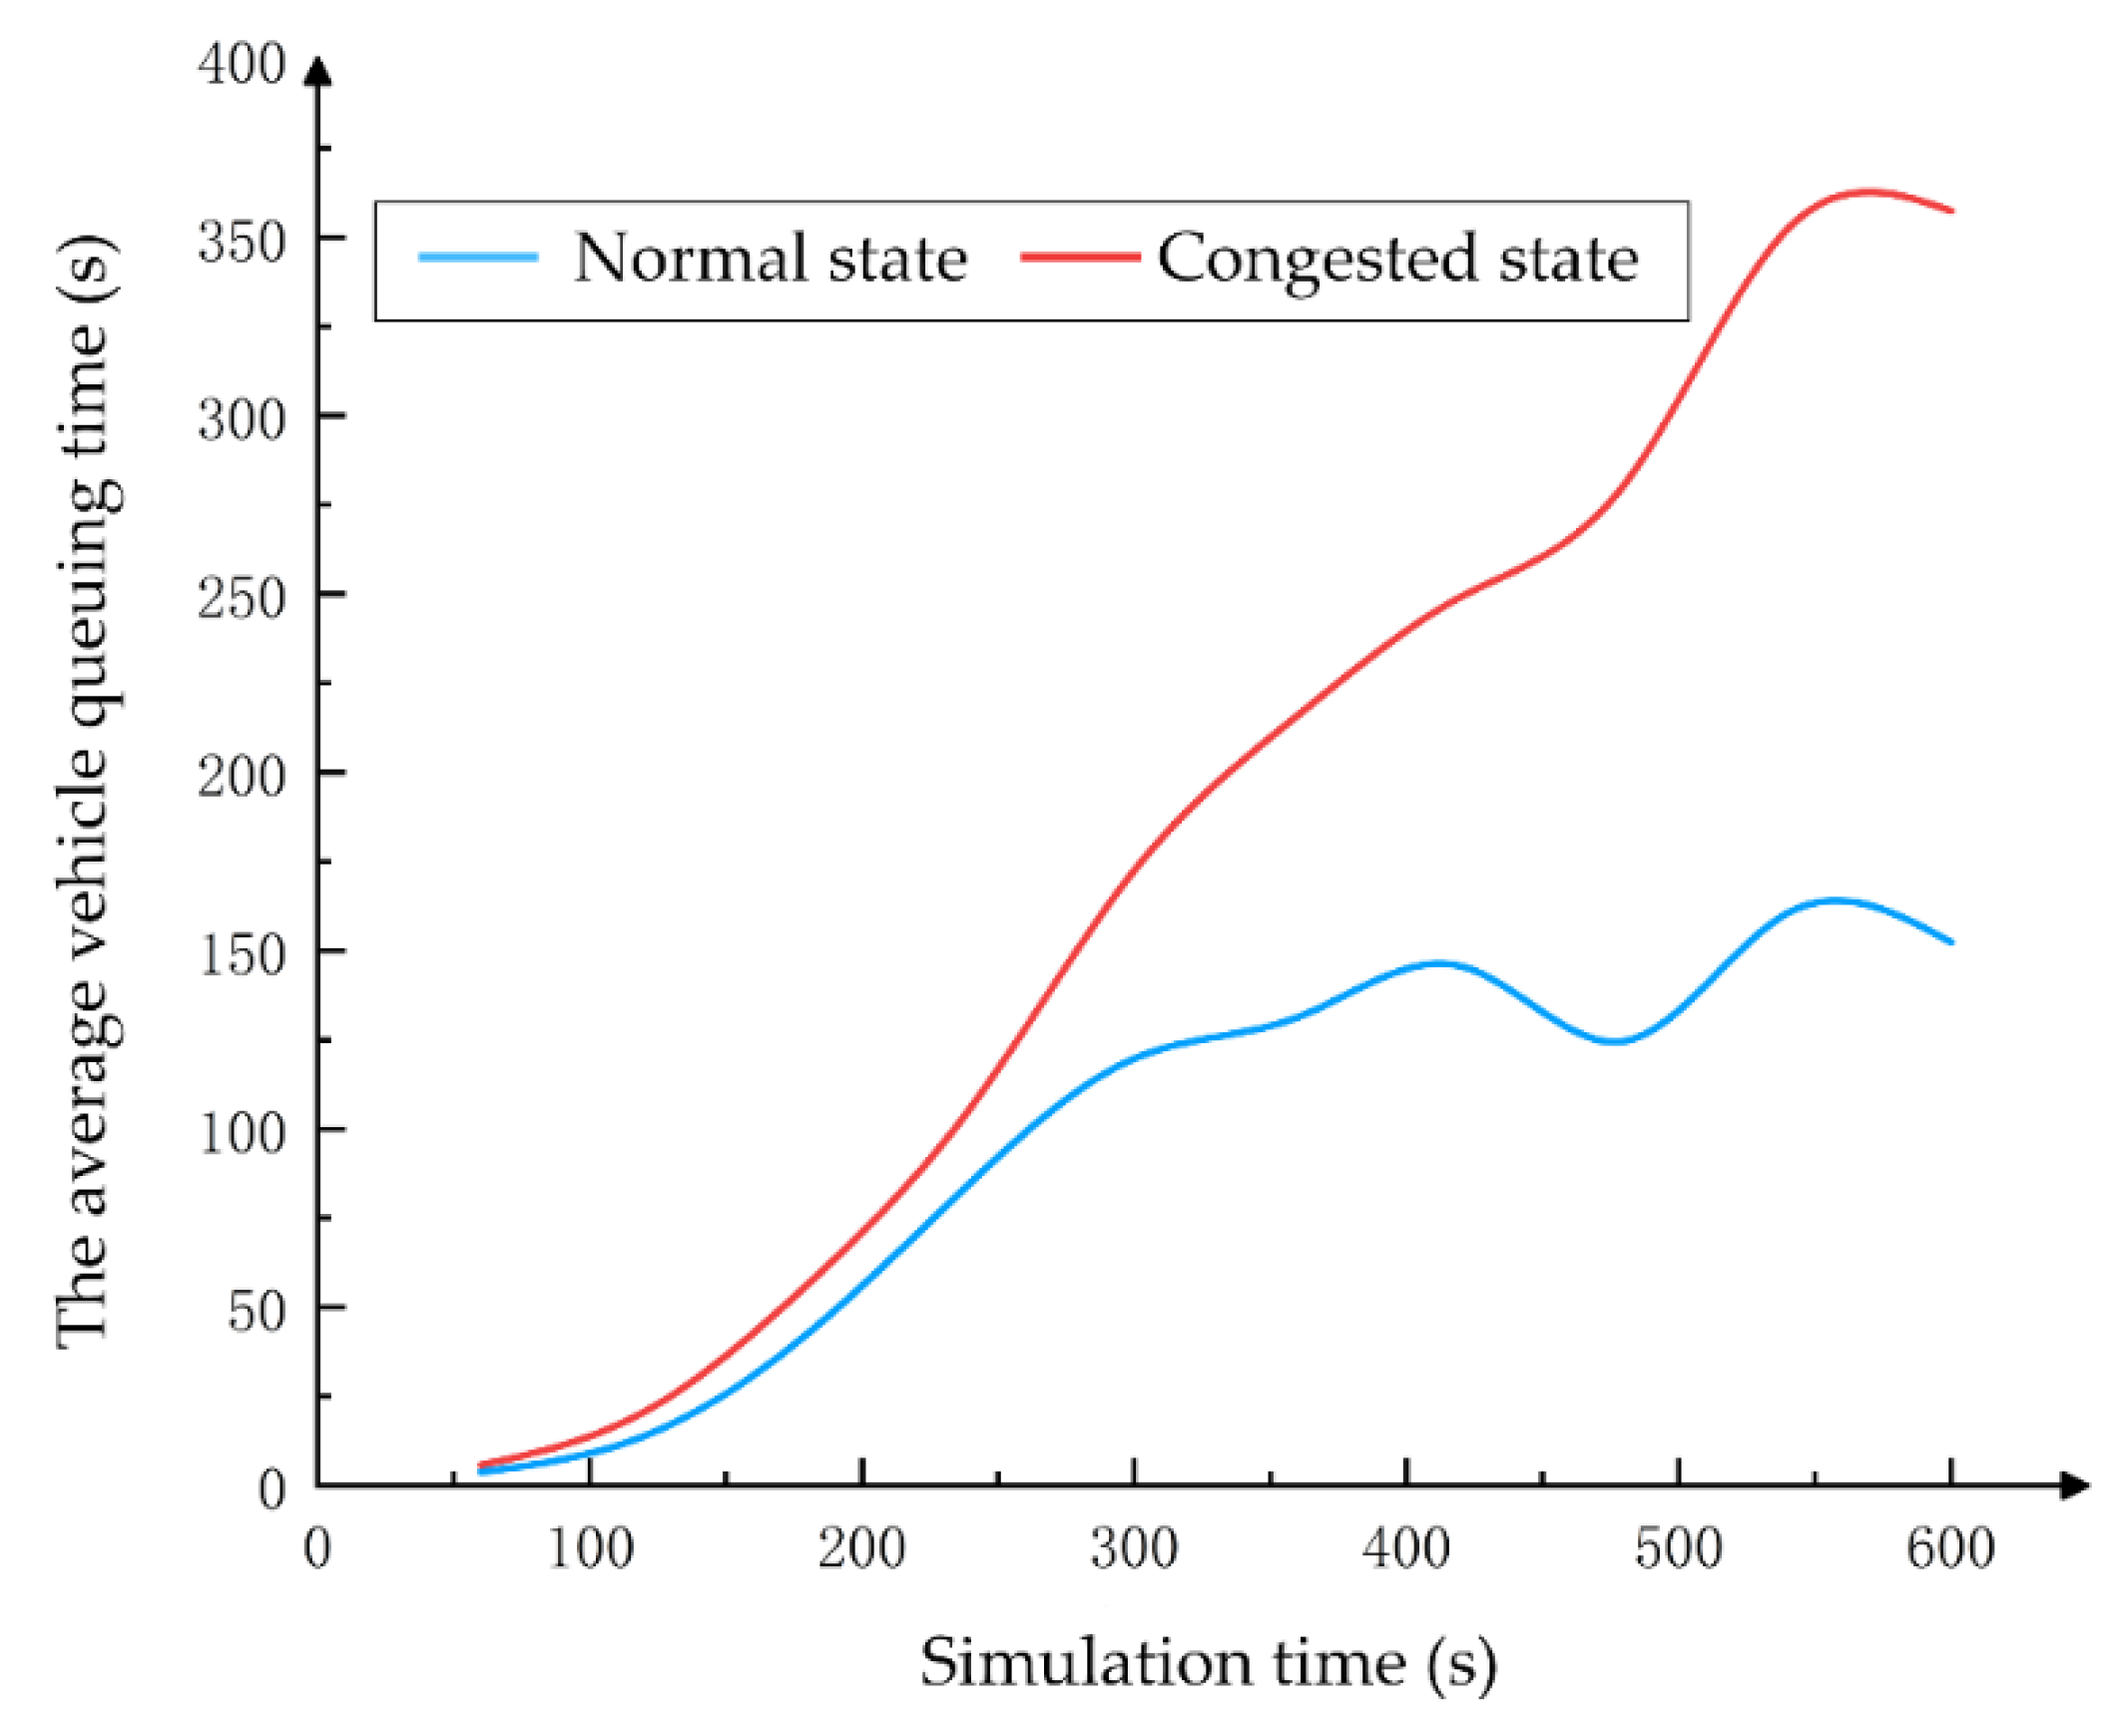
The road conditions were classified into congested or blocked states according to Equation (8), which will have different impacts on road traffic. The impact of a congested road on traffic is reflected by the inability of vehicles to use the full width of a certain length of road and thus an increase in traffic using the several lanes remaining available, as shown in
Figure 3. In contrast, the impact of a blocked road on traffic is reflected by the complete inability of vehicles to pass the road section.
In this study, the VISSIM platform, a modeling tool used to simulate urban traffic conditions [
38], was used to simulate the impact of these two states on traffic. Different measures were taken in VISSIM to simulate the different traffic states: for blocked roads, the entire road section was deleted from the simulation, whereas for congested roads, the lane shutdown option was adopted in the simulation. Additionally, the lengths of the blocked/congested road sections can be obtained from the road traversability analysis results, as described in
Section 3.1.
- (2)
Building the Simulation Model
If a road is blocked or congested after an earthquake, vehicles may alter their original routes, resulting in different behaviors. These behaviors can be generally classified into two types: vehicle-following and lane-changing. The former represents the driving behaviors of the front and following vehicles under the ever-changing road conditions; the latter represents the vehicle behaviors changing their running lanes from one to another according to the road conditions at that time (see
Figure 3). The lane-changing behaviors of vehicles critically impact the traffic-running state as they cause traffic disturbances and reduce road traversability.
A simulation model was built in VISSIM to simulate the micro-level vehicle behaviors. However, the default model parameters in VISSIM are based on traffic conditions in Germany, which differ significantly from those in China. Therefore, the simulation model parameters were adjusted according to the target national traffic situation.
There are 12 modifiable parameters in the VISSIM simulation model that describe vehicle-following and lane-changing behaviors. These parameters were modified in this study to reflect the actual situation of the case study region (Tongzhou, Beijing, China), and the results are shown in
Table 6. The modified model was used to simulate the vehicle-following and lane-changing behaviors under blocked and congested road states.
3.2.3. Validation of the Modified Traffic Model
Because of the blocked or congested road after the earthquake, vehicles are likely to change lanes, resulting in traffic congestion. However, the changes before and after the earthquake are not necessary for the validation of micro-level vehicle behaviors. For instance, the daily blocked or congested roads can also cause the lane-changing behaviors. Therefore, the reliability of the modified traffic model can be validated by comparing the measured micro-level vehicle behaviors on a daily blocked or congested road with the simulation results. The entrance and exit of the main and service roads of the Guanghua Bridge located along Beijing’s East 3rd Ring Middle Road were chosen to measure vehicle behaviors in this study. By comparing the traffic simulation results and measured data in this region, the model’s availability can be confirmed.
For the measured data, a field investigation was also conducted to obtain the attributes of all roads in the simulated area (
Table 7). In addition, the traffic flow data describing 20 min of the morning rush hours on a certain working day were obtained from road traffic images, as shown in
Table 7.
For the traffic simulation, two VISSIM models were constructed in this study: one using the modified parameters described in
Table 6 (called the “modified model”) and the other using the platform default parameters (called the “original model”).
The road network was constructed in the VISSIM platform at a one-to-one ratio according to the observed road conditions with travel-time-monitoring points arranged at major sections. The monitored travel times comprised three main routes: through the main road, through the service road and then the main road, and through the main road and then the service road. After arranging the monitoring points, the default parameters were modified using the “Driving Behavior Parameter Setting” of the VISSIM platform.
Under the same input conditions, the two models were used to conduct a 600 s simulation of road traffic conditions to obtain the travel time in each road section.
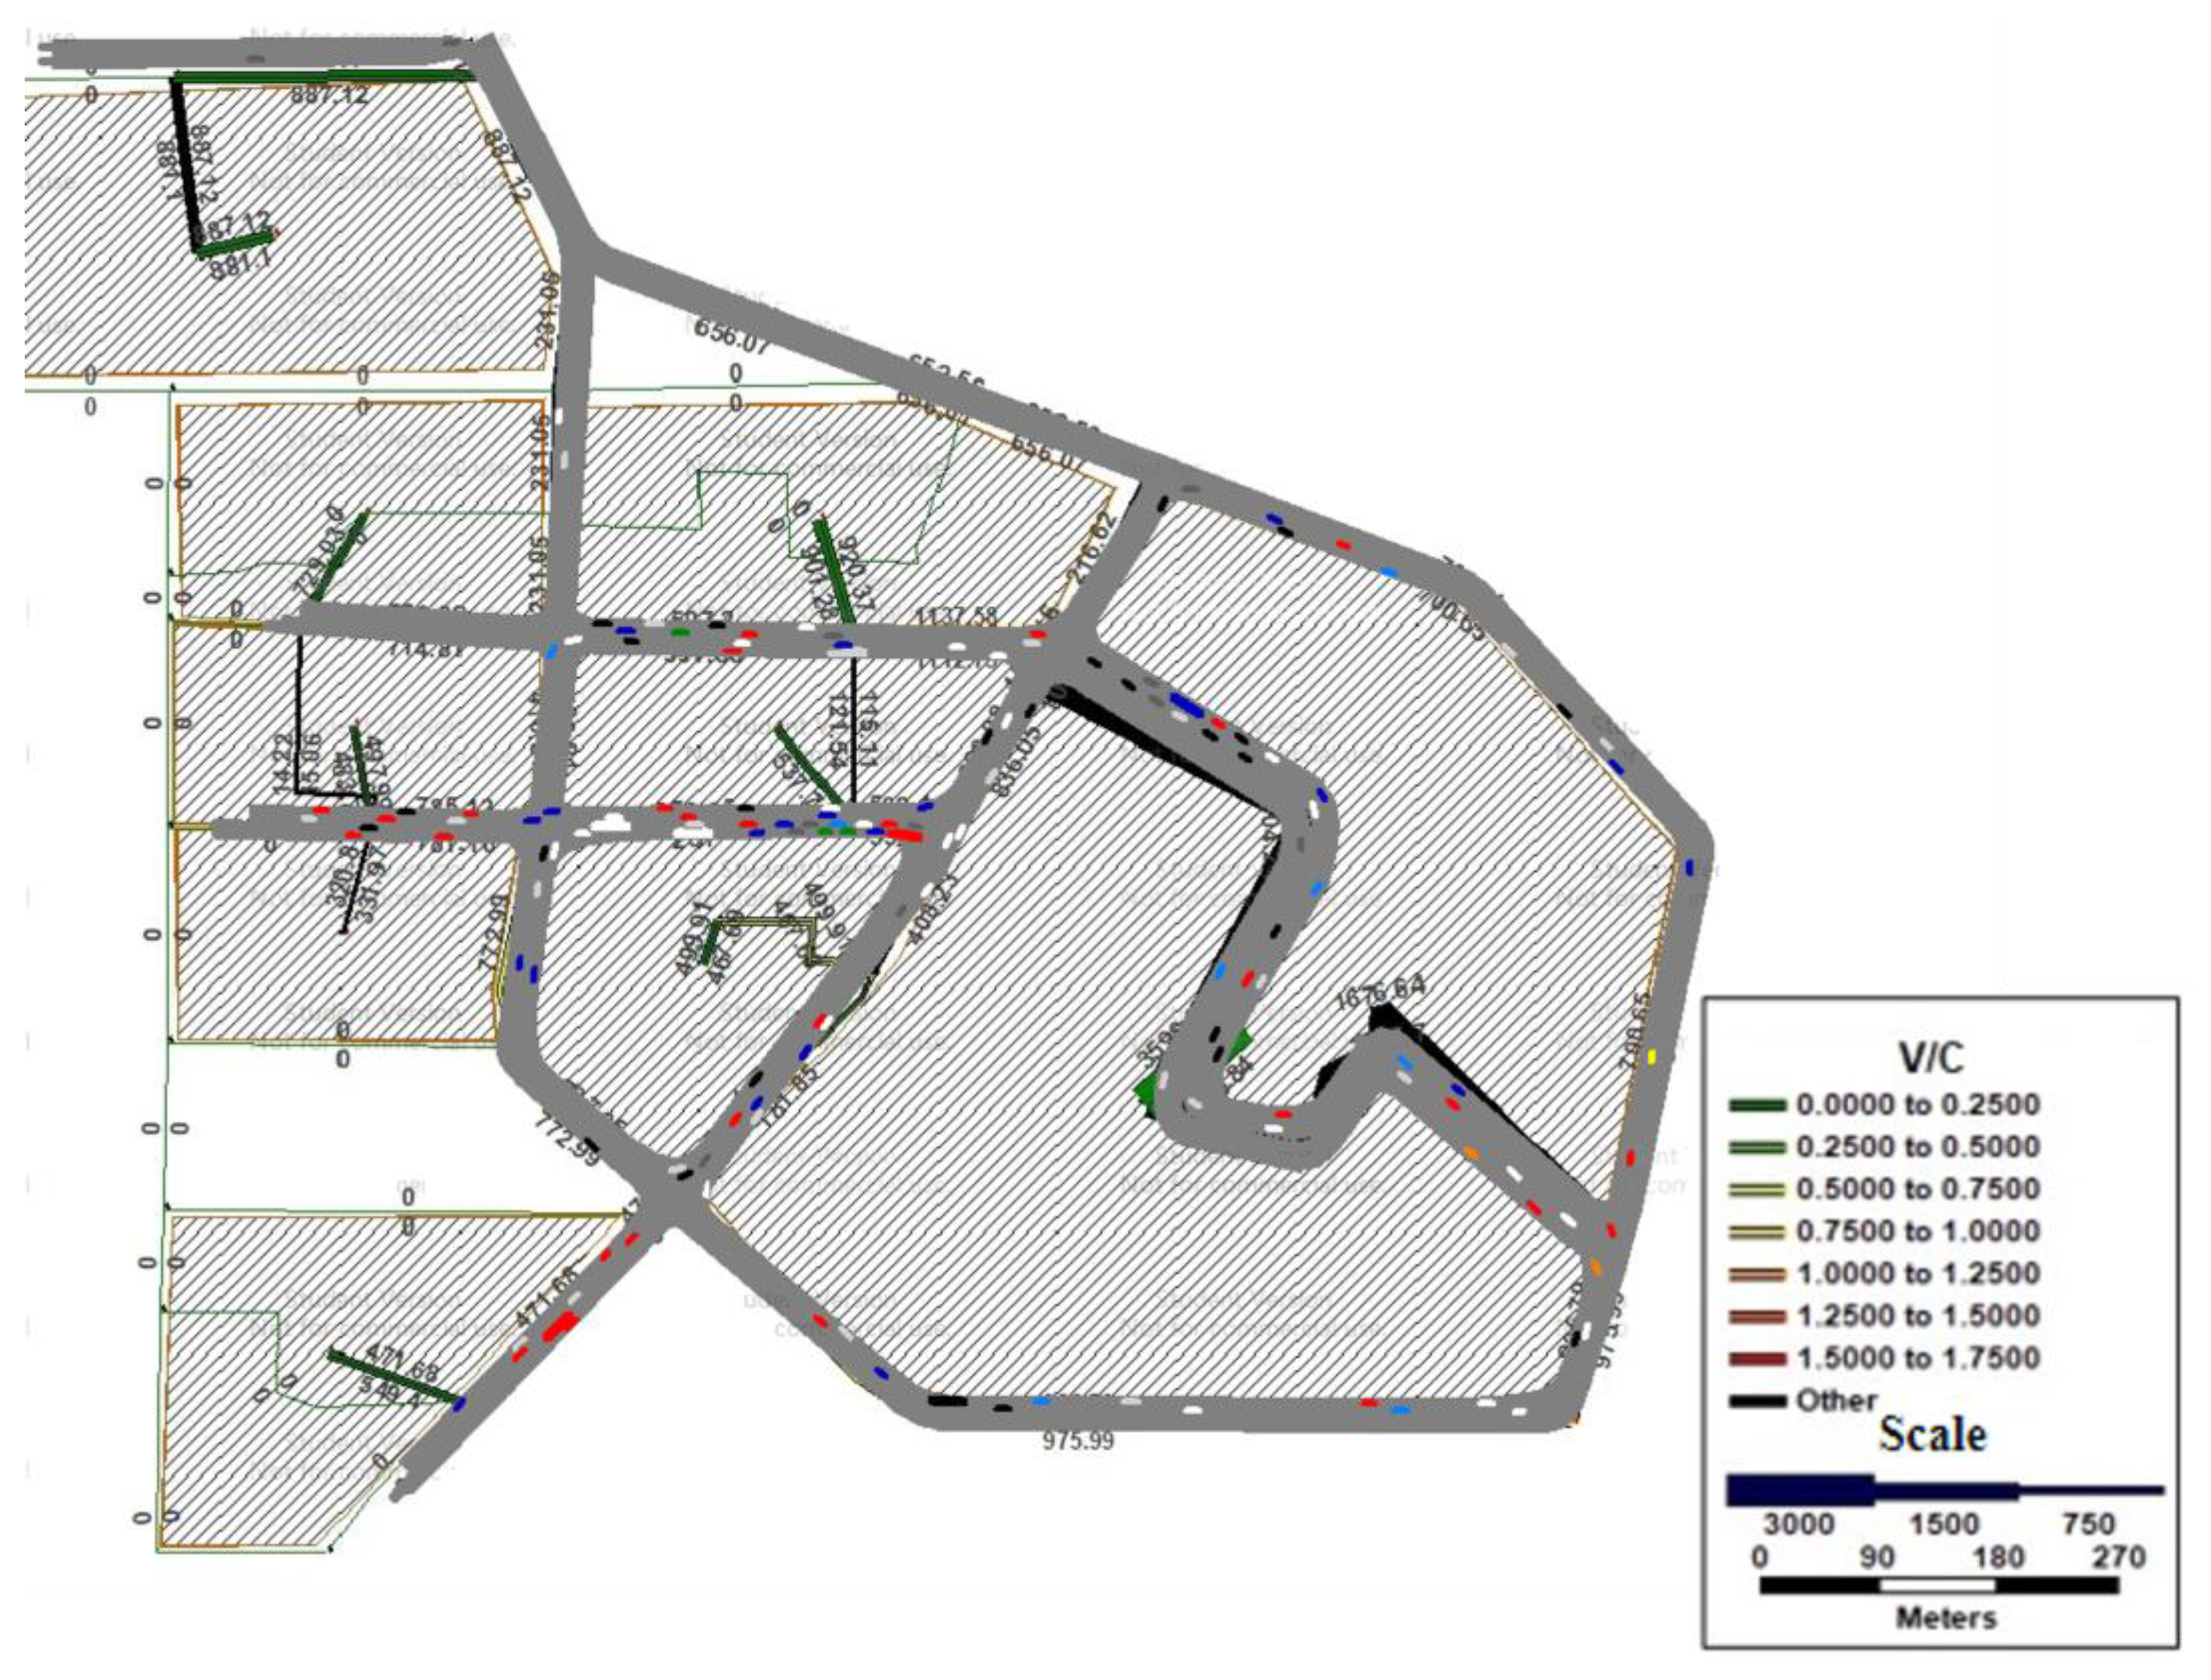
Figure 4 shows a visualization of the road traffic conditions obtained by the modified simulation at a given time, and the results of the two simulations are compared with the field-measured results in
Table 8.
It can be observed from the comparison that the revised model parameters effectively improved the accuracy of the simulation, indicating that the parameter correction scheme adopted in this study is reliable. Hence, the modified parameters were confidently applied to conduct traffic simulations in VISSIM.


