Article

Research on Pedestrian Detection and DeepSort Tracking in Front of Intelligent Vehicle Based on Deep Learning

College of Automobile and Traffic Engineering, Liaoning University of Technology, Jinzhou 121001, China
*
Author to whom correspondence should be addressed.
Sustainability 2022, 14(15), 9281; https://doi.org/10.3390/su14159281
Submission received: 16 June 2022 / Revised: 21 July 2022 / Accepted: 26 July 2022 / Published: 28 July 2022

Abstract

:
In order to improve the tracking failure caused by small-target pedestrians and partially blocked pedestrians in dense crowds in complex environments, a pedestrian target detection and tracking method for an intelligent vehicle was proposed based on deep learning. On the basis of the YOLO detection model, the channel attention module and spatial attention module were introduced and were joined to the back of the backbone network Darknet-53 in order to achieve weight amplification of important feature information in channel and space dimensions and improve the representation ability of the model for important feature information. Based on the improved YOLO network, the flow of the DeepSort pedestrian tracking method was designed and the Kalman filter algorithm was used to estimate the pedestrian motion state. The Mahalanobis distance and apparent feature were used to calculate the similarity between the detection frame and the predicted pedestrian trajectory; the Hungarian algorithm was used to achieve the optimal matching of pedestrian targets. Finally, the improved YOLO pedestrian detection model and the DeepSort pedestrian tracking method were verified in the same experimental environment. The verification results showed that the improved model can improve the detection accuracy of small-target pedestrians, effectively deal with the problem of target occlusion, reduce the rate of missed detection and false detection of pedestrian targets, and improve the tracking failure caused by occlusion.

1. Introduction

A vehicle safety assist driving system or automatic driving system can perceive all kinds of targets and road environment information through radar with multiple sensors, such as visual perception in front of the target and road environment information, make driving decisions in time according to the position relationship between the host vehicle and the surrounding targets, and remind or correct the driver or automatically control the vehicle trajectory to a certain extent so as to curb the occurrence of traffic accidents.
Pedestrian detection is one of the key technologies of an autonomous driving environment perception and also one of the core research hot spots for future vehicles in a complex driving environment to truly realize the unmanned vehicle. Due to the small size of a pedestrian target, its movement is varied and its walking direction is uncertain. Compared with static lane detection and dynamic vehicle target recognition, it is more difficult to identify and predict. Therefore, it is of great significance to quickly detect pedestrian targets and judge their walking intentions in time for autonomous vehicles to control vehicle driving routes in advance and reduce collisions with pedestrians.
As we all know, with the rapid development of computer technology, intelligent control and deep learning theory have been widely applied to various research fields, such as the intelligent vehicle environment perception, smart parting, and food supply chain management in smart cities [1,2,3,4]. At present, research institutions and researchers at home and abroad have carried out extensive studies on pedestrian target detection and tracking using deep learning theory. A two-stage RCNN algorithm was proposed in ref. [5]. In the first stage, feature extraction is carried out to generate candidate regions, and the candidate regions are input into the neural network for convolution operations. In the second stage, SVM is used for target classification, and a non-maximum suppression algorithm is used to delete redundant candidate boxes and retain the candidate boxes with the highest confidence to complete target detection. A VGGNet network was built in ref. [6], and two network models, VGG16 and VGG19, were obtained by the continuous superposition of a convolutional layer and pooling layer [6]. Ref. [7] proposed a YOLO network structure belonging to the one-stage detection algorithm [7]. An image is divided into regions in the network structure, each grid region is input into a neural network for target detection, and the boundary boxes and categories of detected targets are predicted. In Ref. [8], a SAF RCNN method was proposed; this can detect targets of different scales in a target detection task by assigning different weights to the output results of the network [8]. Based on the YOLO network, the distribution density of candidate boxes in the x and y directions was adjusted to improve the real-time performance of the detection model in ref. [9]. In Ref. [10], YOLO and DenseNet were combined to amplify target feature information using the HSV model, to extract features using a convolutional neural network, and, finally, to improve the lightweight model using the Dense Block structure [10]. A Sort algorithm was proposed; this takes IOU as the evaluation index, uses a Kalman filter to predict the trajectory, and realizes the matching between the detection frame and the tracking trajectory combined with the Hungarian algorithm. The algorithm has fast detection speed but poor shielding ability and low tracking accuracy. Later, a depth tracking algorithm based on Sort was proposed; this performs off-line training of the model on pedestrian re-recognition data, deals with the occlusion problem to a certain extent, and reduces the number of target ID jumps [11]. In Ref. [12], a twin bidirectional network GRU was proposed, a new candidate trajectory was established in a sparse environment according to the target features extracted by CNN and RCNN neural networks, and the trajectory with the highest confidence score was retained [12]. A double matching attention network with a spatio-temporal double attention mechanism was proposed to track and correlate data with a single object. The LSTM memory method was used to solve the problem of the RNN neural network with a too-small data amount due to a gradient descent [13]. A pedestrian tracking algorithm based on the idea of multi-granularity was proposed. This integrates the convolutional features of a neural network with the underlying color features, makes decisions on the results of the auto-regression network tracking algorithm based on deep learning, and revises the tracking results according to the target detection results [14]. From the above analysis, we can know that the deep reinforcement learning method has powerful hierarchical decision-making and recognition abilities, which can be applied to many fields, such as an intelligent vehicle system, energy management system [15,16,17,18], and so on [19,20].
It was our goal to propose an improved method for pedestrian target detection in an intelligent driving environment. The article is structured as follows. Section 2, titled “Improved YOLO Network Design Based on Deep Learning”, analyzes the pedestrian detection process based on deep learning and proposes a CBAM (convolutional block attention module), including the spatial attention module (SAM) and channel attention module (CAM) based on the general YOLO model architecture. Section 3, “DeepSort Pedestrian Tracking Based on Improved Network”, demonstrates the flow of a DeepSort pedestrian tracking method and the Kalman filter to estimate the pedestrian motion state. The measures of appearance feature and Mahalanobis distance were set for data association matching between the detection frame and predicted pedestrian trajectory. The Hungarian algorithm was used to achieve the optimal matching of pedestrian targets. Section 4, “Pedestrian Detection and Tracking Evaluation Indicators”, discusses the evaluation indicators on pedestrian detection and tracking. Section 5, “Pedestrian Detection and Tracking Verification”, lists some verification results on pedestrian detection and tracking based on the data set PD-2022, the COCO data set, VOC 2017, and other data sets. Section 6, “Conclusions”, summarizes the research results and remarks of the article. The main innovation of the paper is that the improved pedestrian detection model has a stronger ability to deal with occlusion and accurately detects missed and misdetected images, which solves the tracking failure caused by occlusion before improvement.

2. Improved YOLO Network Design Based on Deep Learning

2.1. Analysis of Overall Pedestrian Detection Process Based on Deep Learning

Deep learning-based pedestrian detection in the front of intelligent vehicles can be summarized into the following six aspects.
(1)
Model building
The target detection model is mainly divided into two modules: the Darknet-53 backbone network module extracts pedestrian features, and the detection module performs multi-scale pedestrian prediction.
(2)
Model parameter setting
Model parameters are designed for intelligent driving scenarios and pedestrians with small targets to make the detection network more suitable for the environment awareness system of intelligent driving, realizes the optimization of the network model, and improves the detection effect.
(3)
Data preprocessing
Data preprocessing includes two modules: data set making and data enhancement. The data sets mainly come from three aspects. In one, pedestrian images in different environments are collected by a camera. In another, driving records are collected by a vehicle camera, and single frame images are obtained by frame segmentation technology. In the third, some pedestrian images are extracted from various public data sets, and a new pedestrian data set named PD-2022 is established by merging them.
(4)
Model training
The detection model after tuning is trained on the self-constructed data set to observe the change of loss value; the model training is completed after the optimal weight is obtained.
(5)
Model test
The trained pedestrian detection model is tested on the self-built data set to analyze the pedestrian detection effect.
(6)
Model evaluation
The pedestrian detection accuracy is calculated by the target detection evaluation index, and the model is evaluated and analyzed.

2.2. Model Improvement Based on CBAM Module

In order to effectively alleviate target misdetection and missed detection caused by occlusion and camera exposure of pedestrian targets, the convolutional block attention module (CBAM) is introduced in this paper, including the spatial attention module (SAM) and channel attention module(CAM), as shown in Figure 1.
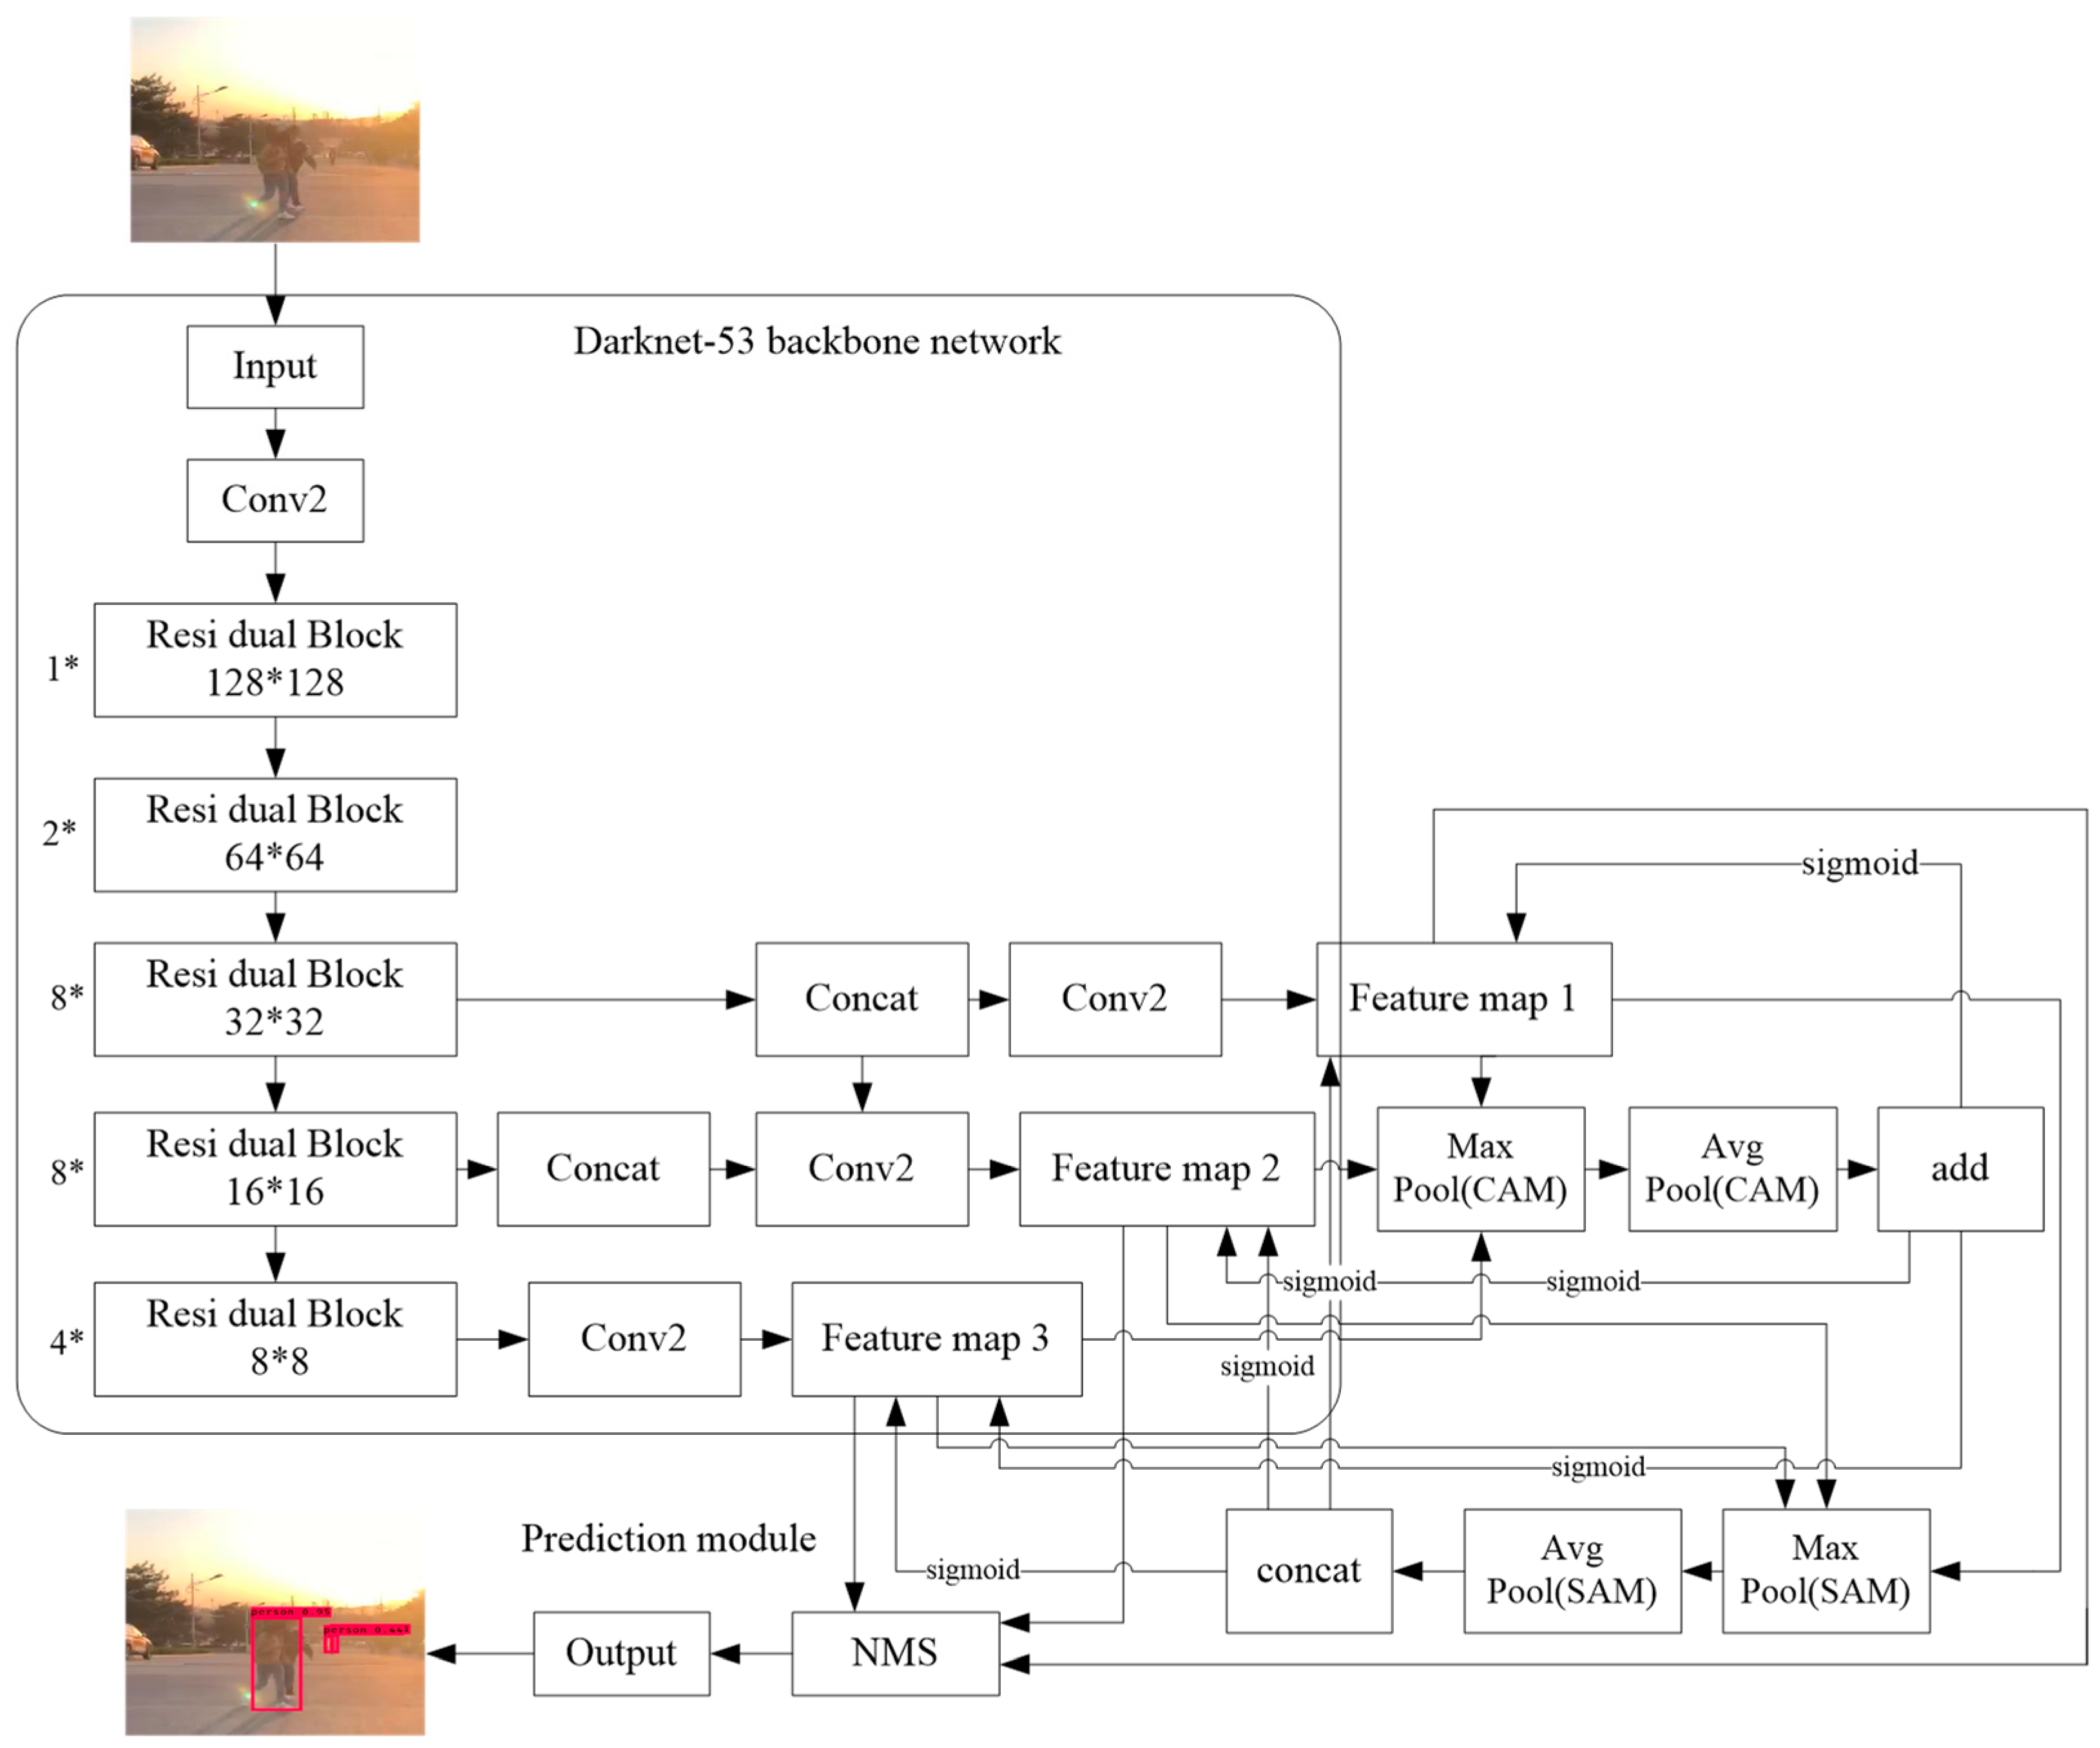
The constructed CBAM modules were added to the rear of the YOLO backbone network Darknet-53, and the feature maps extracted by YOLO were pooled to the maximum and average in spatial and channel dimensions. It can enlarge the weight of useful information and reduce the weight of useless information in the feature map, enlarge the features of pedestrians in the image, increase the feature extraction ability of the model, and improve the detection performance of the model.
The channel attention module (CAM) is shown in Figure 2; it is assumed that the size of the original feature map is N times N channel. Firstly, global maximum pooling and global average pooling are carried out to obtain two feature vectors with channel numbers of the original figure. A fully connected neural network is used to combine feature vectors, learn the non-linear relationship between channels, and output feature vectors with the length of the channel number. The output of the two artificial neural networks is added together, that is, for fusion processing, and then the sigmoid function is used to map the result to between 0 and 1, which is used to represent the weight of each channel. Finally, the weight values from 0 to 1 are multiplied to the original feature map to realize the amplification of useful information and the reduction in useless information.
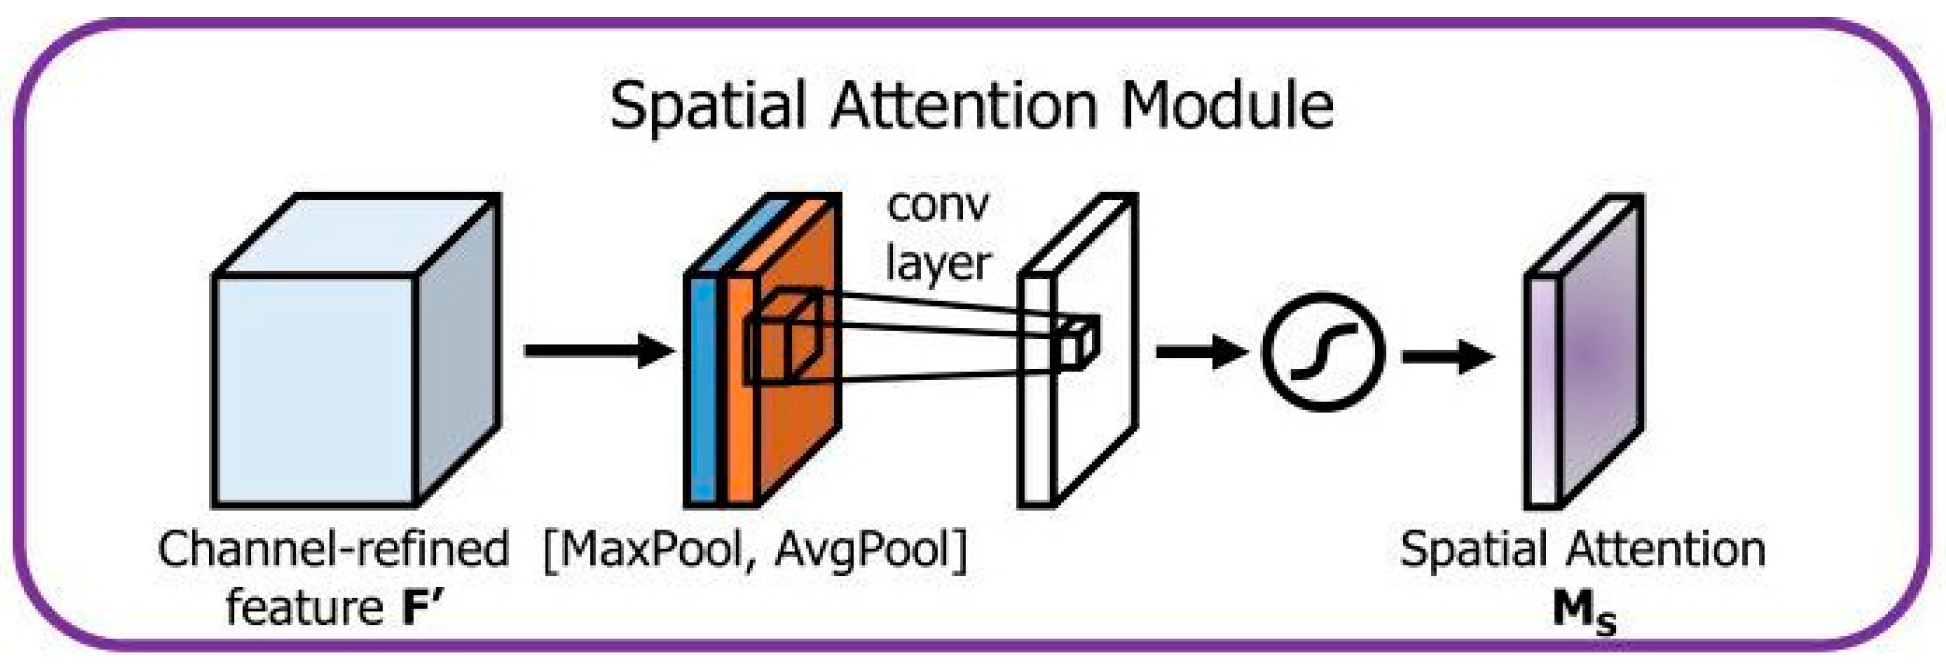
The spatial attention module (SAM) is shown in Figure 3. For channel maximum pooling and average pooling, convolution kernels are 1’1, and two n’n’1 feature graphs can be generated. The two feature graphs are spliced by tensors to obtain a n’n’1 feature graph. A sigmoid function is used to activate the operation. The value on the feature map is mapped to 0 to 1, which is used to represent the weight on the space. The weight value is multiplied to the input feature map to achieve the enlargement of useful information and the reduction in useless information and complete the spatial attention. The CBAM module is spliced behind the traditional YOLO backbone network structure Darknet-53. The improved YOLO model architecture is shown in Figure 4.
It can be seen from Figure 4 that pedestrian features are extracted from the original image after the backbone network. Feature images of three scales were obtained as the Figure 1, Figure 2 and Figure 3, respectively. Firstly, the maximum pooling and average pooling of the channel dimension are calculated for the feature map, and the two feature vectors obtained are processed by the add module. Secondly, the eigenvalues are normalized by the sigmoid function, so that the output values are compressed to values between 0 and 1. Finally, the result is multiplied by Feature Map 1, Feature Map 2, and Feature Map 3 to complete the realization of channel attention. Feature Map 1, Feature Map 2, and Feature Map 3 obtained through channel attention were calculated by max pool and avg pool of the spatial dimension; the two-layer feature maps obtained were processed by the concat module. By the concat module processing, the feature values are normalized by the sigmoid function, and the normalized result is multiplied by the channel attention module, which is placed on the three feature maps (Feature Map 1, Feature Map 2, and Feature Map 3) to complete the realization of spatial attention. The pedestrian prediction was carried out on the feature graph and the final detection result was obtained after the screening of the prediction results by the non-maximum suppression (NMS) algorithm.

3. DeepSort Pedestrian Tracking Based on Improved Network

The Hungarian algorithm and the overlapping area of the measurable boundary boxes are used as the measurement standard in the sort algorithm; the target tracking is realized by Kalman filter estimation and frame-by-frame data association. The sorting algorithm has good tracking accuracy and accuracy under a high frame rate. However, because the algorithm only uses the motion measure as the association standard, it returns too many identity switches during association; therefore, the sort algorithm has shortcomings in processing target tracking tasks under occlusion scenes. The DeepSort algorithm adopted in this paper was improved on the basis of the sort algorithm, adding appearance measure information, using Mahalanobis distance matching and appearance information matching as two ways to carry out data association, which has a better tracking effect and a certain ability to deal with occlusion problems.

3.1. DeepSort Pedestrian Tracking Process

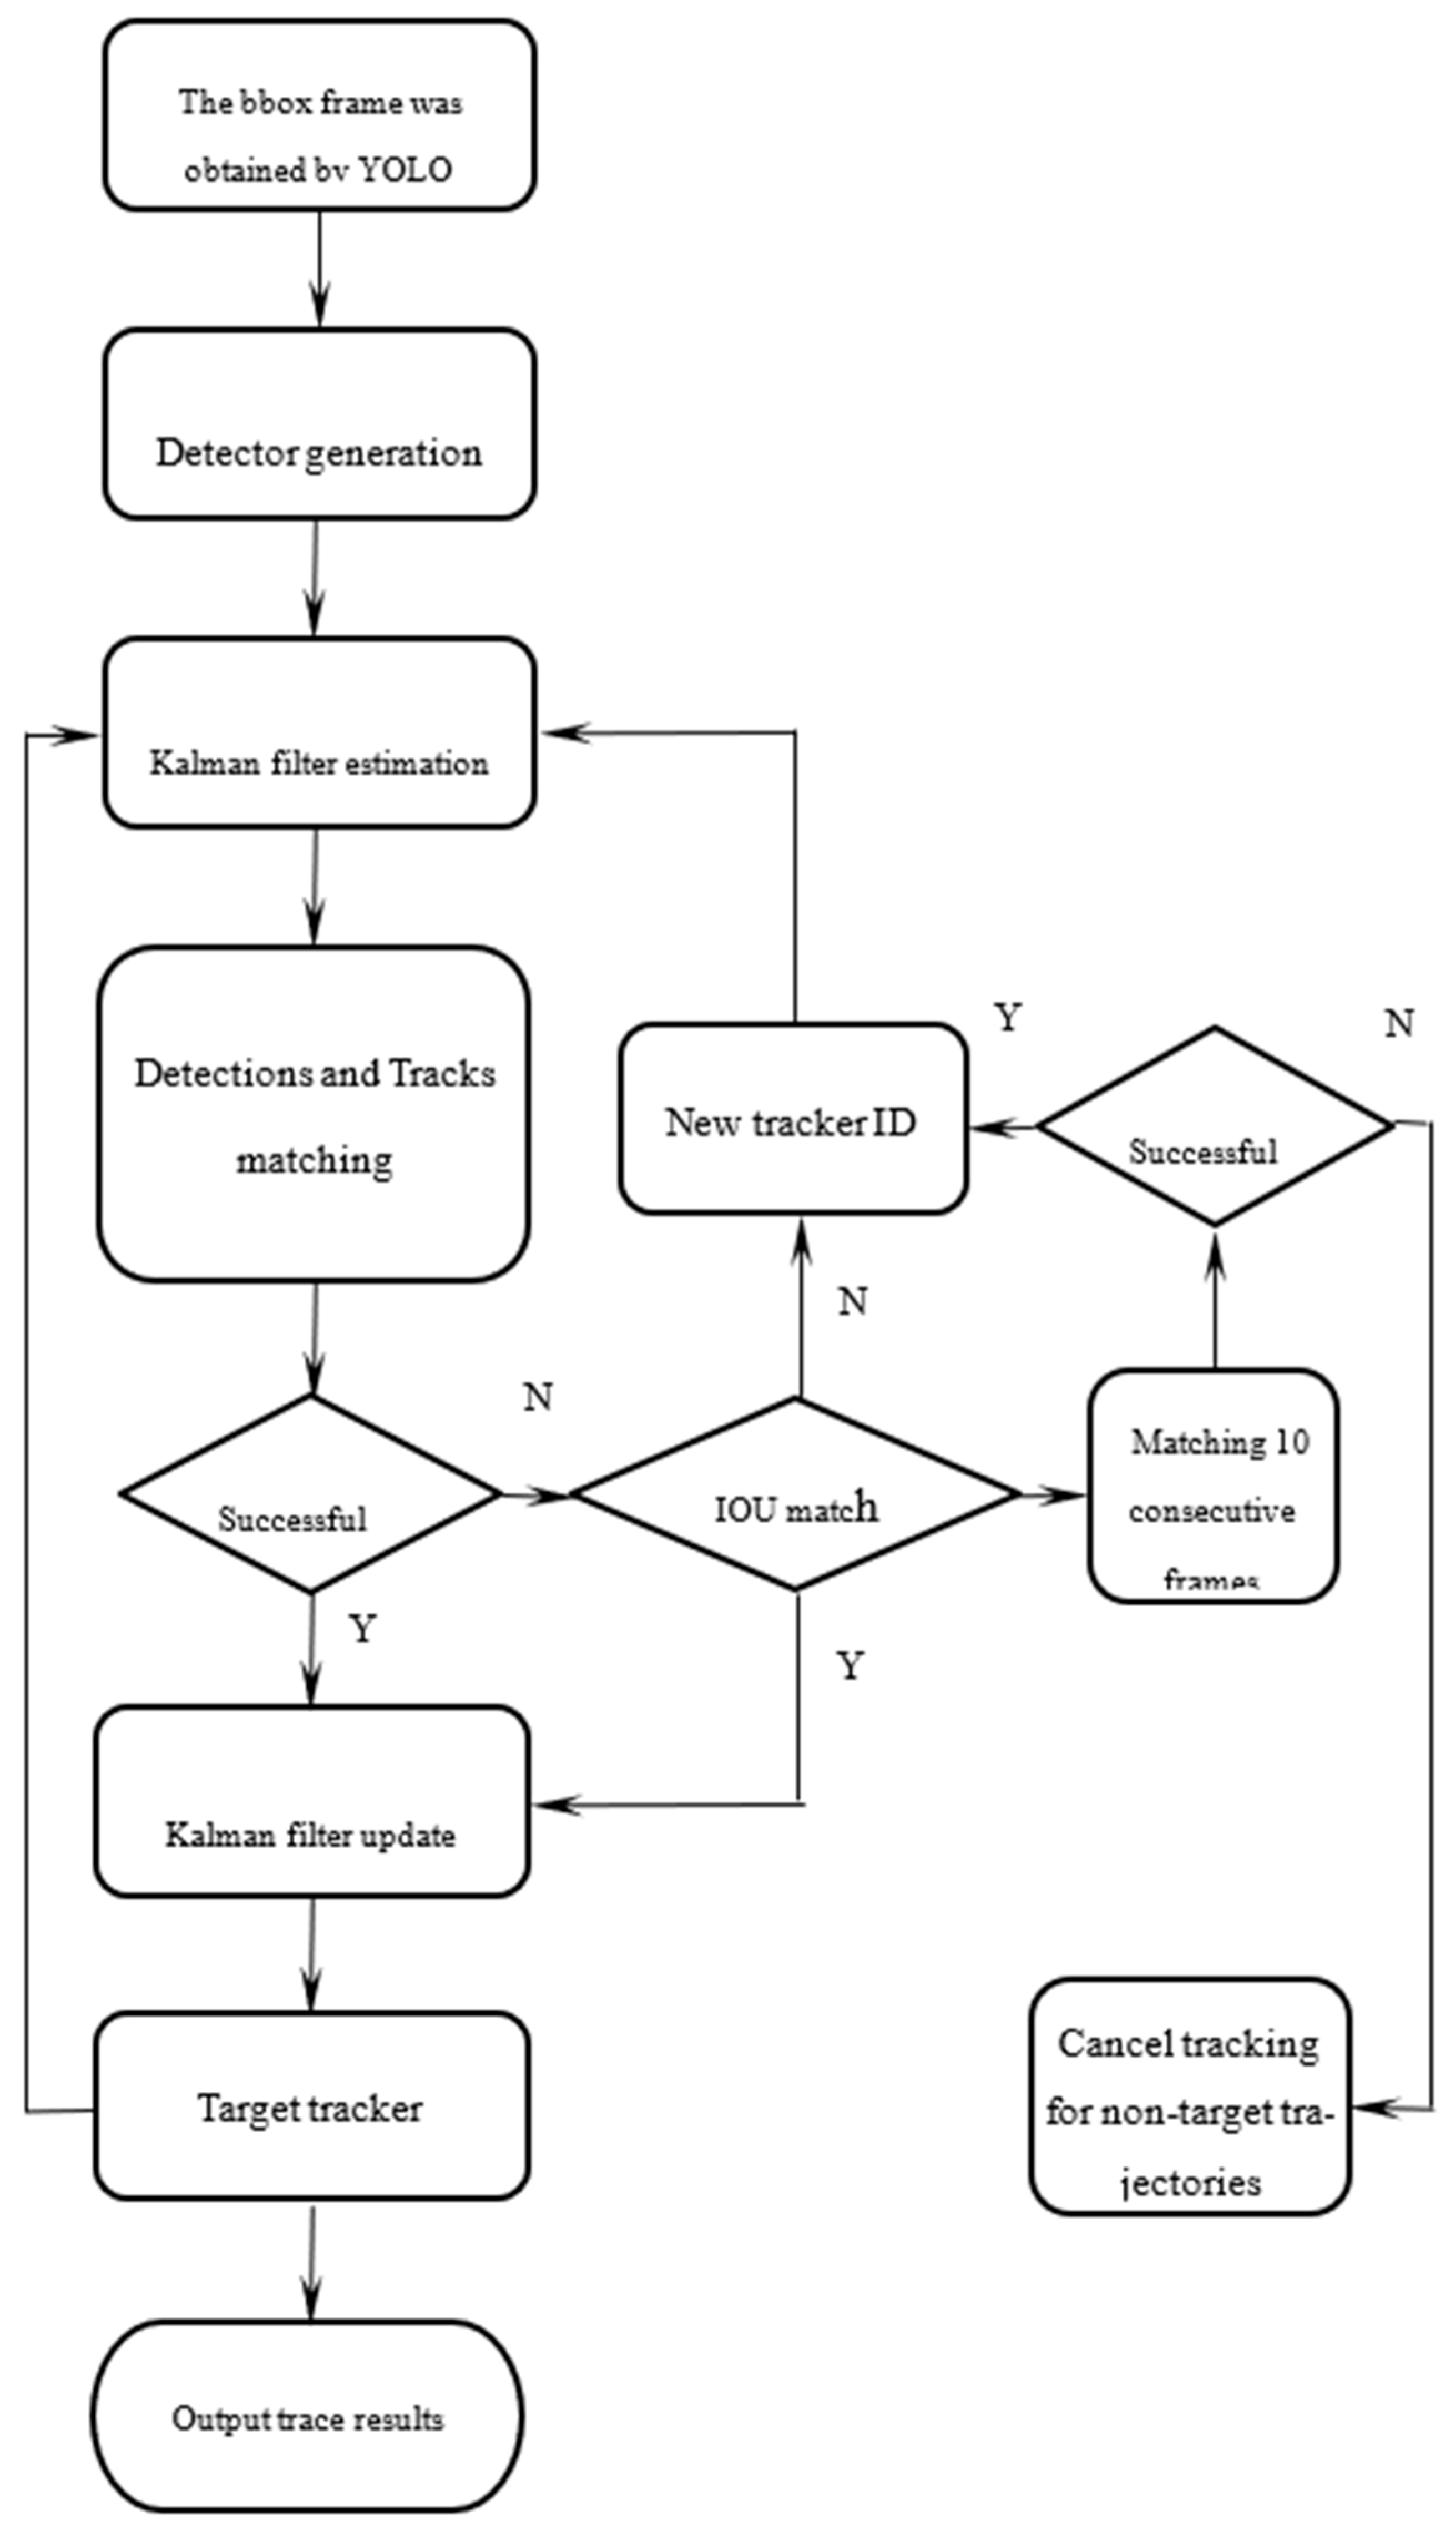
The pedestrian tracking method based on the DeepSort algorithm is mainly divided into the following steps; the overall process is shown in Figure 5.
(1)
According to the YOLO detection model, the detector information of the pedestrian at the last moment is obtained. The path of the pedestrian at the next moment is predicted by a Kalman filter algorithm, and the prior estimate value of the pedestrian is obtained.
(2)
The YOLO detection model is used to extract and save the features of the target pedestrian in the image at the current moment; the detector of pedestrian position information at the current moment can be obtained.
(3)
The Hungarian algorithm is used to match the detector and track by using the appearance feature and Mahalanobis distance. If the match is successful, it will enter a Kalman update and output tracking results. Otherwise, the unmatched detection frame and tracker are matched with IOU. During the cascade matching, a time update parameter (time_since_update) is set for each track. The tracking track is arranged according to the update parameter value. The tracking track with the smallest parameter value is first associated with the detector for matching, so as to ensure that the tracking target with the shortest matching time has a higher priority, which ensures the continuity of tracking and reduces the number of identity ID switchings.
(4)
The proportion of overlapping regions is used to calculate the similarity between the detection frame and the tracker and determine whether the detection frame and tracker at this moment have the same identity ID. If the match is successful, it will enter a Kalman update and output tracking results. Otherwise, the unmatched tracker will be matched for 10 consecutive frames. If the detection frame is matched within 10 frames, the tracking result will be output. If there is still no match, the target is considered as a non-tracking target, that is, the trajectory is deleted.
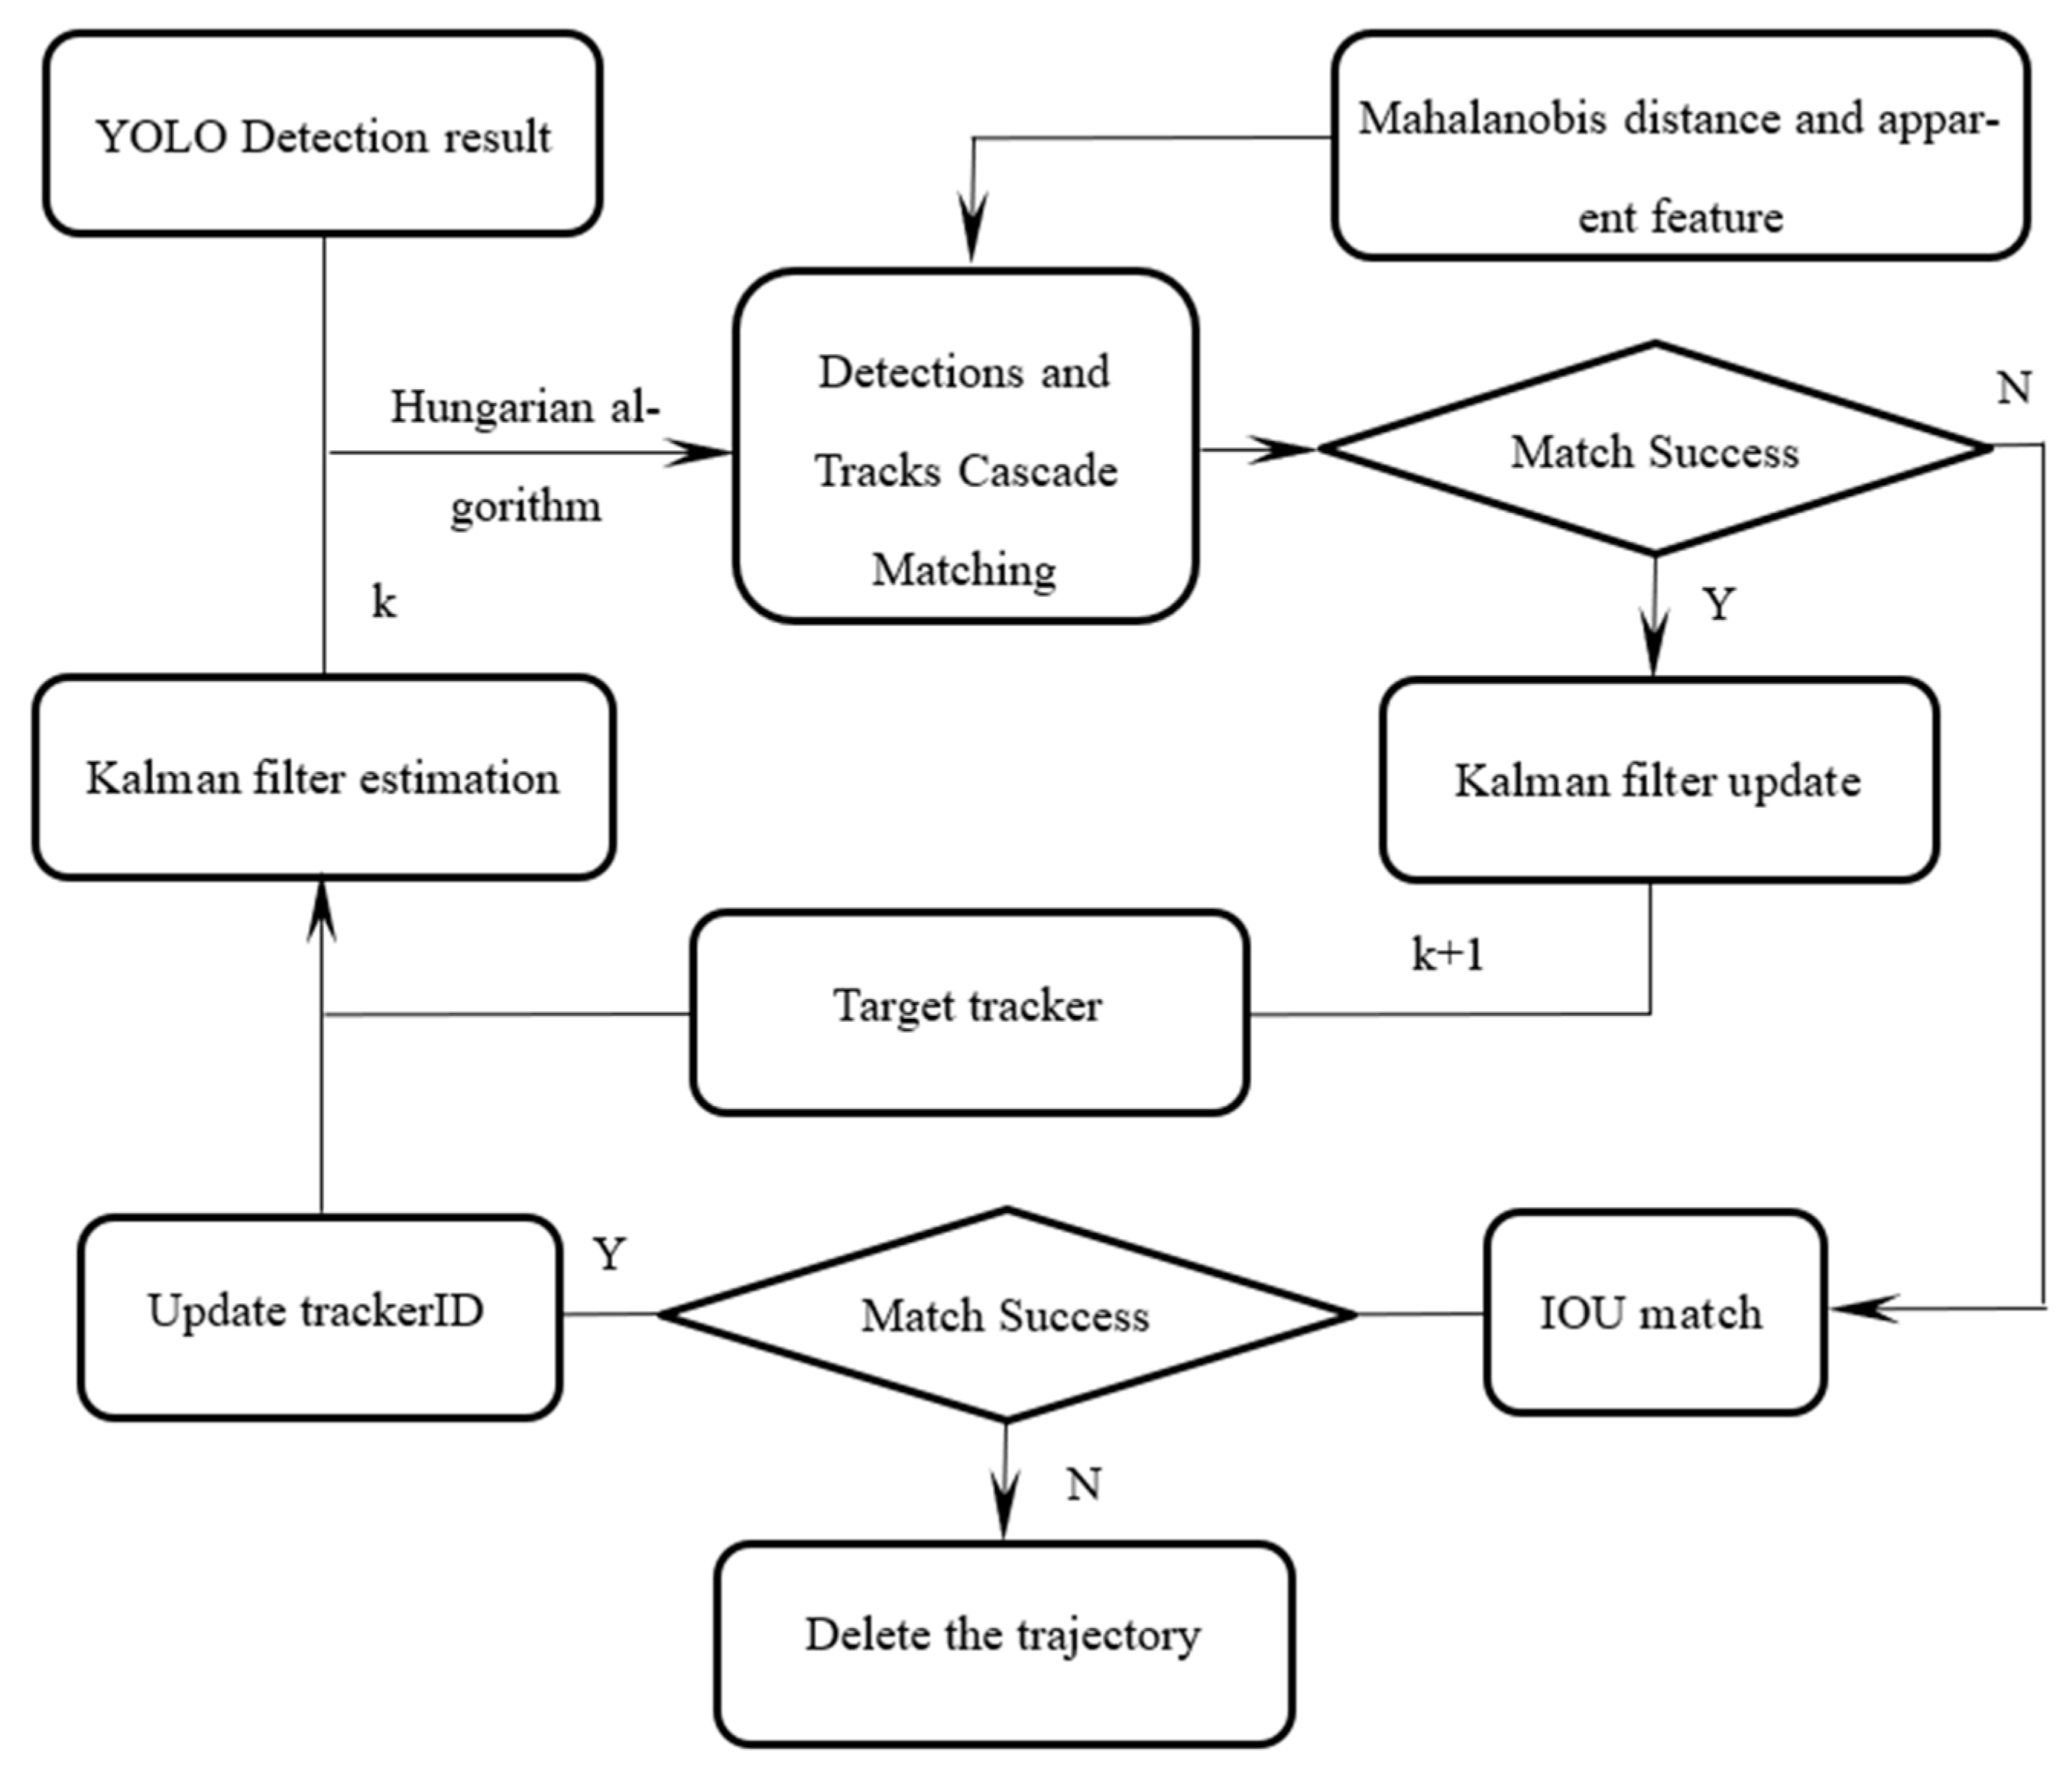
It needs to repeat the above steps to modify and adjust the tracking trajectory estimated by the Kalman filter to obtain the final tracking result. In addition, it is necessary to judge the detector that fails to match and track and perform operations such as assigning a new identity ID or deleting the trajectory. The above analysis process can be seen in Figure 5 and Figure 6.

3.2. Kalman Filter Estimation of Pedestrian Target State

In the process of pedestrian tracking in this paper, the video files used were pedestrian videos shot by vehicle-mounted cameras. In the two adjacent images of the video, the pedestrian position changed very little and the time interval of the images was short. Therefore, the pedestrian’s motion state was determined as uniform linear motion. A Kalman uniform velocity model was adopted as the basic model for the estimation of the pedestrian motion state; its pedestrian motion state equation is shown below.
x k = A x k 1 + ω k 1
where A is the state transition matrix, indicating that the pedestrian is moving in a uniform straight line, and the pedestrian state is set from k − 1 to k, ω is the noise generated by the prediction process, and Q is the covariance matrix of noise.
The pedestrian target detection results are taken as the observed values at the current time; the observation equation is as follows.
z k = H x k + v k
In Formula (2), H is the measurement matrix, and the conversion from the state value to the observed value is calculated, vk is the observation noise with Gaussian distribution, and the expectation is 0. R is the covariance matrix of the observation noise.
The state of the pedestrian target is represented by vector x as follows.
x = p , q , γ , h , v p , v q , v γ , v h T
where p and q are the horizontal and vertical coordinates of the target center point; γ is the length–width ratio of the boundary frame; h is the height of the boundary frame; and vp, vq, vγ, and vh are the corresponding velocities of each point of the boundary frame, respectively.
The time update equation of the pedestrian targets is shown below.
x ^ k = A x ^ k 1 + ω
P k = A P k 1 A T + Q
where x ^ k is the prior estimate of the pedestrian state at time k, P k is the prior estimate of covariance at time k, x ^ k 1 is the posterior estimate of the pedestrian state at time k − 1, P k 1 is the posterior estimate of covariance at time k − 1, and Q is the covariance of noise.
The status update equation of the pedestrian target is shown below.
K k = P k H T H P k H T + R 1
x ^ k = x ^ k + K k z k H x ^ k
P k = I K k H P k
The estimation process of using a Kalman filter is to predict the pedestrian state at k moment according to a Kalman filter value at k − 1 moment and to predict the variance through the process noise to complete the prior estimation. Then, the filter is used to modify and adjust the prior estimate according to the observed value at time k to complete the posterior estimate. Through the cyclic process above, the error between the real value and the measured value is constantly reduced, so that the predicted value is constantly approaching the real value and the final tracking result is obtained.

3.3. Correlation Matching of Pedestrian Targets

During tracking, it is necessary to perform correlation matching between the detector and tracking track on the prior estimate of the pedestrian target position and assign the same identity ID to the pedestrian with the same target.
(1)
Mahalanobis distance matching
In this paper, two measures of appearance feature and Mahalanobis distance are used for data association matching. The Mahalanobis distance is calculated as follows.
d ( i , j ) 1 = d j y i T S i 1 d j y i
where (yi, Si) is the projection of the ith pedestrian track mapped to the detection space, dj is the position of the jth detection frame, yi is the target position predicted by the ith tracking track, and Si is the covariance matrix of the observation space at the current moment predicted by a Kalman filter.
(2)
Appearance feature matching
A cosine deep feature network was trained on a large number of pedestrian sample re-recognition data sets. In total, the row sample data set contained more than 1,100,000 images of 1261 pedestrians. This characteristic network contained two convolution layers and six residual modules. Its network structure is shown in Table 1.
First, dj is detected based on each bounding box, and the appearance descriptor ri is calculated. Secondly, according to each track k, a library of appearance descriptors ( R k = r k ( i ) k = 1 L k ) is established, and the feature vectors successfully associated with 100 frames before and after are saved. Finally, the minimum cosine distance between the ith tracking track r k ( i ) and the jth detector r j T were calculated. The calculation of appearance features is shown as follows.
d 2 i , j = min 1 r j T r k i r k i R i
The appearance matching and Mahalanobis distance matching are fused as the final metric of association matching, as shown in Formula (11) below.
c i , j = λ d 1 i , j + 1 λ d 2 i , j
In view of the widespread severe occlusion of dense crowds in pedestrian tracking tasks, the continuity of pedestrian target tracking results is defective. Therefore, this paper gives priority association matching rights to frequently occurring targets to be tracked. A track is matched for each detector, represented by a time update parameter (time_since_update). If the tracking track matches the corresponding detector, this parameter is initialized to 0. Otherwise, the tracking track is counted with +1. The tracking track is arranged from large to small according to the parameter value of time_since _update, and the tracking track with the smallest parameter value is preferentially associated and matched with the detector. Therefore, the tracking target with the shortest matching time has a higher priority, which ensures the continuity of tracking, reduces the number of ID switchings, and achieves a more stable tracking effect.
Multiple pedestrian targets in an image will generate multiple target detection frames and predict multiple tracking trajectories at the same time. In this paper, the Hungarian algorithm is used to deal with the optimal matching problem between detection frames and tracking trajectories.

4. Pedestrian Detection and Tracking Evaluation Indicators

4.1. Pedestrian Detection Evaluation Indicators

In pedestrian detection tasks, the average detection accuracy (mAP) is the most widely used and most recognized evaluation index, which can be obtained by the following Formula (12).
m A P = k = 1 M A P k / M
A P = n = 1 m p n × g n / N g
where M is the number of images to be recognized, Ng is the number of positive samples in the image to be retrieved, and P(n) is the prediction accuracy. P(n) is the prediction result of the nth prediction.

4.2. Pedestrian Tracking Evaluation Indicators

The currently recognized performance evaluation of target tracking mainly includes the MOTP and MOTA.
The index MOTP is mainly used to measure the error degree between the real target and the tracking result. Its calculation formula is as follows.
M O T P = i , t d t i t C t
where d t i is the distance deviation between the ith pair matched tracker of the t frame and the real position of the target in the image and Ct is the logarithm of successful matching between the t frame tracker and the real target in the image.
MOTA represents the degree of successful tracking to the same target after matching by the tracking module and evaluates the accuracy of tracking model.
M O T A = 1 t m t + f p t + m m e t t g t
where mt is the real number of targets that are not matched successfully in the t frame, f p t is the number of unsuccessful trackers in the t frame, m m e t is the number of ID switches occurring in the t frame, and g t is the total number of real targets contained in the t frame image.

5. Pedestrian Detection and Tracking Verification

In order to verify the effectiveness of the pedestrian detection and tracking method in this paper, the data set PD-2022 was created based on all kinds of public data sets, such as the COCO data set, VOC 2017, and other data sets. The data set includes single or multi-target pedestrians in various lighting environments and different scenarios, such as roads, campuses, pedestrian streets, scenic spots, shopping malls, etc. In addition, vehicle-mounted recorders and cameras were used to capture video and frame images of pedestrians in urban and campus traffic environments.

5.1. Pedestrian Detection Verification and Result Analysis

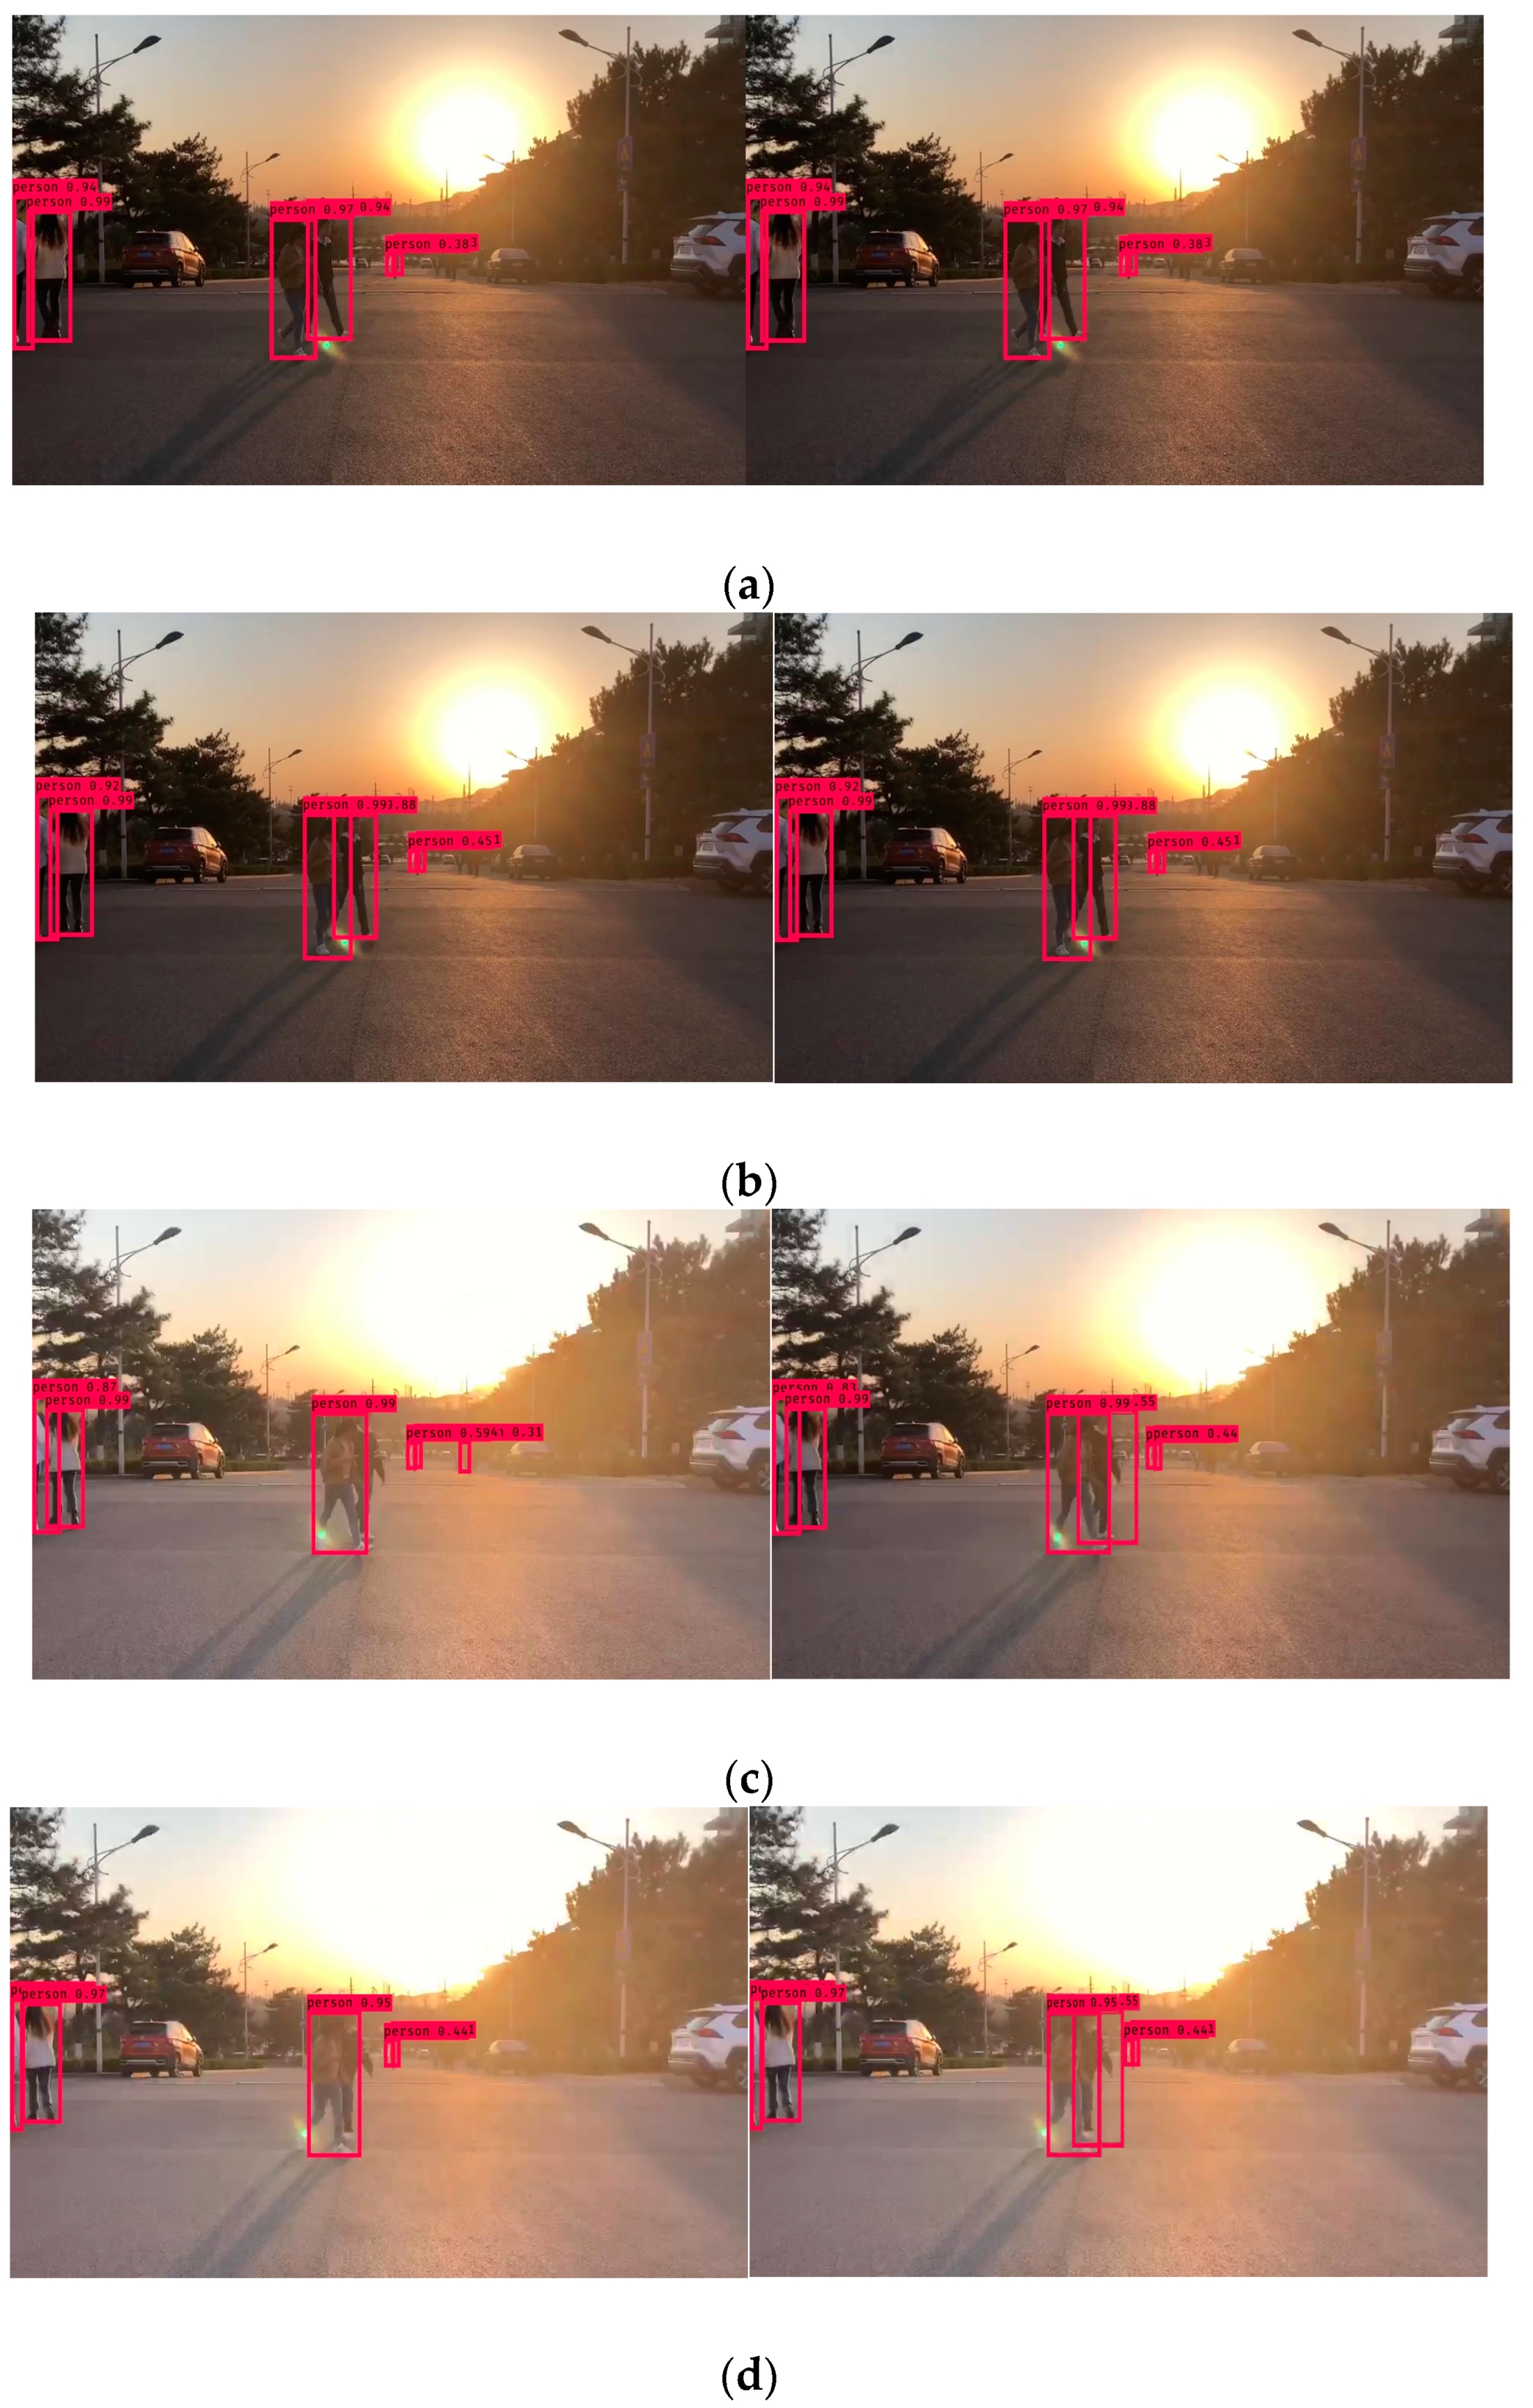
Figure 7 compares pedestrian detection results of campus video before YOLO improvement and pedestrian detection results after splicing the CBAM module.
As can be seen from Figure 7, from frame 15 to frame 18, there is no pedestrian missed detection problem, while from frame 21 to frame 24, there is a pedestrian missed detection problem in the model before improvement; the improved model can still accurately detect the target.
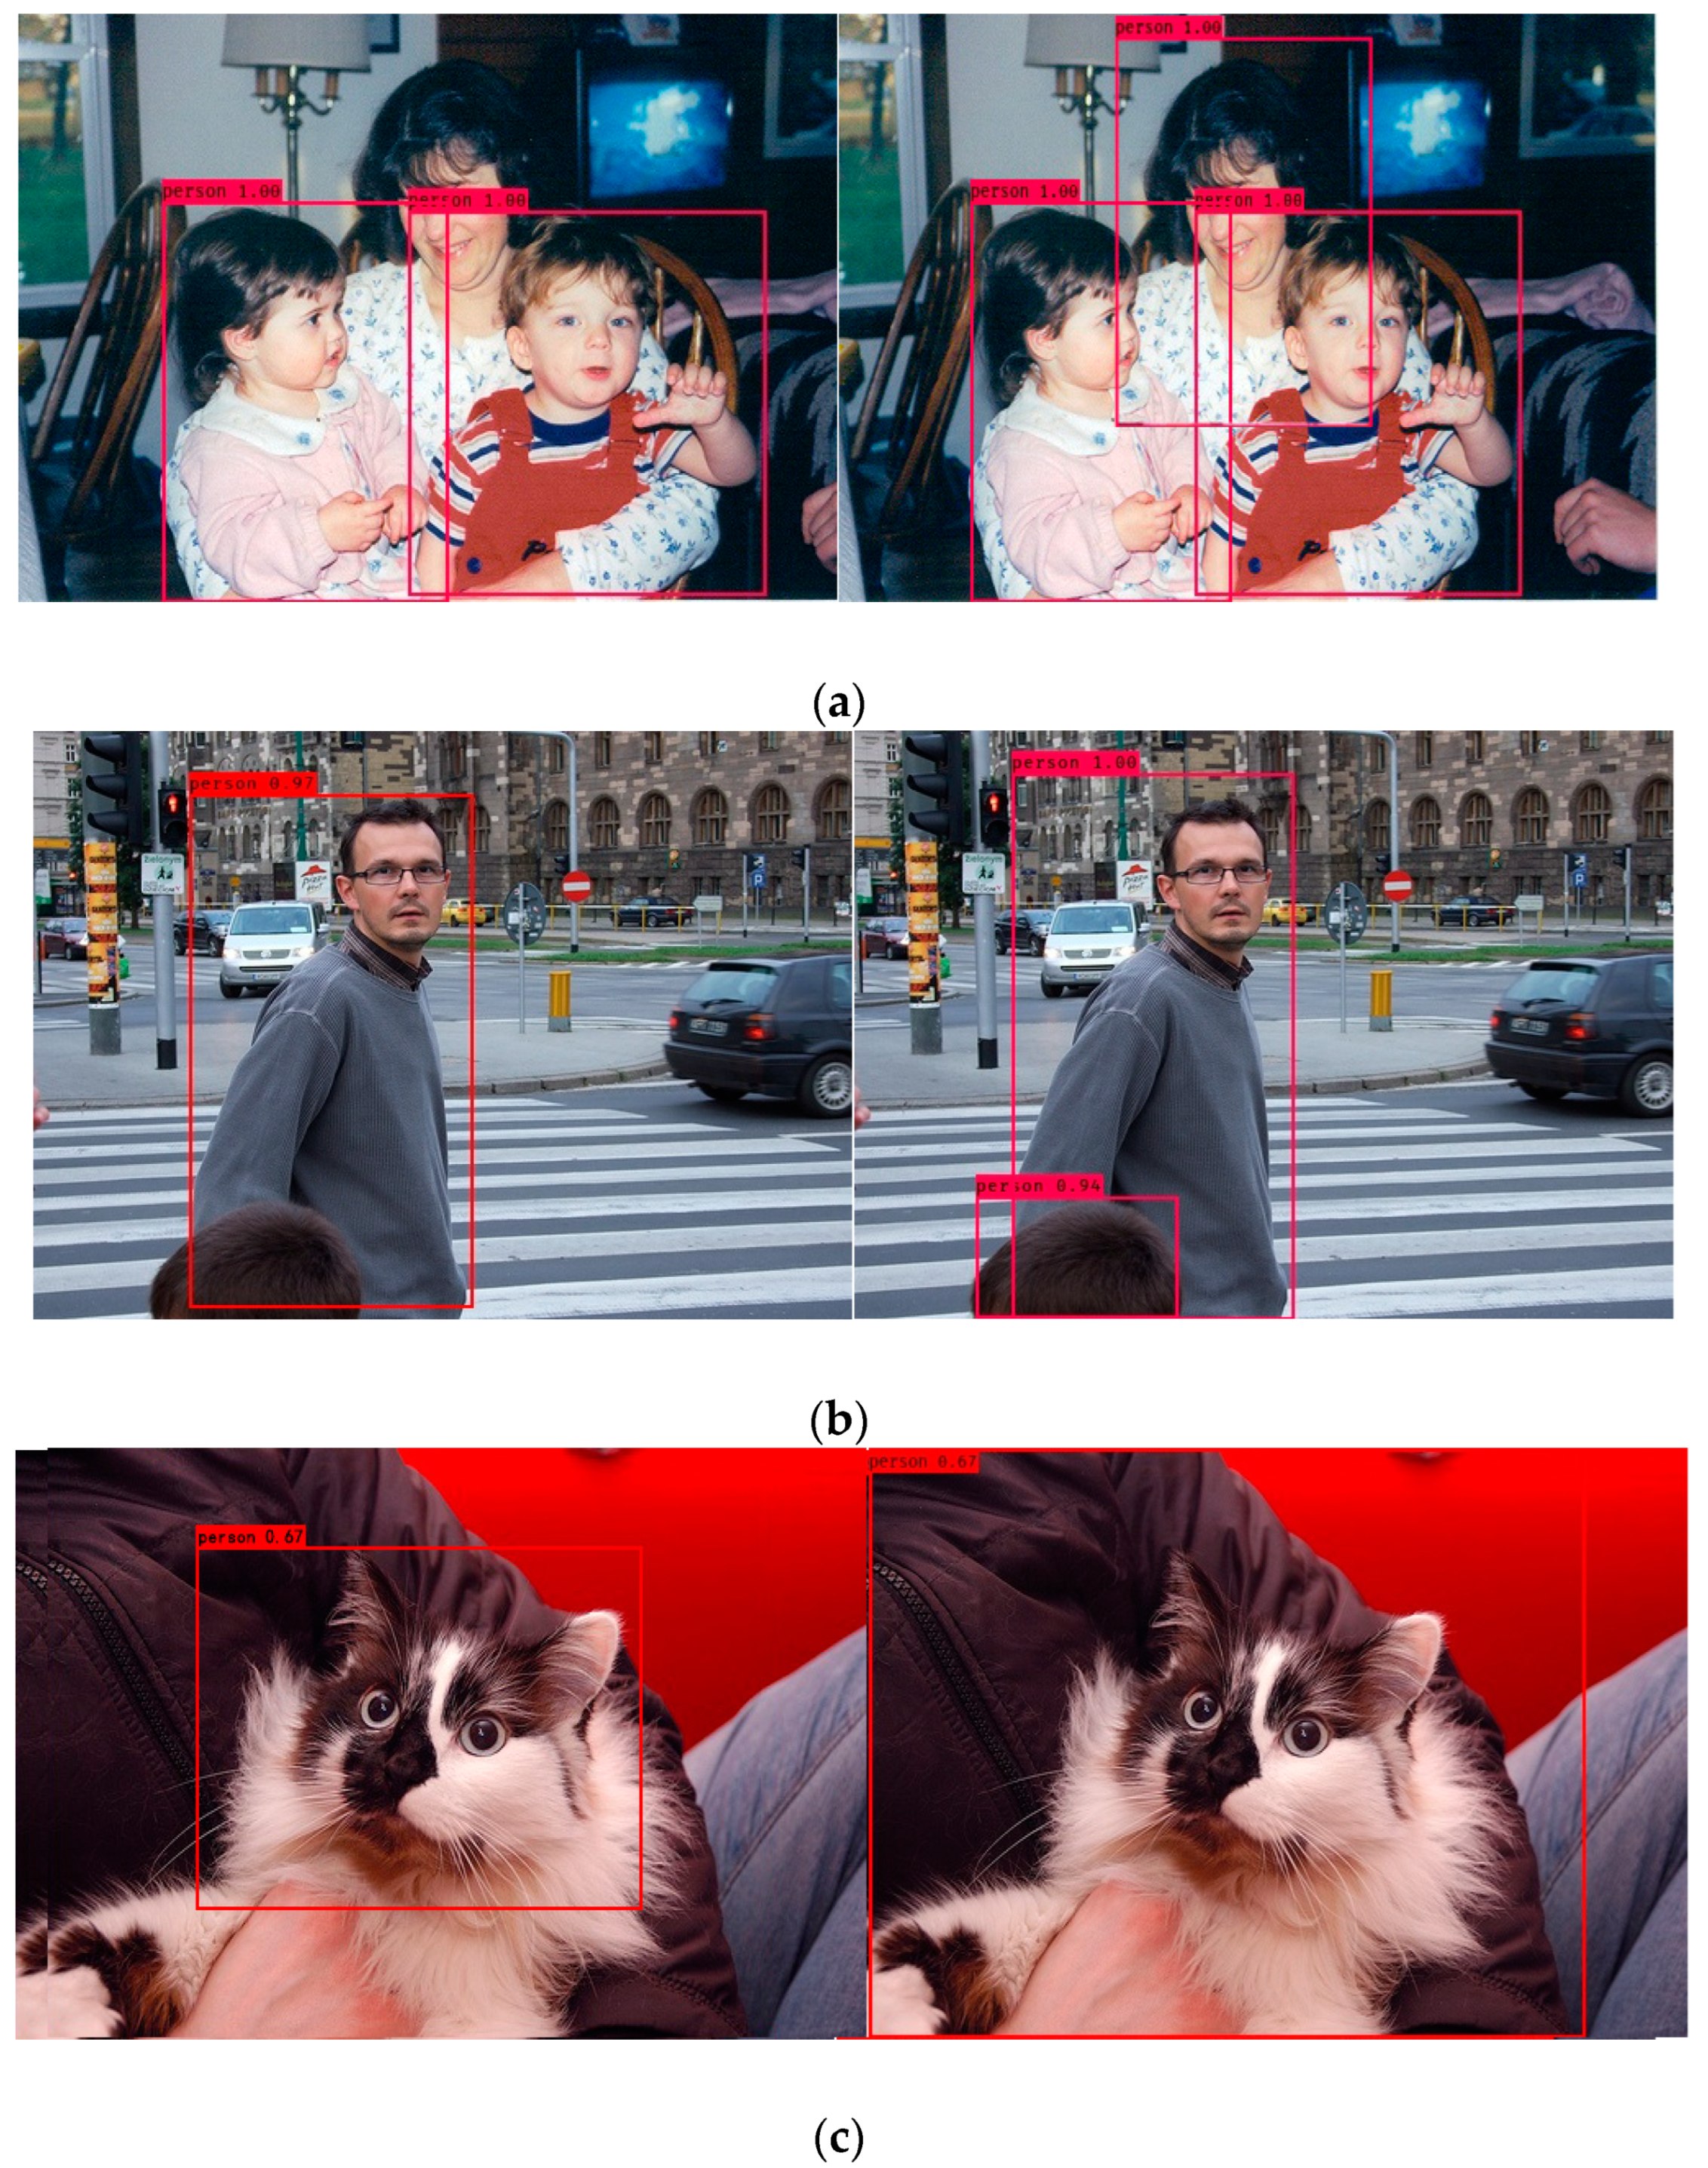
Figure 8 shows the detection and comparison results before and after improvement in the case of target occlusion. It can be seen from Figure 8 that the improved model can also avoid the occurrence of missed detection and misdetection in the occlusion of the same class (as shown in Figure 8a), other classes (as shown in Figure 8c), and partial pedestrian targets leaving the field of view (as shown in Figure 8b).
In addition, the p-R curves of training and testing of the improved model were counted, and the convergence was realized. The training accuracy and testing accuracy of the improved YOLO model were 82.21% and 72.02%, respectively. Compared with the model before improvement, the training accuracy and detection accuracy of the improved model were improved by 1.57% and 2.57%, respectively.

5.2. Pedestrian Tracking Verification and Result Analysis

A tracking experiment was carried out by combining the improved network model with the modified DeepSort algorithm in MOT-16, vehicle data recorder, and pedestrian video collected in a campus environment. Part of the video in the data set is used for model training and the other part is used for model testing.
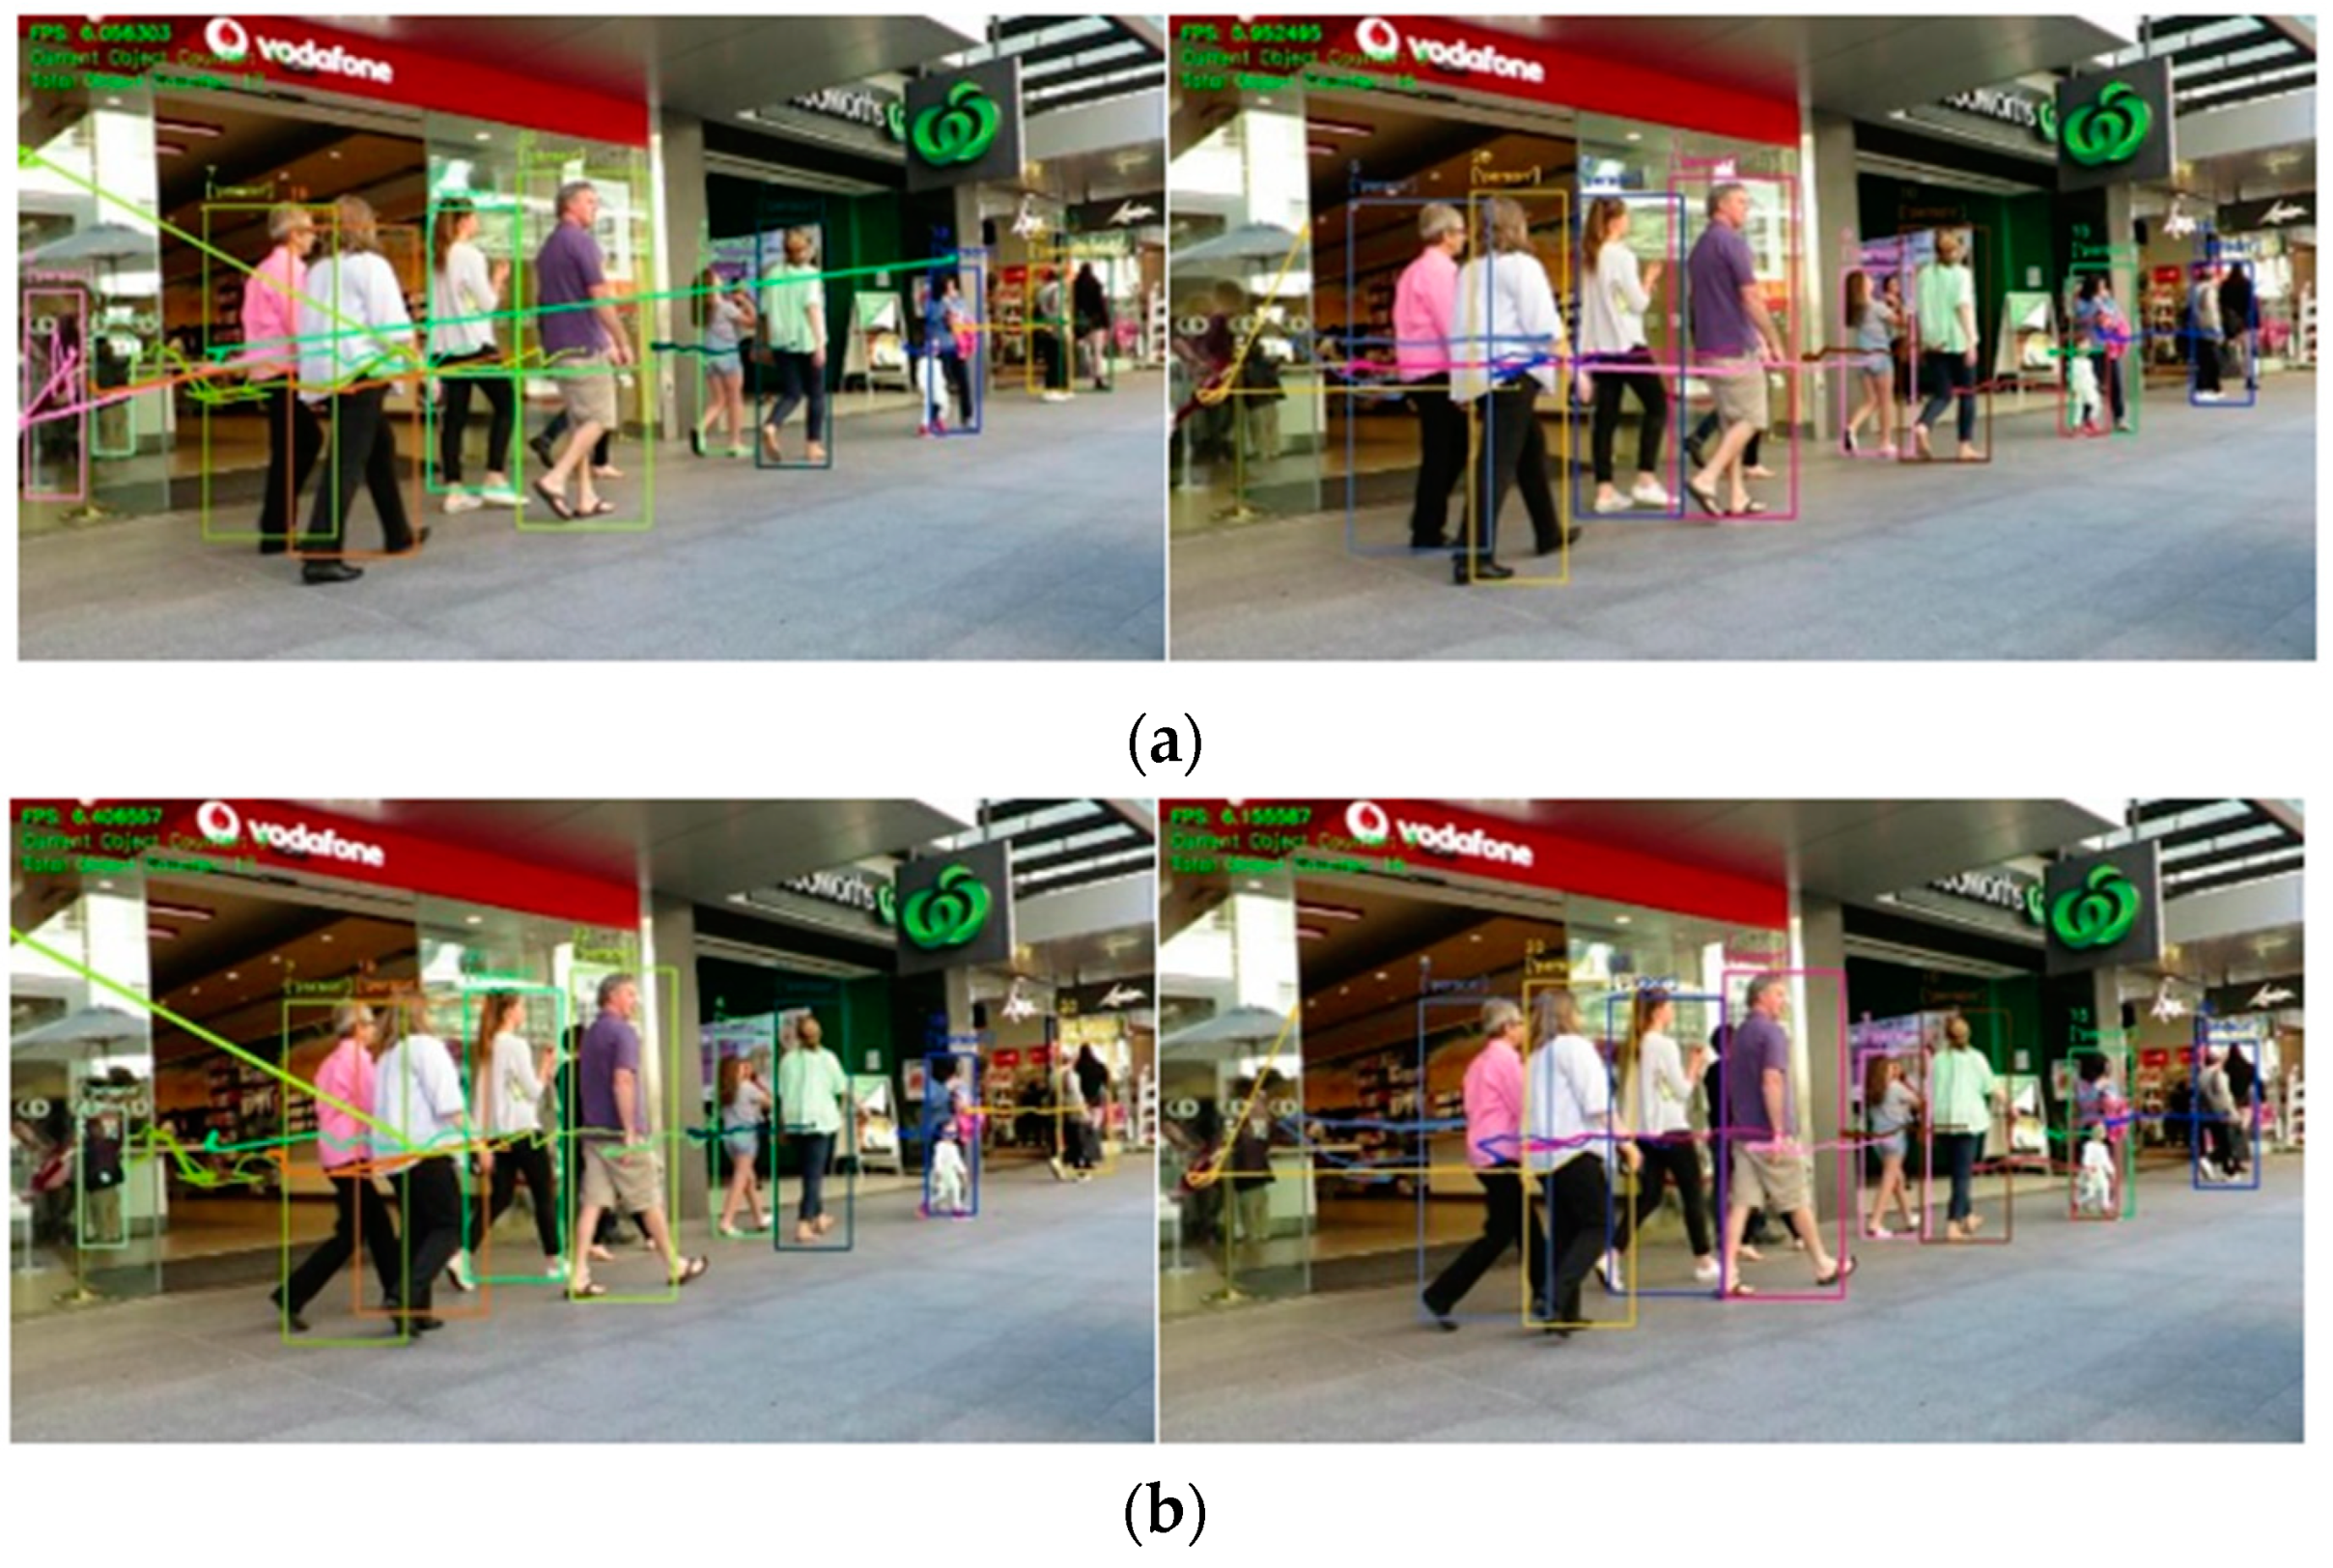
Figure 9 shows the comparison results of multi-target pedestrian tracking in the MOT-16 data set. It can be seen from Figure 9 that the tracking of the smallest child in the figure fails, but the improved YOLO model can achieve accurate tracking of the child in pedestrian tracking with a good tracking effect.
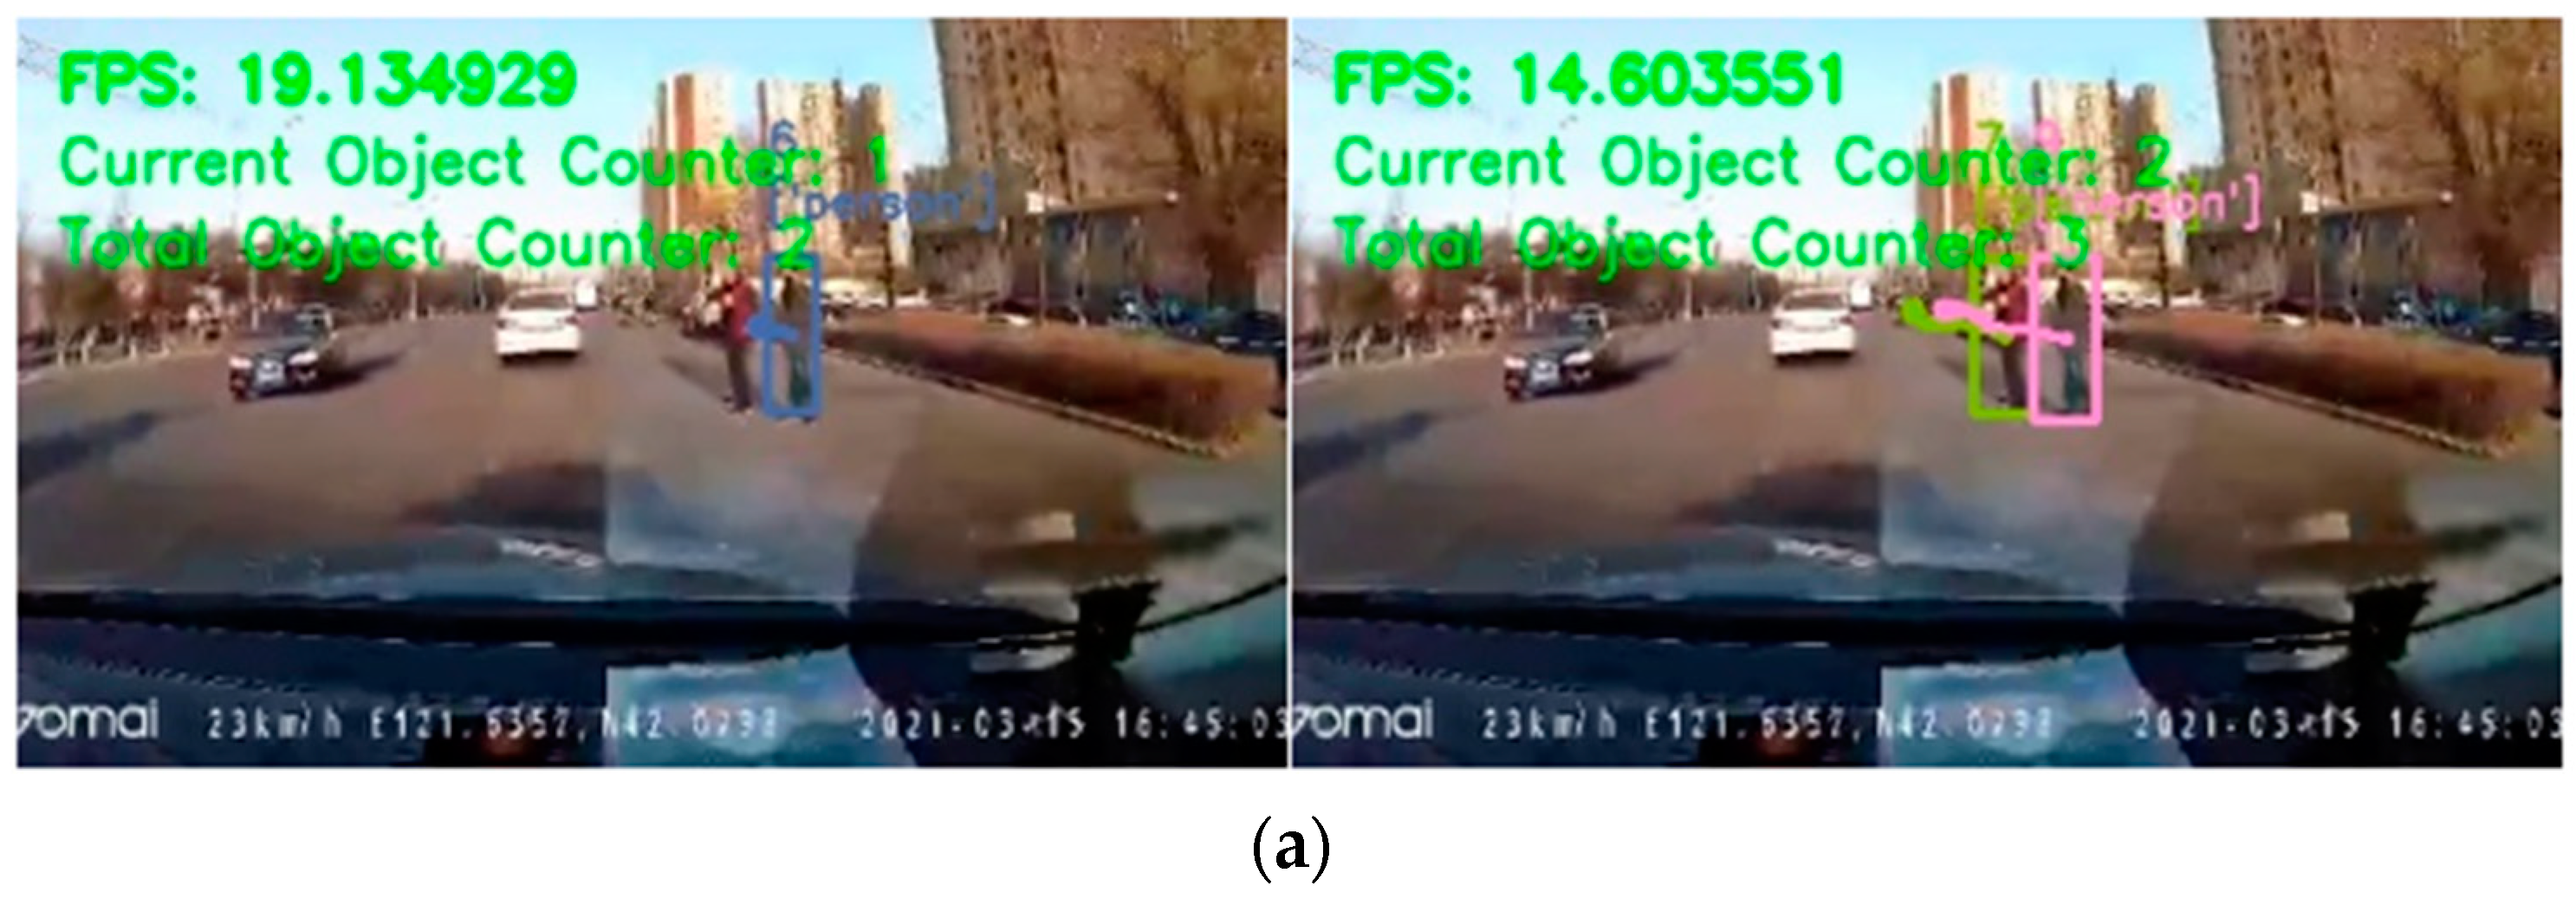
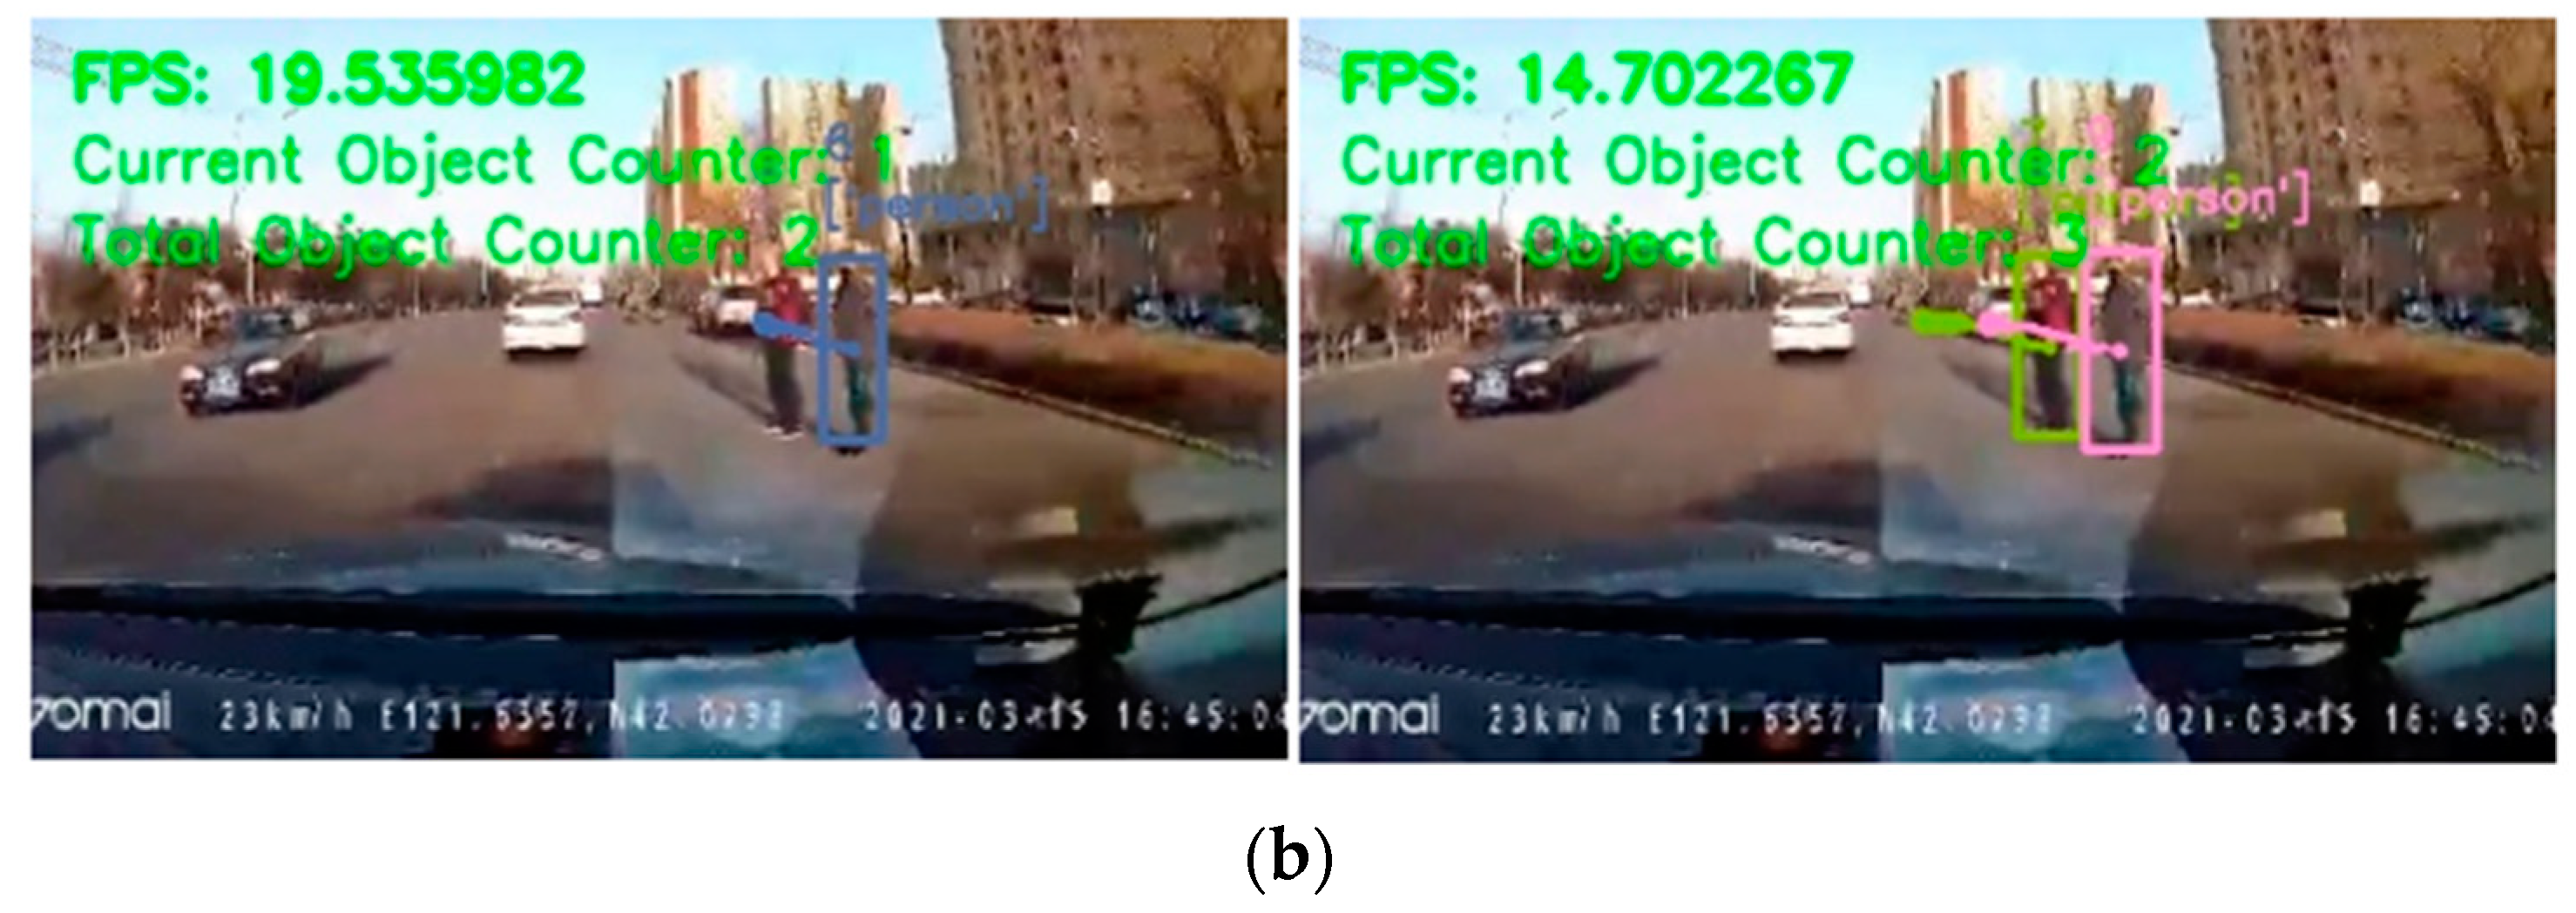
It can be seen from Figure 10 that only one pedestrian target was tracked in front of the vehicles in the left images, respectively, while the other pedestrian target failed to track. In the improved right images, both pedestrian targets can achieve accurate tracking.
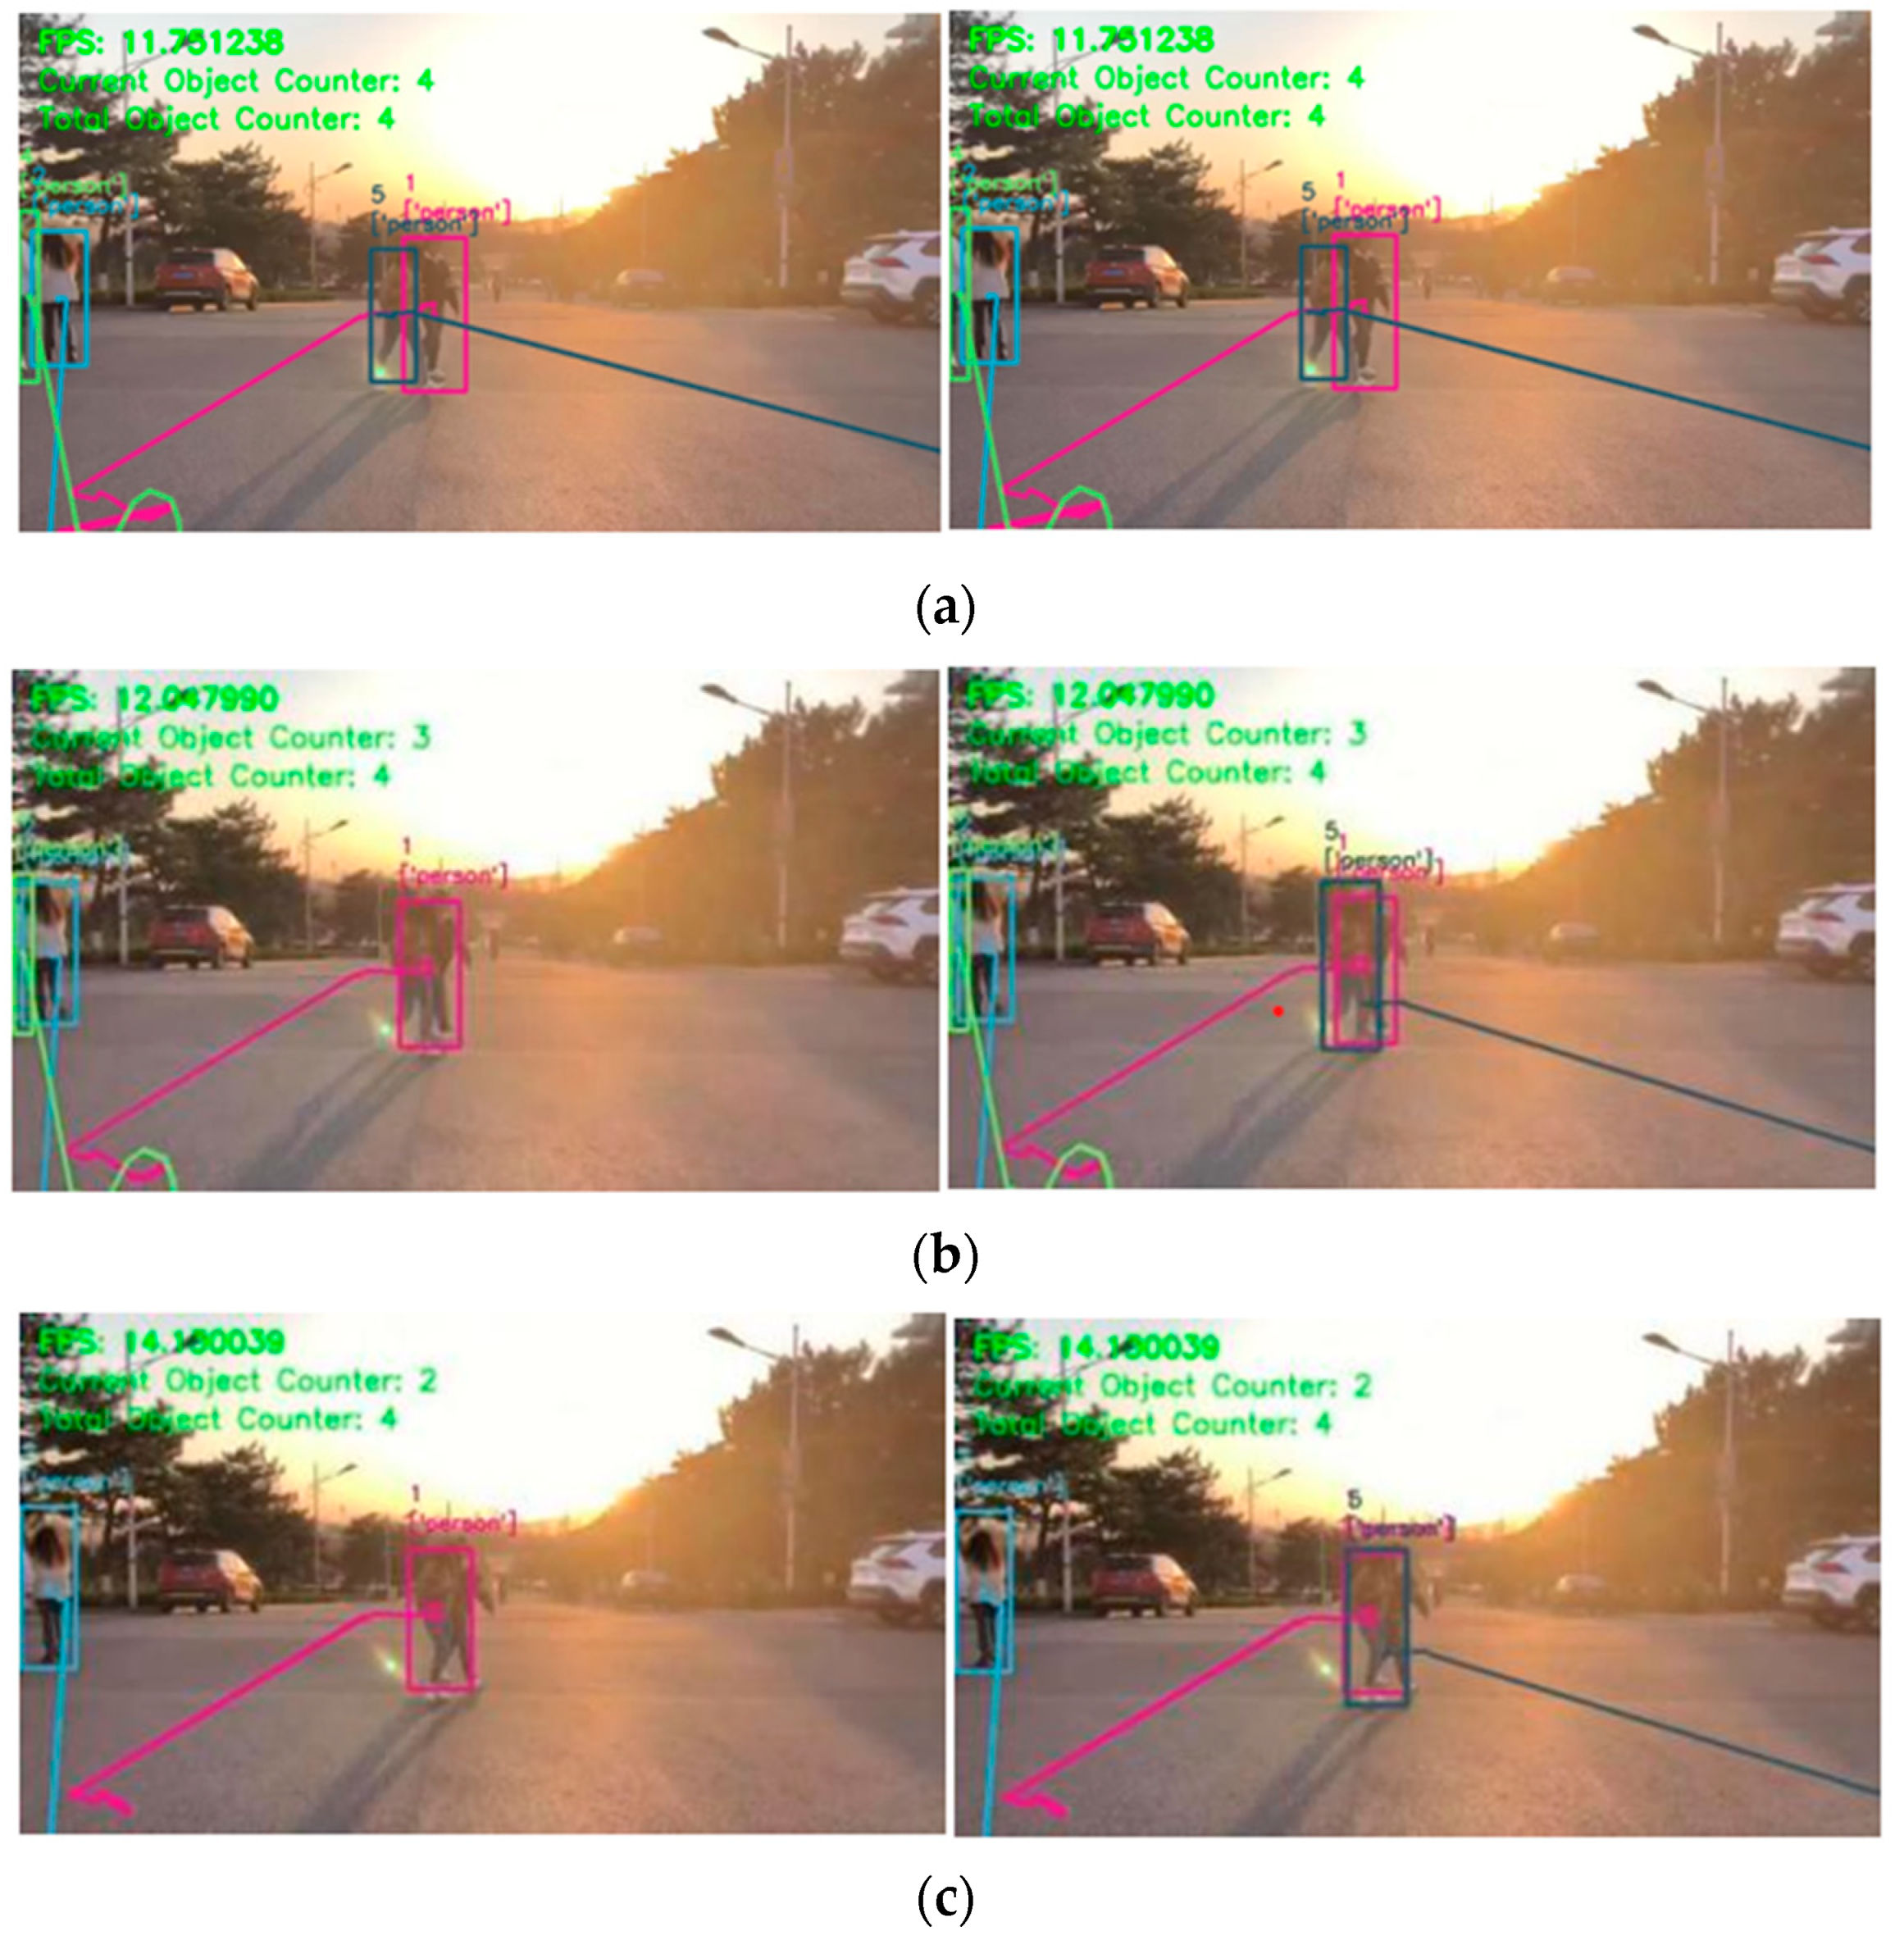
Figure 11 shows the comparison results of multi-target pedestrian tracking in a campus environment. It can be seen from Figure 11 that the tracking of pedestrian targets in different frames on the left of each image is lost, while in the image of each frame on the right after improvement, both pedestrian targets can achieve accurate tracking.
As can be seen from Table 2, the tracking effect based on the improved YOLO detection model was better, and the pedestrian tracking accuracy MOTA and pedestrian tracking precision MOTP were higher. The index value (MT) that is higher than 80% of the track is tracked as higher. The value (ML) that is less than 20% of the trajectory as an untracked parameter is lower. The target trajectory interrupt times (FM) were lower at the same time. The evaluation index IDSW represents the switching times of the identity ID of the tracking track matching, which is used to measure the ability of the model to deal with an occlusion problem. If the identity ID of the pedestrian remains unchanged after occlusion, the target before and after occlusion is judged to be the same, indicating accurate tracking. It is found in the table that the IDSW value of the improved model was lower, which indicates that the model had a better ability to deal with occlusion. The evaluation index FPS is used to measure the processing speed and real-time performance of the model for each frame of video; the value had little change, indicating that it can meet the requirements of real-time performance. It shows that the tracking algorithm based on the improved YOLO detection model had better tracking trajectory integrity and timeliness.

6. Conclusions

(1)
The channel attention module (CAM) and spatial attention module (SAM) were introduced and spliced to the rear of a YOLO backbone network Darknet-53, which improved the representation ability of important feature information of the model.
(2)
Based on the improved YOLO network, a DeepSort pedestrian tracking method was designed. A Kalman filtering algorithm was used to estimate the pedestrian state. Mahalanobis distance and apparent feature indexes were used to calculate the similarity between the detection frame and predicted pedestrian trajectory; the optimal matching of a pedestrian target was achieved by a Hungarian algorithm. According to official statistics, the test accuracy of the YOLO model was only 55.3%. The training accuracy and testing accuracy of the YOLO model before improvement were 80.64% and 69.45%, respectively. The improved YOLOv3 pedestrian detection model and DeepSort pedestrian tracking method were compared and verified in the same experimental environment. The training accuracy and testing accuracy of the improved YOLO model were 82.21% and 72.02%, respectively. Compared with the model before improvement, the training accuracy and detection accuracy of the improved model were improved by 1.57% and 2.57%, respectively. The verification results showed that the improved pedestrian detection model had a stronger ability to deal with occlusion and accurately detected missed and misdetected images, which solved the tracking failure caused by occlusion before improvement.
(3)
The network model and tracking method before and after the improvement were compared and verified. The improved network model can effectively reduce the rate of missed detection and false detection caused by target occlusion and improve the tracking failure caused by occlusion. The main performance was as follows: pedestrian tracking accuracy MOTA and accuracy MOTP were improved, tracking track integrity MT was improved, the track interruption frequency FM was significantly reduced in the tracking process, the IDSW value was significantly improved, and it had a better ability to deal with occlusion.
(4)
This paper mainly focuses on the special cases of missing detection, misdetection, and tracking failure caused by small pedestrians with multiple targets and partially blocked pedestrians in a dim driving environment and solves the problems of multi-target tracking failure caused by occlusion. The research results of this paper have important reference value for theoretical research and development of a human–vehicle collision avoidance system, such as the ADAS system, intelligent vehicle system, AEB system, and so on.

Author Contributions

Conceptualization, X.C.; methodology, Y.J.; investigation, X.T.; validation, Z.L. All authors have read and agreed to the published version of the manuscript.

Funding

The author(s) disclosed receipt of the following financial support for the research, authorship, and/or publication of this article: this work was supported, in part, by the Natural Science Foundation of China under grants 61473139 and 61622303, the project of the Natural Science Foundation of Liaoning Province of China 2019-MS-168, and the project for Distinguished Professor of Liaoning Province.

Data Availability Statement

In this article, the data set PD-2022 was created based on all kinds of public data sets, such as the COCO data set, VOC 2017.

Conflicts of Interest

The author(s) declared no potential conflict of interest with respect to the research, authorship, and/or publication of this article.

References

  1. Sun, S.J.; Akhtar, N.; Song, H.; Mian, A.; Shah, M. Deep Affinity Network for Multiple Object Tracking. IEEE Trans. Pattern Anal. Mach. Intell. 2019, 43, 104–119. [Google Scholar] [CrossRef] [PubMed] [Green Version]
  2. Gopal, D.G.; Jerlin, M.A.; Abirami, M. A smart parking system using IoT. World Rev. Entrep. Manag. Sustain. Dev. 2019, 15, 335–345. [Google Scholar] [CrossRef]
  3. Nagarajan, S.M.; Chatterjee, P.; Alnumay, W.; Muthukumaran, V. Integration of IoT based routing process for food supply chain management in sustainable smart cities. Sustain. Cities Soc. 2022, 76, 103448. [Google Scholar] [CrossRef]
  4. Nagarajan, S.M.; Chatterjee, P.; Alnumay, W.; Ghosh, U. Effective task scheduling algorithm with deep learning for Internet of Health Things (IoHT) in sustainable smart cities. Sustain. Cities Soc. 2021, 71, 102945. [Google Scholar] [CrossRef]
  5. Girshick, R.; Donahue, J.; Darrell, T. Rich feature hierarchies for accurate object detection and semantic segmentation. In Proceedings of the Computer Vision and Pattern Recognition, Piscataway, NJ, USA, 22 October 2014; pp. 580–587. [Google Scholar]
  6. Nam, W.; Dollar, P.; Han, J.H. Local decorrelation for improved pedestrian detection. In Proceedings of the Advances in Neural Information Processing Systems, New York, NY, USA, 8–13 December 2014; pp. 424–432. [Google Scholar]
  7. Redmon, J.; Divvala, S.; Girshick, R. You only look once: Unified, real-time object detection. In Proceedings of the IEEE Conference on Computer Vision and Pattern Recognition, Las Vegas, NV, USA, 9 May 2016; pp. 779–788. [Google Scholar]
  8. Li, J.; Liang, X.; Shen, S.M. Scale-aware fast r-cnn for pedestrian detection. IEEE Trans. Multimed. 2018, 17, 985–996. [Google Scholar] [CrossRef] [Green Version]
  9. Gao, Z.; Li, S.B.; Chen, J.N.; Li, Z.J. Pedestrian Detection Method Based on YOLO Network. Comput. Eng. 2018, 44, 215–219. [Google Scholar]
  10. Feng, Y.; Li, J.Z. Improved convolutionanl neural network pedestrian detection method. Comput. Eng. Des. 2020, 41, 1452–1457. [Google Scholar]
  11. Wojke, N.; Bewley, A.; Paulus, D. Simple Online and Realtime Tracking with a Deep Association Metric. In Proceedings of the 2017 IEEE International Conference on Image Processing (ICIP), Beijing, China, 17–20 September 2017. [Google Scholar]
  12. Ma, C.; Yang, C.; Yang, F.; Zhuang, Y.; Zhang, Z.; Jia, H.; Xie, X. Trajectory factory: Tracklet cleaving and re-connection by deep siamese bi-gru for multiple object tracking. In Proceedings of the 2018 IEEE International Conference on Multimedia and Expo (ICME), San Diego, CA, USA, 23–27 July 2018; pp. 1–6. [Google Scholar]
  13. Zhu, J.; Yang, H.; Liu, N.; Kim, M.; Zhang, W.; Yang, M.-H. Online multi-object tracking with dual matching attention networks. In Proceedings of the European Conference on Computer Vision (ECCV), Munich, Germany, 8–14 September 2018; pp. 366–382. [Google Scholar]
  14. Wang, Z.Y.; Miao, D.Q.; Zhao, C.R.; Luo, S.; Wei, Z.H. A Pedestrian Tracking Algorithm Based on Multi-Granularity Feature. J. Comput. Res. Dev. 2020, 57, 996–1002. [Google Scholar]
  15. Li, Y.; Zhang, H.; Liang, X.; Huang, B. Event-triggered based distributed cooperative energy management for multienergy systems. IEEE Trans. Ind. Inf. 2019, 15, 2008–2022. [Google Scholar] [CrossRef]
  16. Li, Y.; Gao, D.W.; Gao, W.; Zhang, H.; Zhou, J. A Distributed Double-Newton Descent Algorithm for Cooperative Energy Management of Multiple Energy Bodies in Energy Internet. IEEE Trans. Ind. Inf. 2021, 17, 5993–6003. [Google Scholar] [CrossRef]
  17. Zhang, N.; Sun, Q.; Yang, L.; Li, Y. Event-Triggered Distributed Hybrid Control Scheme for the Integrated Energy System. IEEE Trans. Ind. Inform. 2022, 18, 835–846. [Google Scholar] [CrossRef]
  18. Yang, L.; Sun, Q.; Zhang, N.; Li, Y. Indirect Multi-energy Transactions of Energy Internet with Deep Reinforcement Learning Approach. IEEE Trans. Power Syst. 2022. [Google Scholar] [CrossRef]
  19. Saravanan, R. Selfish node detection based on evidence by trust authority and selfish replica allocation in danet. Int. J. Inf. Commun. Technol. 2016, 9, 473–491. [Google Scholar]
  20. Palanisamy, S.; Sankar, S.; Somula, R. Communication Trust and Energy-Aware Routing Protocol for WSN Using DS Theory. Int. J. Grid High Perform. Comput. 2021, 13, 24–36. [Google Scholar] [CrossRef]
Figure 1. CBAM architecture.
Sustainability 14 09281 g001
Figure 2. Channel attention module.
Sustainability 14 09281 g002
Figure 3. Spatial attention module.
Sustainability 14 09281 g003
Figure 4. YOLO+CBAM model architecture.
Sustainability 14 09281 g004
Figure 5. DeepSort pedestrian tracking process.
Sustainability 14 09281 g005
Figure 6. Detailed process of pedestrian tracking.
Sustainability 14 09281 g006
Figure 7. Comparison of detection results on each frame image in campus environment. (a) Detection results (left) and improved results (right) of 15 frames. (b) Detection results (left) and improved results (right) of 18 frames. (c) Detection results (left) and improved results (right) of 21 frames. (d) Detection results (left) and improved results (right) of 24 frames.
Sustainability 14 09281 g007
Figure 8. Comparison of image detection results with target occlusion in random environment. (a) Detection results before (left) and after (right) improvement in the target occlusion of the same class. (b) Detection results before (left) and after (right) improvement in the occlusion of the partial target leaving the field of view improvement. (c) Detection results before (left) and after (right) improvement in the occlusion of other classes’ target.
Sustainability 14 09281 g008
Figure 9. Comparison of multi-target pedestrian tracking results in the MOT-16 data set. (a) Tracking results of frame 357 before (left) and after (right) improvement. (b) Tracking results of frame 364 before (left) and after (right) improvement.
Sustainability 14 09281 g009
Figure 10. Comparison of multi-target pedestrian tracking results in vehicle data recorder. (a) Tracking results of frame 208 before (left) and after (right) improvement. (b) Tracking results of frame 215 before (left) and after (right) improvement.
Sustainability 14 09281 g010aSustainability 14 09281 g010b
Figure 11. Comparison of multi-target pedestrian tracking results in a campus environment. (a) Tracking results of frame 22 before (left) and after (right) improvement. (b) Tracking results of frame 26 before (left) and after (right) improvement. (c) Tracking results of frame 31 before (left) and after (right) improvement.
Sustainability 14 09281 g011
Table 1. Cosine deep feature network structure.
Network TypeFilter SizeOutput Size
Convolution layer3 × 3/132 × 128 × 64
Maximum pooling layer3 × 3/232 × 64 × 32
Residual block3 × 3/132 × 64 × 32
Residual block3 × 3/232 × 64 × 16
Residual block3 × 3/132 × 64 × 16
Residual block3 × 3/2128 × 16 × 8
Residual block3 × 3/1128 × 16 × 8
Fully connected layer 128
L2 normalized layer 128
Table 2. Statistical results of pedestrian tracking evaluation indicators.
ModelMOTAMOTPMTMLFMIDSWFPS
YOLO+DeepSort4960.112422.698661136
Improved YOLO+DeepSort53.862.1228.221.824112033
Publisher’s Note: MDPI stays neutral with regard to jurisdictional claims in published maps and institutional affiliations.