Article

Experimental Study of the Fluctuating Wind Characteristics of Typhoon Jangmi Measured at the Top of a Building

1
School of Civil Engineering, Taizhou University, Jiaojiang 318000, China
2
State Key Laboratory of Mountain Bridge and Tunnel Engineering, Chongqing Jiaotong University, Chongqing 400074, China
3
Key Laboratory of Intelligent Lifeline Protection and Emergency Technology for Resident Aty, Wenzhou University of Technology, Wenzhou 150080, China
4
School of Civil Engineering and Architecture, Zhejiang SCI-TECH University, Hangzhou 310018, China
*
Author to whom correspondence should be addressed.
Sustainability 2022, 14(15), 9266; https://doi.org/10.3390/su14159266
Submission received: 15 May 2022 / Revised: 18 July 2022 / Accepted: 21 July 2022 / Published: 28 July 2022

Abstract

:
Based on wind field data measured during the landfall of Typhoon Jangmi in Wenzhou in 2008, this study analyzes wind field characteristics, including wind speed, wind direction, probability density, turbulence intensity, gust factor, peak factor, power spectrum, turbulence integral scale, coherence, and the autocorrelation coefficient of Typhoon Jangmi. Results showed that the wind field characteristics for the east and west measuring points were basically the same and followed an approximately similar pattern. The probability density of fluctuating wind tends to obey a Gaussian distribution. The turbulence intensity gradually decreases with increasing 10 min averaged wind speed, but the reduction rate gradually drops. The turbulence intensity is affected by the change in a time interval because turbulence intensity decreases as the time interval increases. With an increase in the 10 min average wind speed and time interval, the gust factor decreases. The peak factor decreases, though insignificantly, with increasing mean wind speed, and the distribution of peak factors is greatly scattered. The variation in the peak factor with time is in good agreement with the Durst curve. The gust factor increases as the turbulence intensity increases and is in line with the empirical curves of Ishizaki, Choi, and Cao. The power spectra of the fluctuating wind speed of Typhoon Jangmi in all directions agree well with Von Karman’s empirical spectrum. The turbulence integral scale increases slightly with increasing average wind speed, and the distribution is relatively scattered. The coherence of the fluctuating wind speed components matches the exponential function proposed by Davenport, and the autocorrelation coefficient decreases as τ increases.

1. Introduction

Numerous studies reveal that wind disasters are the leading source of human casualties and property damage [1,2], ranking first among all types of natural disaster losses owing to their high frequency, huge secondary effects, and broad-ranging influence [3,4,5,6]. Wind-induced damage has been a major source of concern in recent years. Many domestic and international scholars have conducted in-depth studies on wind characteristics to further explore the mechanisms of wind catastrophes via field measurements [7,8,9,10], numerical simulation [2,11], and wind tunnel testing [12,13].
Numerical simulation is usually based on computational fluid dynamics, which simulate the wind fields of canyons, hills, and other complex terrains, so as to determine the distribution law of the wind characteristics at various locations in the region. For example, large eddy simulation (LES) is used to simulate turbulence [14]. Ren et al. used CFD to simulate the spatial wind field of complex terrain and LES to simulate the turbulent behavior of the spatial wind field, respectively and established a spatial wind field prediction model, which is feasible compared with the measured wind characteristics [15]. Huang et al. used CFD to evaluate the effects of wind on high-rise structures, and they recommended that the incident wind speed profile and turbulence intensity profile be accurately predicted after comparing the observed data [16]. Additionally, Feng et al. studied the wind steering effect of super high-rise buildings by using CFD and LES systems, respectively, and discussed the flow mechanism in depth [17]. CFD can accurately simulate the wind field of complex terrains on a small scale and get the quantitative results of the flow field quickly, which saves human and material resources and is less disturbed, but it is also limited by boundary conditions, so it is difficult to simulate the real mesoscale circulation information.
Although wind characteristics could be discussed and analyzed in a variety of ways, there are still various obstacles that make it difficult to master, owing to the complexity and randomness of wind [10,18,19]. In contrast to theoretical research and numerical simulation methods, many scholars, both at home and abroad, believe that wind tunnel testing methods could simulate turbulent flow and complex terrain in addition to having the benefits of easy control, convenient modeling, and the repeatability of test parameters [20,21,22]. Li et al. used four simplified valley models and a 1:500 scale replica of genuine valley terrain to study the wind characteristics in hilly valley terrain. The relationship between slopes and velocity speed-up, as well as the average wind flow and longitudinal turbulence intensity, were discussed and analyzed, and the results discovered that topographic feature of a more complicated valley terrain might cause perturbation to the general wind characteristics [23]. Meanwhile, a model of a deep-cutting gorge was made in a wind tunnel by Li et al. to study the wind characteristics at the bridge site. Results showed that the wind attack angle for wind resistance should be determined in the range of –6° to 2° [24]. A 1:40 scale model was made in a wind tunnel to analyze vehicle aerodynamics under different conditions in the vicinity of a single tower by Argemtini et al. [25]. Song et al. investigated the link between terrain and wind direction using wind data collected by a Doppler Sodar monitoring system mounted in a Y-shaped valley terrain. Additionally, a high-precision terrain model with a scale size of 1:1500 was employed in wind tunnel tests to supplement full-scale measurements. The findings revealed that the incoming flow field, particularly the shielding and channeling effects, had a considerable influence on wind deceleration and acceleration at the bridge location [26]. In summary, the wind tunnel test has become the most common approach for analyzing wind characteristics over complicated and varied terrain. Simultaneously to the development of wind tunnel tests, field measurement has been increasingly used to explore wind characteristics across coastal areas, owing to the use of such high-precision instruments as global position system (GPS) dropsonde, Doppler wind profiler, weather radar, and satellite.
Field measurement, being the most direct research method, is often used by many scholars to investigate wind characteristics and is an essential way to determine the wind resistance code for buildings due to its outstanding benefits. Zisis carried out a field measurement on low-rise buildings to investigate the mechanism of force transfer by wind pressure and force data [27]. Li et al. evaluated the wind parameters during a typhoon’s passage using wind data obtained by anemometers mounted on flat-roof and gable-roof buildings [28,29]. Wind characteristics such as probability distribution, auto-correlations, and power spectrum were presented and discussed based on field measurement data collected in Aylesbury [7]. Aiming to study wind effects on low-rise buildings and offer reliable full-scale observations for wind tunnel tests and numerical simulation, Li et al. conducted a full-scale experiment in a typhoon-prone area in China [30]. The wind rose diagram, mean wind speed and angle, and other wind characteristics were calculated in detail using real-time wind data from the structural health monitoring system (SHMS) of the Runyang suspension bridge. Meanwhile, the inhomogeneous wind properties of three strong winds, Typhoon Matsa, Typhoon Khanun, and Typhoon Northern, were compared [31]. At the same time, the wind data from a strong typhoon (Damrey) which an SHMS collected at the Sutong bridge, were studied to determine nonstationary wind properties, as well as the average wind speed, turbulence intensity, peak factor, and gust factor [32]. The mean wind speed and extreme wind duration were firstly obtained from an SHMS, and then the turbulence intensity and average wind speeds on cable vibrations of an ultra-long stay cable were analyzed. The results showed that the large-amplitude vibration of the ultra-long stay cables in high-wind conditions could be mitigated by the out-of-plane dampers [33]. Huang et al. and Peng et al. conducted an analysis of near-ground wind characteristics in Pudong, Shanghai, using a 3D ultrasonic wind instrument; the results revealed that the trends in attenuation coefficients that changed were consistent with the change in the mean wind speed and the turbulence intensity and gust factor were high when close to the ground [34,35]. To study the wind field characteristics near the ground, wind data during the passage of Typhoon Fung-Wong and Typhoon Morakot, collected by wind field instruments installed in the construction building of Wenzhou University, China, were analyzed in detail. The findings show that the probability density distribution obeys the Gaussian distribution and that the cross-power spectrum and modified Karman spectrum are perfectly consistent [10,36].
In this paper, to better understand the wind field environment of China’s coastal areas, detailed research of the wind characteristics, such as mean wind speed and angle, turbulence density, gust factor, cross-correlation, and auto-correlation were calculated and discussed based on wind data collected from wind field instruments installed in the construction building of Wenzhou University during Typhoon Jangmi’s passage. The findings of this study can be utilized as a guide for wind resistance design in this region.

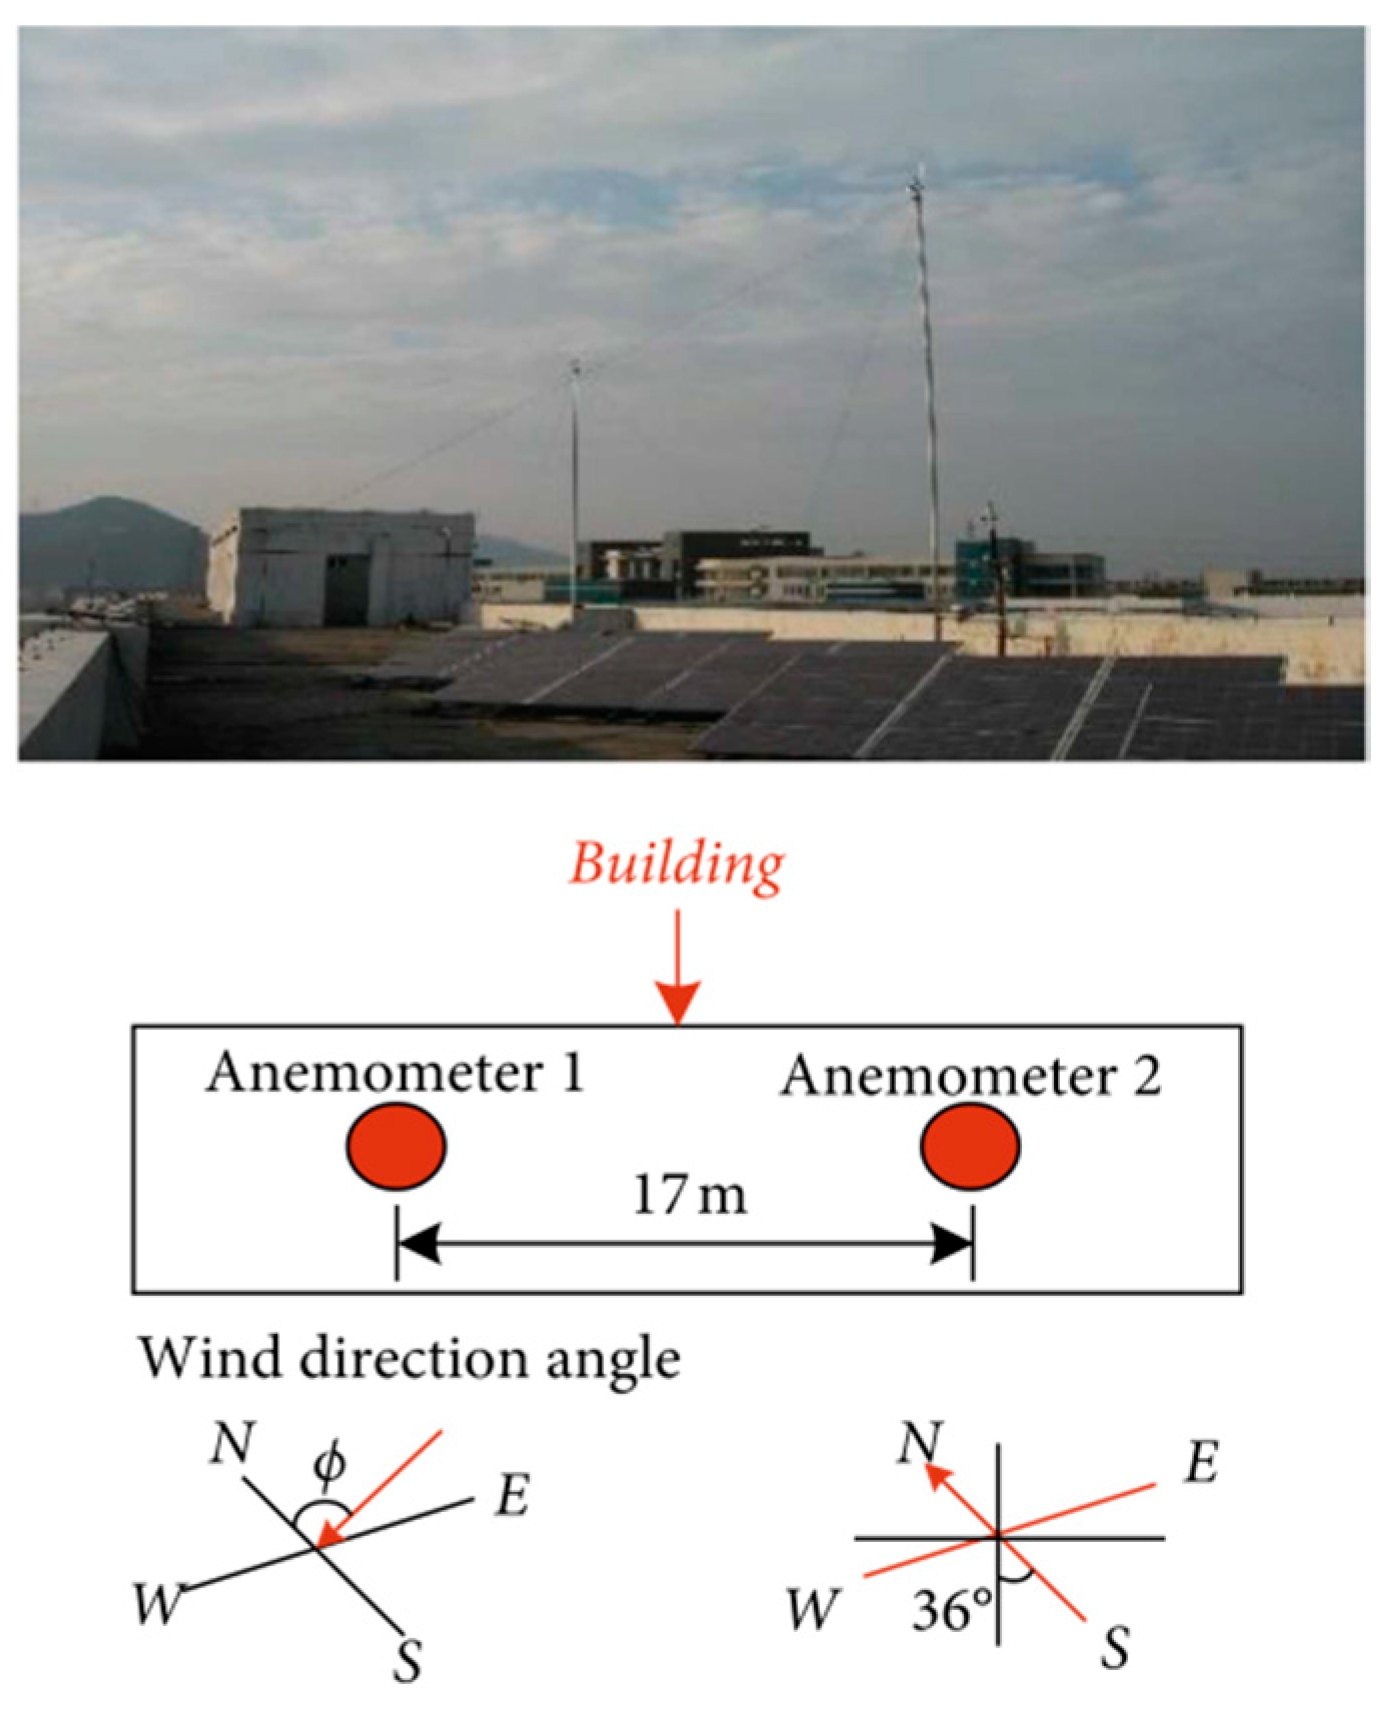
2. Typhoon Jangmi and Wind Speed Measurement

Typhoon Jangmi formed on 24 September 2008 and developed into a Category 5 super typhoon on the 27th, making landfall near Nanao Township, Yilan County, Taiwan Province, at around 15:40. At 05:00, on 30 September, the center of the severe Tropical Storm Jangmi was located at sea, about 200 km east of Wenzhou. The maximum wind speed near the center was 25 m/s (Beaufort scale 10), the radius of the 7th wind circle was 200 km, and the radius of the 10th wind circle was 50 km. It weakened to an extratropical cyclone on 1 October. Jangmi was the 15th named tropical storm of the 2008 Pacific typhoon season and the strongest tropical storm over the western Pacific Ocean that year. It was characterized by rapid development, high intensity, a large affected area, and a complex path in its later stage. Two WJ-3 anemometers were placed at the same height on top of the architectural engineering building at Wenzhou University, which served as the wind field measurement location. The anemometers were mounted on 9 m-high straight bars, 30 m above the ground and 17 m apart (horizontally), to prevent any interference with the measurement of the wind field above the structure. A DH-5937 data acquisition system was used to record and collect data, with a sampling frequency of 20 Hz. Data were collected from 29 September 2008, with a total duration of 42 h, and the maximum observed instantaneous wind speed was 14.14 m/s. The fundamental time period used to split the sample was 10 min. The track of the typhoon and the arrangement of the anemometers are shown in Figure 1 and Figure 2, respectively [36].

3. Research on the Wind Characteristics of the Typhoon

3.1. Mean Wind Speed and Direction

During the field measurement, the wind direction increased clockwise, with the due north representing a wind direction of θ 0° and the due south representing a wind direction of θ 180°. The two components of horizontal wind speed are u x t and u y t , and they are decomposed in accordance with Formulas (1) and (2) as:
u x t = u t cos ϕ t
u y t = u t sin ϕ t
where u x t is the north–south component and u y t is the east–west component. With the fundamental time period t = 10 min, mean wind speed U and main wind direction θ   can be computed using vector decomposition as follows:
U = u x t ¯ 2 + u y t ¯ 2
cos θ = u x t ¯ / U
sin θ = u y t ¯ / U
and:
u x t ¯ = 1 n i = 1 n u x t
u y t ¯ = 1 n i = 1 n u y t
where u x t ¯ and u y t ¯ are the 10 min averaged wind speeds of u x t and u y t , respectively; and n is the number of samples over the time interval of t = 10 min.

3.2. Turbulence Intensity

Turbulence intensity is defined as the ratio of the standard deviation of fluctuating wind speed to the wind speed averaged over the time interval of t (in this paper, t = 10 min). It describes the variation degree of wind speed with time and space, reflecting the strength of the fluctuating wind, and is a major scale characterizing the strength of atmospheric turbulence. The turbulence intensities of longitudinal fluctuating wind speed u(t) and lateral fluctuating wind speed v(t) can be expressed as follows:
I i = σ i U i = u , v
where σ i is the root mean square of the longitudinal and lateral fluctuating wind speeds over the time interval of t. The fluctuating wind speed is the projection of the u x t sum of the horizontal wind speed components in the u y t longitudinal direction (the main wind direction, generally denoted as the u direction) and the lateral direction (perpendicular to the main wind direction, generally denoted as the v direction). The longitudinal u t and lateral v t fluctuating wind speeds can be calculated by:
u t = u x t cos φ + u y t sin φ U
v t = u x t sin φ + u y t cos φ
In consideration of its variation with the time interval, the longitudinal turbulence intensity over a specific time interval is expressed as follows, which is different from that over a general time interval:
SD u ( T , t ) = i = 1 n u i 2 ( t ) / N 1 U T
where u i is the longitudinal fluctuating wind speed. In this paper, T is 1 h; U T is the 1-h averaged wind speed; and t is the time interval variable, N = T / t .

3.3. Gust Factor

The gust factor reflects the instantaneous intensity of the fluctuating wind and is a physical quantity to describe the degree of fluctuation in the wind. It is generally defined as the ratio of the maximum gust wind speed over a short time interval t g (3 s in this paper) to the wind speed averaged over a longer time interval (10 min in this paper), and its formula is as follows:
G u t g = max ( u ( t g ¯ ) ) U + 1
where max ( u ( t g ¯ ) ) and max ( v ( t g ¯ ) ) are the maximum wind speeds of the longitudinal and lateral fluctuating winds averaged over a short time interval t g , respectively.

3.4. Peak Factor

The instantaneous intensity of fluctuating wind can also be expressed by the peak factor:
g u =   U ^ t g U / σ u
where σ u is the standard deviation of the longitudinal fluctuating wind speed, and   U ^ t is the maximum mean wind speed over the time interval of t.

3.5. Gust Factor and Turbulence Intensity

Turbulence intensity and gust factor are not independent. Ishizaki [37] derived the empirical relationship between turbulence intensity and gust factor based on typhoon data, which reads as the formula below:
G u = 1 + aI u b ln ( T / t g )
where T is the average time interval, and t g is the gust duration. Ishizaki [37] suggested that a = 0.5 and b = 1.0.
Choi et al. [38] improved Formula (1) based on measured data and suggested that a = 0.62 and b = 1.27. Cao et al. [39] fitted Formula (1) based on the measured data of Typhoon Maemi, and the results obtained after fitting were a = 0.5 and b = 1.15.

3.6. Power Spectrum

In accordance with Kolmogorov theory, many scholars have proposed various power spectrum functions for fluctuating wind, among which the Von Karman [40] spectrum is the most representative. This paper adopts a modified equation of the Von Karman spectrum of fluctuating wind speed, which reads as follows:
nS n σ u 2 = 4 f 1 + 70.8 f 2 5 / 6
nS v n σ v 2 = 4 f 1 + 755.2 f 2 1 + 283.2 f 2 11 / 6

3.7. Turbulence Integral Scale

The turbulence integral scale is a measure of the average size of turbulent eddies in fluctuating winds, and its definition is as follows:
L i = 1 σ i 2 0 R i 1 i 2 x dx
where L i refers to the turbulence integral scales of the fluctuating wind speed in the u and v directions, and R i 1 i 2 x is the correlation function of the synchronous fluctuating wind speed at two points in space.
The turbulence integral scale is obtained by integrating the correlation functions observed at multiple points in a space at the same time. Owing to the difficulty of the simultaneous observation of multiple points, this study is based on a simplified form of Taylor’s hypothesis, which is written as follows:
L i = U σ i 2 0 R i τ d τ
where L i denotes the turbulence integral scales of the fluctuating wind speed in the u, v, and w directions, and R i τ is the autocorrelation function of the fluctuating wind speed.

3.8. Coherence Analysis

The coherence coefficient represents the degree of correlation between signals in the frequency domain. Davenport [41] proposed an empirical expression for the coherence coefficient of the fluctuating wind speed component in the form of an exponential function:
Coh f = exp f U ( C z 2 Δ z 2 + C y 2 Δ y 2 ) 1 / 2
where f is the frequency, U is the average wind speed, C y and C z stand for the exponential attenuation coefficients in the horizontal and vertical directions, respectively, Δ y and Δ z are the horizontal and vertical distances between the two measurement stations, respectively, and Coh represents the coherence coefficient.
This formula may be reduced to the following in this paper:
Coh f = exp ( C z f Δ z U )

3.9. Autocorrelation Coefficient

Autocorrelation refers to the dependence between an instantaneous signal value at one moment and an instantaneous value at another time, reflecting the degree of correlation between the values of the same sequence at various intervals. If X(t) is a time series, then the correlation function is expressed as follows:
R XX t 1 , t 2 = E X t 1 X t 2
If X(t) is a stationary stochastic process, then
R XX τ = E X t X t + τ
where R XX represents the autocorrelation function and τ represents the time difference.

4. Analysis of Wind Characteristics Based on Measured Data

4.1. Mean Wind Speed and Direction

A time of 10 min was the basic time interval with which to analyze the measured horizontal average wind speed and main wind direction data at the east and west measuring points, as reflected in Figure 3a and Figure 3b, respectively. From Figure 3, with 10 min as the basic time interval, the measured mean wind speeds at the east and west measurement locations are 6.6 and 6.4 m/s, respectively, and the main wind direction steadily increases from about 90° to about 140°. Figure 3 depicts the change of 10 min average wind speed and main wind direction over time. The wind speed, though with fluctuations, is generally decreasing, which is consistent with the way Typhoon Jangmi affected Wenzhou and its complex path in the later stage.

4.2. Probability Density Function

To study the fluctuating wind speed of Typhoon Jangmi, this study compares the probability density of the fluctuating wind with a Gaussian distribution. The results in Figure 4 show that the fluctuating wind speed components of Typhoon Jangmi at the east and west observation stations tend to obey a Gaussian distribution and fit well with the Gaussian curve, which is consistent with the research findings of Cao [39].

4.3. Turbulence Intensity

Figure 5 portrays the variation in turbulence intensity with the mean wind speed of Typhoon Jangmi at the east and west measurement stations. Under low wind speeds, the turbulence intensity steadily decreases as the wind speed rises. As the wind speed continues to increase, this reduction rate drops. At the east measuring point, the longitudinal and lateral turbulence intensities stabilize at about 0.5 and 0.25, respectively. The curve between the turbulence intensity and the mean wind speed tends to level off, indicating that there is essentially no longer a relationship between the two variables. At the west measuring point, when the longitudinal and lateral turbulence intensities also start to level off, the turbulence intensity stabilizes at the value of 0.25. When the average wind speed is low, the turbulence is dispersed due to the influence of atmospheric instability. The smaller the wind speed is, the greater the surface thermal stress is, so the stability of the boundary layer deviates from neutral. However, as the wind speed increases, the turbulence intensity will approach a single value, and this value is not constant. From a comparison of the graphs between the turbulence intensity and wind speed at the east and west measurement stations, the two graphs exhibit roughly the same trends, and the wind speed at the “abrupt change point” (where the most significant change between turbulence intensity and wind speed occurs) is basically the same.
In Figure 6, a comparison of the relationship between the time interval and the turbulence intensity under various wind speeds indicates that the turbulence intensity reduces as the time interval increases. When the time interval is short, the decline curve of the turbulence intensity tends to level off; when the time interval is long, the decline curve of the turbulence intensity is steeper, and the steepness of the curve increases as the time interval becomes longer.

4.4. Gust Factor

Figure 7 shows the relationship between the longitudinal and lateral gust factors and the mean wind speed of Typhoon Jangmi at the east and west measuring stations. When mean wind speed rises, the gust factor declines. The longitudinal and lateral gust factors decrease with increasing mean wind speed at the east and west sites, which is similar to the variation in the turbulence intensity with the mean wind speed. The lower the mean wind speed, the stronger the influence of atmospheric boundary-layer instability factors. The distribution of gust factors at the eastern site is relatively scattered, whereas they tend to be clustered at the western site. The longitudinal gust factors at the east and west sites tend to stabilize at around 2.0, and the lateral gust factors tend to stabilize at 0.5.
The change in gust factor is affected by the length of the time interval. Long time interval T affects mean wind speed U, and short time interval tg affects max ( u ( t g ) ¯ ) and max ( v ( t g ) ¯ ) . With reference to the research findings of Ashcroft [42] and Krayer [43], this study uses T = 3600 s to evaluate the impact of a short time interval tg on the gust factor. Figure 8 portrays the variation in gust factor with the time interval under various wind speeds. The longitudinal and lateral gust factors drop as the time interval increases at the east and west measuring stations, and the curve becomes unsmooth at the time intervals of 10, 100, and 1000 s. The gust factors under different wind speed all approach 1.0 at the maximum time interval.

4.5. Peak Factor

Figure 9 shows the variation in the peak factor with 10 min averaged wind speed. The comparison of the variations in peak factor with mean wind speed at the east and west measuring stations shows that the peak factors decrease slightly with increasing mean wind speed, and the distribution of peak factors is greatly scattered.
Figure 10 shows the variations in the peak factor with time intervals under different wind speeds at the eastern and western sites. The results indicate that the peak factor decreases with the increase in the time interval, and the reduction rate gradually rises. The maximum peak factors at the eastern and western sites both fall between 3.0 and 4.0. In addition, the peak factor varies greatly under different wind speeds. A comparison of the measured results with the empirical results of Durst [44] shows that, at the east measuring point, under the wind speeds of 3.83, 6.41, and 4.73 m/s, the measured peak factors are smaller than the empirical results of Durst over a short time interval but are greater than the empirical results of Durst over a long time interval. Under wind speeds of 3.27 and 5.59 m/s, the measured peak factors are greater than the empirical results of Durst over both short and long time intervals. At the west measuring point, only under a wind speed of 6.41 m/s is the measured peak factor smaller than the empirical result of Durst over a short time interval and greater than the empirical results of Durst over a long time interval. Under the wind speeds of 3.83, 4.73, 3.27, and 5.59 m/s, the measured peak factors are greater than the empirical results of Durst over both short and long time intervals.
Figure 11 shows the variation in the gust factor with the peak factor. The gust factor increases as the peak factor increases, and the distribution of the gust factor is relatively scattered.

4.6. Gust Factor and Turbulence Intensity

Figure 12 shows the variations in the gust factor with turbulence intensity at the east and west measuring points. With increasing turbulence intensity, the gust factor becomes larger and exhibits a more scattered distribution. Formula (15) is used to construct the curve that fits the measured data. For the east measuring point, the fitting parameters are a = 0.5 and b = 0.97; for the west measuring point, the fitting parameters are a = 0.49 and b = 0.9. A comparison with the empirical curves of Ishizaki [37], Choi [38], and Cao [39] shows that the empirical formula of Ishizaki [37] has the best fit for the measured data in this paper.

4.7. Power Spectrum

Figure 13 and Figure 14 depict the power spectrum of the fluctuating wind speed in each direction at the east and west measuring stations and the corresponding Karman’s [40] empirical spectrum. At the east and west measuring stations, the power spectrum of the lateral fluctuating wind speed agrees well with Karman’s empirical spectrum. The power spectrum of the longitudinal fluctuating wind speed is significantly lower than Karman’s empirical spectrum for the mid-band spectrum but is higher than Karman’s empirical spectrum for the high-band spectrum. In general, the measured power spectrum of the fluctuating wind speed agrees well with Karman’s empirical spectrum, indicating that Karman’s empirical spectrum can well reflect the fluctuating wind spectrum characteristics of Typhoon Jangmi.

4.8. Turbulence Integral Scale

Figure 15 and Figure 16, respectively, depict the correlation between the longitudinal and lateral turbulence integral scales and the 10 min averaged wind speeds at the east and west sites. The distribution of turbulence integral scales is relatively scattered, which broadly matches the results of Wang et al. [45]. In addition, as the wind speed increases, the distribution of the turbulence integral scales becomes more scattered. A certain linear relationship is found between the turbulence integral scale and mean wind speed. The smaller the average wind speed is, the smaller the turbulence integral scale is. It may be that under low wind speed, the unstable dynamic factors in the atmosphere make large-scale vortices disperse into small-scale vortices, which dissipate faster. The turbulence integral scales increase, though insignificantly, with increasing wind speed.

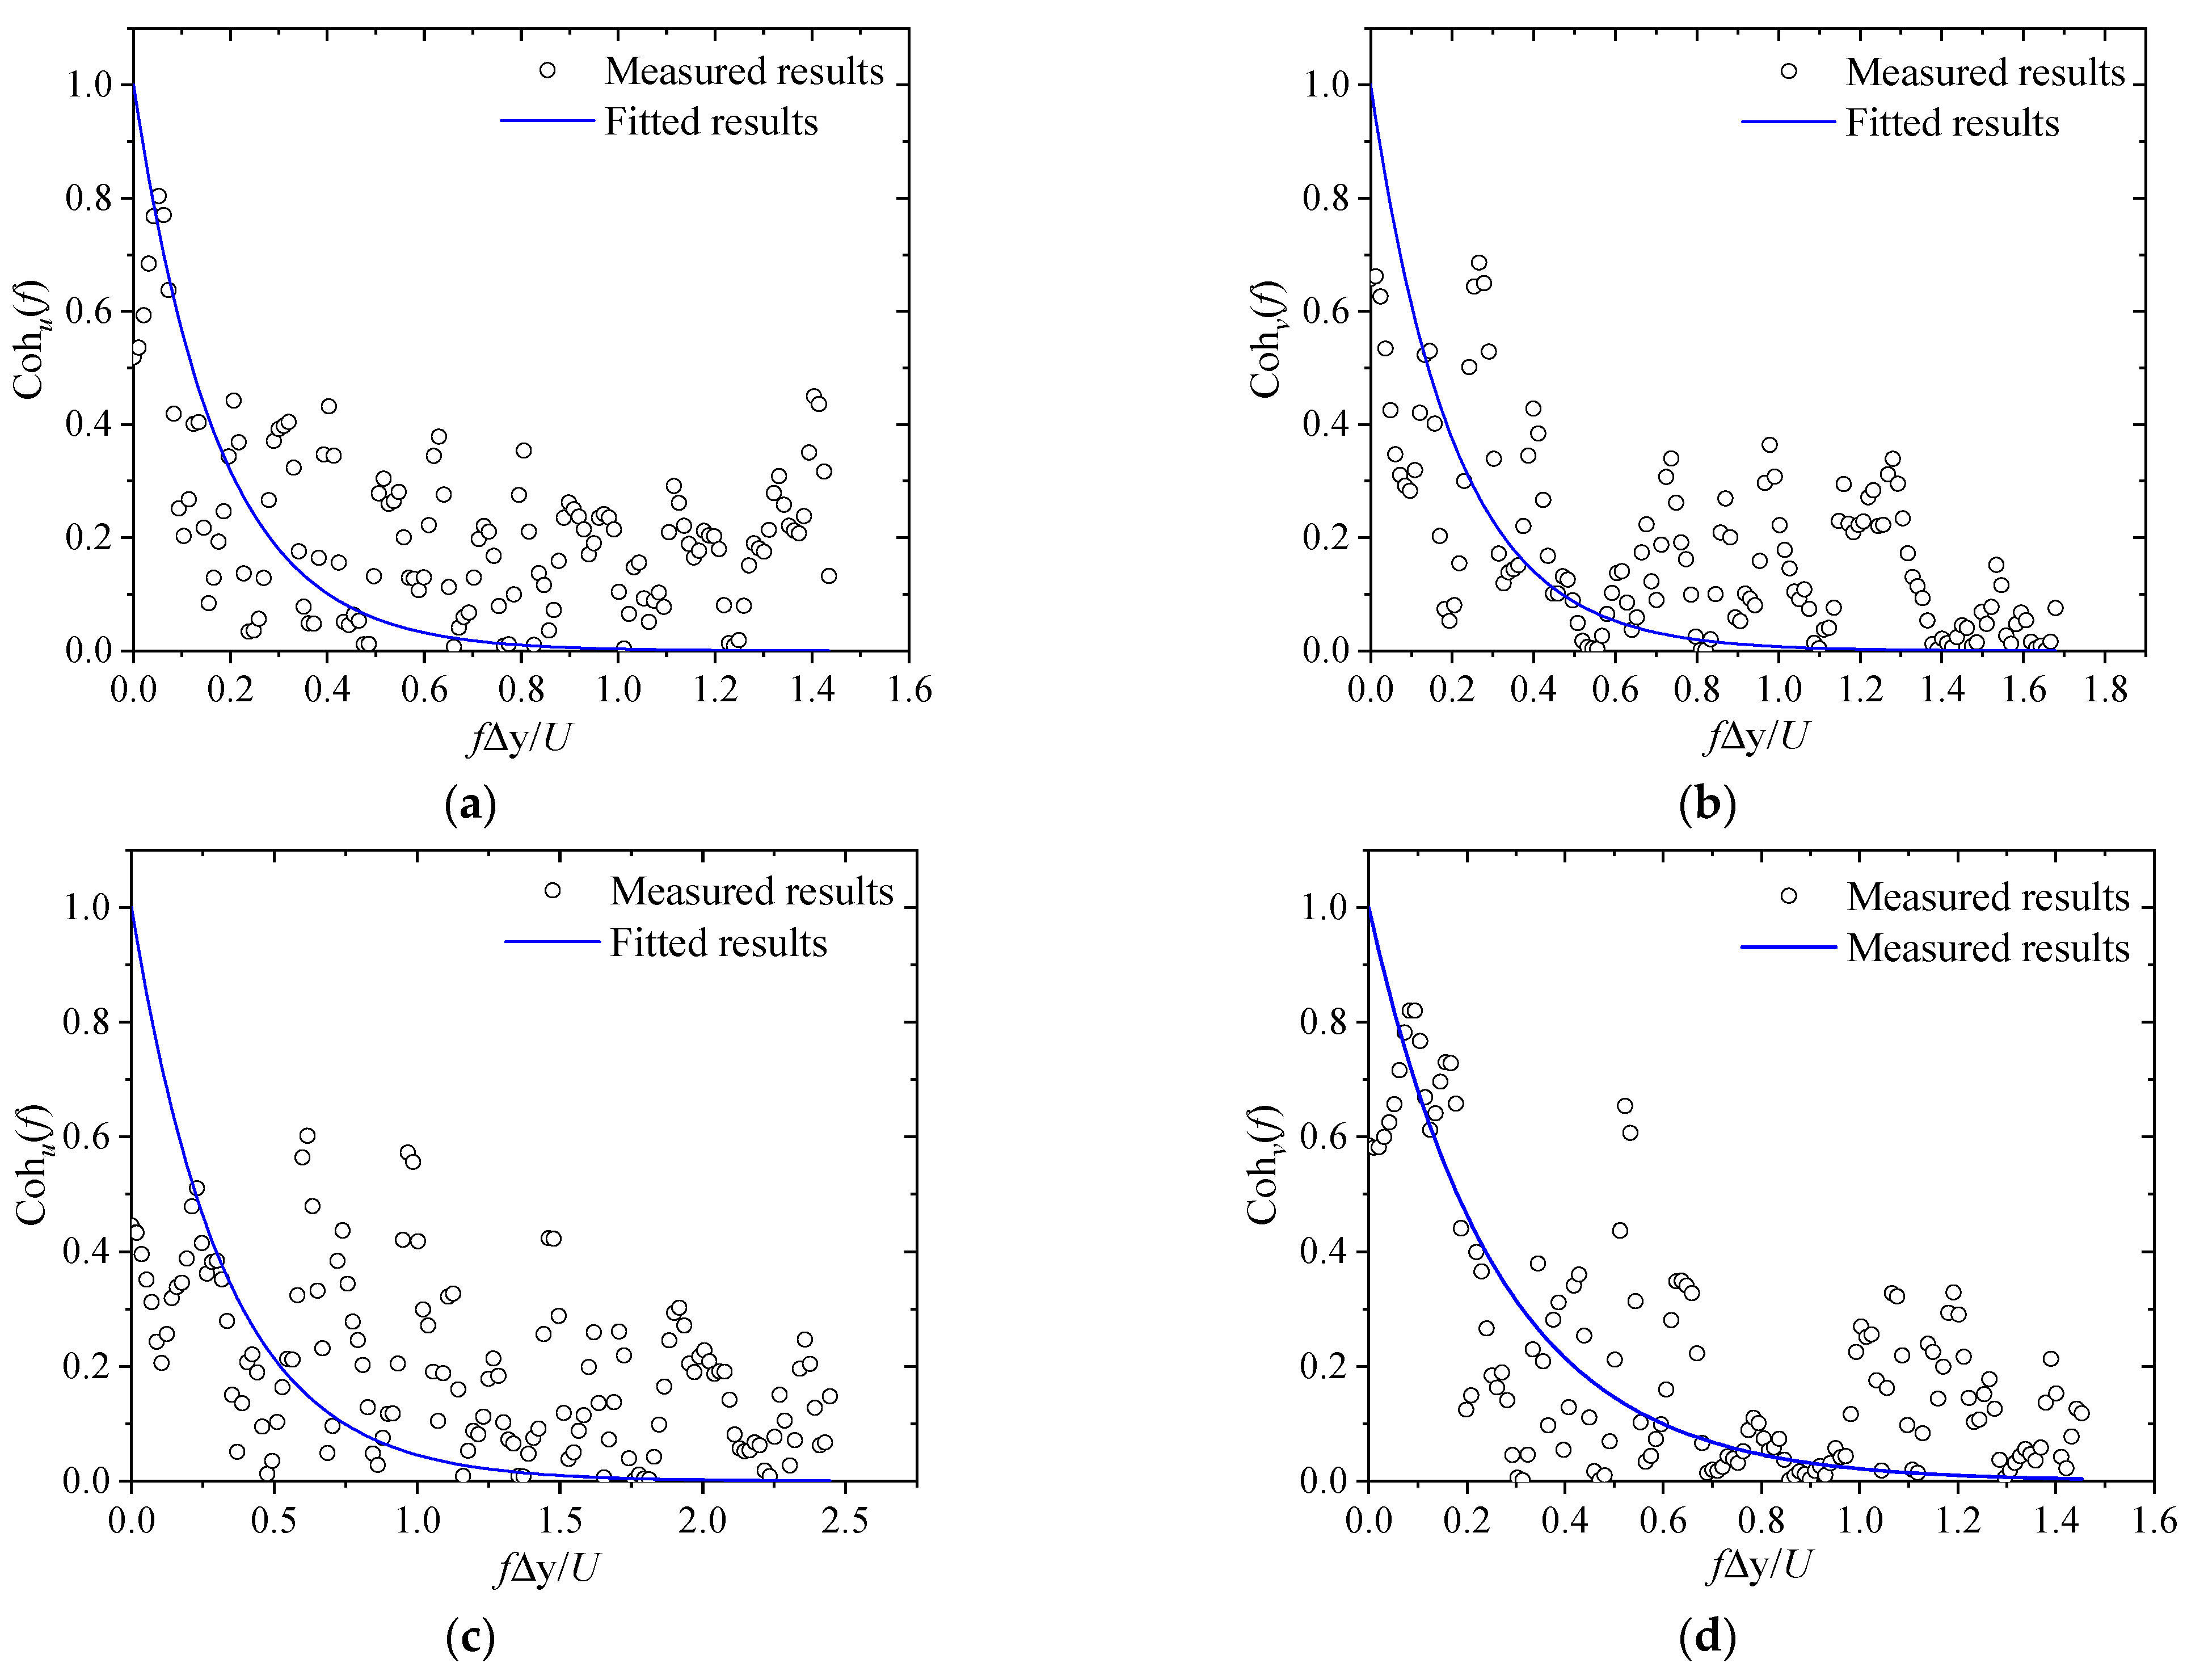
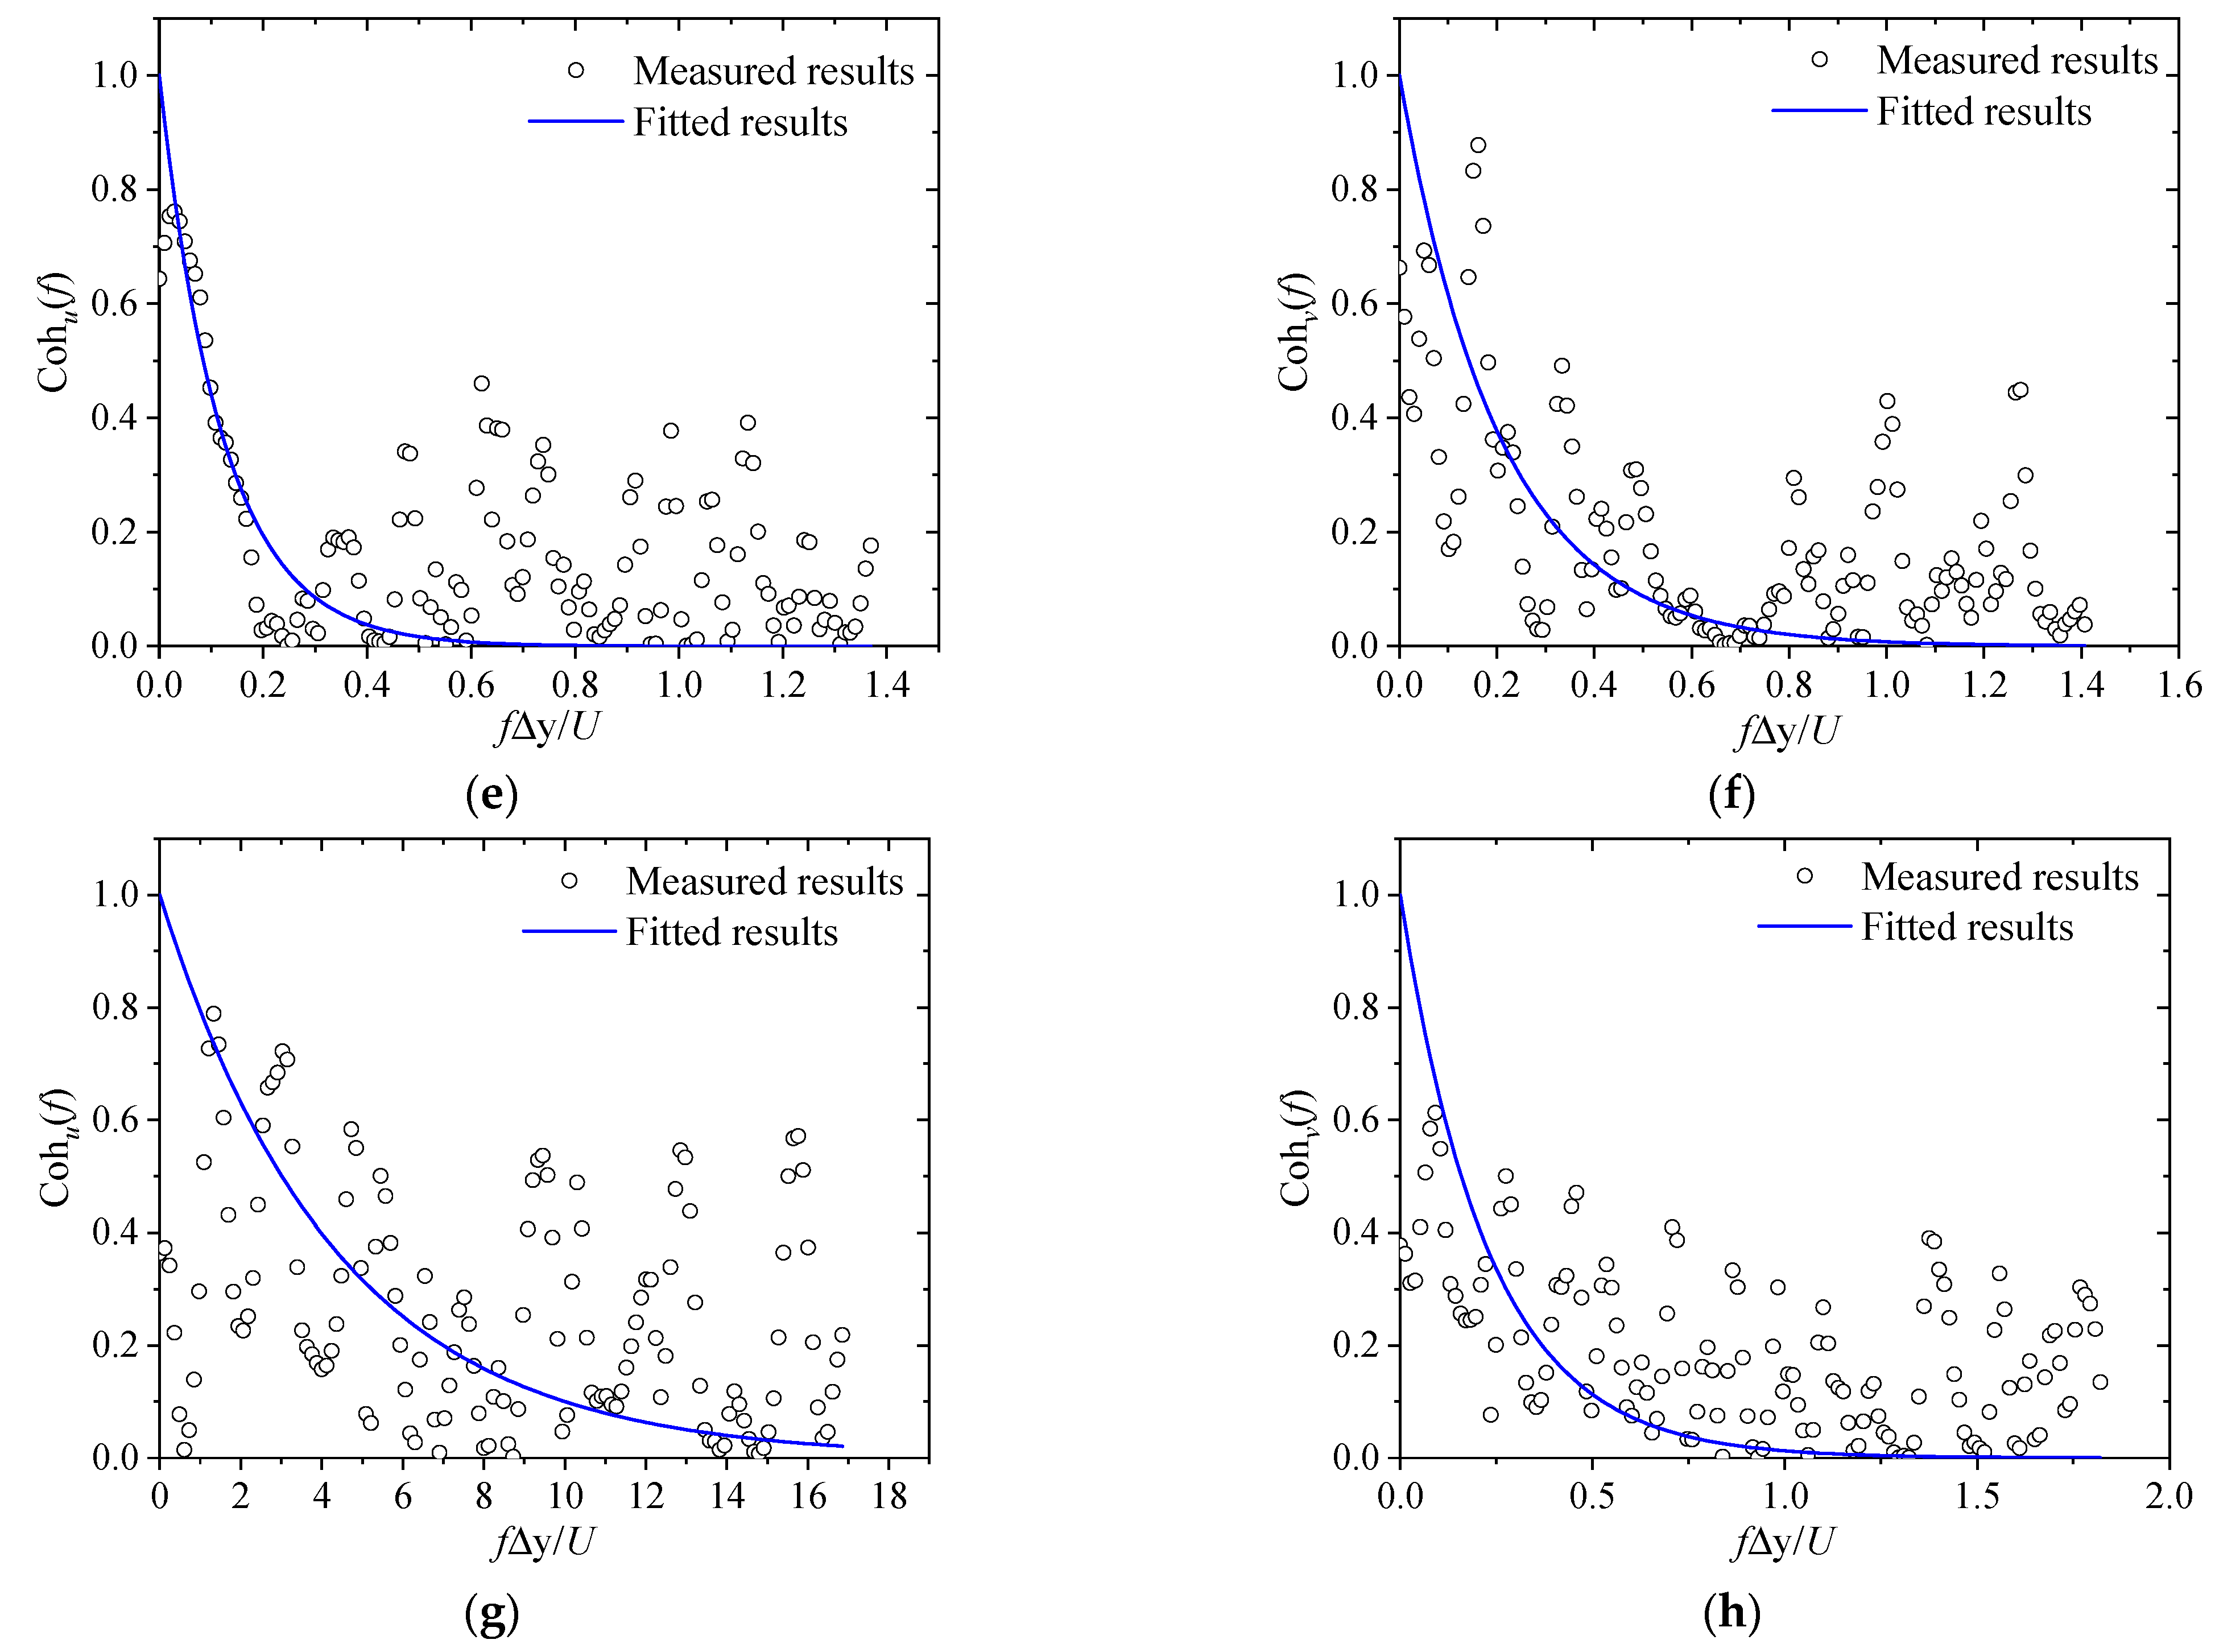
4.9. Coherence Analysis

The longitudinal and lateral fluctuating wind-speed-coherence coefficient curves are shown in Figure 17 and are in good agreement with the exponential curve. Accordingly, Formula (21) reflects the coherence characteristics of the measured fluctuating wind speed components in this study.

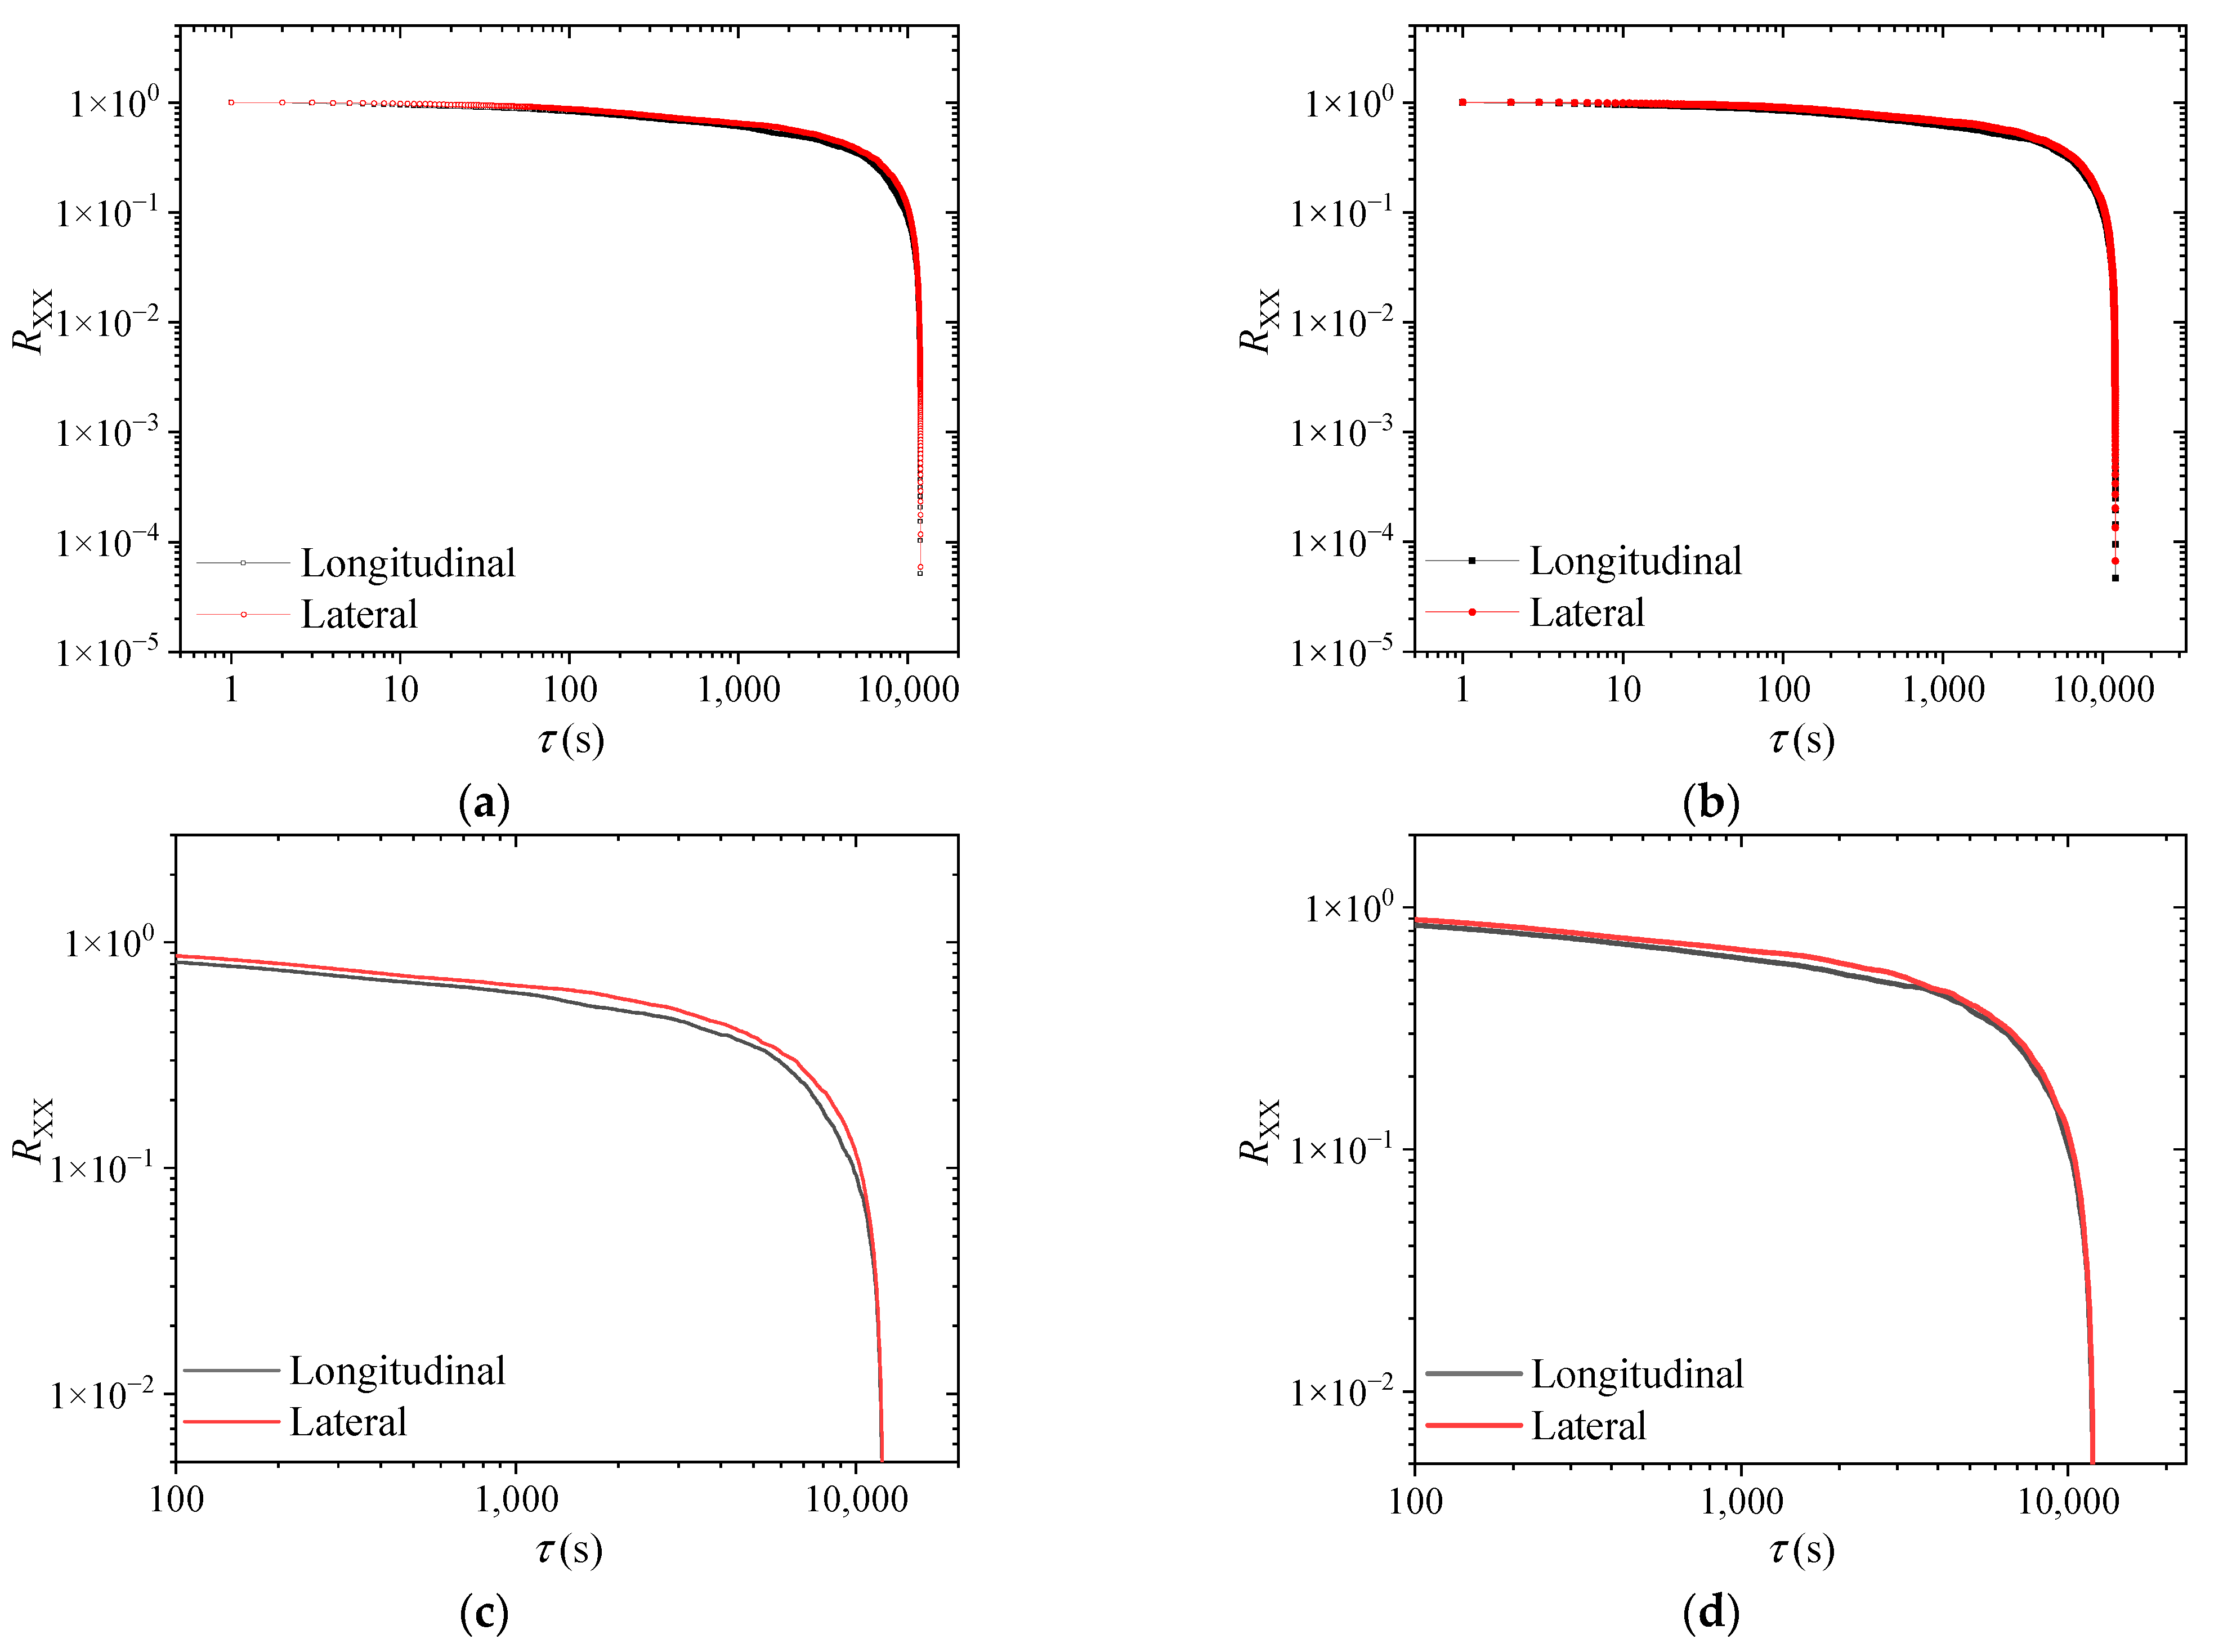
4.10. Autocorrelation Coefficient

Figure 18 shows the variation in the autocorrelation coefficients of fluctuating wind speed in each direction at the east and west sites. The figure’s curve displays the average autocorrelation coefficient of the fluctuating wind speed during a 10 min time frame. As τ rises, the autocorrelation coefficient goes down. The reduction rate slowly increases before a certain value τ , but after point τ , the reduction rate continues to rise and hikes to the maximum. This sharp change occurs at τ , some point between 100 and 10,000 s. The autocorrelation coefficient of the lateral fluctuating wind speed is always greater than that of the longitudinal fluctuating wind speed, and the variations at the east and west sites are almost identical.

5. Conclusions

Based on the 42 h time series wind speed data collected using two WJ-3 anemometers located at Wenzhou University’s architectural engineering building, this study analyzes the wind characteristic parameters, including mean wind speed, main wind direction, gust factor, peak factor, turbulence intensity, and coherence. Our analysis leads to the following conclusions:
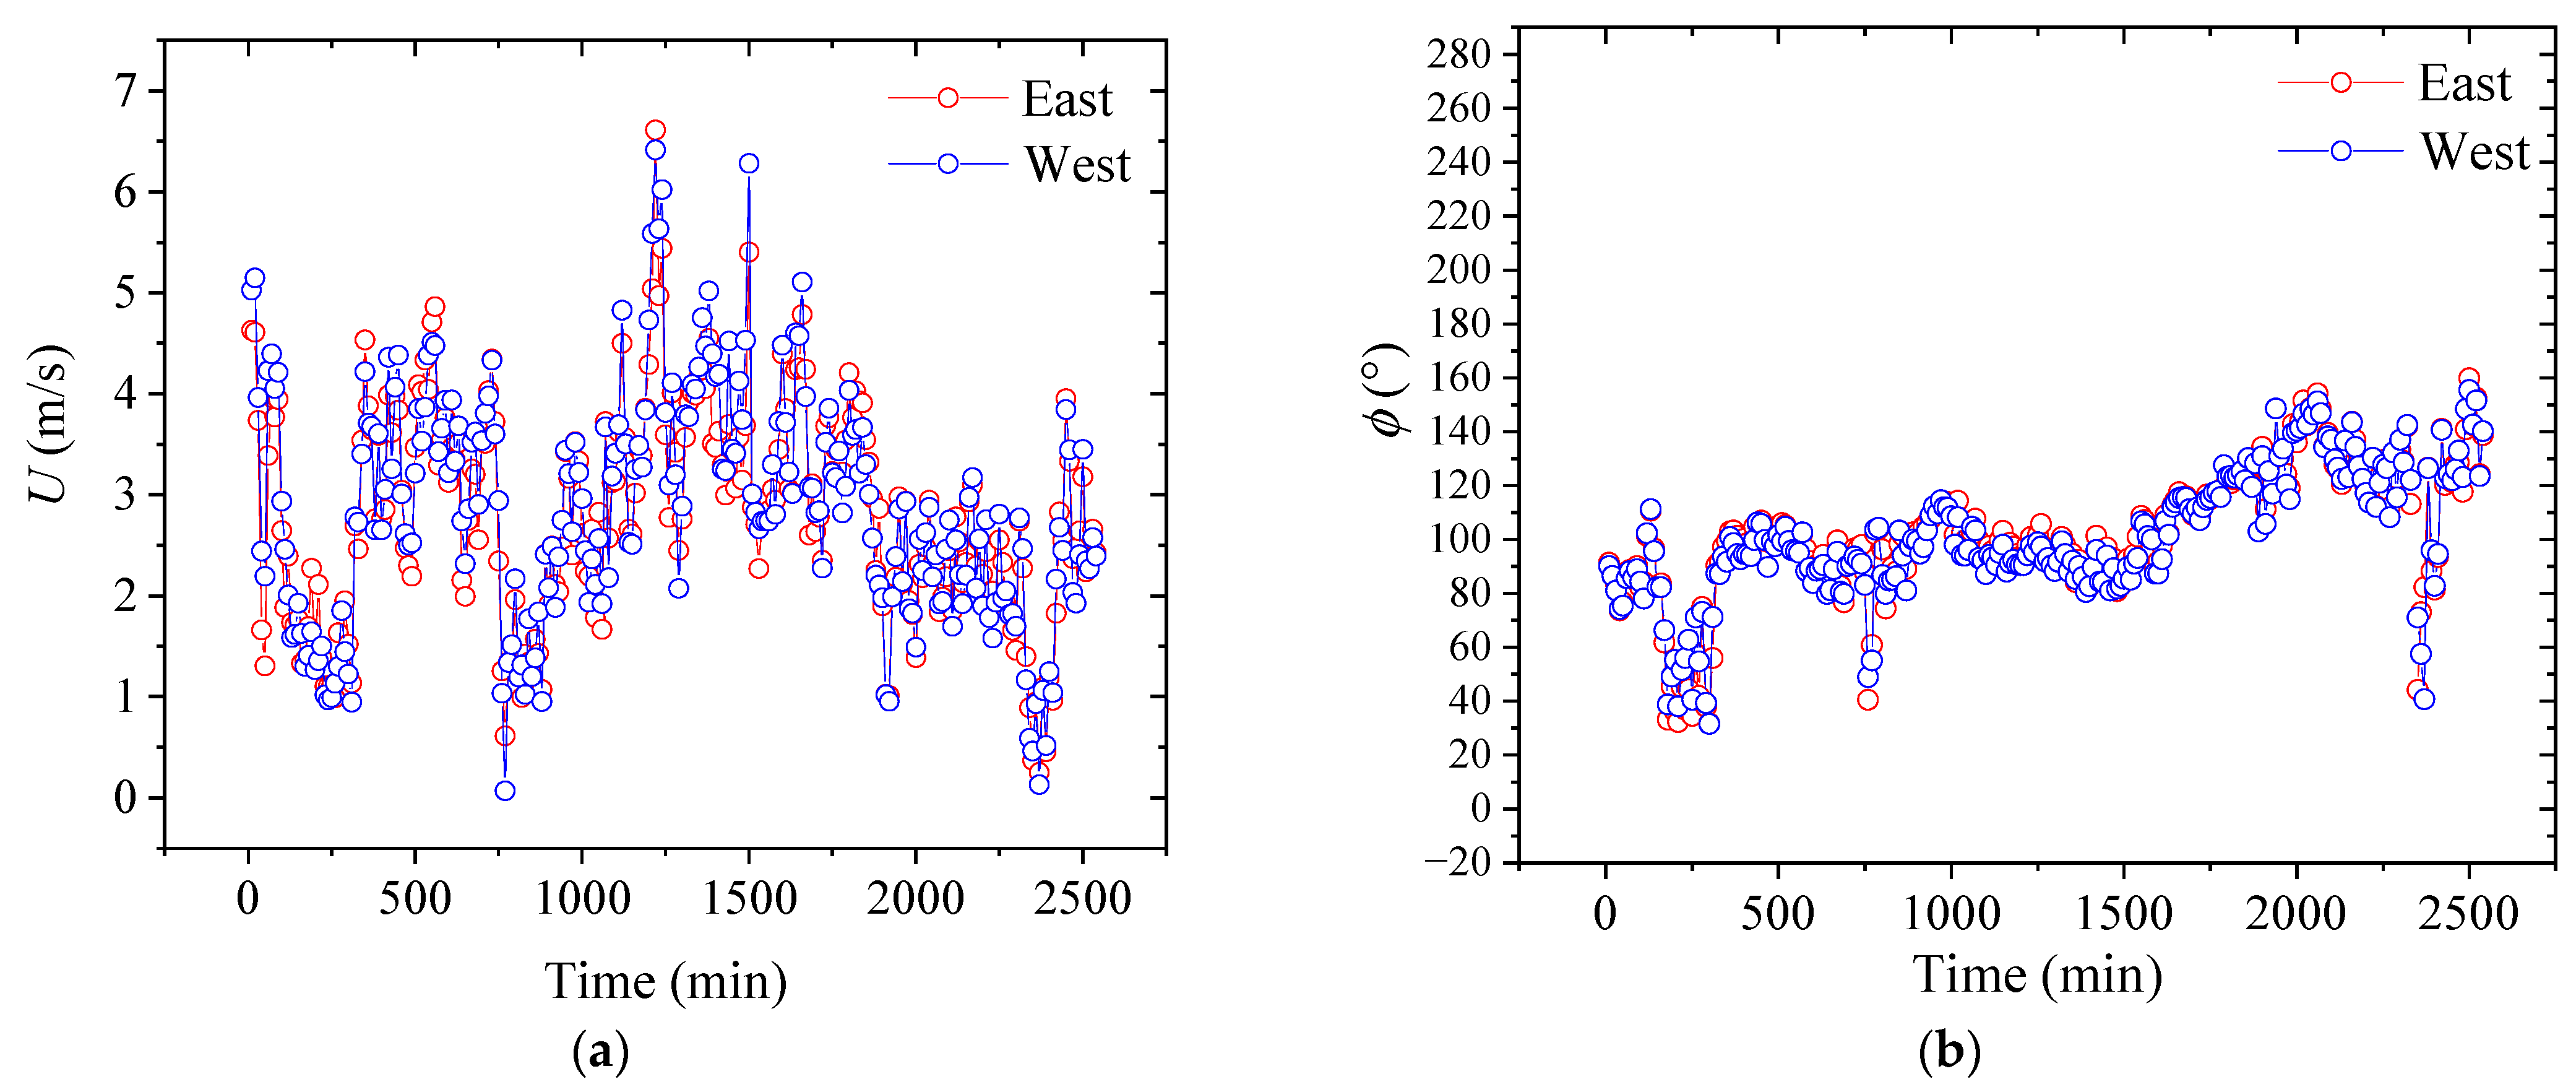
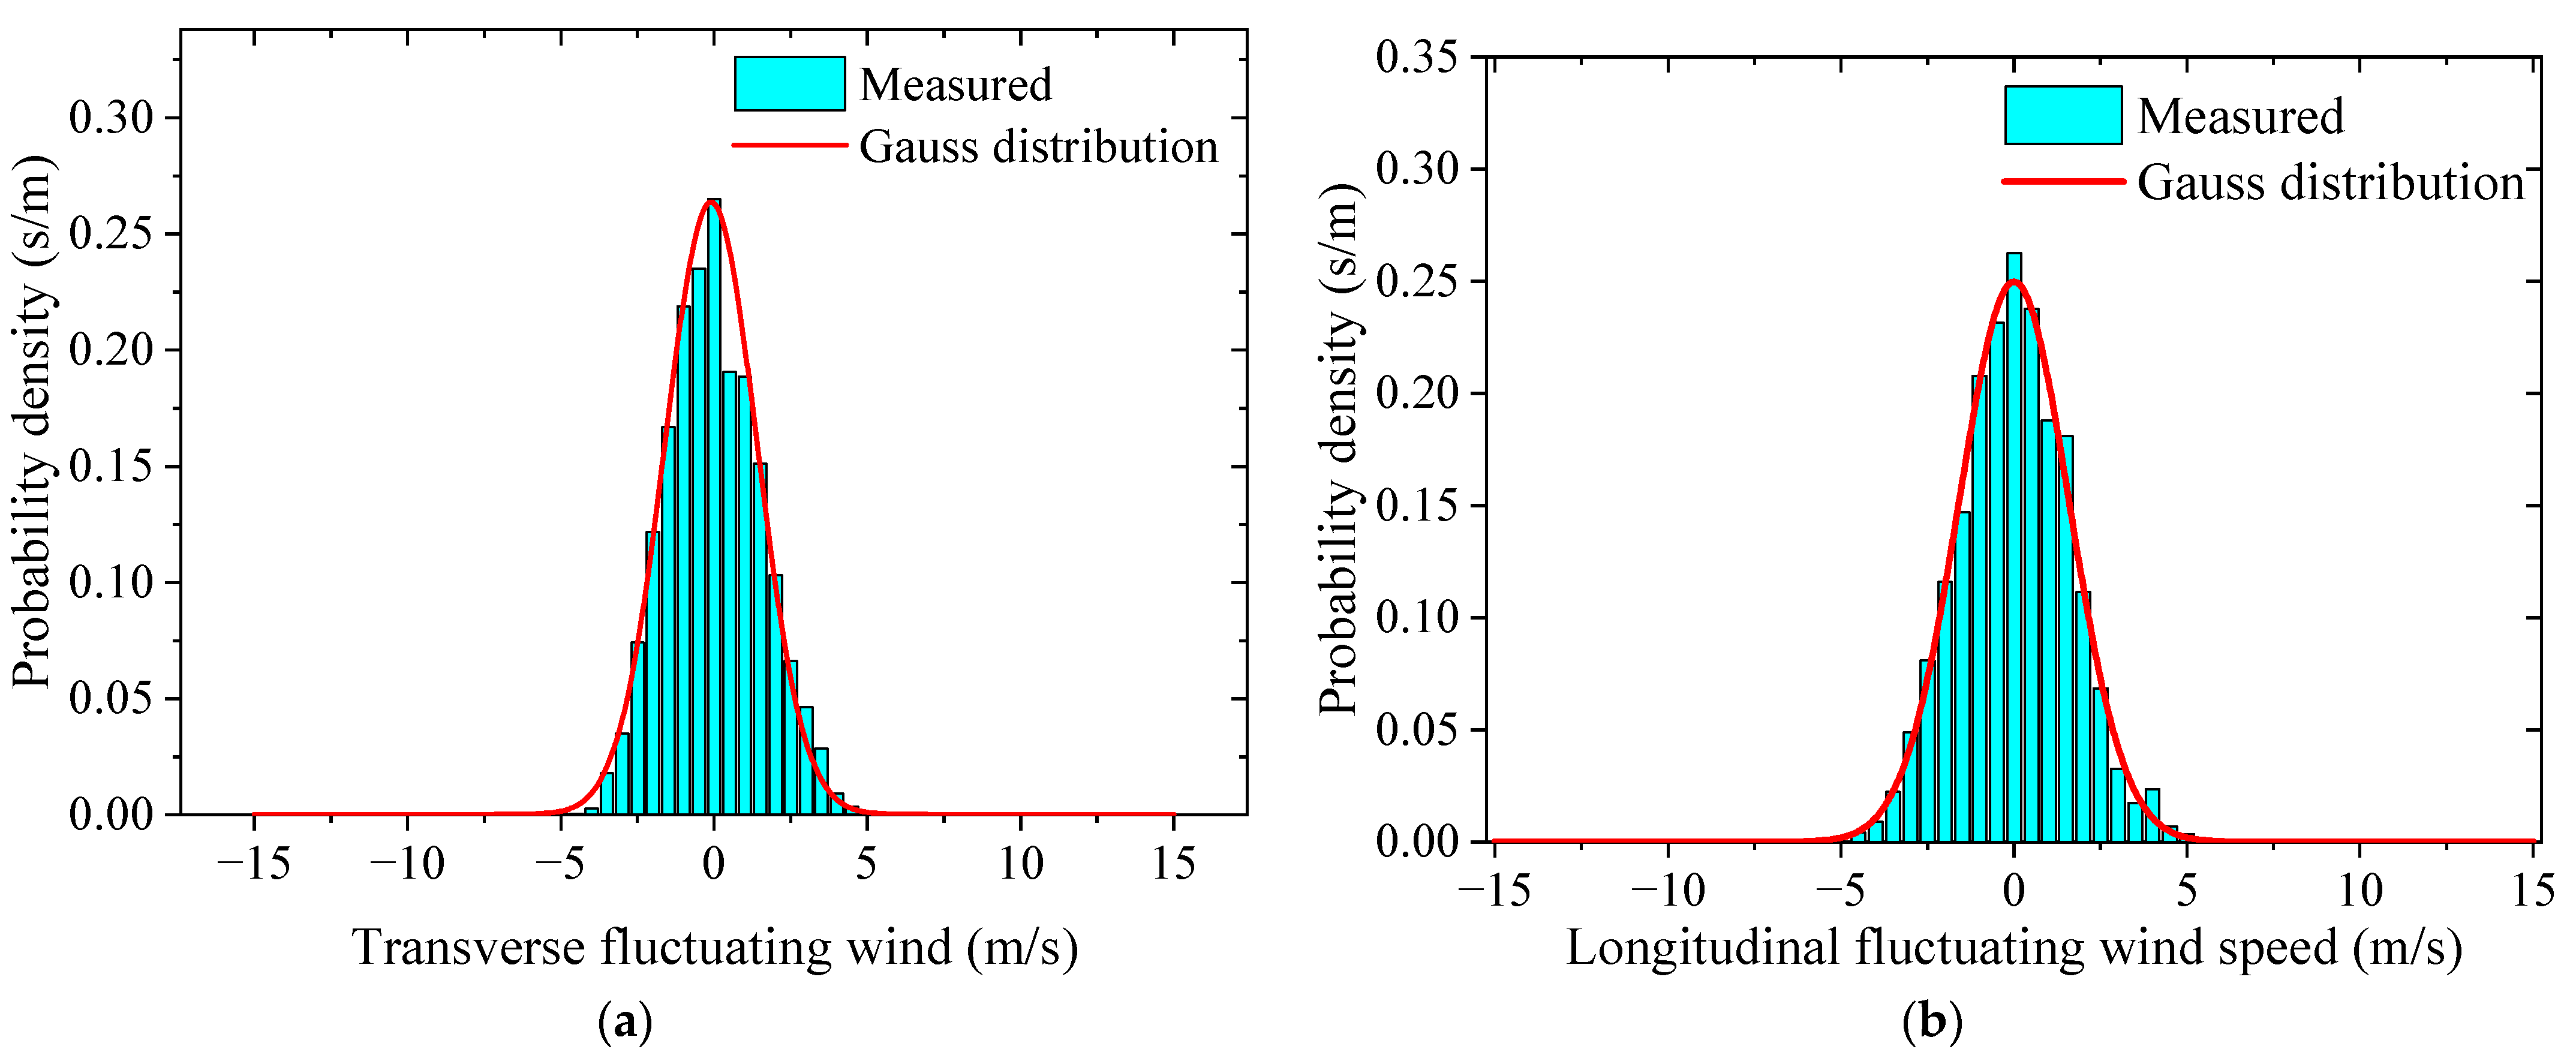
  • During the landfall of Typhoon Jangmi in Wenzhou, its impact was complicated. The wind speed fluctuated irregularly, but overall, the wind speed decreased, though insignificantly. The wind direction, which is measured with an angle, gradually increased. The fluctuating wind speed components of Typhoon Jangmi at the east and west measuring stations tended to obey a Gaussian distribution and fit well with the Gaussian curve, which is consistent with the research findings of Cao [39];
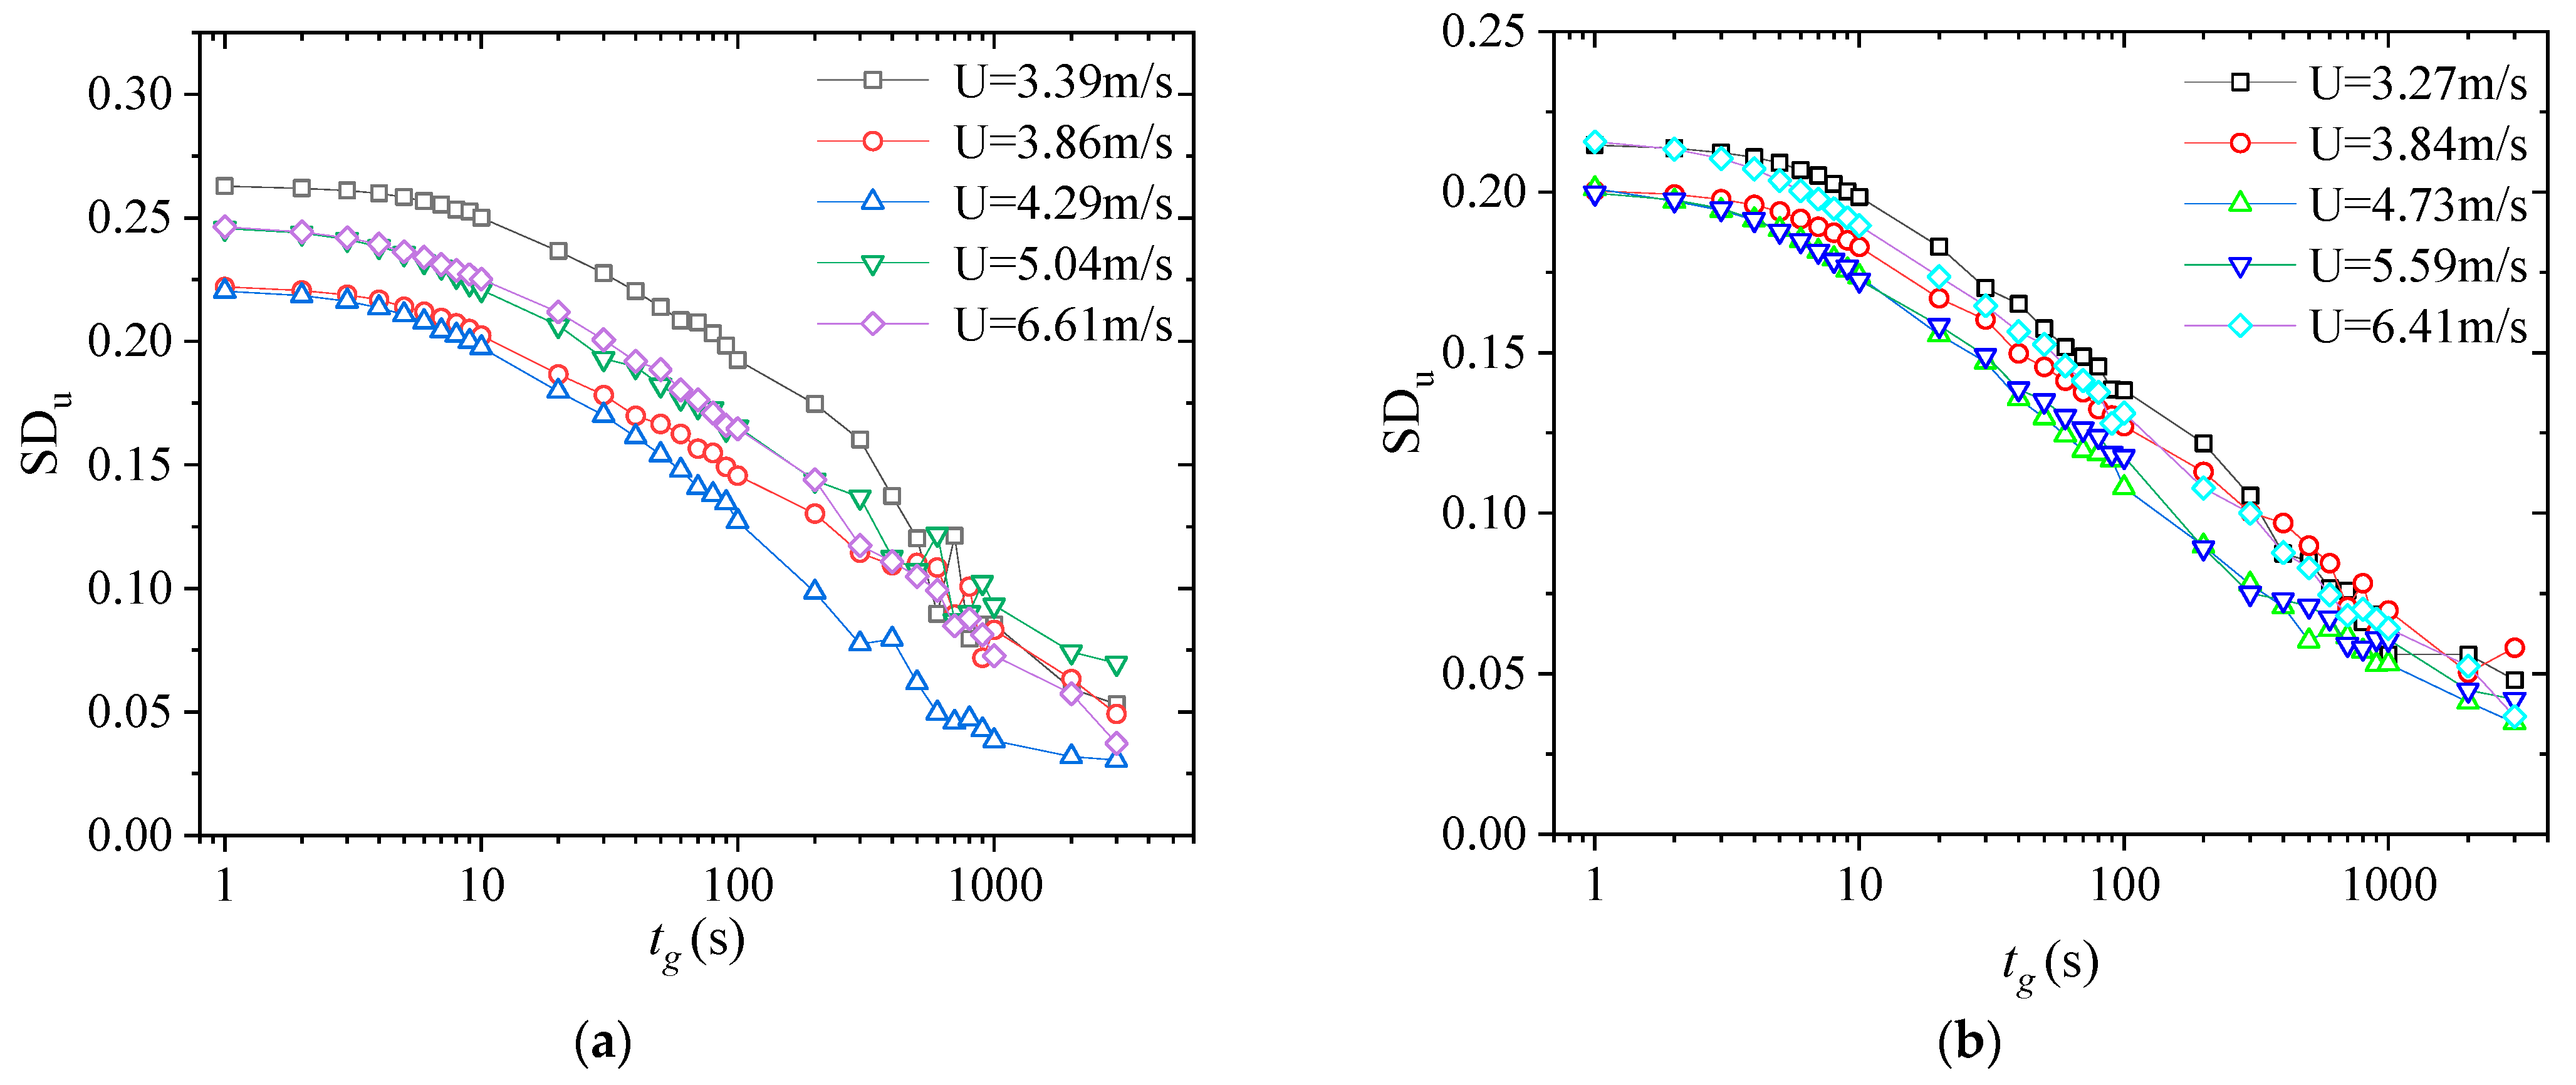
  • In low wind conditions, the turbulence intensity steadily reduced as the wind speed increased. As the wind speed continued to increase, this reduction rate dropped. At the east measuring point, the longitudinal and lateral turbulence intensities stabilized at about 0.5 and 0.25, respectively. At the west measuring point, the longitudinal and lateral turbulence intensities stabilized at 0.25. At these points, the curve between turbulence intensity and mean wind speed tended to level off, indicating that the turbulence intensity basically no longer changed with the mean wind speed. When the time interval was short, the decline curve of the turbulence intensity tended to level off; when the time interval was long, the decline curve of the turbulence intensity is steeper, and the steepness of the curve increased as the time interval became longer;
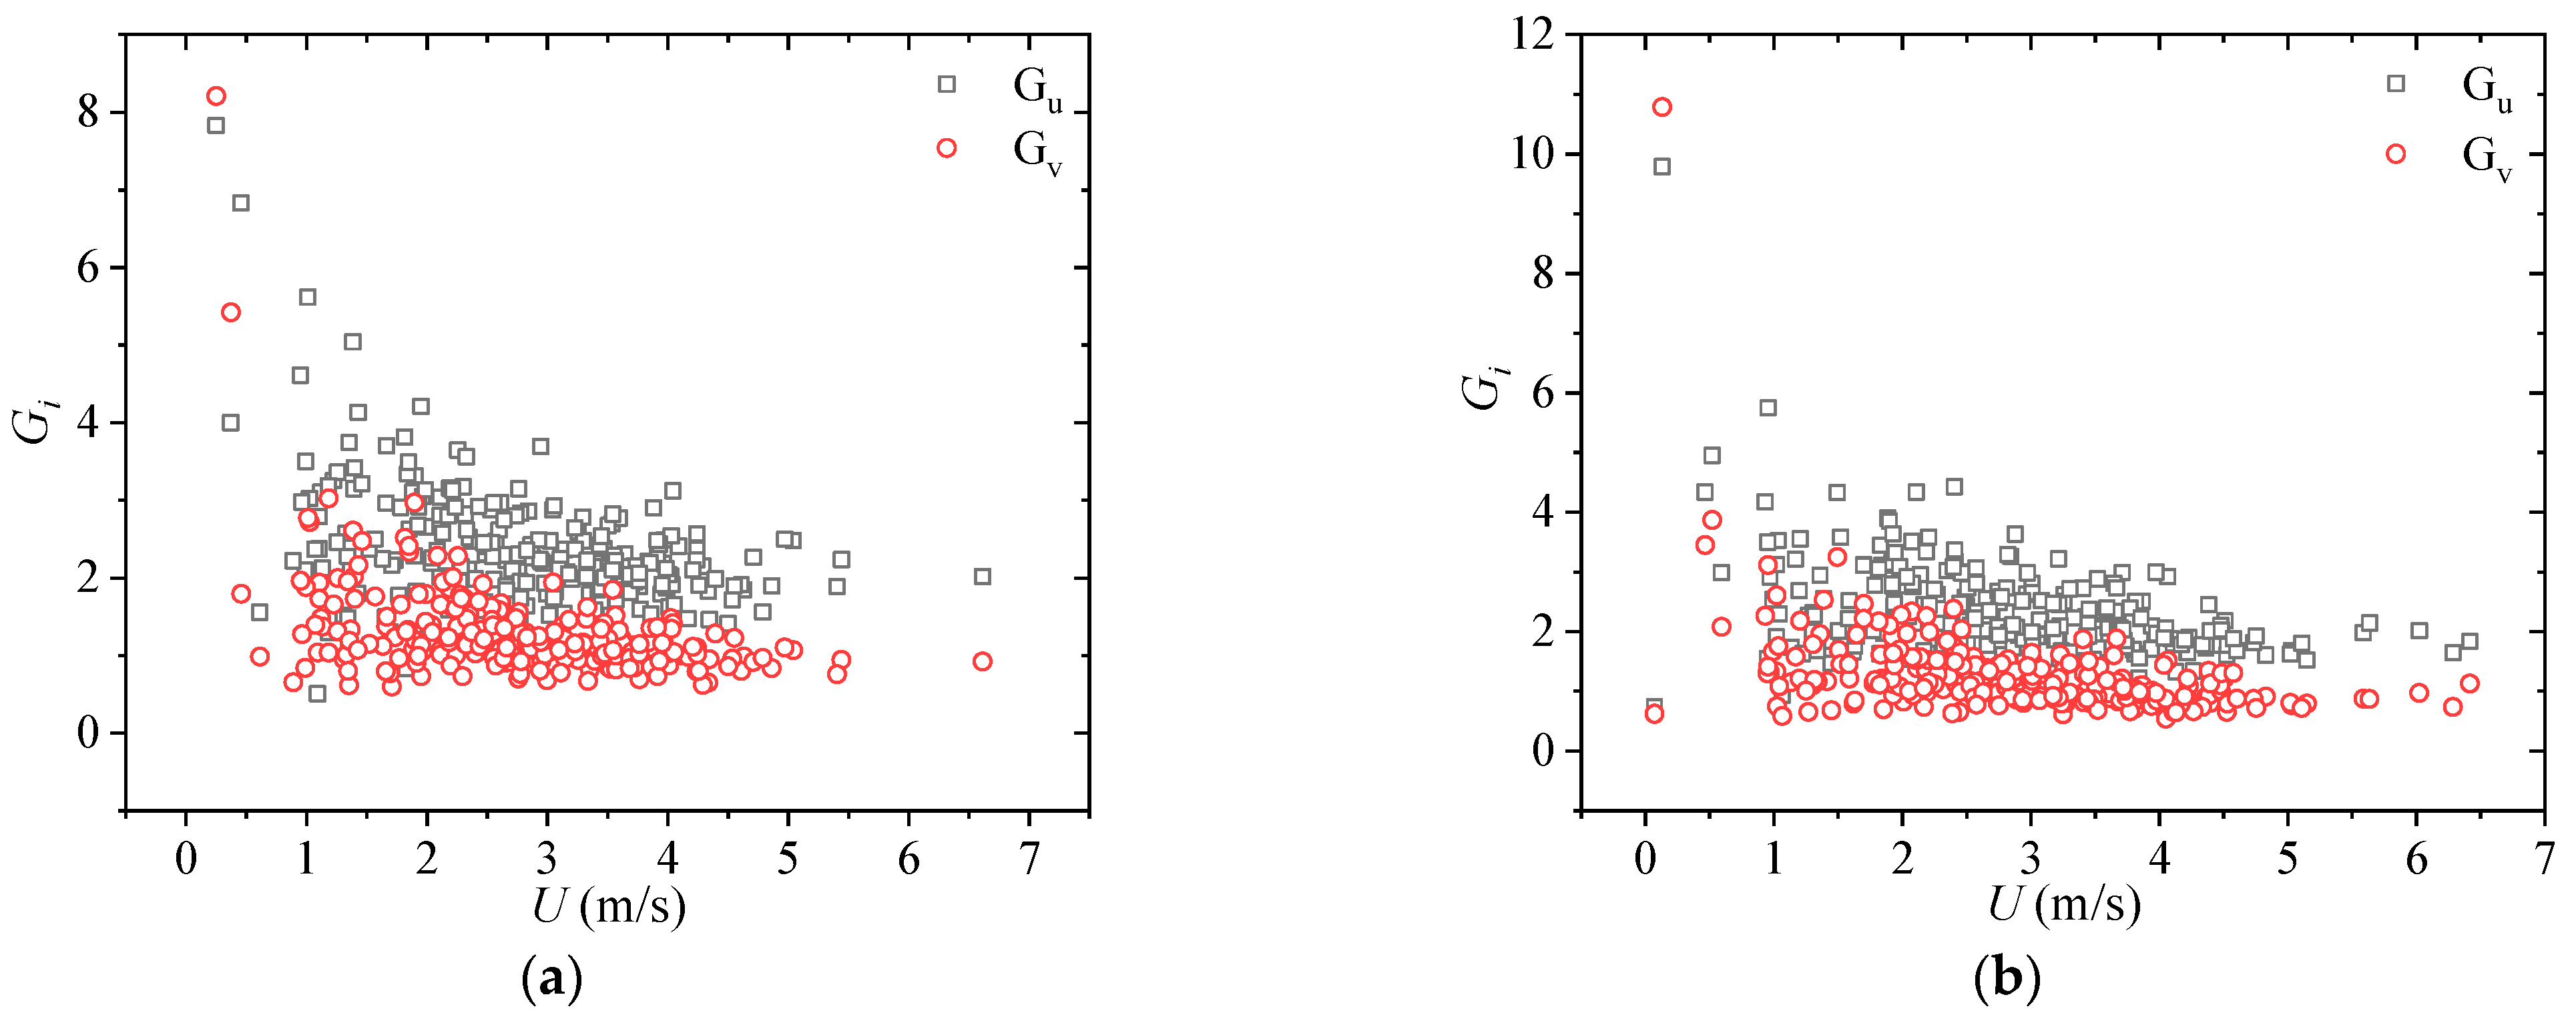
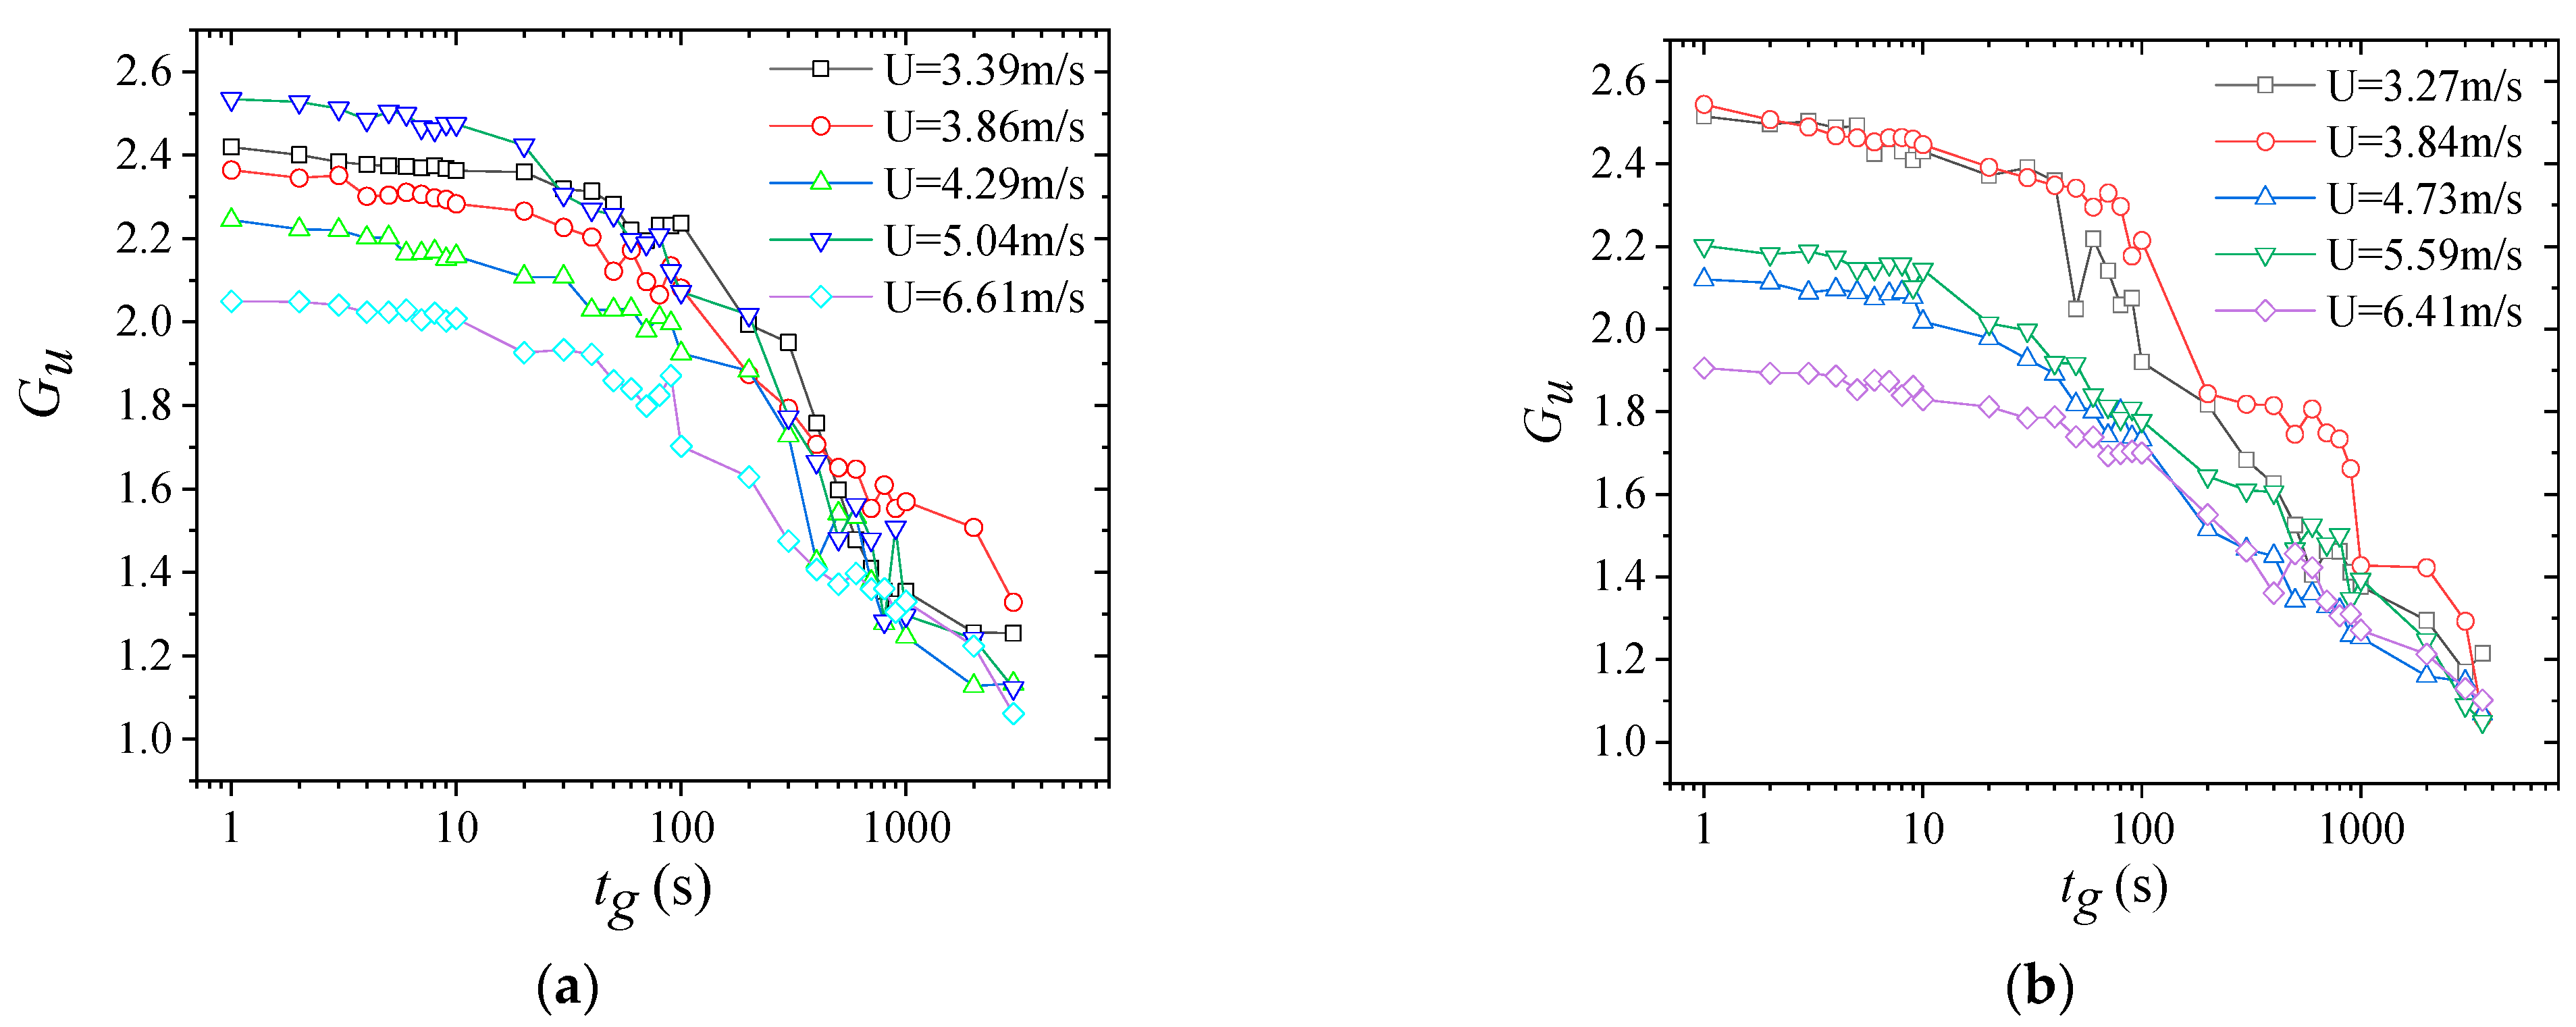
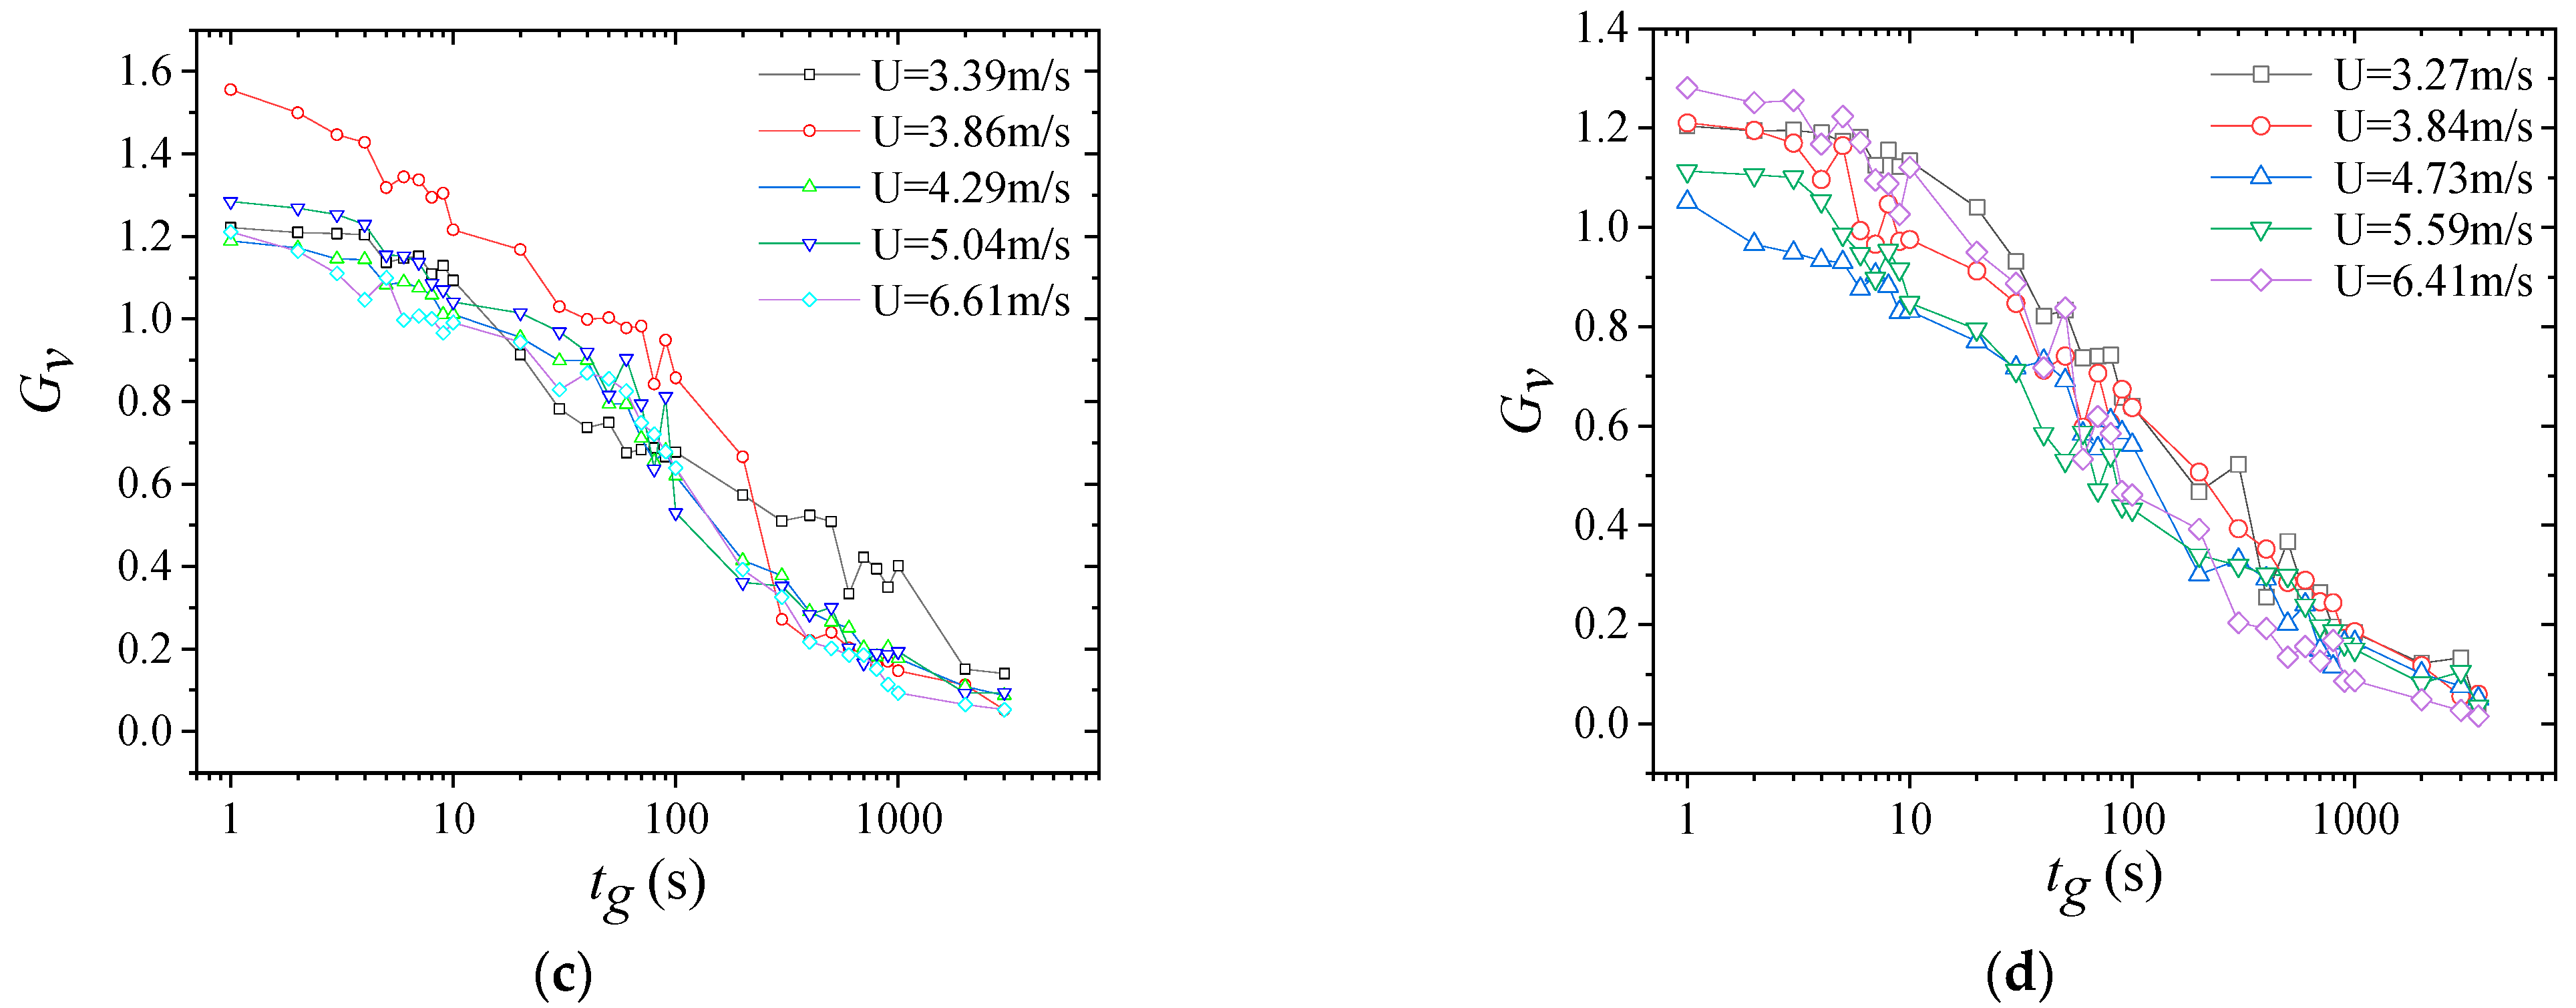
  • The gust factor decreased with increasing mean wind speed. From the curves between the gust factor and the average wind speed, the distribution of gust factors at the east measurement site was relatively scattered, whereas gust factors at the west measuring point tended to cluster. The longitudinal and lateral gust factors decreased as the time interval increased for both east and west measurement stations, and the curve became unsmooth at the time intervals of 10, 100, and 1000 s. The gust factors under different wind speeds all approached 1.0 at the maximum time interval;
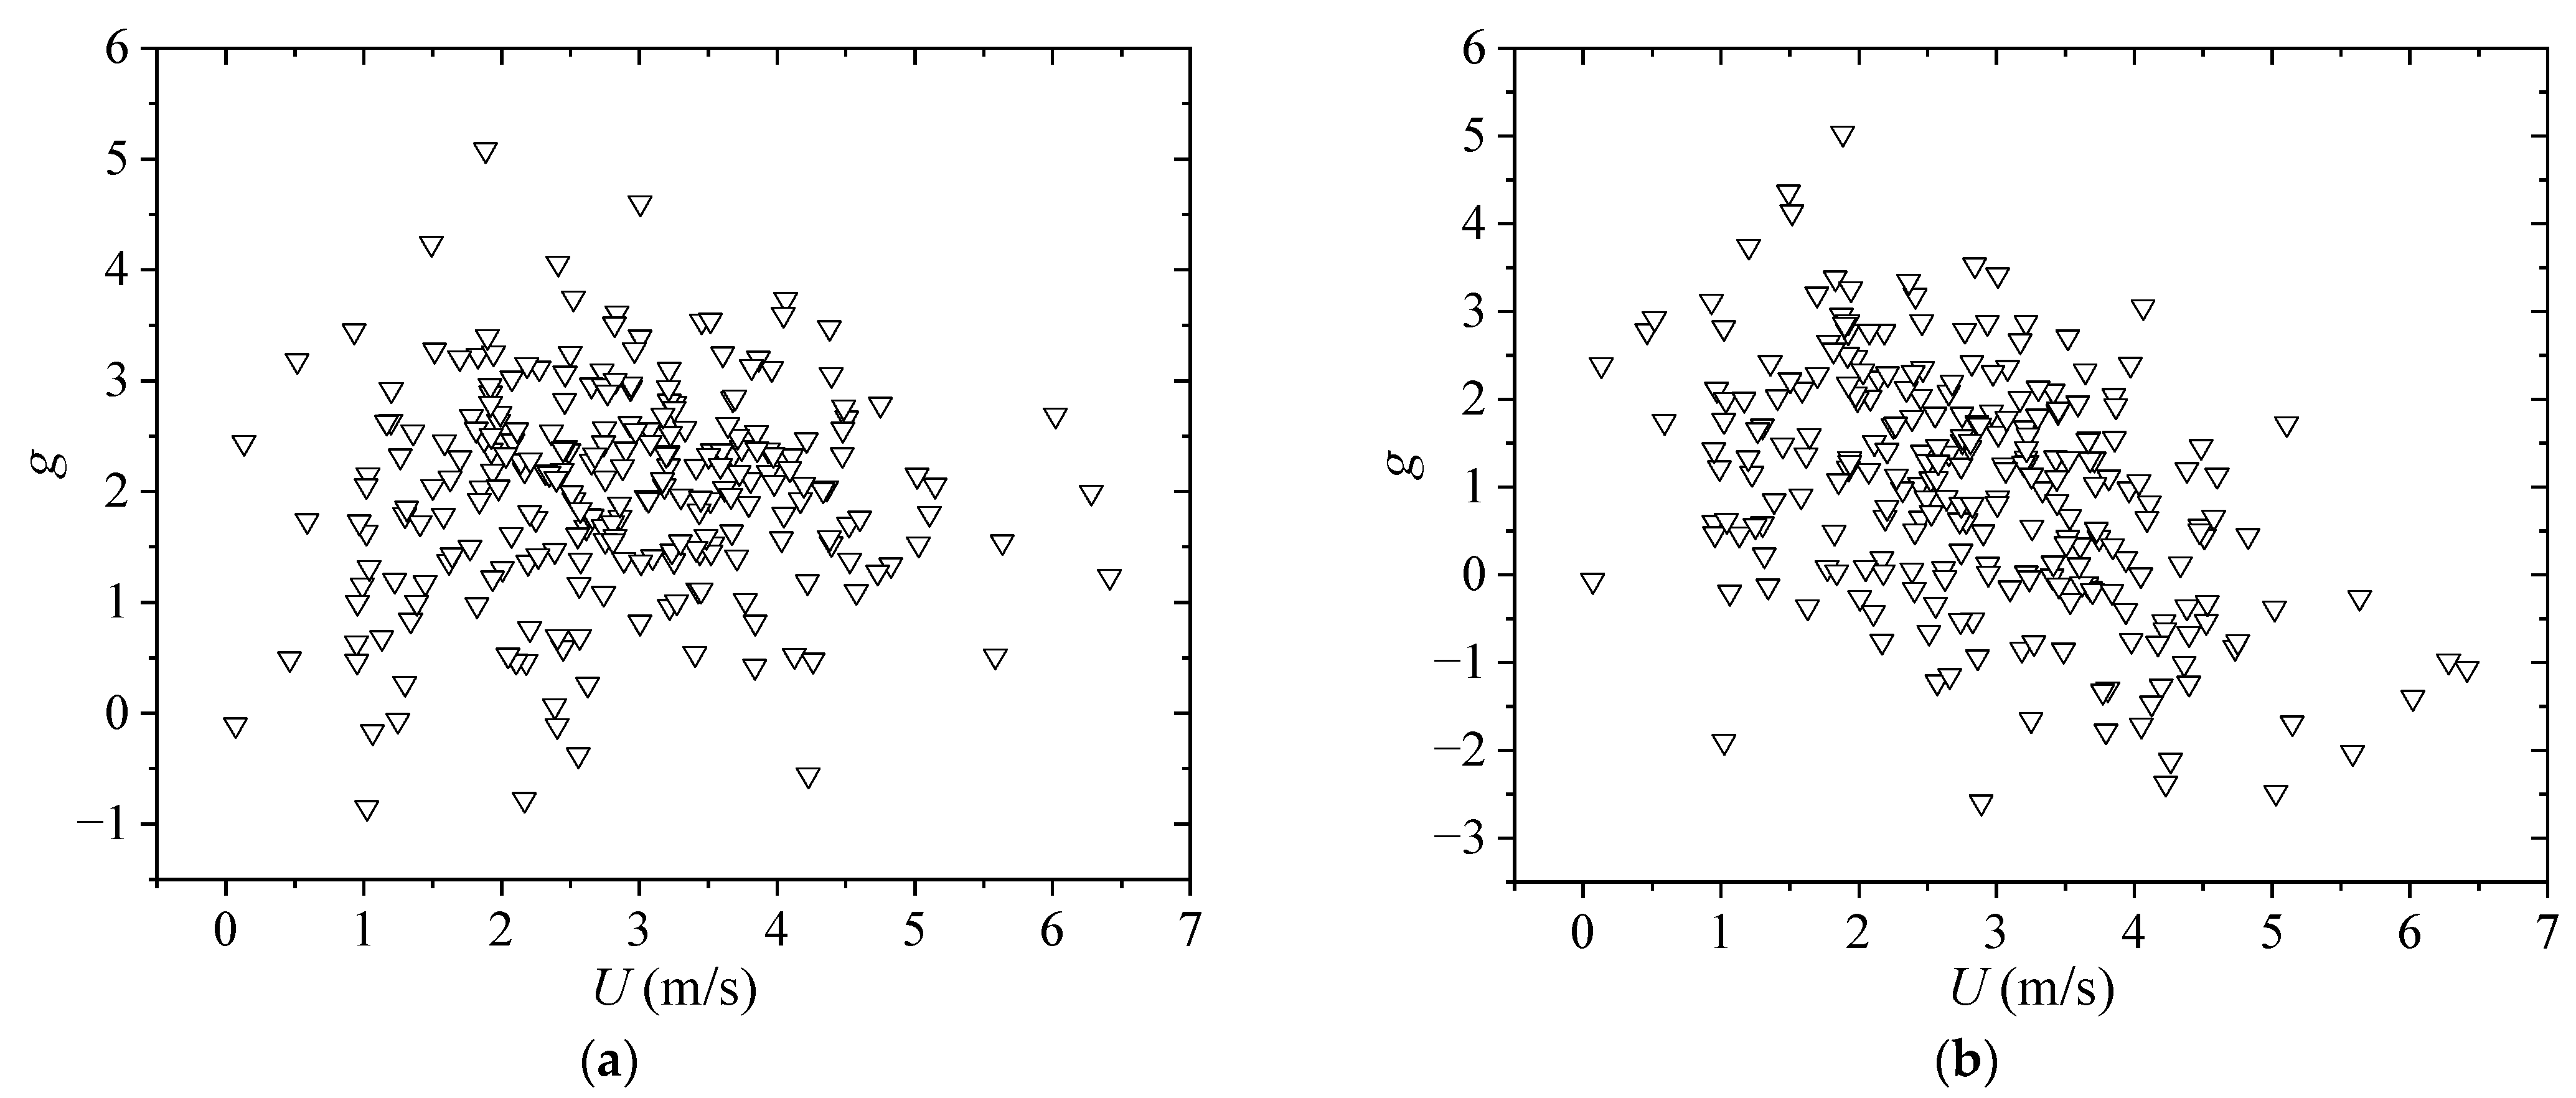
  • The peak factor decreased, though insignificantly, with increasing mean wind speed, and the distribution of peak factors was greatly scattered. The maximum peak factors at the east and west measuring points both fell between 3.0 and 4.0. The gust factor increased as the peak factor increased, and the distribution of gust factors was relatively scattered;
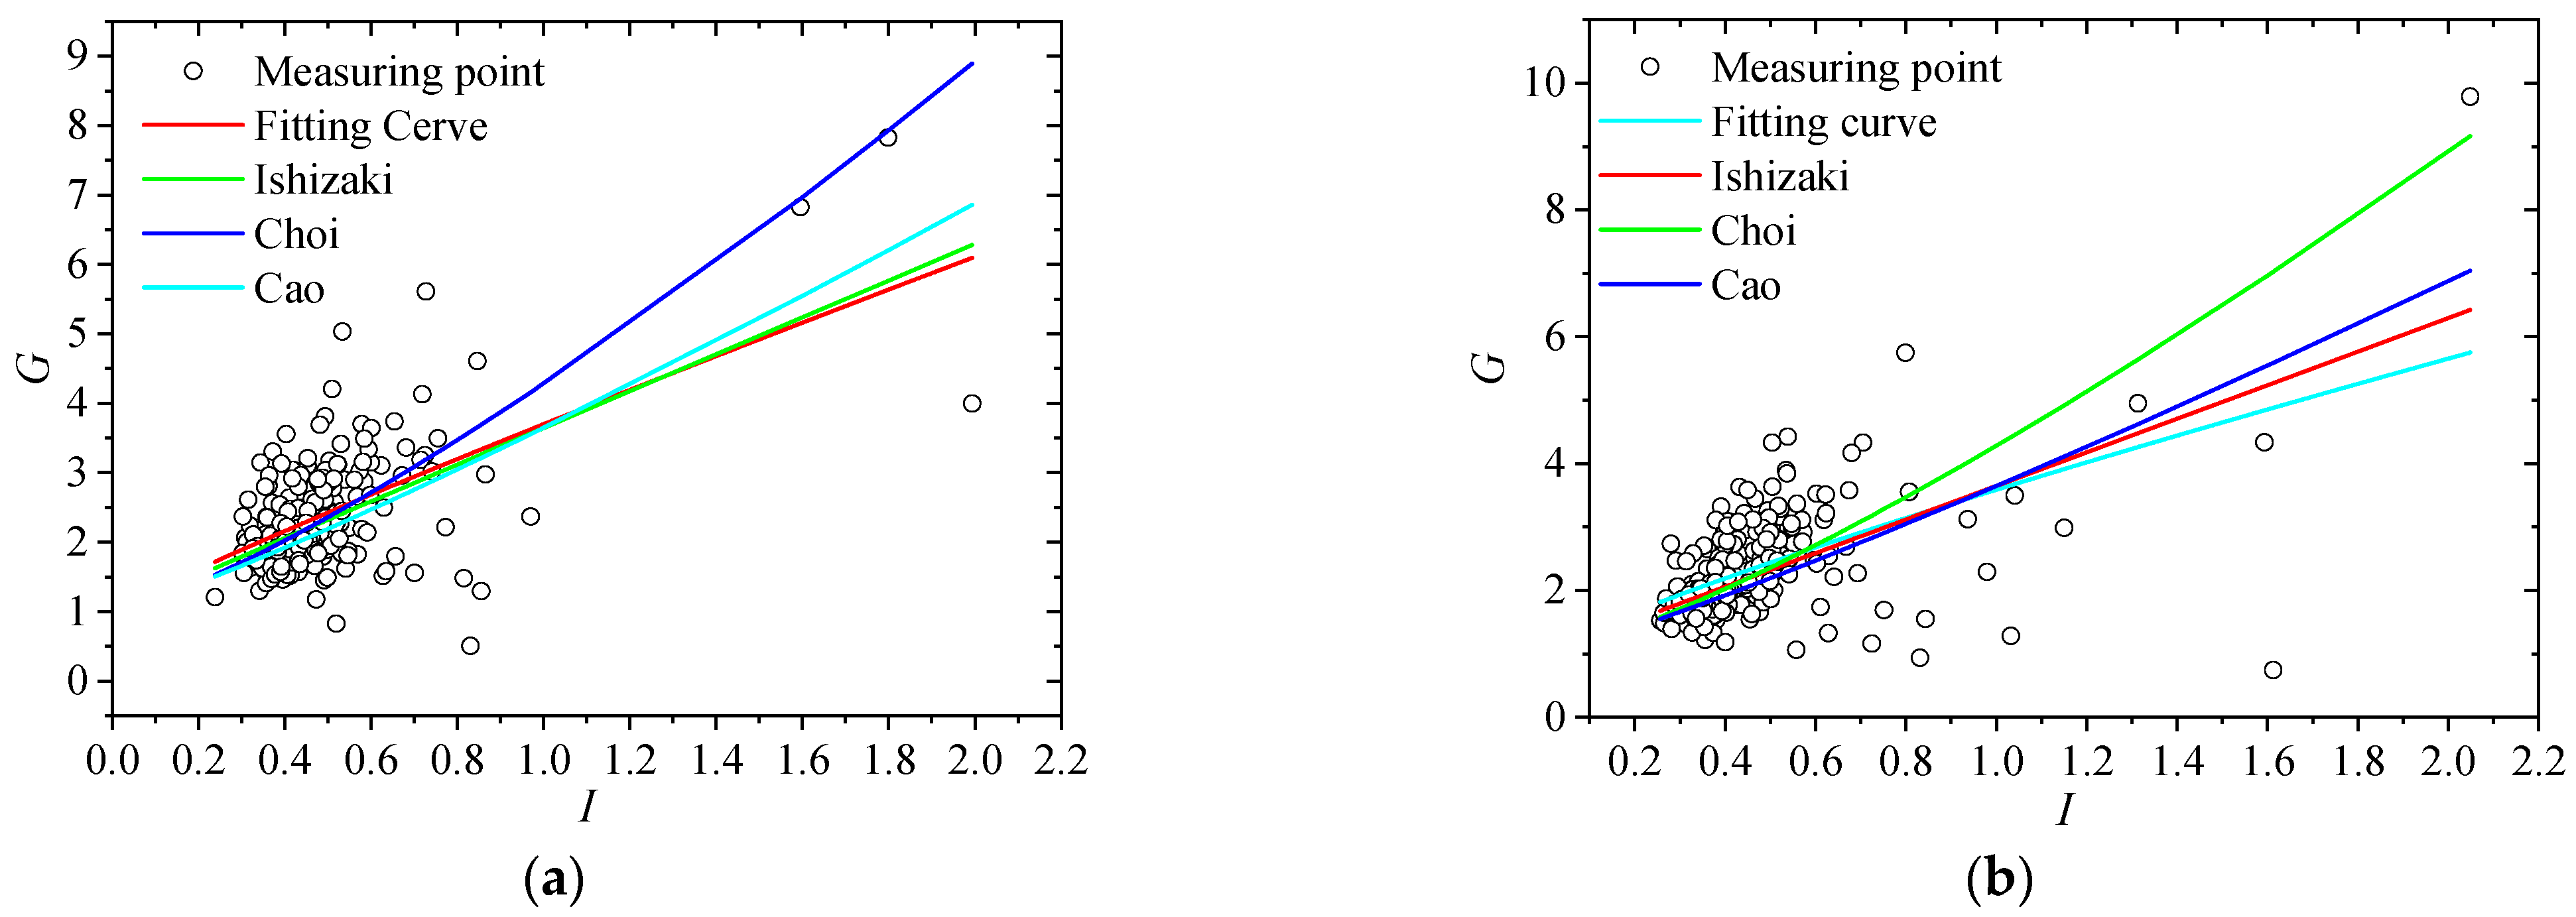
  • With increasing turbulence intensity, the gust factor became larger and exhibited a more scattered distribution. For the east measuring point, the fitting parameters of the fitted curve to the measured data were a = 0.5 and b = 0.97; for the west measuring point, the fitting parameters obtained were a = 0.49 and b = 0.9;
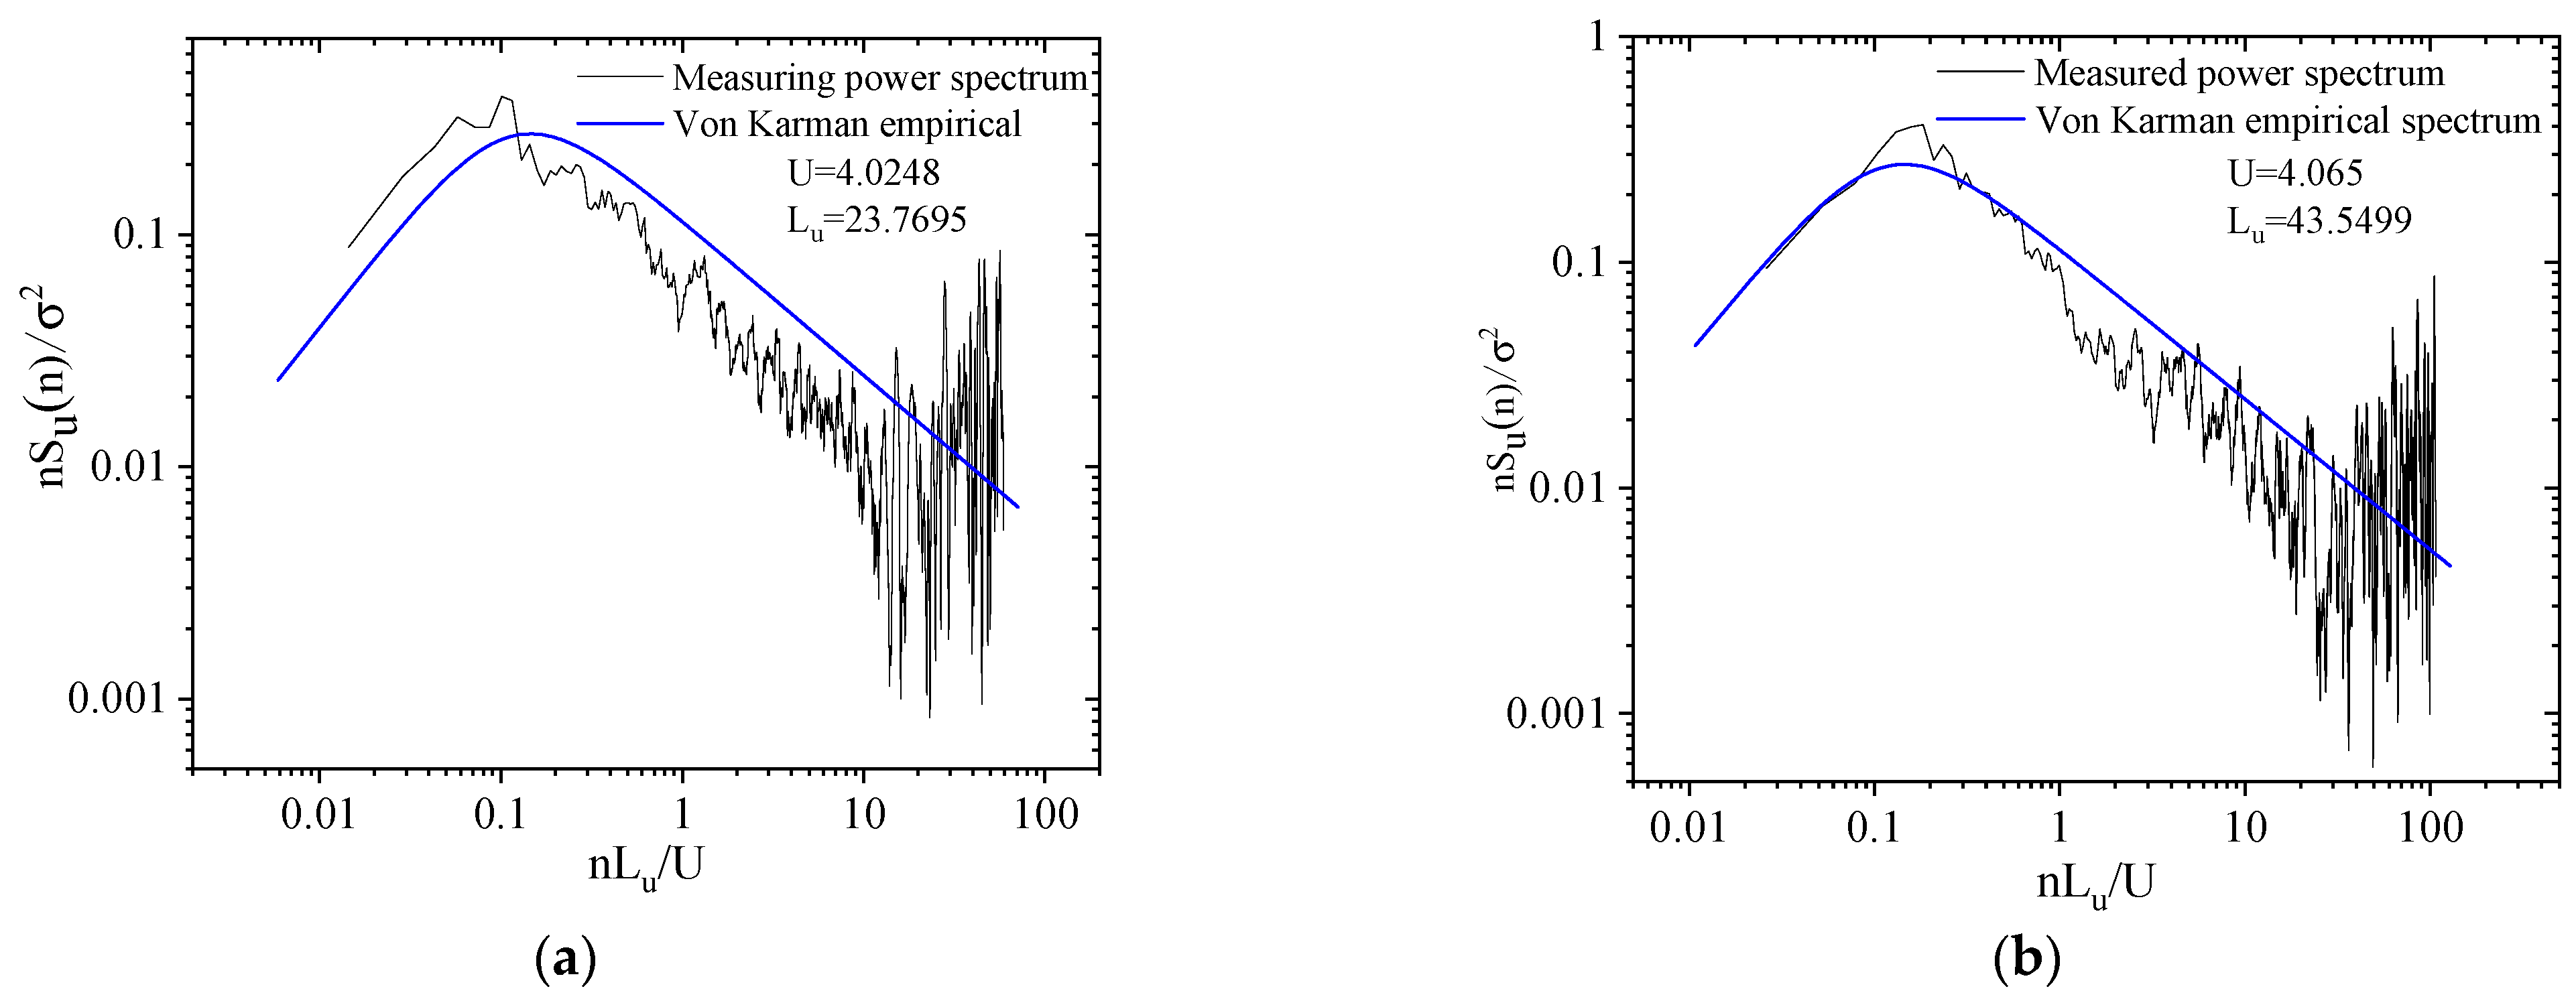
  • The lateral fluctuating wind speed power spectrum and Von Karman’s empirical spectrum are in good agreement for the east and west measurement spots. The power spectrum of the longitudinal fluctuating wind speed is significantly lower than Von Karman’s empirical spectrum for the mid-band spectrum but is higher than Karman’s empirical spectrum for the high-band spectrum. The autocorrelation coefficient decreased with increasing τ over a 10 min interval.

Author Contributions

Conceptualization, Y.W. and Y.L.; methodology, Y.W.; software, Y.L.; validation, Y.L.; formal analysis, Y.W., B.F. and G.F.; investigation, C.Z.; resources, C.Z.; data curation, C.Z.; writing—original draft preparation, Y.W., X.W. and Y.L.; visualization, Y.L. and Q.Q. All authors have read and agreed to the published version of the manuscript.

Funding

This research was funded by Zhejiang Province Natural Science Foundation Project (LY19E080022), Natural Science Foundation of China (51508419, 51678455) and Zhejiang Provincial Department of Education Project (title of the project: Wind Field Characteristic Monitoring and Wind Load Monitoring Research on Coastal Low-rise Buildings, and the number: Y202147409).

Institutional Review Board Statement

Not applicable.

Informed Consent Statement

Not applicable.

Data Availability Statement

Not applicable.

Conflicts of Interest

The authors declare no conflict of interest.

References

  1. Fu, J.Y.; Wu, J.R.; Xu, A.; Li, Q.S.; Xiao, Y.Q. Full-scale measurements of wind effects on Guangzhou West Tower. Eng. Struct. 2012, 35, 120–139. [Google Scholar] [CrossRef]
  2. Wang, H.; Zong, Z.-H.; Li, A.-Q.; Tong, T.; Niu, J.; Deng, W.-P. Digital simulation of 3D turbulence wind field of Sutong Bridge based on measured wind spectra. J. Zhejiang Univ. Sci. A 2012, 13, 91–104. [Google Scholar] [CrossRef]
  3. Wang, B.; Hu, F.; Cheng, X. Wind gust and turbulence statistics of typhoons in South China. Acta Meteorol. Sin. 2011, 25, 113–127. [Google Scholar] [CrossRef]
  4. Song, L.; Pang, J.; Jiang, C.; Huang, H.; Qin, P. Field measurement and analysis of turbulence coherence for Typhoon Nuri at Macao Friendship Bridge. Sci. China Technol. Sci. 2010, 53, 2647–2657. [Google Scholar] [CrossRef]
  5. Shi, W.H.; Li, Z.N.; Zhang, C.X. Field measurements of strong wind characteristics near ground in Wenzhou district. J. Build. Struct. 2010, 31, 34–40. [Google Scholar]
  6. Wang, H.; Li, A.; Guo, T.; Xie, J. Field measurement on wind characteristic and buffeting response of the Runyang Suspension Bridge during typhoon Matsa. Sci. China Ser. E Technol. Sci. 2009, 52, 1354–1362. [Google Scholar] [CrossRef]
  7. Eaton, K.J.; Mayne J, R. The measurement of wind pressures on two-storey houses at Aylesbury. J. Wind Eng. Ind. Aerodyn. 1975, 1, 67–109. [Google Scholar] [CrossRef]
  8. Sparks, P.R.; Reid, G.T.; Reid, W.D.; Welsh, S.; Welsh, N. Wind conditions in Hurricane Hugo by measurement, inference, and experience. J. Wind Eng. Ind. Aerodyn. 1992, 41, 55–66. [Google Scholar] [CrossRef]
  9. Kato, N.; Ohkuma, T.; Kim, J.; Marukawa, H.; Niihori, Y. Full scale measurements of wind velocity in two urban areas using an ultrasonic anemometer. J. Wind Eng. Ind. Aerodyn. 1992, 41, 67–78. [Google Scholar] [CrossRef]
  10. Li, X.; Li, Y.; Zhou, J.; Wang, Q.; Wang, X. Characteristics of Typhoon “Fung-Wong” Near Earth Pulsation. Shock. Vib. 2021, 2021, 9972981. [Google Scholar] [CrossRef]
  11. Zhao, L.; Cui, W.; Ge, Y. Measurement, modeling and simulation of wind turbulence in typhoon outer region. J. Wind Eng. Ind. Aerodyn. 2019, 195, 104021. [Google Scholar] [CrossRef]
  12. Yao, Y.; Wu, H.; Li, X.; Zhao, B.; Chen, B.; Yi, T. A review of the transmission tower-line system performance under typhoon in wind tunnel test. Wind Struct. Int. J. 2019, 29, 87–98. [Google Scholar]
  13. Kubota, T.; Miura, M.; Tominaga, Y.; Mochida, A. Wind tunnel tests on the relationship between building density and pedestrian-level wind velocity: Development of guidelines for realizing acceptable wind environment in residential neighborhoods. Build. Environ. 2008, 43, 1699–1708. [Google Scholar] [CrossRef]
  14. Lu, B.; Li Q, S. Investigation of the effects of wind veering and low-level jet on wind loads of super high-rise buildings by large eddy simulations. J. Wind Eng. Ind. Aerodyn. 2022, 227, 105056. [Google Scholar] [CrossRef]
  15. Ren, H.; Laima, S.; Chen, W.-L.; Zhang, B.; Guo, A.; Li, H. Numerical simulation and prediction of spatial wind field under complex terrain. J. Wind Eng. Ind. Aerodyn. 2018, 180, 49–65. [Google Scholar] [CrossRef]
  16. Huang, S.; Li, Q.; Xu, S. Numerical evaluation of wind effects on a tall steel building by CFD. J. Constr. Steel Res. 2007, 63, 612–627. [Google Scholar] [CrossRef]
  17. Feng, C.; Gu, M. Numerical simulation of wind veering effects on square-section super high-rise buildings under various wind directions. J. Build. Eng. 2021, 44, 102954. [Google Scholar] [CrossRef]
  18. Tao, T.; Wang, H.; Zhao, K. Efficient simulation of fully non-stationary random wind field based on reduced 2D hermite interpolation. Mech. Syst. Signal Processing 2021, 150, 107265. [Google Scholar] [CrossRef]
  19. Tao, T.; Shi, P.; Wang, H. Spectral modelling of typhoon winds considering nexus between longitudinal and lateral components. Renew. Energy 2020, 162, 2019–2030. [Google Scholar] [CrossRef]
  20. Zhang, J.; Zhang, M.; Huang, B.; Li, Y.; Yu, J.; Jiang, F. Wind Tunnel Test on Local Wind Field around the Bridge Tower of a Truss Girder. Adv. Civ. Eng. 2021, 2021, 8867668. [Google Scholar] [CrossRef]
  21. Li, Y.; Xu, X.; Zhang, M.; Xu, Y. Wind tunnel test and numerical simulation of wind characteristics at a bridge site in mountainous terrain. Adv. Struct. Eng. 2017, 20, 1223–1231. [Google Scholar] [CrossRef]
  22. Giorgio, D.; Omarini, S. A non-linear method to compute the buffeting response of a bridge validation of the model through wind tunnel tests. J. Wind Eng. Ind. Aerodyn. 2020, 201, 104163. [Google Scholar]
  23. Li, C.; Chen, Z.; Zhang, Z.; Cheung, J. Wind tunnel modeling of flow over mountainous valley terrain. Wind Struct. 2010, 13, 275. [Google Scholar] [CrossRef]
  24. Li, Y.; Hu, P.; Xu, X.; Qiu, J. Wind characteristics at bridge site in a deep-cutting gorge by wind tunnel test. J. Wind Eng. Ind. Aerodyn. 2017, 160, 30–46. [Google Scholar] [CrossRef]
  25. Argentini, T.; Ozkan, E.; Rocchi, D.; Rosa, L.; Zasso, A. Cross-wind effects on a vehicle crossing the wake of a bridge pylon. J. Wind Eng. Ind. Aerodyn. 2011, 99, 734–740. [Google Scholar] [CrossRef]
  26. Song, J.-L.; Li, J.-W.; Flay, R.G. Field measurements and wind tunnel investigation of wind characteristics at a bridge site in a Y-shaped valley. J. Wind Eng. Ind. Aerodyn. 2020, 202, 104199. [Google Scholar] [CrossRef]
  27. Zisis, I.; Stathopoulos, T. Wind load transfer mechanisms on a low wood building using full-scale load data. J. Wind. Eng. Ind. Aerodyn. 2012, 104–106, 65–75. [Google Scholar] [CrossRef]
  28. Li, Q.S.; Hu, S.Y. Monitoring of wind effects on an instrumented low-rise building during severe tropical storm. Wind Struct. 2015, 20, 469–488. [Google Scholar] [CrossRef]
  29. Li, Q.S.; Hu, S.Y.; Dai, Y.M.; He, Y.C. Field measurements of extreme pressures on a flat roof of a low-rise building during typhoons. J. Wind Eng. Ind. Aerodyn. 2012, 111, 14–29. [Google Scholar] [CrossRef]
  30. Li, J.; Hu, S.; Li, Q. Comparative study of full-scale and model-scale wind pressure measurements on a gable roof low-rise building. J. Wind Eng. Ind. Aerodyn. 2021, 208, 104448. [Google Scholar] [CrossRef]
  31. Wang, H.; Guo, T.; Tao, T.-Y.; Li, A.-Q. Study on Wind Characteristics of Runyang Suspension Bridge Based on Long-Term Monitored Data. Int. J. Struct. Stab. Dyn. 2016, 16, 1640019. [Google Scholar] [CrossRef]
  32. Wang, H.; Wu, T.; Tao, T.; Li, A.; Kareem, A. Measurements and analysis of non-stationary wind characteristics at Sutong Bridge in Typhoon Damrey. J. Wind Eng. Ind. Aerodyn. 2016, 151, 100–106. [Google Scholar] [CrossRef] [Green Version]
  33. Zhang, H.; Wang, H.; Xu, Z.; Zhang, Y.; Tao, T.; Mao, J. Monitoring-based analysis of wind-induced vibrations of ultra-long stay cables during an exceptional wind event. J. Wind Eng. Ind. Aerodyn. 2022, 221, 104883. [Google Scholar] [CrossRef]
  34. Pang, J.; Lin, Z.; Ge, Y. Field measurements of strong wind characteristics near ground in Pudong district. In Proceedings of the 9th National Conference on Atmospheric Environment and Pollution, Dalian, China, 16–19 October 2001; pp. 14–22. [Google Scholar]
  35. Peng, H.; Yin-tao, D.A.I.; Xu, W.A.N.G.; Ming, G.U. Field measurement on power spectra and coherence characteristics of near-ground wind in shanghai coastal area. Eng. Mech. 2014, 31, 126–133. [Google Scholar]
  36. Wang, Y.; Li, Y.; Fu, B.; Wang, X.; Zhang, C.; Fan, G. Characteristics of the Near-Ground Typhoon Morakot. Shock Vib. 2021, 2021, 9968586. [Google Scholar] [CrossRef]
  37. Ishizaki, H. Wind profiles, turbulence intensities and gust factors for design in typhoon-prone regions. J. Wind Eng. Ind. Aerodyn. 1983, 13, 55–66. [Google Scholar] [CrossRef]
  38. Choi, C. Wind Loading in Hong Kong: Commentary on the Code of Practice on Wind Effects Hong Kong, 1983; Hong Kong Institution of Engineers: Hong Kong, China, 1984. [Google Scholar]
  39. Cao, S.; Tamura, Y.; Kikuchi, N.; Saito, M.; Nakayama, I.; Matsuzaki, Y. Wind characteristics of a strong typhoon. J. Wind Eng. Ind. Aerodyn. 2009, 97, 11–21. [Google Scholar] [CrossRef]
  40. Von Kármán, T. Progress in the Statistical Theory of Turbulence. Proc. Natl. Acad. Sci. USA 1948, 34, 530–539. [Google Scholar] [CrossRef] [Green Version]
  41. Davenport, A.G. The spectrum of horizontal gustiness near the ground in high winds. Q. J. R. Meteorol. Soc. 1961, 87, 194–211. [Google Scholar] [CrossRef]
  42. Ashcroft, J. The relationship between the gust ratio, terrain roughness, gust duration and the hourly mean wind speed. J. Wind Eng. Ind. Aerodyn. 1994, 53, 331–355. [Google Scholar] [CrossRef]
  43. Krayer, W.R.; Marshall, R.D. Gust factors applied to hurricane winds. Bull. Am. Meteorol. Soc. 1992, 73, 613–618. [Google Scholar] [CrossRef] [Green Version]
  44. Durst, C.S. Wind speeds over short periods of time. Meteorol. Mag. 1960, 89, 181–186. [Google Scholar]
  45. Wang, X.; Huang, P.; Yu, X.-F.; Huang, C. Near ground wind characteristics during typhoon Meari: Turbulence intensities, gust factors, and peak factors. J. Cent. South Univ. 2017, 24, 2421–2430. [Google Scholar] [CrossRef]
Figure 1. Track of Typhoon Jangmi.
Sustainability 14 09266 g001
Figure 2. Arrangement of the anemometers.
Sustainability 14 09266 g002
Figure 3. Variations in mean wind speed and main wind direction with time: (a) Variation in mean wind speed with time; (b) Variation in main wind direction with time.
Sustainability 14 09266 g003
Figure 4. Probability density of measured fluctuating wind speed: (a) East; (b) West.
Sustainability 14 09266 g004
Figure 5. Variation in turbulence intensity with mean wind speed: (a) East; (b) West.
Sustainability 14 09266 g005
Figure 6. Variation in turbulence intensity with time interval: (a) East; (b) West.
Sustainability 14 09266 g006
Figure 7. Variation in gust factor with mean wind speed: (a) East; (b) West.
Sustainability 14 09266 g007
Figure 8. Variation in gust factor with time interval: (a) East; (b) West; (c) East; (d) West.
Sustainability 14 09266 g008aSustainability 14 09266 g008b
Figure 9. Variation in peak factor with mean wind speed: (a) East; (b) West.
Sustainability 14 09266 g009
Figure 10. Variations in peak factor with time interval: (a) East; (b) West.
Sustainability 14 09266 g010
Figure 11. Variation in gust factor with peak factor: (a) East; (b) West.
Sustainability 14 09266 g011
Figure 12. Variations in gust factor with turbulence intensity: (a) East; (b) West.
Sustainability 14 09266 g012
Figure 13. Power spectrum of longitudinal fluctuating wind speed: (a) East; (b) West.
Sustainability 14 09266 g013
Figure 14. Power spectrum of lateral fluctuating wind speed: (a) East; (b) West.
Sustainability 14 09266 g014
Figure 15. Relationship between longitudinal turbulence integral scale and mean wind speed: (a) East; (b) West.
Sustainability 14 09266 g015
Figure 16. Relationship between lateral turbulence integral scale and mean wind speed: (a) East; (b) West.
Sustainability 14 09266 g016
Figure 17. Coherence coefficient curves of longitudinal and lateral fluctuating wind speeds: (a) Longitudinal measuring point 1; (b) Lateral measuring point 1; (c) Longitudinal measuring point 2; (d) Lateral measuring point 2; (e) Longitudinal measuring point 3; (f) Lateral measuring point 3; (g) Longitudinal measuring point 4; (h) Lateral measuring point 4.
Sustainability 14 09266 g017aSustainability 14 09266 g017b
Figure 18. Autocorrelation coefficient of fluctuating wind speed in each direction: (a) Measuring point 1; (b) Measuring point 2; (c) Measuring point 3; (d) Measuring point 4.
Sustainability 14 09266 g018
Publisher’s Note: MDPI stays neutral with regard to jurisdictional claims in published maps and institutional affiliations.

