Review

Personal Carbon Budgets: A Pestle Review

Faculty of Environmental and Life Sciences, University of Southampton, University Rd., Highfield, Southampton SO17 1BJ, UK
*
Author to whom correspondence should be addressed.
Sustainability 2022, 14(15), 9238; https://doi.org/10.3390/su14159238
Submission received: 5 July 2022 / Revised: 18 July 2022 / Accepted: 26 July 2022 / Published: 28 July 2022
(This article belongs to the Topic Climate Change and Environmental Sustainability)

Abstract

:
Personal Carbon Budgets (PCBs) are a radical policy innovation that seek to reduce an individual’s carbon consumption. This review identifies three archetypes of PCBs in the current literature; Personal Carbon Trading, Carbon Tax and Carbon Labelling. We theorised that carbon trading could affect equity and allow quality of life and consumption to be driven by income rather than needs. We, therefore, developed a new model (Personal Carbon Allowance with no trading) to compare to existing archetypes. A PESTLE (Political, Economic, Social, Technological, Legal, Environmental) framework was applied to each archetype to analyse and compare their costs and benefits and to critically evaluate and identify which model may be the most appropriate to reduce emissions severely but equitably. We conclude that the only model that can achieve this is our proposed Personal Carbon Allowance (PCA) model with no trading. PCA has a hard cap on emissions allowing for controllable severe cuts to emissions, and the lack of trading would prohibit those with wealth from continuing high-consumption lifestyles at the expense of those with lower incomes.

1. Introduction

Carbon emissions are the key contributor to climate change [1]. In order to halt global temperature rises to a level at which catastrophic climate change impacts would be limited, greenhouse gases (GHGs) must be reduced [1]. One of the largest contributors to carbon emissions is household consumption; household energy consumption, personal transport and food consumption are key drivers of household emissions [2]. Whilst many seek a top-down approach to reducing carbon emissions, for example, regulating industry, all sources of emissions must be addressed to slow climate change.
Due to the severity of the threat of catastrophic climate change, it is imperative that definite and effective actions take place (‘actions not words’); these may be uncomfortable to many, but the scientific consensus is that we are reaching ‘the point of no return’ in terms of anthropogenic emissions and their adverse impacts. Whilst governments, such as the United Kingdom’s, have commitments to reduce GHG emissions in law, the reductions needed are deep, and it is highly unlikely that targets will be met [1,3]. The Climate Change Committee (CCC), the UK government’s climate advisors, state within the Sixth Carbon Budget report that the UK needs to aggressively cut emissions by 78% of 1990 levels over the next fifteen years to achieve the ‘Net Zero’ emissions target by 2050 [3]. The CCC also advises that despite the UK’s sizable efforts to reduce emissions, the government is currently ‘off track’ to meet the targets of the Fourth and Fifth Carbon Budgets [4]. New policies that are more radical need to be delivered quickly to cut emissions. This is evident even in countries setting and working towards ambitious ‘Net Zero’ goals, since these goals may be out of reach with current strategies and policies.
Several policy interventions have been proposed to reduce personal carbon emissions; these range from a carbon tax to carbon labelling and personal carbon trading. Personal carbon trading has not been applied yet, whereas carbon taxes and carbon labelling have been employed by either governments or businesses (in the case of carbon labelling). The features of these models vary; some include carbon allocations for individuals, whilst others seek to nudge the public into reshaping their consumption behaviours. Personal carbon trading has been tested in small pilot studies but never applied on a large scale due to how complex it may be to implement and how radical a policy it is perceived to be [4,5,6,7,8]. Therefore, the features of this model vary, but the inclusion of the trading of carbon ‘credits’ or their allocation is always a key feature.
Three archetypes have been defined from the synthesis of the existing literature; however, these models are rarely critically reviewed and compared to each other in terms of their potential efficiency in reducing emissions and costs as well as their benefits, to ascertain which is the most viable.
We propose a fourth personal carbon budget archetype—personal carbon allowance (no trading). Trading is usually involved in mandatorily capped carbon budgets (PCT), or if not included in a study or pilot, it is the ‘end goal’ of such schemes and will be mentioned extensively in the discussions around the study [5,6,7,8]. The removal of trading may have a host of different impacts on how a carbon budget may work and may provide answers to issues raised by the inclusion of trading in proposed PCT models. To evaluate the benefits of this new policy a social framework is of great benefit, such as by a PESTLE (Political, Economic, Social, Technological, Legal, Environmental) analysis [9].
PCT has been evaluated to be a progressive policy measure, particularly those with an allocated budget, as they ‘level the playing field’, allowing those from lower income backgrounds to be on equal footing as those from higher income backgrounds [8,10,11,12,13,14]. This could be reinforced even further by eliminating trading, particularly trading where credits can be purchased using money that would give advantage back to those who are more affluent. A CT tax would be a regressive tax since via reducing carbon emissions, different policies could have drastically different impacts on people’s lives depending on their circumstances/demographics [11,12,13].
The proposed PCA model is unique as it eliminates trading, a ubiquitous feature of mandatory budget models. Almost all proposed PCB schemes with a cap and mandatory limit include trading or will include trading at a later point [6,7,8,14,15,16,17,18,19,20,21]. Most proposed policies with a hard cap and allocation of emissions include trading as a standard unquestioned feature. PCT (and the proposed PCA) differ from carbon taxation and carbon labelling due to the hard cap they can apply on overall emissions generated. Each individual would be given an allocation that was part of a larger national or international budget that could not be exceeded [14,15,16,17,18,19,20,21]. Carbon labelling is voluntary, and therefore, it is impossible to have an enforced cap, even if there was a suggested allocation for the public to attempt to stay within [22,23,24].

2. Personal Carbon Budget Models

Within the peer reviewed and grey literature, numerous permutations of PCBs have been proposed and discussed, alongside other policy interventions that have been considered as reasonable alternatives to PCBs. These models fall into three broad categories. This paper identifies three main overall archetype: personal carbon trading (PCT), carbon labelling (CL) and carbon tax (CT). We propose a personal carbon allowance with no trading (PCA) as a separate model from PCT (Table 1). Each model aims to reduce carbon emissions from the public.
To review and compare each model, each model was defined according to a review of the literature. An adapted PESTLE (Political, Economic, Social, Technological, Legal and Environmental) analysis framework has been applied to each model, synthesising information from the existing literature with reasonable assumptions [9]. A set of questions were developed in order to facilitate a critical evaluation of each model. Not all the questions applied to all models in all cases, but they indicate general areas of importance (see Supplementary Materials Part S1). Key features of each model were identified in relation to each PESTLE factor according to the answers to the set questions (see Supplementary Materials Part S2).
Carbon offsetting has not been included in this review since it is out of its scope; it is not a specific personal carbon reduction policy as it can be used more generally across businesses and other groups. Carbon offsetting does not directly reduce emissions—it simply seeks to neutralise them—and is thus outside the scope of this review.

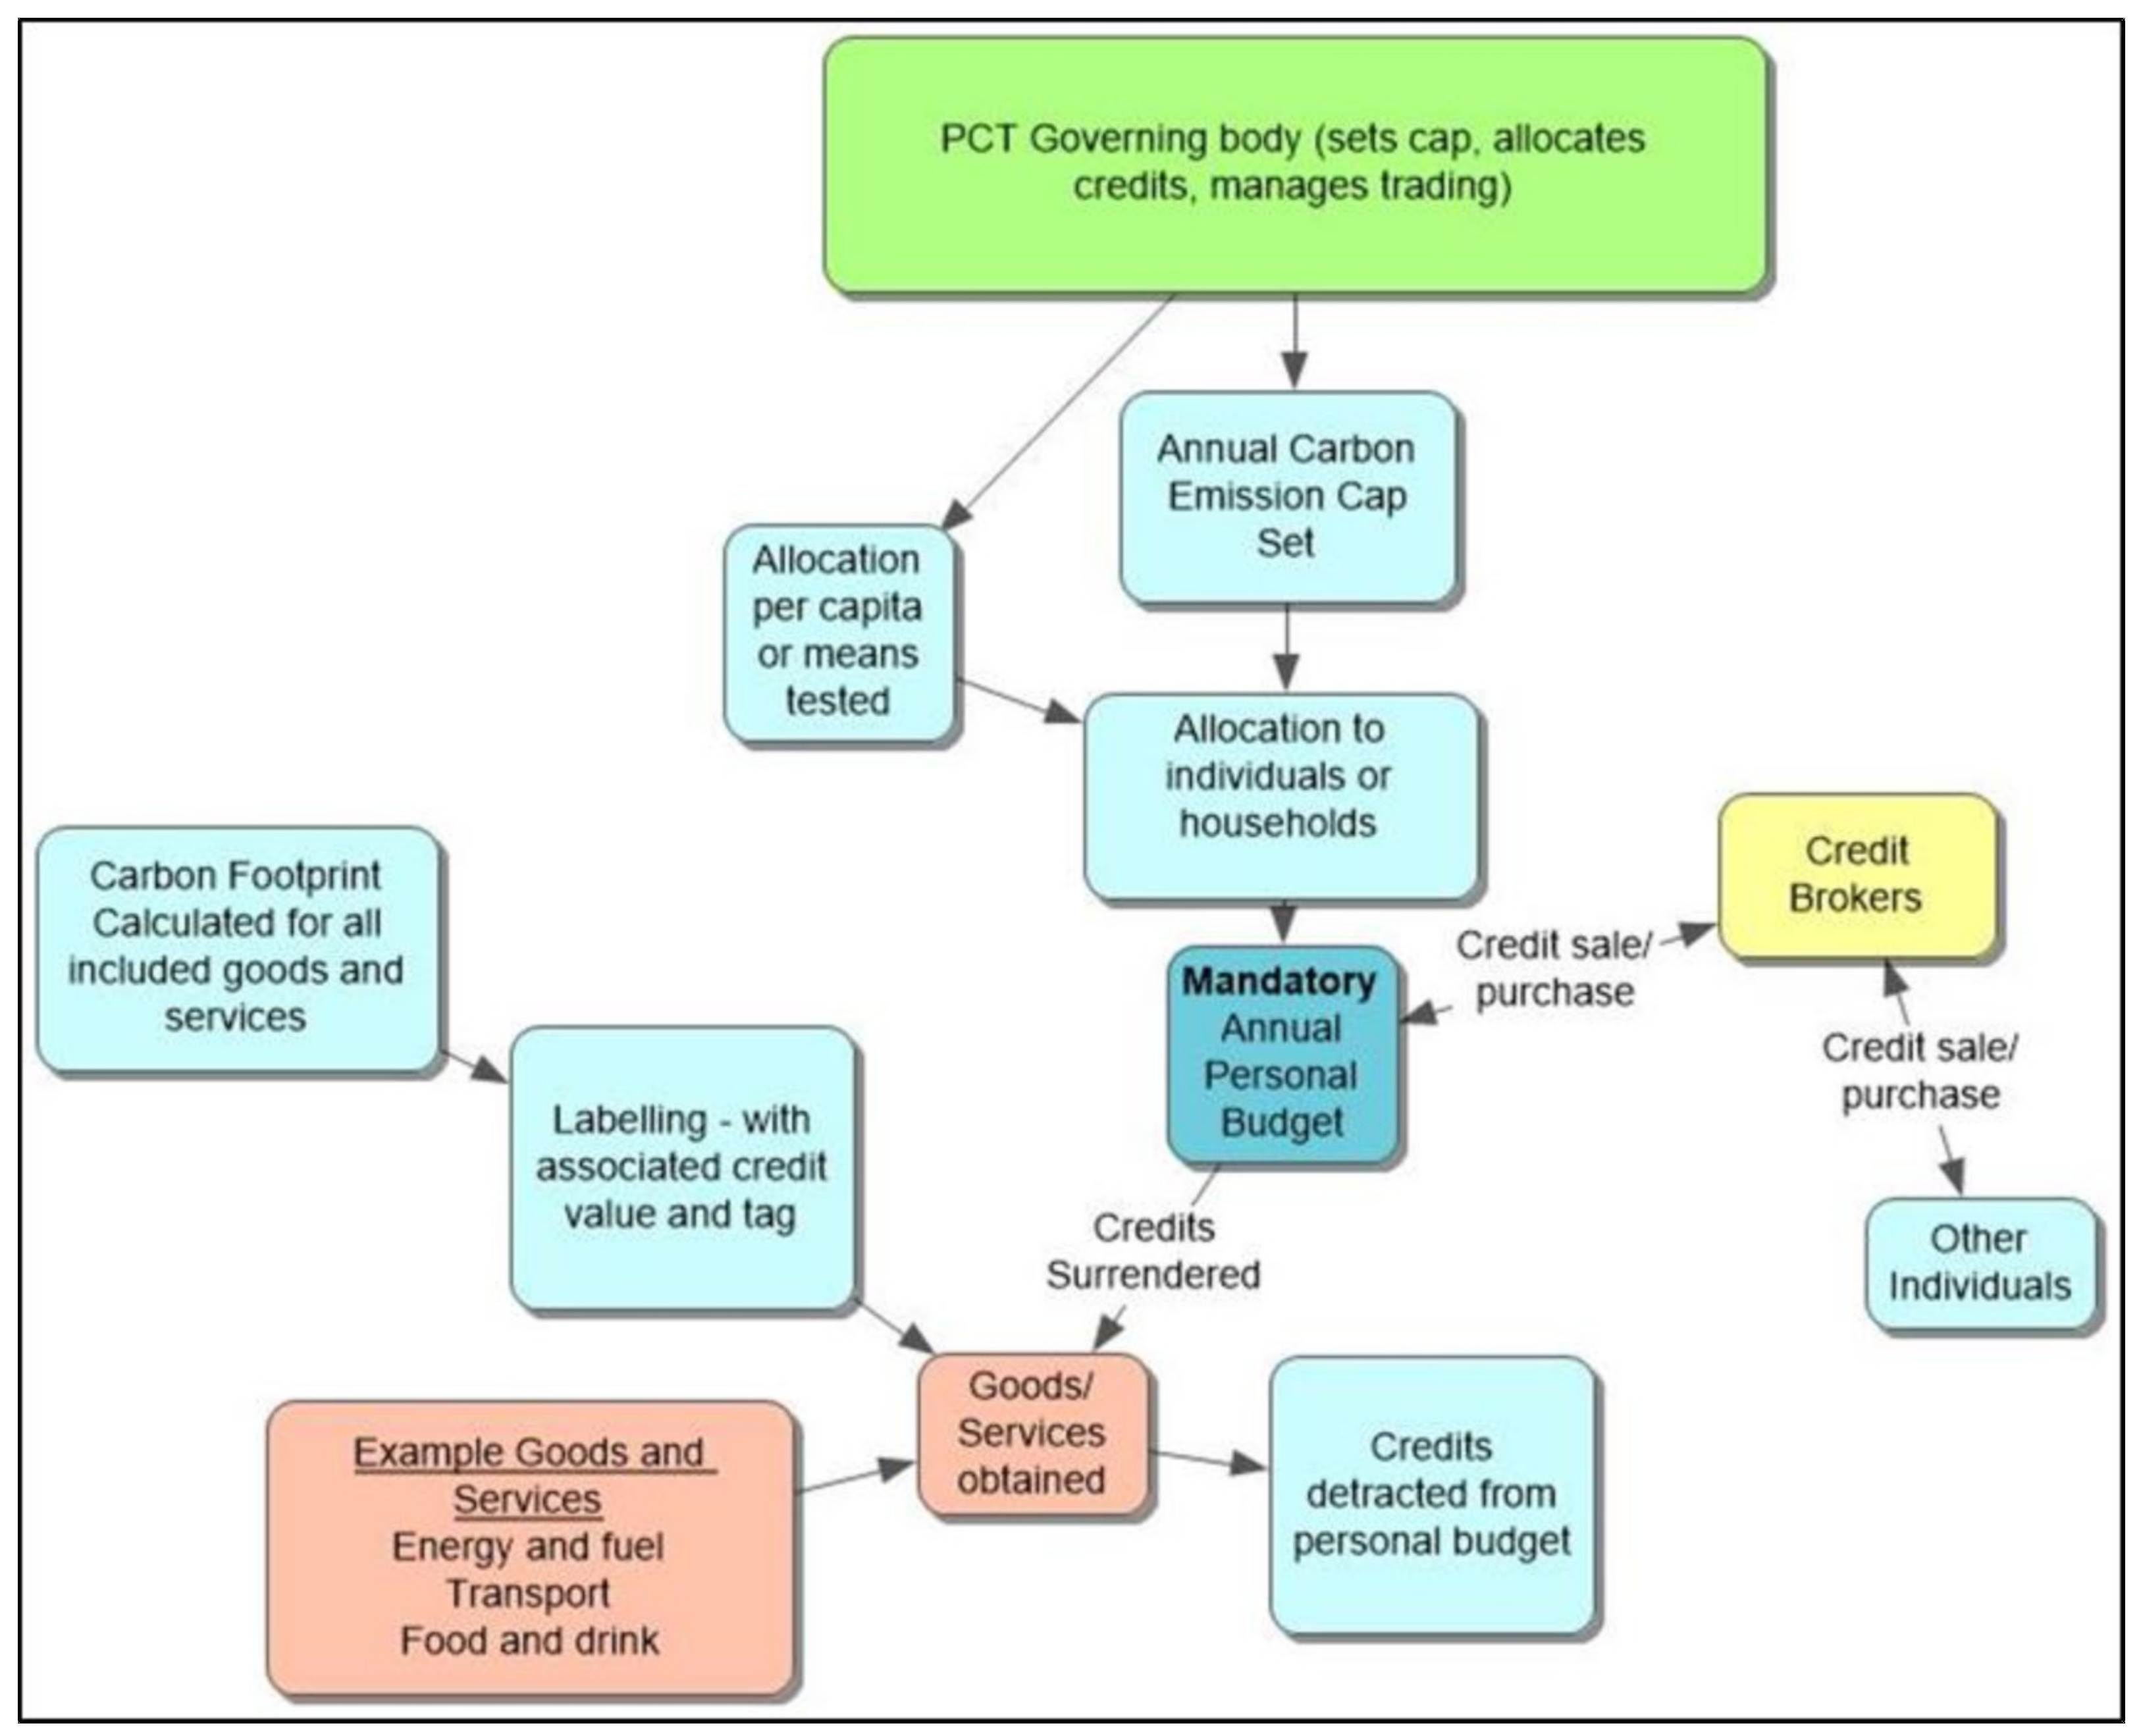
2.1. Personal Carbon Trading

Personal carbon trading (PCT) is a cap-and-trade model for reducing carbon emissions (Table 1 highlights the key features of this model). A limit (cap) is put upon the weight of carbon (as CO2e) that can be emitted by a country/area/population for a unit of time, often a year. This cap amount is then allocated amongst those regulated by the scheme [13,25]. These allocations would likely be in the form of carbon credits to be ‘spent’ on goods and services; credits can be traded to other members of the public via a credit broker for a set monetary value [6,26]. The ability to purchase additional credits means those with higher incomes would be at an advantage to live higher-consumption lifestyles; some models propose a limit to how much of a carbon allowance may be traded, but there is no consensus on what this limit should be [14,27]. Figure 1 demonstrates how a hypothetical PCT scheme may work.
A personal carbon trading scheme may only involve the public, but versions of this model include industry. Tradable Energy Quota (TEQ) models allocate approximately 40% of to the public, with the remaining 60% auctioned to qualifying firms [25,28].
DEFRA’s (2008) report, among others, proposes a system whereby the credits are monitored through existing banking systems and contactless cards are used in order to spend credits [28,29,30]. These cards would make use of existing contactless machines in shops and would have an account where the public could track their credit spending.

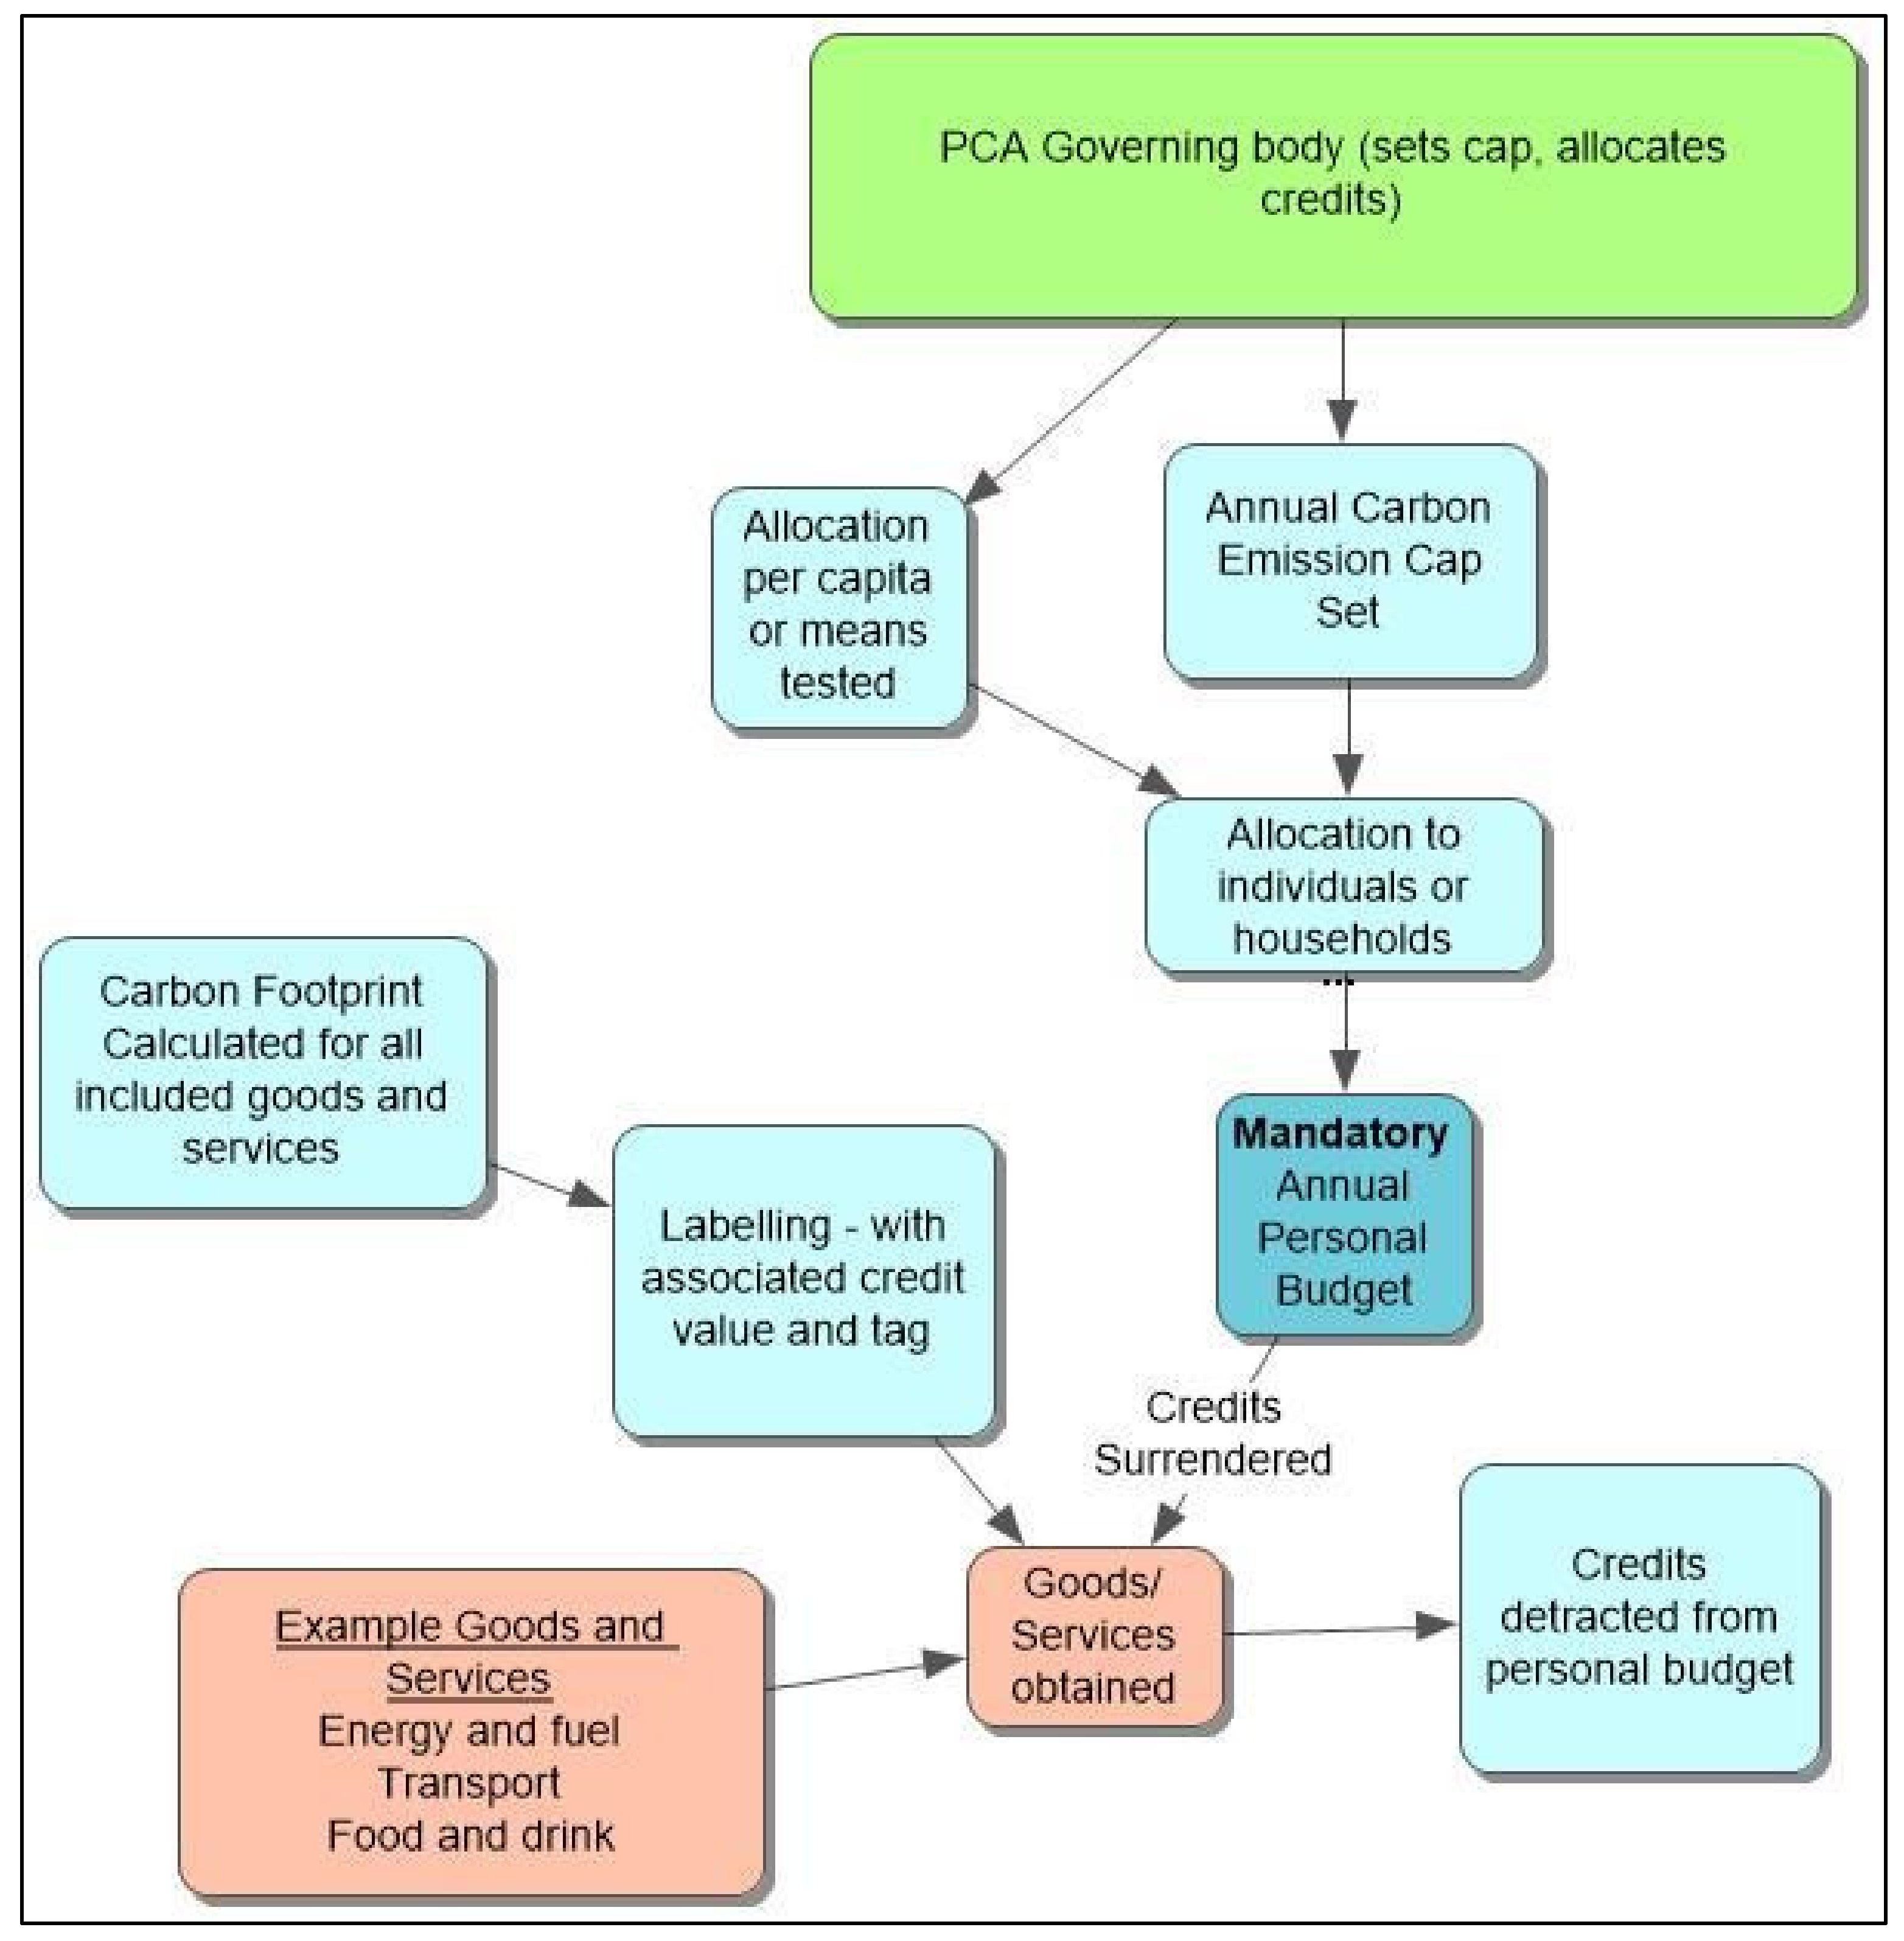
2.2. Personal Carbon Allowance (No Trading)

A PCA model without trading is mostly identical to a PCT model as the methods for the distribution of carbon, the scope of emissions and various other technical aspects can be the same (see Section 2.1). Most literature on PCBs that cap individual carbon emissions involve carbon trading, with few suggesting no trading of any kind, although some studies propose a limit on the percentage of the allowance that can be traded [14,31,32]. Table 1 highlights the key features of this model. PCA bypasses the social justice issues surrounding the ability of those with greater wealth to purchase carbon credits from those of lower incomes to continue their current lifestyles. Within the existing literature, most PCT/PCA models involve trading, and no thorough examination has been given regarding the implications of eliminating trading. It may be that personal allowances are too low to reach the reductions needed so that trading would be redundant. Figure 2 demonstrates how a hypothetical PCA scheme may work.
Allocations of carbon credits in a PCA model would be of great importance. The public would not be able to ‘top up’ their allowance by trading, even if their need is justified. The governing body would have to accurately and fairly distribute allowances with consideration for specific requirements and needs, such as; mobility, housing (for example a detached house is more expensive to heat than a terraced house), disability, gender, age and potentially even cultural impacts such as religious or cultural requirements. The governing body that would monitor and oversee a PCA scheme may need to have a reserve of carbon credits that could be applied in the case of an individual going beyond their allocation for unforeseen circumstances or needs.
Public carbon allowance schemes have arisen in recent years, notably Carbon Rationing Action Groups (CRAGs). CRAGs are voluntary measures, and each participant is given a carbon allowance per year that they then manage and account for personally. If they go over this allowance, they pay a penalty for their carbon debt (Carbon Day, 2021; Howell, 2012). This is similar to the proposed idea of PCA in this paper, as currently there is no trading in the CRAGs model; however, it is not mandatory and has no hard cap. At the time of writing, no government has implemented a PCA (or PCT) scheme or policy.

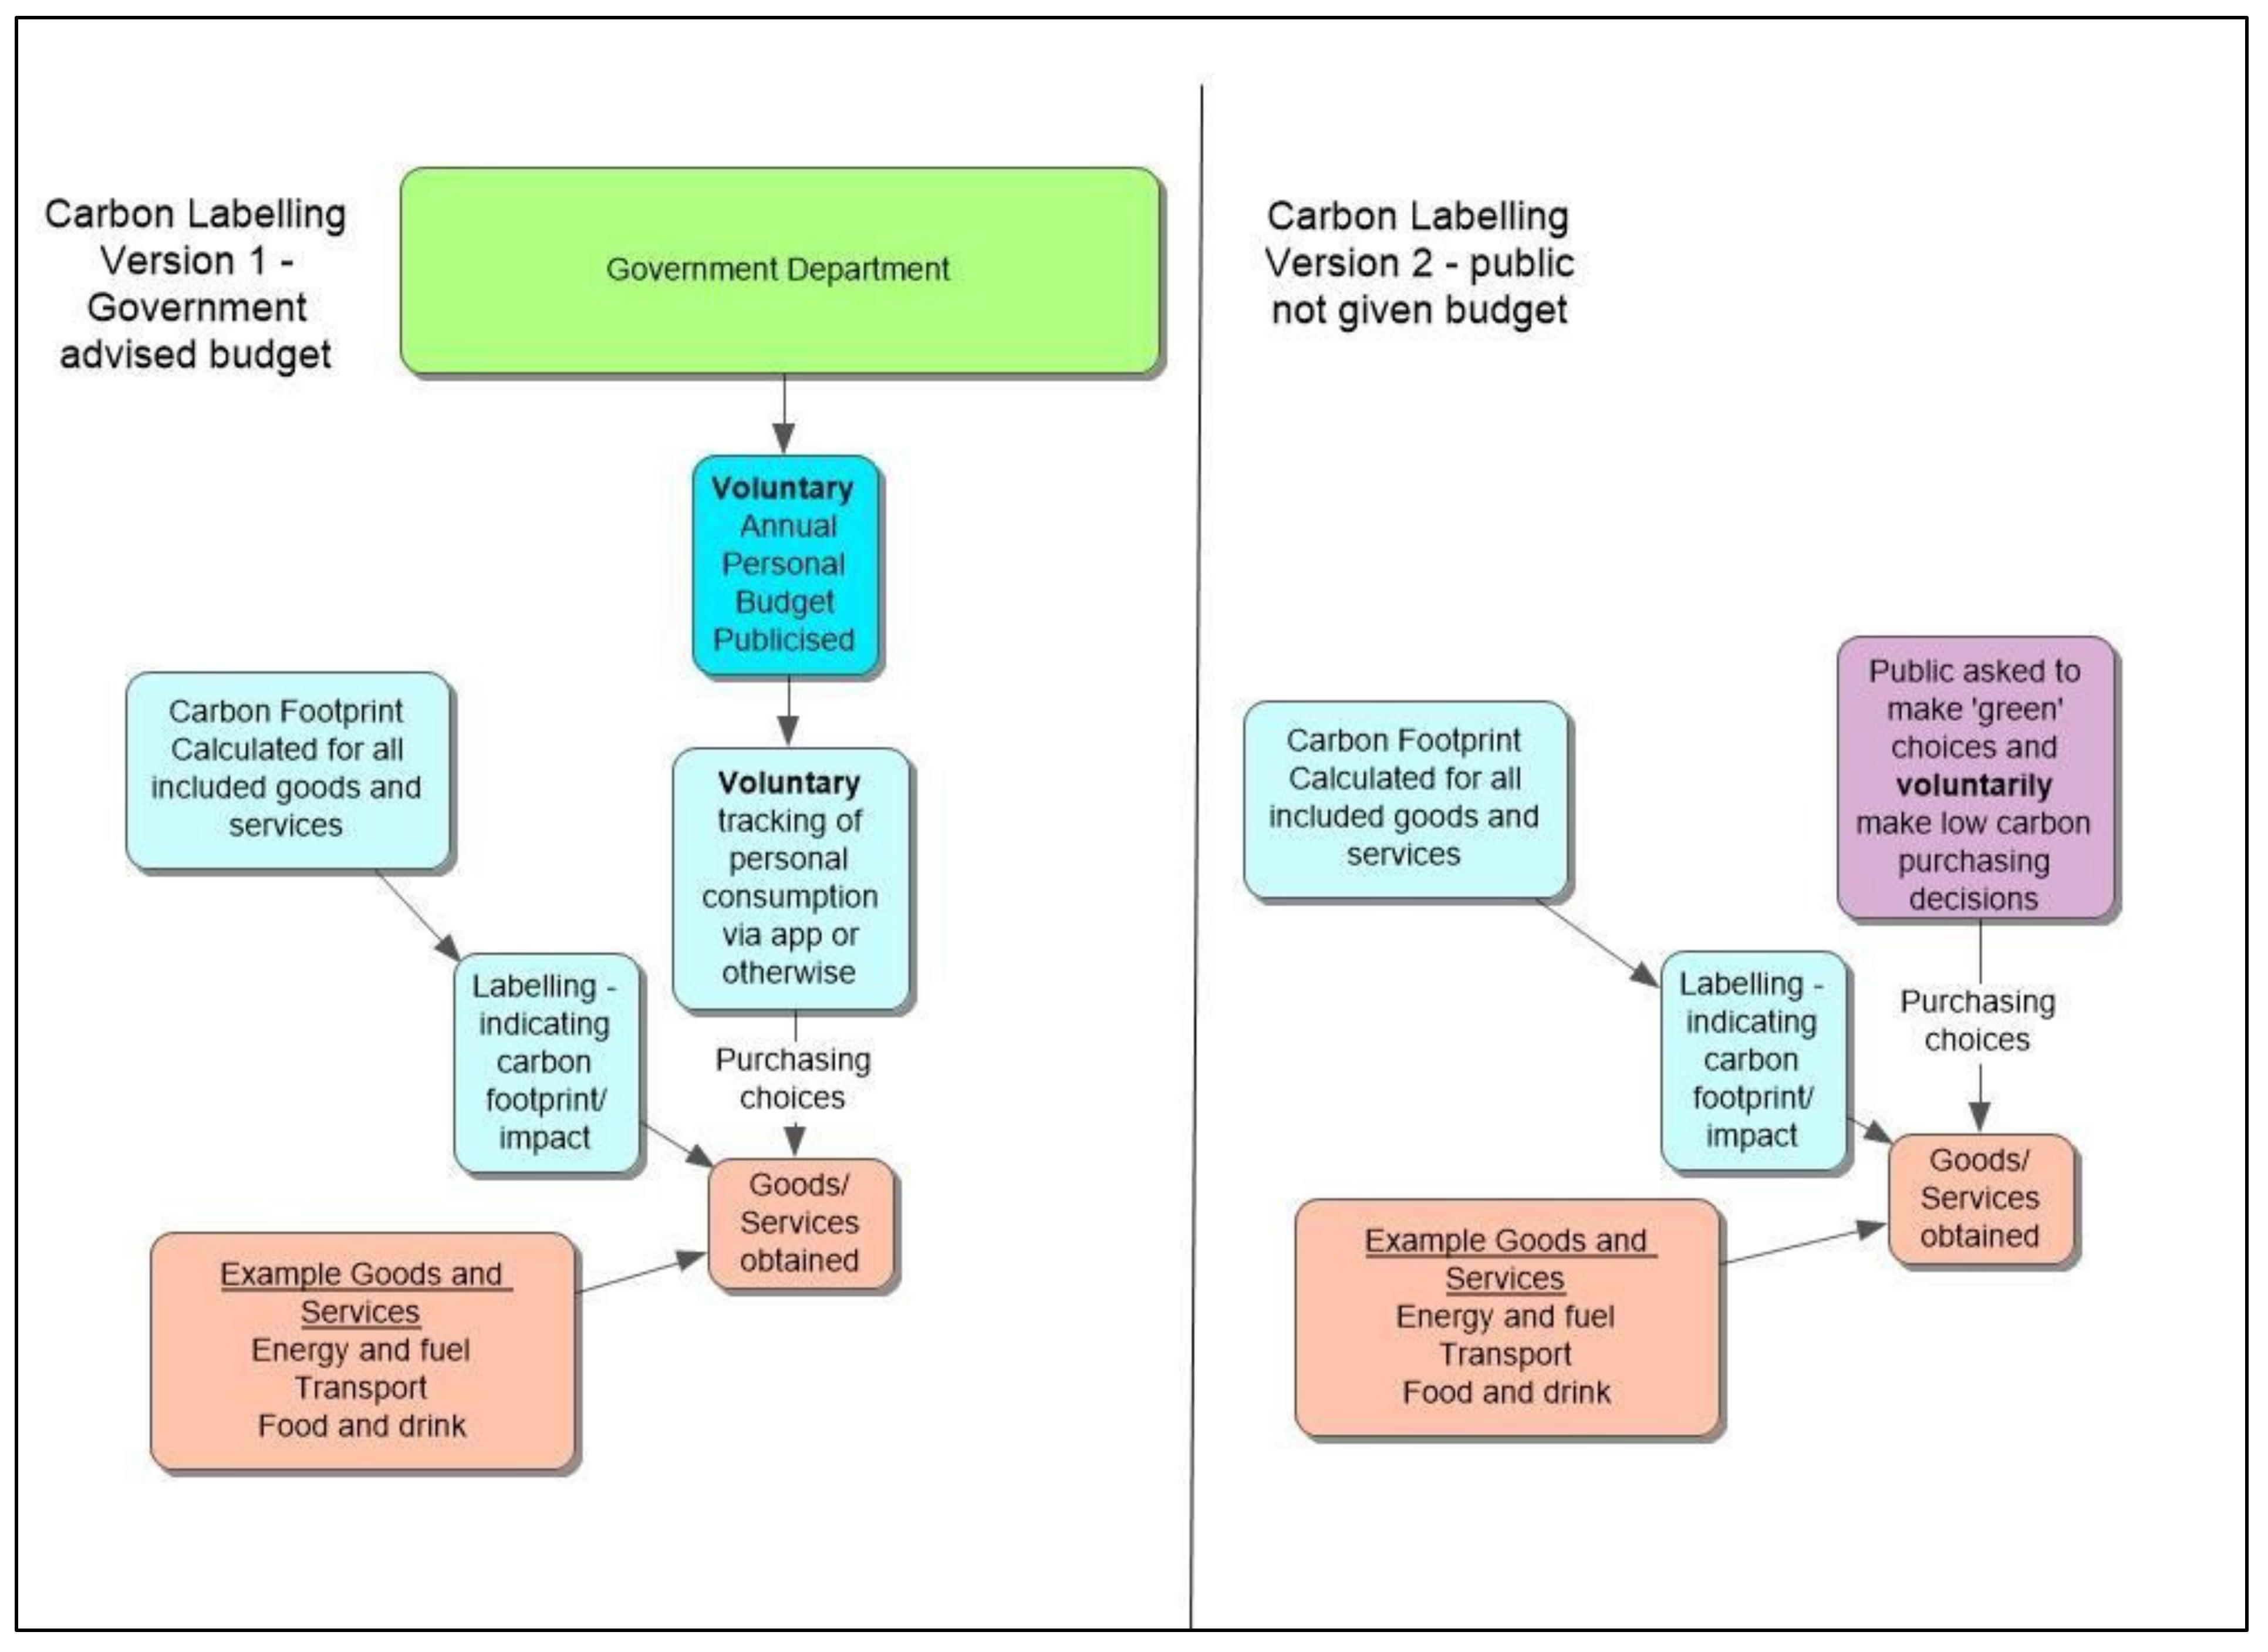
2.3. Carbon Labelling
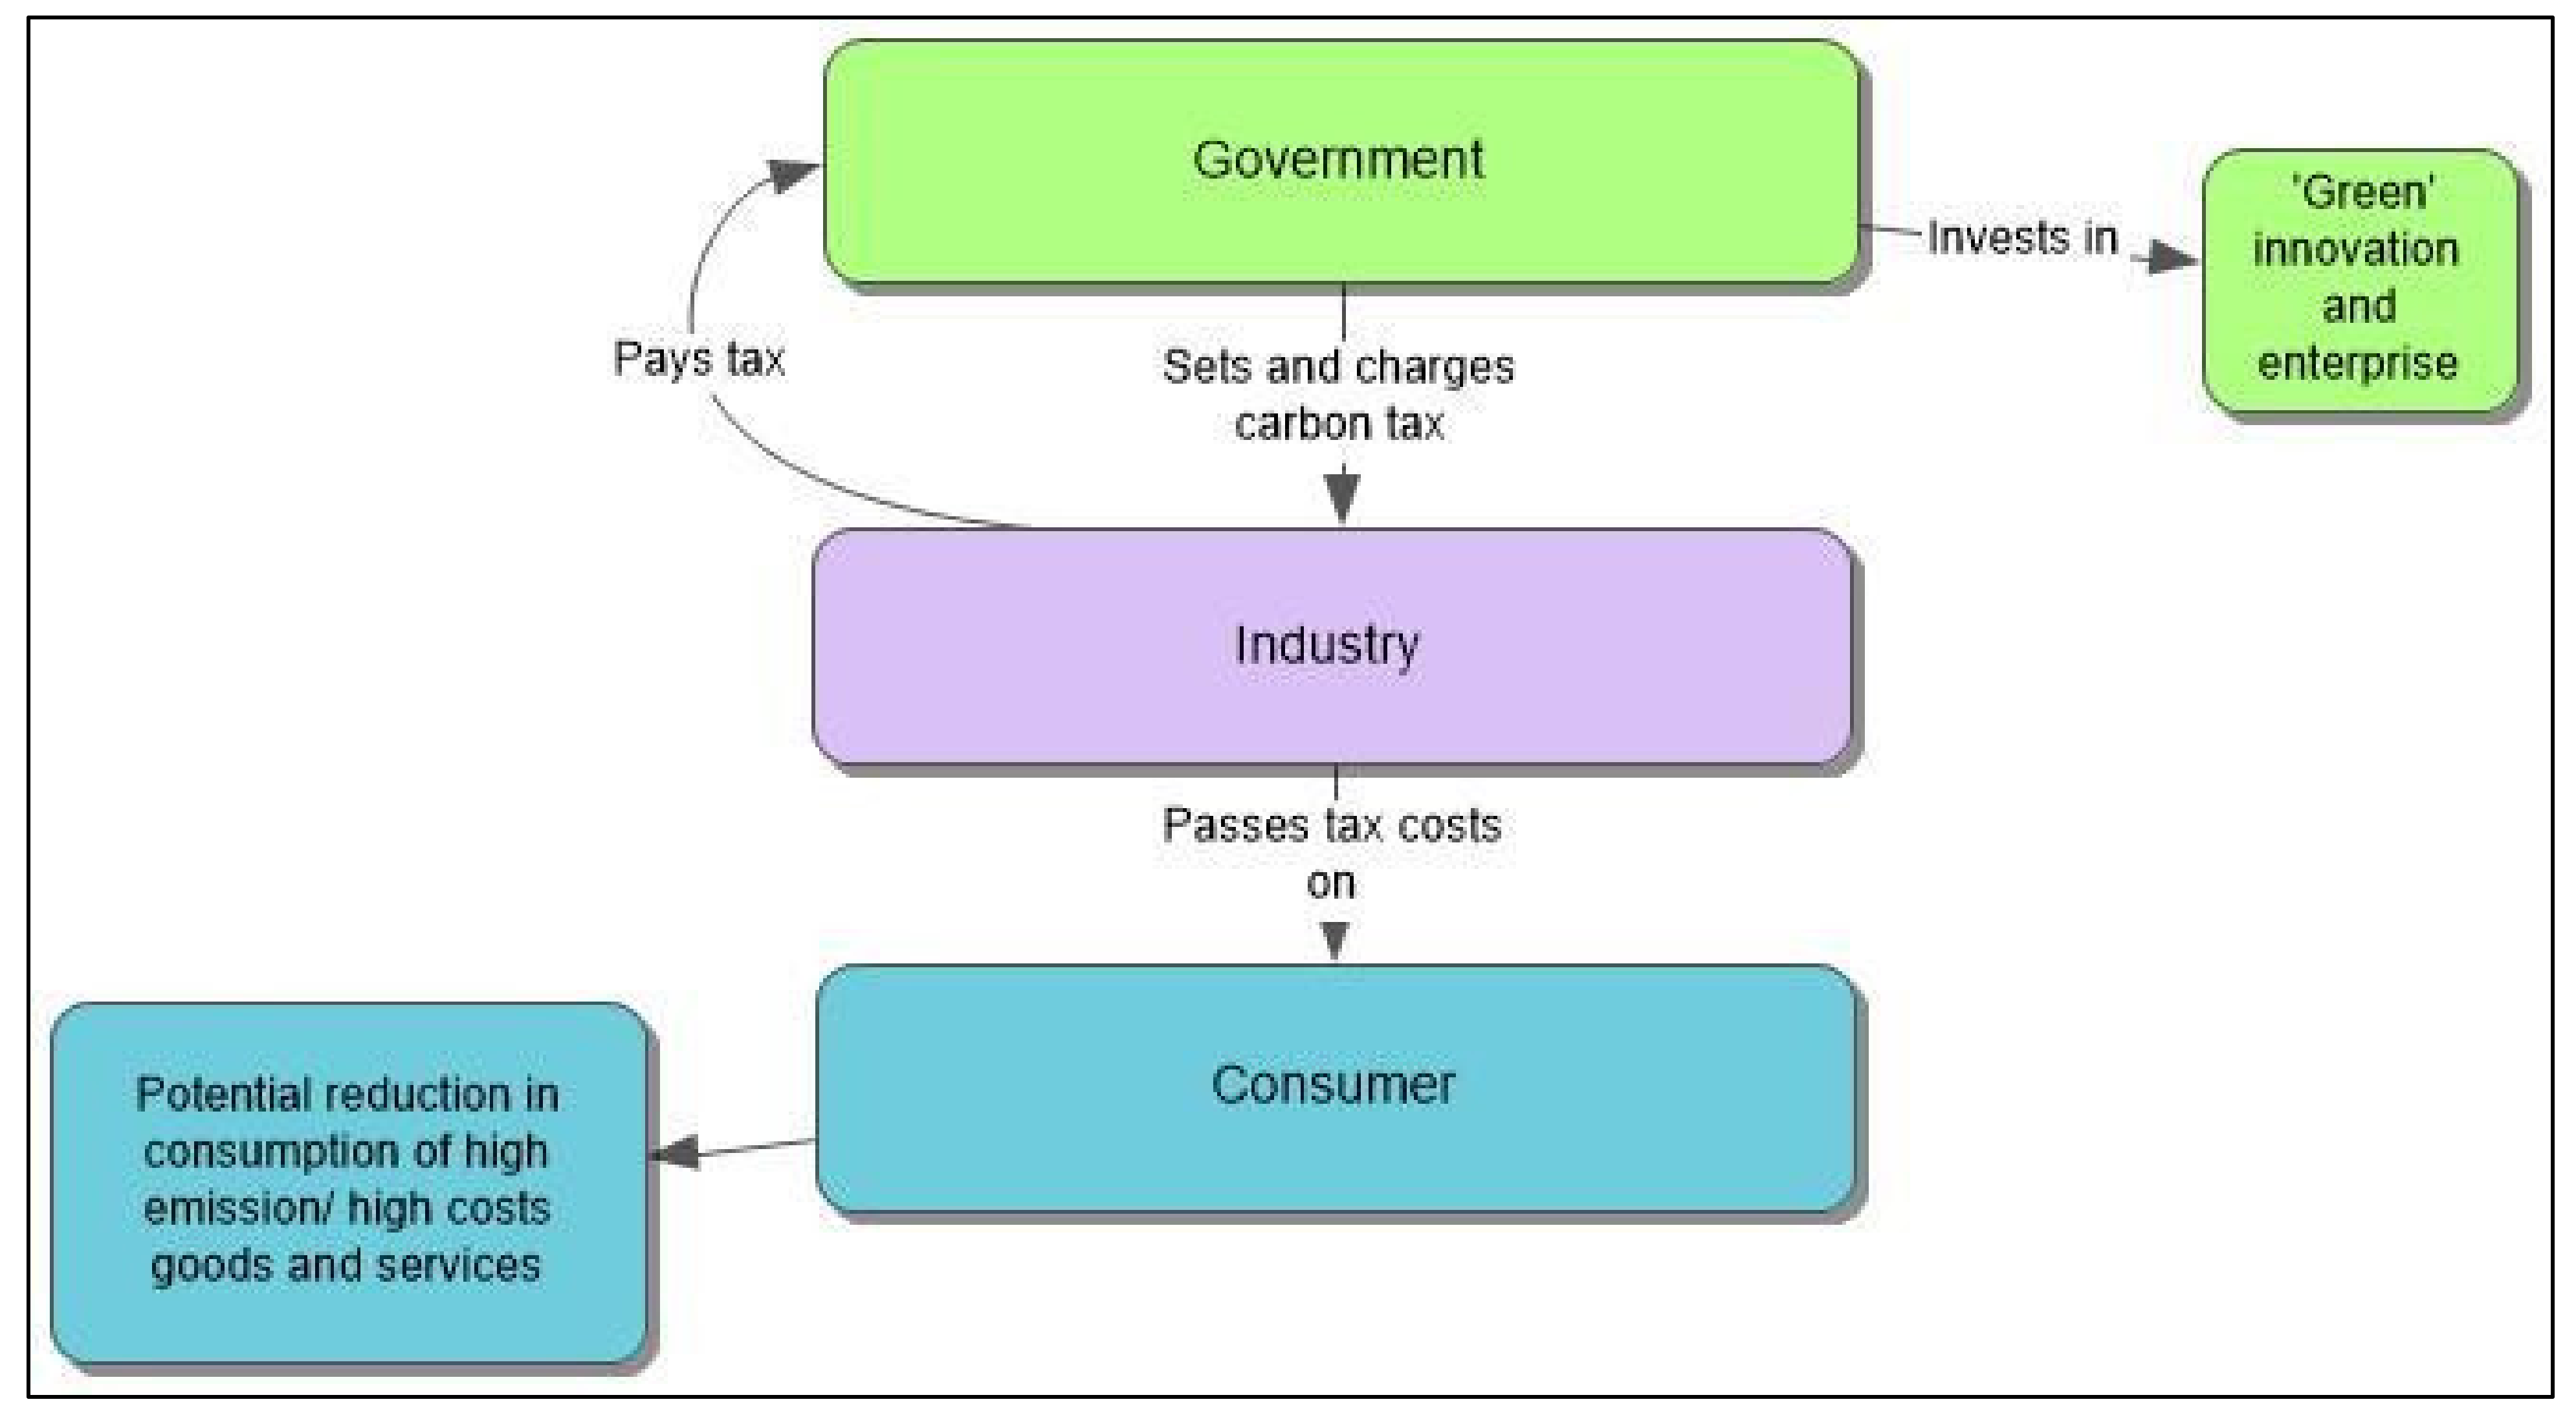
Carbon labelling (CL), unlike the other models, is a voluntary measure (Table 1 highlights the key features of this model). Goods and services would be required to have a label indicating the carbon emissions generated in relation to that good or service, and the public would be asked to work to a voluntary carbon budget set by the government using these labels to inform their consumption, or simply asked to make ‘green’ choices based on labelling (see Figure 3) [22,23]. There would be no public enforcement to follow the CL policy and no cap on emissions. A carbon labelling method would rely on nudge theory principles; the implication of the labelling and the voluntary budget would be that everyone needs to comply but would not be forced to do so, and would face no penalty if they did not. This type of model would rely on the principle that the public’s behaviour could be shaped and drastically changed by the provision of information and education on the embodied carbon from their consumption. Figure 3 demonstrates how two different CL models may be implemented: one model includes a government-set cap, one simply has the public encouraged to make ‘green’ consumption choices based on labelling.
Businesses would be required to provide carbon footprints and labels for their products, and hence standardisation across the footprinting method used (as with all PCT/PCA) would be necessary to ensure consistency, reliability and accuracy.
Carbon labelling, unlike PCT and PCA, has been implemented by various brands and companies on occasion, usually in the form of kg CO2e per product. In 2007, Pepsi Co announced that Walkers Crisp packets would bear a Carbon Trust-certified carbon label identifying the carbon cost of the product, and there was also a commitment to lower the carbon impact of the product over two years [33,34]. However, a visit to the supermarket now will show that Walkers crisps currently no longer bear a carbon label. Supermarket Tesco stated an intention to label all their products with a Carbon Trust label; however, this was discontinued due to the cost and time required, with estimates it would take the supermarket centuries to carbon label all their own-brand products at the pace they were going [35,36]. Recently, other brands have made efforts to carbon label some of their products. Both Oatly and Quorn display carbon labels on popular items, but this is not a widespread practice and still most commonly occurs on food products [37,38]. Pilot schemes and the practical testing of carbon labelling has taken place, but the nature of the labels varies; some use a ‘traffic light’ system that has amber as the ‘average’ carbon emissions for a product, black ‘worse’ and green ‘better’ [24]. This is different from current approaches by companies such as Oatly which put the kg CO2e value on products. This relies on the public having an understanding of what their allowance should be, and would be suitable if people had a budget (see Figure 3). A traffic light system could be applicable for versions of labelling with no budget.

2.4. Carbon Tax

A carbon tax is an often-suggested carbon pricing policy that aims to discourage the public from generating carbon emissions by taxing goods and services that generate high emissions (see Table 1). Several countries already have carbon taxation policies (e.g., Canada, Denmark and Germany). A carbon tax is applied per unit on fossil fuels and similar fuels; the tax is levied in relation to the carbon content of the fuel [39,40]. The tax is applied upstream directly to the producer of the raw product, and this raises prices of any goods or services that used a carbon intensive fuel in their provision [10,39]. Figure 4 provides a simplified example of how a carbon tax works.
A carbon tax does not include a cap on emissions and would not require individual goods and services to have their carbon footprints calculated. The reduction in carbon emissions would not be controlled, and therefore, reductions in carbon emissions are expected to come from the public changing their behaviours when faced with increased costs for goods and services [41,42]. Many countries do not have a direct carbon tax on all fuels or one that is applied across all carbon-emitting energy sources, but do have fuel or energy taxes to discourage carbon emission generation. For example, India has a tax on coal both imported and nationally produced but not a carbon tax on other fuel sources [43].
A carbon tax would be reasonably simple to implement and would not require a new governing body or regulator to be created; depending on existing policies, it could be relatively easy to fit alongside existing climate change policies in most governments [25,40]. There are a range of ways revenue raised by a carbon tax could be invested. It has been suggested that funds from carbon taxation would be reinvested into green innovation and enterprise, with the revenue itself being used to combat climate change [44,45]. This may not necessarily always occur; governments may use the revenue as part of the general budget, or create a revenue neutral model, as they have in Canada, where the revenue raised is returned to the public as a rebate [46].

3. Pestle Analysis

The results of the PESTLE analysis indicate all models have complex benefits and costs (see Supplementary Materials Part S2). For example, a carbon tax may have considerable benefits from a political perspective, but its positive environmental benefits are questionable. Whilst each category of the PESTLE analysis has importance when reviewing PCBs, considerable significance must be given to the environmental factor, as PCBs exist to reduce emissions. Following the environmental category, considerable weight must be given to the social factor, as PCBs impact individuals and could impact all facets of a person’s life, particularly depending on their circumstances, means and needs. Researchers often currently look towards the public acceptability of PCB models, but this study gives greater weight to the environmental impacts and social justice impacts [14,22,44].

3.1. Political

Due to the commitments by most global governmental bodies to the Paris Agreement, and many countries having targets, such as the UK’s goal of Net Zero Emissions by 2050, it can be assumed that governments will have to undertake strong emission curbing policies at all levels. Therefore, selecting an appropriate policy to reduce emissions will become steadily more important to governments.
From a governance perspective, the PCT and PCA require the most investment, both financially and by the nature of needing additional governing and monitoring bodies to be created [28]. Both CT and CL place more of the burden on industry, and CT would raise revenue for the government and fit in with existing policies [46]. PCT and PCA would arguably be less politically popular due to their larger impact on the public and the lifestyle restrictions that hard limits on emissions would bring [5,10]. A carbon tax may be an unpopular policy as it could raise the costs of numerous goods and services [44]. Carbon labelling, as it is voluntary, would not cost the public anything financially and would not enforce lifestyle changes, so this may be comparably more politically popular [22,23,24]. CT may be politically unpopular; countries that have implemented any form of carbon pricing have experienced pushback from the public and political opponents. Canada’s federal carbon taxation policy was challenged in the Supreme Court, and Australia repealed their unpopular carbon tax after two years despite the fact there was a significant drop in emissions in that time period [46,47,48,49,50]. This indicates that effectiveness does not currently hold greater weight with governments than popularity at this time. Between a carbon tax and a carbon budget model such as PCT, it has been found that the public state little preference between the two, which means each could be as popular with the public as the other, depending on their features [14].
Carbon labelling shares features with PCT and PCA, as a budget for an individual is set, and goods and services are ‘bought’ with this budget. However, for CL, this has no mandatory enforcement, instead using the currently politically popular ‘nudge theory’ [51,52,53]. Nudge theory employs behaviour-shaping to change public behaviours, using tactics such as social pressure and advertising campaigns to influence individuals [51]. Nudge initiatives have had some modest successes; however, it is questionable how successful a policy lacking any enforcement can be at large-scale behaviour changes. For example, it has been suggested that during the COVID-19 pandemic, the UK government attempted to employ nudge theory, particularly at the outset of the pandemic, where advice was given to the public, i.e., ‘Hands, Face, Space’, rather than legal requirements and restrictions [54,55]. As restrictions had to then be introduced and the UK suffered considerably in the pandemic, this has led to criticism of nudge theory as an effective method to change behaviour in the face of a global crisis [53,54,55,56,57], especially one that requires the public to edit their behaviours for the benefit of others as it does not force change. Whilst CL is attractive politically as it requires little in the way of enforcement and would fit with existing nudge methods, there is little proof it could achieve its goals to reduce emissions.
The ramifications related to international trade are hard to define: if all countries moved to a PCT or PCA model, then they would all be working with comparable standards in terms of the emissions generated by goods and services. However, if one nation had a hard cap on emissions and was engaging in trade with one without a cap, this may be complex, since the nation without a cap may be doing less to reduce emissions, and demand for their produce may lower or be unsuitable for consumption by those under a cap. Any mandatory policy that reduces emissions will reduce consumption, and less consumption will likely overall mean less trade. A labelling scheme is voluntary, so if the public kept to the limits, it may impact trade, but likely not to the degree mandatory policies would.
For the political factor, the CT and CL models are likely the most acceptable. A CT policy would raise revenue, and a CL policy has little burden on the governing body compared to PCT and PCA models.

3.2. Economic

PCT and PCA models would arguably be the most financially costly models to implement, and they would require both government and industry spending [28]. Governments would be required to fund new governing and monitoring bodies and infrastructure; industries would be required to have carbon footprints calculated for all included goods and services, which would require considerable labour hours [26,28]. A carbon tax would increase costs for industry but raise government revenue, and a carbon labelling approach would incur costs in industry (for data collection and footprint calculation) [58]. Each model has a financial burden, but a carbon tax is the only model where the public bears the brunt [26,28,58].
Jobs generated by any model are difficult to predict; however, a carbon tax is unlikely to create jobs directly. PCT, PCA and CL all require carbon footprints developed for goods and services, and the anticipated substantial requirement for this service may generate jobs in this sector as footprints would need to frequently be recalculated [28]. PCT and PCA would require the development of new governing and monitoring bodies and systems that would create additional government jobs [26,28].
A carbon tax is regarded as a regressive tax since those with lower incomes pay proportionally more of their income than those with higher incomes [12,58]. There are social inequality concerns around carbon taxing, as those with lower incomes would be paying a higher percentage of their earnings on the carbon tax than those with higher incomes for needs such as household heating [11,58]. Those with lower incomes and less disposable income would likely have greater changes to their lifestyle and access to goods and services than those with higher incomes, who could just pay any additional taxes without a considerable detriment to their lifestyle. PCT and PCA models have been evaluated to be progressive (those with higher incomes ‘pay’ proportionally more than those with lower incomes); in the case of PCT and PCA, this means that those with higher incomes would have a considerably higher proportional emissions reduction than those with lower incomes [11,59].
Canada passed carbon pricing federal legislation in 2018 that came into effect in 2019. Carbon emissions are taxed per tonne under this legislation, with the cost per tonne rising from 2019 to 2022, where the price started at $20 and rose to $50 in $10 increments [46]. The model is revenue-neutral, with 90% of raised tax funds being returned to the public as a rebate in the province the taxes were raised [46]. This is instead of the funds being invested in green innovation and enterprise; as suggested in Figure 4, the only benefit of this policy is the assumption that behaviours will be changed by increased taxes and incentivised by the rebates. The use of rebates would have some impact on counteracting the regressive nature of the tax; however, the lack of investment in further green innovation limits its overall environmental impact [58].
Any model that limits consumption would likely have a knock-on effect on growth and potentially GDP; if the public have limited spending power, then growth will slow or drop [60]. ‘Green’ industries and technologies, such as electric vehicles, home insulation and photovoltaic panel businesses, may see increases in revenue, but there may be a period where traditional measures of economic health, such as growth and GDP, seem to be negatively impacted [61]. However, the preservation of life-giving systems and natural capital has a value beyond money, and it is impossible to overstate their importance, as the stalling a PCB may cause to growth is largely irrelevant compared to the cost of not acting on emissions and destroying the atmosphere and systems we need to live [60,61].
As all models aim to reduce carbon emissions, it is unlikely any model would have a negative impact on natural capital, although both the CL and CT models do not have strong protections in place for natural capital as they do not possess any hard limits. Natural capital may still be depleted and not renewed under these models.
All four models have varying economic benefits and costs. As a carbon tax is regressive, this makes it a less attractive policy, as it could significantly impact the wellbeing of the public. As discussed further in Section 3.5. the importance of carbon emissions reduction for the preservation of life-giving systems is far greater than its impact on traditional economic health measures.

3.3. Social

Following the PESTLE analysis, the PCT and PCA models are broadly similar. The trading model would have a greater negative impact socially due to distributional impacts, as the model still allows personal finances to impact how much an individual can consume, not unlike the carbon tax. The CL model is unlikely to have a drastic overall social impact as it is voluntary and does not involve penalties or costs either financial or of other types. A CT policy would have negative distributional effects due to its nature as a regressive tax that would disproportionally impact those with lower incomes [11,12,58]. Whilst money generated from a CT scheme could be reinvested, this would have to be included in law with funds ringfenced and may not directly benefit those who bear the burden of the tax [58].
An important question to consider is if carbon allowances in PCT and PCA are allocated per capita, then how do those that have high consumption requirements through no fault of their own manage on a budget designed without nuance? Per capita allowances would simply divide the carbon emissions allocated to the public by the number of members of the public. However, this would mean those with additional requirements such as disability and/or mobility issues, and thus particular transport requirements, for example, that they may be forced to go without [31,62]. Careful design is required within a set carbon budgeting model to ensure allocation is fair; whilst a per capita allocation seems the most equitable, it is an inflexible allocation method that cannot account for differences in life circumstances.
CL would have little impact socially as it is not enforceable and there would be no trading, and if the government publicised an ‘ideal’ footprint for people to follow this could be modified depending on individuals’ needs. A carbon tax is a regressive tax so it would have a far greater financial impact on those with lower incomes and thus have considerable social impacts (see Section 2.2.) [58]. Those with higher incomes would be able to absorb the additional tax whereas those on lower incomes would not, as they spend proportionally more of their income on high-carbon goods such as energy to heat their home and personal transport [31,58].
In a PCB model that allows trading, there is significant potential for exploitation by those who have the finances to buy further carbon credits to supplement their own allowance and potentially rely on the poverty of those with low incomes being forced to sell carbon credits. Carbon trading is fundamentally unequal, whether in personal or international markets. The reason for this is simple: those with more money will always be able to purchase more carbon, those with less money will often feel the need to sell their carbon for more money in the immediate sense. If an individual who takes frequent holidays overseas can just pay for more carbon, and someone who feels pressured to sell their credits for money due to food poverty then must go with even less, this would be socially unequal. Even if trading did not officially have a financial cost and only existed in theory to allow individuals to distribute any unrequired credits, this could easily be exploited ‘off the books’. For example, if trading had no financial cost but credits could be donated, richer individuals could pay others for their carbon. A PCB scheme has the potential to drastically impact people’s lives, but to do so in a socially sustainable way there must be equity, everyone must have access to a fair carbon allocation that is appropriate for their needs, with no one having the ability to pay more to consume more at the expense of others. This is not an issue that is much discussed in the existing literature, but the results of our PESTLE analysis highlight the concerns about allowing credits to be exchanged for money instead of in an equitable distribution.
In the city of Lahti (Finland), a PCT scheme is being piloted. The CitiCAP app is funded by the EU’s Urban Innovative Actions programme. This app seeks to reduce volunteers’ carbon emissions from travel [8,63]. This model, instead of punishing going over budget, incentivizes participants to go under budget, with rewards each week. As it is a voluntary pilot study, there is no enforcement or hard cap. The price of carbon was increased over the course of the pilot and expressed as €/kg CO2 rather than discrete tradable permits, and carbon was not traded between users, but as mentioned, allowances could be traded in for rewards. In the reported results of the project, 21% of participants admitted to ‘cheating’ the system in various ways to earn more reward euros to trade for rewards [64]. This demonstrates that even in a voluntary and free system, individuals will seek to gain from it.
Only PCA and CL would not have negative impacts on those who have some form of social disadvantage, such as a low income or disability, provided a fair allocation method was in place. CL would only not have a negative impact due to its voluntary nature and lack of enforcement. PCA eliminates the potential for abuse in carbon trading and the advantages wealth would bring. If properly managed, PCA could ensure the distribution of carbon allowances was equitable and all under the policy were allocated according to their needs. This makes the PCA model the only currently available socially acceptable model.

3.4. Technologigal

The technological implications of the four models vary. For the PCT and PCA models, there have been various proposals to integrate carbon allowance spending with existing credit/contactless card systems and through online banking or apps [26,28,65]. PCT, PCA and CL would all require some form of technological or software system to track and monitor carbon spending.
A carbon tax would generate revenue that theoretically could then be invested in green technology or innovation; however, in those countries where carbon taxation policies have been implemented, this additional revenue has often been absorbed into the general governmental budget [39]. If a CT policy could be carefully managed and revenue ring-fenced to be invested into green technologies, this could have significant benefits for green technology development.
All models would potentially make fuel-inefficient and high-carbon-costing technology undesirable due to either the additional tax or cost to the customer in terms of their carbon allowance. This may encourage the development of efficient technology as the public seeks to lower their emissions to maximise use of their budget. There is a possibility with a strict PCA or PCT policy that public spending on complex technology would drastically lower if carbon budgets meant they took a considerable proportion of their allowance to buy. Some technological sectors may be hampered by this.

3.5. Legal

The key legal factor comparison to be made is the importance of a mandatory policy versus a voluntary policy. CL is a voluntary model, and there would be no legal implications for the public if they did not abide by the policy. There could be legal implications if businesses did not provide carbon information for their products that may require enforcement, but this would not affect the public’s behaviours. Mandatory policies would require enforcement, and the type of enforcement would be important to the efficiency of the policy and the social justice aspect. If a violation of a PCT method was a £500 flat fine, someone on a higher income would be able to simply pay the fine and carry on as they have, and someone on a lower income would not be able to. The enforcement would need to be equitable and have the same impact regardless of personal privilege.
A discussion can be had on the concept of carbon credits themselves in terms of PCT and PCA schemes; within the literature, the amount of carbon an individual is allocated is often not given as a weight but as several credits. This implies the allowance in the form of these credits is a currency the individual owns, rather than a limit they cannot overstep. If credits are owned by an individual, this implies they have some rights over whether they can be traded or not – it is theirs to use as they see fit. However, if the allowance is expressed as a weight, this implication is lessened. [66].

3.6. Environmental

PCB models are designed with the intention of reducing GHG emissions, and so the environmental component of the PESTLE analysis is vital. Two models are mandatory and have a fixed cap on emissions (PCT and PCA), and whilst the allocation of emissions within the cap may vary, the cap itself is unchangeable. The reduction these models could bring about is simple to understand, as if an ambitious enough cap was implemented, the required GHG reductions could be achieved. However, the CL and CT models have no cap and no overall control over GHG emissions, although CT is mandatory, so it would certainly have some impact. The CL model may have a theoretical cap to aim for using labelling and diligence from the public, but without this being mandatory, it is unlikely it would be reached. The reductions a CT model could bring about are similarly nebulous; taxes and charges have changed behaviours at small scales, such as congestion charges and plastic bag charges, but GHG emissions are at a far larger scale and are far more central to people’s overall consumption [67,68]. A carbon tax is regressive, so it may force lower income households to change their behaviour due to cost. However, higher income houses can emit three times as many emissions as those of a lower income, and these households would be less impacted by the tax and less likely to change consumption [69,70,71].
Whilst PCT has a cap, there are still environmental concerns with this model; if trading is allowed, then there will never be a surplus, the cap would always be met, and extra credits would always be bought up. It would be environmentally beneficial to not always hit the emissions cap as this would mean even greater emissions reductions. If carbon trading is disallowed, then those who are thrifty with their allowance may have a surplus, which could then roll over for a certain number of years before being surrendered back to the government, or being surrendered at the end of the year, potentially for some kind of benefit. Even if everyone only had a small surplus, this could create significant emissions savings.
Three models—PCT, PCA and CL—all would require carbon footprinting (or some other form of carbon accounting) to calculate the carbon emissions associated with the included goods and services. A method and definition of a carbon footprint would need to be adopted and standardised, with all goods and services being footprinted to the same standard. The nature of this footprint, the scope of what emissions are included and the cut-offs within processes would require standardisation.
What is included in the carbon budget is critically important for a PCT, PCA or CL method. If, for example, only hairstyling and bed linen were included, most emissions would not be accounted for and emissions would largely not be impacted. A PCT, PCA or CL model is only as effective as its scope. For example, the PCT model proposed by DEFRA included the carbon content of energy for use in the home and personal transport purchases, and aviation was covered through fuel purchases by airline [72]. This model does not include food, textiles and other goods created by agricultural processes that are responsible for around 18% of global emissions [73]. By excluding all goods and services from this sector, a considerable quantity of carbon emissions is unregulated by the policy and can continue to contribute to global climate change.
Carbon labelling would require a considerable amount of education surrounding carbon costs, alongside clear and informative labelling to ensure the public made informed choices [23]. Without any kind of enforcement, they would have no legal reason to spend time understanding any carbon labelling system. Carbon labelling was trialed in Vanclay et al., (2011), where coloured labels were attached to products indicating if a product was ‘below average emissions’ (green), ‘around average’ (yellow) or ‘above average emissions’ (black) in a grocery store over three months. Sales of black-labelled products reduced by 6%, and sales of green-labelled products increased by 4%, so only small changes in sales over the time period. There was an increase in green-labelled products when they were comparatively lower priced than products with other coloured labels, with a 20% switch from black-labelled products to green-labelled [24]. However, as this study used the average emissions that could still be a high value, it may not be the most appropriate scheme as it does not provide the public with detailed information surrounding carbon emissions. Choosing a green-labelled product does not mean the item has low carbon emissions—just lower according to this type of carbon labelling model.
The DEFRA synthesis report created in 2008 states: ‘…the key benefit of personal carbon trading is the increase in the visibility of personal carbon emissions that it creates.’ [72].
This statement is the key justification of the report for the implementation of a PCT method rather than other policies such as carbon taxation or upstream trading. The public developing a clear understanding of their carbon emissions, and responsibility for them, is put forward repeatedly as a vital component of PCT and a consideration outside of straightforward feasibility. The assertion is also put forward in other literature that TEQ/PCT models allow participants to understand their role in emissions, how they can limit them and their personal responsibilities [74,75]. These reports acknowledge other policies may be easier to implement but would have less benefits in terms of public education around carbon emissions and public responsibility [74,75].
PCA may be the most environmentally acceptable model; although PCT would likely have a similar impact, the difference may be the potential impact trading would have on ‘using up’ the cap limit. As carbon taxes and carbon labelling have no way to enforce a limit on emissions, they are unlikely to enable the deep cuts to carbon emissions required to limit global temperature rises [1,3]. Whilst the literature shows that CT can cause cuts to emissions, the lack of a cap does not allow this to be enacted with a strong scientific underpinning as a reduction policy [39,46,47,48,49,50].
The most effective environmental feature is a hard cap on carbon emissions; with a controlled cap, emissions can be reduced as stringently as they need to be, and there are no grey areas. CL and CT models have no enforcement to limit overall emissions and therefore could not be relied upon to make cuts deep enough to halt climate change, and therefore cannot be the sole policies to reduce carbon emissions. Both the PCT and PCA models provide hard caps on emissions, and as both function in similar ways, they would mostly have the same ability to cut emissions [27]. However, as trading would likely mean all surplus carbon credits would always be purchased and spent, PCT may be less environmentally effective than PCA. To limit the catastrophic impacts of climate change, every advantage must be taken, and the lowest amount of carbon emitted. This is currently not a factor discussed in the literature; the overall assumption is that the cap will be met, and instead of using a cap on emissions as an absolute limit, it is assumed the entire cap amount will always be used [5,6,7,8,10,11,12,13,14,15,16,17,18,19,20,21,22].
Whilst PCT is a popular policy model, it would create considerable disparity between those who can afford to purchase more carbon credits via trading and those who either could not purchase more or had financial pressures that led them to sell credits. A PCT scheme cannot be socially equitable and, on these grounds, is unsuitable as a method to limit personal carbon emissions. PCA eliminates the trading element, all the public is treated equally in terms of income and no one has an advantage due to their personal wealth. Each individual can be allocated a carbon budget in relation to their needs rather than their wealth. A PCA scheme with no trading is an opportunity to reduce inequalities those with lower incomes suffer from, with all individuals treated as equals, with their specific needs respected and accounted for.
Carbon taxation suffers from the same concerns as PCT, as those with greater financial means would simply pay more to continue their lifestyles, and as there is no cap on emissions, there is no certainty CT would create the carbon reductions needed [12,39,58]. Carbon labelling is voluntary, and whilst this may be attractive politically, require less financial investment form the government and not disadvantage individuals socially, like CT without enforcement, it is very likely people would carry on as usual. Political or economic attractiveness will make both CL and CT tempting to governments; however, governments should not take the ‘easier’ path and instead must focus on the environmental effectiveness and social equality of policy models.
Considering the social and environmental factors as having the highest weight in terms of importance, the PCA model would be the recommended model to reduce emissions without disadvantaging those with lower incomes. Whilst this model may be less popular politically than a voluntary model such as carbon labelling, it would have greater effectiveness at implementing the reductions almost all governments have pledged to make. Severe cuts in carbon emissions must be made to have any hope of limiting the global temperature rise to 1.5 °C; to do so, radical mandatory measures must be taken.

4. Conclusions

We identified three main archetypes of PCBs—Personal Carbon Trading, Carbon Tax and Carbon Labelling—and proposed a new policy model, Personal Carbon Allowance (no trading). Each policy model has an array of costs and benefits across the PESTLE factors. Some impacts are difficult to quantify as two of the PCB models are currently largely theoretical, and their impacts when applied at a national or global scale can only be assumed. Because PCBs are an environmental policy measure, the greatest weight must be given to this factor, but as PCBs would directly impact individuals’ lives in every area, consideration of social factors must be almost as important. Individuals must not be disadvantaged due to carbon budgets, and those with higher incomes should not be able to benefit from a trading-based system where they can exploit their greater wealth to the detriment of those that must sell their carbon to survive. As this policy seeks to reduce carbon emissions. it must be an effective measure, regardless of popularity with the public or the discomfort it may cause those currently living lavish lifestyles.
Whilst PCT is a popular policy model within this area of literature, it could create considerable disparity between those who can afford to purchase more carbon credits via trading and those who either could not purchase more or had financial pressures that led them to sell credits. Individuals then may find that having sold credits for immediate financial relief, they no longer have enough carbon credits to then spend that income on goods and services they need later in the budget period. A PCT scheme cannot be socially equitable and, on these grounds, is unsuitable as a method to limit personal carbon emissions. PCA eliminates the trading element, all the public are treated equally in terms of income and no one has an advantage due to their personal wealth. Everyone can be allocated a carbon budget in relation to their needs rather than their wealth. A PCA scheme with no trading is an opportunity to reduce inequalities those with lower incomes suffer from, with all individuals treated as equals, with their specific needs respected and accounted for.
Carbon taxation suffers from the same concerns as PCT, as those with greater financial means would simply pay more to continue their lifestyles, and as there is no cap on emissions, there is no certainty CT would create the carbon reduction needed. Carbon labelling is voluntary, and whilst this may be attractive politically, require less financial investment form the government and not disadvantage individuals socially, like CT without enforcement, it is very likely people would carry on as usual. Political attractiveness will make both CL and CT tempting to governments; however, governments should not take the ‘easier’ path and instead must focus on balancing the environmental effectiveness and social equality of policy models.
Considering the social and environmental factors as having the highest weight in terms of importance, the PCA model would be the recommended model to reduce emissions without disadvantaging those with lower incomes and while providing aggressive emissions cuts. Whilst this model may be less popular politically than a voluntary model such as carbon labelling, it would have greater effectiveness at implementing the reductions almost all governments have pledged to make. Severe cuts in carbon emissions must be made to have any hope of limiting the global temperature rise to 1.5 °C; to do so, radical mandatory measures must be taken.

Supplementary Materials

The following are available online at https://www.mdpi.com/article/10.3390/su14159238/s1; Supplementary Materials Part S1: FACTOR QUESTIONS; Supplementary Materials Part S2: Table S1: PESTLE analysis of a PCT model according to criteria defined in Supplementary Materials Part S1; Table S2: PESTLE analysis of PCA model according to criteria defined in Supplementary Materials Part S1; Table S3: PESTLE analysis of carbon labelling model according to criteria defined in Supplementary Materials Part S1; Table S4: PESTLE analysis of carbon tax model according to criteria defined in Supplementary Materials Part S1.

Author Contributions

Conception, research, draft, editing; A.B.; Conception, supervision, editing, I.D.W. and S.K. All authors have read and agreed to the published version of the manuscript.

Funding

This research was funded by the Economic and Social Research Council via a studentship through the South Coast Doctoral Training Partnership, grant number 2342054. The APC was funded by The University of Southampton.

Institutional Review Board Statement

Not applicable.

Informed Consent Statement

Not applicable.

Data Availability Statement

Not applicable.

Conflicts of Interest

The authors declare no conflict of interest.

References

  1. Intergovernmental Panel on Climate Change (IPCC). Special Report: Global Warming of 1.5 °C; Intergovernmental Panel on Climate Change (IPCC): Geneva, Switzerland, 2018. [Google Scholar]
  2. Department for Environment Food & Rural Affairs. Data—Consumption Emissions 1997–2017 [DATASET]. 2020. Available online: https://www.gov.uk/government/statistics/uks-carbon-footprint (accessed on 9 October 2020).
  3. Climate Change Committee. Sixth Carbon Budget; Climate Change Committee: London, UK, 2020. [Google Scholar]
  4. Climate Change Committee. Advice on Reducing the UK’s Emissions—Climate Change Committee. 2021. Available online: https://www.theccc.org.uk/about/our-expertise/advice-on-reducing-the-uks-emissions/ (accessed on 17 June 2021).
  5. Wallace, K.N.; Irvine, K.N.; Wright, A.J.; Fleming, P.D. Public attitudes to personal carbon allowances: Findings from a mixed-method study. Clim. Policy 2010, 10, 385–409. [Google Scholar] [CrossRef]
  6. Fawcett, T.; Parag, Y. An introduction to personal carbon trading. Clim. Policy 2010, 10, 29–38. [Google Scholar] [CrossRef] [Green Version]
  7. Fawcett, T. Personal carbon trading: A policy ahead of its time? Energy Policy 2010, 38, 6868–6876. [Google Scholar] [CrossRef]
  8. Kuokkanen, A.; Sihvonen, M.; Uusitalo, V.; Huttunen, A.; Ronkainen, T.; Kahiluoto, H. A proposal for a novel urban mobility policy: Personal carbon trade experiment in Lahti city. Util. Policy 2020, 62, 100997. [Google Scholar] [CrossRef]
  9. Perera, R. The PESTLE Analysis, 1st ed.; Nerdynaut: Avissawella, Sri Lanka, 2017; ISBN 9781626209985. [Google Scholar]
  10. Parag, Y.; Capstick, S.; Poortinga, W. Policy attribute framing: A comparison between three policy instruments for personal emissions reduction. J. Policy Anal. Manag. 2011, 30, 889–905. [Google Scholar] [CrossRef]
  11. Carbone, J.C.; Morgenstern, R.D.; Williams, R.C.I.; Burtraw, D. Deficit reduction and carbon taxes: Budgetary, Economic, and Distributional Impacts. In Resources For the Future; RFF Centre: Washington, DC, USA, 2013. [Google Scholar]
  12. Elkins, P.; Baker, T. Carbon taxes and carbon emissions trading. J. Econ. Surv. 2002, 15, 325–376. [Google Scholar] [CrossRef]
  13. Haites, E. Carbon taxes and greenhouse gas emissions trading systems: What have we learned? Clim. Policy 2018, 18, 955–966. [Google Scholar] [CrossRef] [Green Version]
  14. Bristow, A.L.; Wardman, M.; Zanni, A.M.; Chintakayala, P.K. Public acceptability of personal carbon trading and carbon tax. Ecol. Econ. 2010, 69, 1824–1837. [Google Scholar] [CrossRef] [Green Version]
  15. Parag, Y.; Eyre, N. Barriers to personal carbon trading in the policy arena. Clim. Policy 2010, 10, 353–368. [Google Scholar] [CrossRef]
  16. Seyfang, G.; Lorenzoni, I.; Nye, M. Personal Carbon Trading: A Critical Examination of Proposals for the UK; Tyndall Centre for Climate Change Research: Norwich, UK, 2009. [Google Scholar]
  17. Roberts, S.; Thumim, J. A Rough Guide to Individual Carbon Trading: The Ideas, the Issues and the Next Steps; Department for Food And Rural Affairs: London, UK, 2006. [Google Scholar]
  18. Fawcett, T. Personal carbon trading: Is now the right time? Carbon Manag. 2012, 3, 283–291. [Google Scholar] [CrossRef]
  19. Howell, R.A. Living with a carbon allowance: The experiences of carbon rationing action groups and implications for policy. Energy Policy 2012, 41, 250–258. [Google Scholar] [CrossRef] [Green Version]
  20. Fawcett, T.; Hvelplund, F.; Meyer, N.I. Making it personal: Per capita carbon allowances. In Generating Electricity in a Carbon-Constrained World; Elsevier Inc.: Amsterdam, The Netherlands, 2010; pp. 87–107. [Google Scholar]
  21. Hyams, K. A just response to climate change: Personal carbon allowances and the normal-functioning approach. J. Soc. Philos. 2009, 40, 237–256. [Google Scholar] [CrossRef]
  22. Upham, P.; Dendler, L.; Bleda, M. Carbon labelling of grocery products: Public perceptions and potential emissions reductions. J. Clean. Prod. 2011, 19, 348–355. [Google Scholar] [CrossRef]
  23. Marek, E.; Raux, C.; Engelmann, D. Personal carbon allowances: Can a budget label do the trick? Transp. Policy 2018, 69, 170–178. [Google Scholar] [CrossRef]
  24. Vanclay, J.K.; Shortiss, J.; Aulsebrook, S.; Gillespie, A.M.; Howell, B.C.; Johanni, R.; Maher, M.J.; Mitchell, K.M.; Stewart, M.D.; Yates, J. Customer response to carbon labelling of groceries. J. Consum. Policy 2011, 34, 153–160. [Google Scholar] [CrossRef]
  25. Narassimhan, E.; Gallagher, K.S.; Koester, S.; Alejo, J.R. Carbon pricing in practice: A review of existing emissions trading systems. Clim. Policy 2018, 18, 967–991. [Google Scholar] [CrossRef] [Green Version]
  26. Seyfang, G.; Lorenzoni, I.; Nye, M. Personal Carbon Trading: Notional Concept or Workable Proposition? Exploring Theoretical, Ideological and Practical Underpinnings; Working Paper; Centre for Social and Economic Research on the Global Environment: Norwich, UK, 2007; pp. 1–31. [Google Scholar]
  27. Wallace, A.A. Reducing Carbon Emissions by Households: The Effects of Footprinting and Personal Allowances; Institute of Energy and Sustainable Development, De Montfort University: Leicester, UK, 2009. [Google Scholar]
  28. Lane, C.; Harris, R.; Roberts, S. An Analysis of the Technical Feasibility and Potential Cost of a Personal Carbon Trading Scheme; Department for Environment, Food and Rural Affairs: London, UK, 2008.
  29. Wintour, P. Miliband Plans Carbon Trading “Credit Cards” for Everyone; The Guardian: London, UK, 2006. [Google Scholar]
  30. Brohé, A. Personal carbon trading in the context of the EU emissions trading scheme. Clim. Policy 2010, 10, 462–476. [Google Scholar] [CrossRef]
  31. Seyfang, G.; Paavola, J. Inequality and sustainable consumption: Bridging the gaps. Local Environ. 2008, 13, 669–684. [Google Scholar] [CrossRef] [Green Version]
  32. Parag, Y.; Strickland, D. Personal carbon trading: A radical policy option for reducing emissions from the domestic sector. Environment 2011, 53, 29–37. [Google Scholar] [CrossRef]
  33. Campaign Live. PepsiCo Explains How It Measured The Carbon Footprint of Walkers Crisps 2009. Available online: https://www.campaignlive.co.uk/article/pepsico-explains-measured-carbon-footprint-walkers-crisps/941668 (accessed on 3 May 2021).
  34. BBC News. What’s the Carbon Footprint of a Potato? 2007. Available online: http://news.bbc.co.uk/1/hi/magazine/7002450.stm (accessed on 3 May 2021).
  35. Smithers, R. Tesco’s Pledge to Carbon-Label All Products Set to Take Centuries; The Guardian: London, UK, 2010. [Google Scholar]
  36. Vaughan, A. Tesco Drops Carbon-Label Pledge; The Guardian: London, UK, 2012. [Google Scholar]
  37. Oatly. Look! Oatly Cartons Come with Carbon Dioxide Equivalents|UK. 2021. Available online: https://www.oatly.com/uk/climate-footprint (accessed on 3 May 2021).
  38. Quorn. Quorn Unveils Carbon Footprint Labelling of Its Products and Calls on Other Brands to Follow Suit as It Launches New Campaign to Help Consumers Battle Climate Change. 2020. Available online: https://www.quorn.co.uk/company/press/quorn-unveils-carbon-footprint-labelling-of-its-products-and-calls-on-other (accessed on 3 May 2021).
  39. Lin, B.; Li, X. The effect of carbon tax on per capita CO2 emissions. Energy Policy 2011, 39, 5137–5146. [Google Scholar] [CrossRef]
  40. Sumner, J.; Bird, L.; Dobos, H. Carbon taxes: A review of experience and policy design considerations. Clim. Policy 2011, 11, 922–943. [Google Scholar] [CrossRef] [Green Version]
  41. Goulder, L.H.; Schein, A.R. Carbon taxes versus cap and trade: A critical review. Clim. Change Econ. 2013, 4, 1350010. [Google Scholar] [CrossRef]
  42. Sorrell, S. An upstream alternative to personal carbon trading. Clim. Policy 2010, 10, 481–486. [Google Scholar] [CrossRef]
  43. Singh, K. India’s Coal Tax Is Key to Stabilizing Its Energy Transition. Center for Strategic and International Studies. 2020. Available online: https://www.csis.org/analysis/indias-coal-tax-key-stabilizing-its-energy-transition (accessed on 7 May 2021).
  44. Carattini, S.; Kallbekken, S.; Orlov, A. How to win public support for a global carbon tax. Nature 2019, 565, 289–291. [Google Scholar] [CrossRef]
  45. Dissanayake, S.; Mahadevan, R.; Asafu-Adjaye, J. Evaluating the efficiency of carbon emissions policies in a large emitting developing country. Energy Policy 2020, 136, 111080. [Google Scholar] [CrossRef]
  46. Nuccitelli, D. Canada Passed a Carbon Tax That Will Give Most Canadians More Money; The Guardian: London, UK, 2018. [Google Scholar]
  47. BBC News. Australia Votes to Repeal Carbon Tax. BBC News. 2014. Available online: https://www.bbc.co.uk/news/world-asia-28339663 (accessed on 7 May 2021).
  48. Milman, O. Australia Records Biggest Emissions Drop in a Decade as Carbon Tax Kicks In; The Guardian: London, UK, 2014. [Google Scholar]
  49. Taylor, L. Australia Kills off Carbon Tax; The Guardian: London, UK, 2014. [Google Scholar]
  50. Joselow, M. National Carbon Tax Uphel14d by Canada’s Supreme Court. Scientific American. 2021. Available online: https://www.scientificamerican.com/article/national-carbon-tax-upheld-by-canadas-supreme-court/ (accessed on 6 May 2021).
  51. Hansen, P.G.; Jespersen, A.M. Nudge and the manipulation of choice: A framework for the responsible use of the nudge approach to behaviour change in public policy. Eur. J. Risk Regul. 2013, 4, 3–28. [Google Scholar] [CrossRef] [Green Version]
  52. Stratton, S. Nudge Theory Back in Fashion with Tories; The Guardian: London, UK, 2009. [Google Scholar]
  53. Rigby, S. COVID-19: “Nudges” Change Intentions but Not Behaviour—BBC Science Focus Magazine. Science Focus. 2020. Available online: https://www.sciencefocus.com/news/covid-19-psychological-nudges-change-intentions-but-not-behaviour/ (accessed on 14 January 2021).
  54. Yates, T. Why Is the Government Relying on Nudge Theory to Fight Coronavirus? The Guardian: London, UK,, 2020. [Google Scholar]
  55. Sodha, S. Nudge Theory Is a Poor Substitute for Hard Science in Matters of Life or Death; The Guardian: London, UK, 2020. [Google Scholar]
  56. Forrest, A. Coronavirus: Scientists Cast Doubt on Government ‘Nudge’ Messaging during Outbreak; The Independent: London, UK, 2020. [Google Scholar]
  57. Sibony, A.L. The UK COVID-19 response: A behavioural irony? Eur. J. Risk Regul. 2020, 11, 350–357. [Google Scholar] [CrossRef] [Green Version]
  58. Callan, T.; Lyons, S.; Scott, S.; Tol, R.S.J.; Verde, S. The distributional implications of a carbon tax in Ireland. Energy Policy 2009, 37, 407–412. [Google Scholar] [CrossRef] [Green Version]
  59. Al-Guthmy, F.M.O.; Yan, W. Mind the gap: Personal carbon trading for road transport in Kenya. Clim. Policy 2020, 20, 1141–1160. [Google Scholar] [CrossRef]
  60. Goodland, R. The concept of environmental sustainability. Annu. Rev. Ecol. Syst. 1995, 2, 1–24. [Google Scholar] [CrossRef]
  61. Sandberg, M.; Klockars, K.; Wilén, K. Green growth or degrowth? Assessing the normative justifications for environmental sustainability and economic growth through critical social theory. J. Clean. Prod. 2019, 206, 133–141. [Google Scholar] [CrossRef]
  62. Li, J.; Fan, J.; Zhao, D.; Wang, S. Allowance price and distributional effects under a personal carbon trading scheme. J. Clean. Prod. 2015, 103, 319–329. [Google Scholar] [CrossRef]
  63. Swain, F. Can Rationing Carbon Help Fight Climate Change? BBC Future. BBC. 2020. Available online: https://www.bbc.com/future/article/20200217-can-rationing-carbon-help-fight-climate-change (accessed on 3 May 2021).
  64. Uusitalo, V.; Huttunen, A. Motivating Citizens to Reduce Their Mobility Emissions through Personal Carbon Trading; European Union: Lahti, Finland, 2021. [Google Scholar]
  65. Satoh, I. IT-enabled personal-level carbon emission allowance. Procedia Comput. Sci. 2014, 32, 665–672. [Google Scholar] [CrossRef] [Green Version]
  66. California Environmental Protection Agency. California Cap and Trade Program Overview. 2015; pp. 1–2. Available online: www.Arb.caGov (accessed on 21 June 2021).
  67. Thomas, G.O.; Sautkina, E.; Poortinga, W.; Wolstenholme, E.; Whitmarsh, L. The English plastic bag charge changed behavior and increased support for other charges to reduce plastic waste. Front. Psychol. 2019, 10, 266. [Google Scholar] [CrossRef] [Green Version]
  68. Zheng, Z.; Liu, Z.; Liu, C.; Shiwakoti, N. Understanding public response to a congestion charge: A random-effects ordered logit approach. Transp. Res. Part A Policy Pract. 2014, 70, 117–134. [Google Scholar] [CrossRef] [Green Version]
  69. Preston, I.; White, V.; Thumim, J.; Bridgeman, T. Distribution of Household Carbon Emissions in the UK; Joseph Rowntree Foundation: York, UK, 2013. [Google Scholar]
  70. Hargreaves, K.; Preston, I.; White, V.; Thumim, J. The Distribution of Household CO2 Emissions in Great Britain; Joseph Rowntree Foundation: York, UK, 2013. [Google Scholar]
  71. Fremstad, A.; Paul, M. The impact of a carbon tax on inequality. Ecol. Econ. 2019, 163, 88–97. [Google Scholar] [CrossRef]
  72. DEFRA. Synthesis Report on the Findings from Defra’s Pre-Feasibility Study into Personal Carbon Trading; Department for Environment Food & Rural Affairs: London, UK, 2008; Volume 26.
  73. CAIT. CAIT Historical—Explore Historic Greenhouse Gas Emissions. Climate Data Explorer. 2021. Available online: http://cait.wri.org/historical/CountryGHGEmissions (accessed on 24 March 2021).
  74. Fleming, D.; Chamberlin, S. TEQs Tradable Energy Quotas A Policy Framework for Peak Oil and Climate Change; The All Party Parliamentary Group on Peak Oil & The Lean Economy Connection: London, UK, 2011.
  75. Starkey, R.; Anderson, K. Domestic Tradable Quotas: A Policy Instrument for the Reduction of Greenhouse Gas Emissions; Tyndall Centre for Climate Change Research: Norwich, UK, 2005. [Google Scholar]
Figure 1. Schematic of simplified example of a Personal Carbon Trading scheme.
Sustainability 14 09238 g001
Figure 2. Schematic of simplified example of a Personal Carbon Allowance scheme.
Sustainability 14 09238 g002
Figure 3. Schematic of simplified examples of two CL models, one with a government advised carbon cap, one without.
Sustainability 14 09238 g003
Figure 4. Schematic of simple example of a carbon tax.
Sustainability 14 09238 g004
Table 1. Four main identified Personal Carbon Budget Models and notable features and shortcomings of each model.
ModelFeaturesShortcomingsLiterature
Carbon Tax
(Mandatory)
  • Either flat tax or proportional to carbon emissions by weight per good or service
  • Levied upstream
  • Could have exemptions, etc.
  • No cap on emissions
  • Tax revenue could be invested in green enterprise and innovation
  • No emissions cap means emissions generation cannot be limited to specific levels
  • Taxes largely politically unpopular
  • Regressive policy
[7,10,11,12,13,14]
Personal Carbon Trading
(Mandatory)
  • Carbon ‘credits’ allocated per year, each credit worth a certain amount of carbon/value of carbon, additional credits have a cost. Surplus credits can be sold.
  • Allocation per person or household
  • Scope of what is included is variable but personal only
  • Requires goods and services’ carbon footprint to be calculated
  • Credits could roll over to next year
  • Needs government body to regulate
  • Hard cap on emissions
  • Trading may be socially unjust due to advantages those with greater finances may have
  • Requires considerable infrastructure
  • May be politically unpopular
[14,15,16,17,18,19,20,21]
Personal Carbon Allowance With No Trading
(Mandatory)
  • Carbon ‘credits’ allocated per year, each credit worth a certain amount of carbon/value of carbon
  • Allocation per person or household
  • Scope of what is included is variable but personal only
  • Requires goods and services’ carbon footprint calculated
  • Credits could roll over to next year
  • Needs government body to regulate
  • Hard cap on emissions
  • No trading of credits in any way
  • Requires considerable infrastructure
  • May be politically unpopular
[7,18,19,20,21]
Carbon Labelling
(Voluntary)
  • Responsibility all on companies to provide carbon information on products and services
  • Regulatory body not necessary
  • Requires goods and services’ carbon footprint calculated
  • Public given target but no enforcement
  • No cap on emissions
  • No emissions cap means emissions generation cannot be limited to specific levels
  • May be politically popular due to being voluntary
  • Cannot guarantee any reductions since it is voluntary
[22,23,24]
Publisher’s Note: MDPI stays neutral with regard to jurisdictional claims in published maps and institutional affiliations.

