Article

Interaction between Urbanization and Eco-Environment in Hebei Province, China

School of Mining and Geomatics Engineering, Hebei University of Engineering, Handan 056038, China
*
Author to whom correspondence should be addressed.
Sustainability 2022, 14(15), 9214; https://doi.org/10.3390/su14159214
Submission received: 5 July 2022 / Revised: 22 July 2022 / Accepted: 26 July 2022 / Published: 27 July 2022
(This article belongs to the Special Issue Urbanization and Environmental Sustainability)

Abstract

:
Understanding the complex interaction between urbanization and the eco-environment is necessary for rapid and quality urbanization, eco-environmental protection, and the harmonious coexistence of humans and nature within a region. Based on panel data from Hebei Province between 1985 and 2019, we suggested a symbiosis hypothesis of urbanization and the eco-environment (SHUE) and used the distance coordination coupling model, the Tapio decoupling model, and the symbiosis model to quantitatively determine the interaction relationship between urbanization and the eco-environment. We found that (1) the improved ‘Northam curve’ of urbanization in Hebei Province met the logistic equation. (2) During the study period, the coordinated coupling degree (CCD) of urbanization and eco-environment exhibited an overall upward trend, while the coupling type gradually changed from the endangered imbalance recession type to the coordinated development type. (3) The decoupling types showed strong and weak decoupling fluctuations, with a high frequency of strong decoupling; the growth rate of the urbanization index was higher than that of the eco-environment index; and there was a positive effect between urbanization and eco-environment indicating positive urbanization. (4) The research results verified SHUE. The symbiosis mode of urbanization and eco-environment was mainly asymmetric mutualism, with the two demonstrating mutual promotion and mutualism. However, in 2016–2019, the symbiosis mode became parasitic, urbanization development enforced upon the eco-environment. The study constructed a set of quantitative method to systematically discuss the interaction relationship from two dimensions: coupling and decoupling. The results provide reference for the coordinated development of urbanization and eco-environment in Hebei Province and consequentially enrich this research field.

1. Introduction

Since the Chinese reformation, the country’s level of urbanization has significantly increased, with the urbanization rate increasing from 17.9% in 1978 to 64.7% in 2021. China’s rapid urbanization has attracted global attention, greatly affecting the world development pattern. Unfortunately, this rapid urbanization has also had many negative consequences, including water shortage [1], energy consumption and CO2 emission [2,3], and damaged regional ecological service systems [4]. As an engine to promote social and economic development, urbanization is accompanied by many environmental problems, which restrict further urbanization [5]. Since the establishment of the Lowry Model [6], urbanization research has begun to focus on the application of mathematical methods. To predict the level of urbanization, Wlison [7] combined historical data with the moving average method, weighted moving average method, trend prediction method and the exponential smoothing method. In 1975, Northam [8] proposed the ‘Northam Curve’ that divided urbanization into the initial, rapid, and mature stages. Since then, urbanization research has entered a vigorous development stage [9,10,11]. There is an elaborate relationship between urbanization and the eco-environment [12]. Exploring this relationship and promoting its coordinated development has become a major issue in academic circles and government departments. This relationship has even been recognized as the frontier field within earth system science research for the next 10 years [13]. As early as 1994, Grossman and Kreuger [14] proposed the Environmental Kuznets Curve (EKC). The curve describes the quality of environmental changes with the improvement of urbanization [15]. Since its introduction, many scholars have studied the coupling relationship between urbanization and eco-environment subsystems, such as water resources, atmospheric environment, energy, and climate [16,17,18,19]. Based on the system theory paradigm, several econometric models, such as the coupling coordination degree model, grey correlation degree model and the Tapio model have been used to explore the interactive stress relationship between urbanization and the eco-environment [20,21,22,23,24,25]. In the study of this coupling relationship, the research area and eco-environment evaluation indexes tend to differ [26,27,28,29,30,31] and the study area is also different [32,33,34,35]. With further advancements of research, more scholars aim to use system dynamics, artificial intelligence, and integrated technology methods for dynamic simulation and scenario prediction [36,37].
At present, research on the relationship between urbanization and eco-environment is in its ascendancy [38]. It is focused mainly on using the coupling degree and CCD to measure the mutual influence and coordinated development between the two components [39,40]. The CCD can be used to evaluate the coordination degree of urbanization and eco-environment coupling, and the Tapio decoupling model can express the impact of urbanization on eco-environment. However, the coupling degree and the CCD are unable to reflect the qualitative and quantitative influence degree between subsystems at different development stages in the coupling system. The symbiosis degree model is a dynamic mathematical equation used to express the mutual symbiosis of two species population. It can not only reflect the interaction mode of two symbiotic units, but also reflect the interaction intensity between them. To this end, this study introduces symbiosis theory, which is based on the coupling coordination degree and the Tapio decoupling model. This study aims to understand the interaction mode and intensity between urbanization and eco-environment at different stages of development. The theory originated from ecology and was put forward by Derby in 1879 [41]. It claims that different species depend on a certain material connection to coexist. Thus, the symbiosis degree describes the degree of symbiosis between units, thus reflecting the development and operating law of the entire symbiotic system [42]. Moreover, it has achieved good development in the ecological field [43,44]. For example, Delaux et al. studied the effects of microbial symbiosis on plant evolution [45]. Furthermore, Griesmann et al. were able to explain the effect of symbiosis between plants and nitrogen-fixing bacteria on the global nitrogen cycle from the perspective of genetics [46]. Gutjahr et al. explored the effects of environment and symbiotic bacteria on rice growth [47]. With its continuous development, symbiosis theory gradually began to be applied to anthropology, economics, sociology, and various other fields. Based on this theory, Wang et al. studied the synergistic effect of the water-energy-food relationship in the Beijing-Tianjin-Hebei region [48].
Based on symbiosis theory, there are three symbiotic elements between urbanization and eco-environment. The first symbiotic unit, urbanization and eco-environment may form a symbiont or symbiotic relationship between the basic energy production and exchange units. The second symbiosis mode or relationship is the way and form of interaction between urbanization and the eco-environment, such as parasitic symbiosis and mutualism. The third symbiotic environment, the development exogenous conditions of urbanization and eco-environment symbiotic mode is the harmonious coexistence of man and nature. Furthermore, urbanization and the eco-environment coincide with the principle of compatibility of quality parameters. The internal relationship between the two symbiotic units shows that their quality parameters can be expressed mutually. In addition, the SHUE satisfies the principle of symbiotic energy generation. Environmental protection enterprises within the production process can improve the quality of the eco-environment, while also promoting social development, and thus improving the level of urbanization. Based on the above analysis, there are mutual influences, restriction, common development and mutual symbiosis between urbanization and the eco-environment, which conforms to the symbiosis theory hypothesis. This study extends the scope of symbiosis theory to urban geography and puts forth the hypothesis of symbiosis between urbanization and eco-environment. The symbiosis degree is used to explore the type and size of mutual influence between the eco-environment and urbanization.
Under the national strategic background of the coordinated development of Beijing-Tianjin-Hebei, the construction of the Xiong’an New Area and the urbanization construction in the node cities in Hebei Province as an important area to undertake the non-capital functions of Beijing, have their particularity and are also the main area of new urbanization in Beijing-Tianjin-Hebei. As a result, the urban system planning of Hebei Province (2016–2030) suggests that the urbanization rate of permanent residents will reach 70% by 2030 in Hebei Province, China. With accelerated urbanization after the proposal of the Beijing-Tianjin-Hebei integration strategy in 2014, the urbanization level of Hebei Province has been significantly accelerated. However, it has also put extensive pressure on water resources, land resources, and the eco-environment in Hebei Province, partially restricting the development of the social economy and urbanization. Faced with eco-environment pressure, it is crucial to understand how to adequately promote the coordinated development of urbanization and eco-environment. Present research has focused on the quantitative measurement of the coupling relationship in Beijing-Tianjin-Hebei urban agglomeration and the discrimination of coordinated development types [49,50,51]. Some scholars have examined the relationship between urbanization and eco-environment in Hebei Province, China [52,53,54]. However, very few studies have systematically and quantitatively explored the interactive relationship between urbanization and eco-environment in this province.
Therefore, the coordinated development of urbanization and the eco-environment needs further examination. To relatively comprehensively reveal the interactive relationship between urbanization and the eco-environment in Hebei Province, starting from Hebei Province as a whole, this study proposes the symbiosis hypothesis of urbanization and the eco-environment. It integrates various mathematical models to conduct a quantitative study on the interaction relationship between them in two dimensions, coupling and decoupling, to realize the whole process analysis of coupling quantitative measurement, coupling type identification, decoupling path exploration and symbiosis hypothesis verification. These results should provide references and suggestions for promoting the coordinated and healthy development of urbanization and eco-environment in Hebei Province. Furthermore, they will enrich the research field concentrated on the interactive stress relationship between urbanization and the eco-environment.

2. Materials and Methods

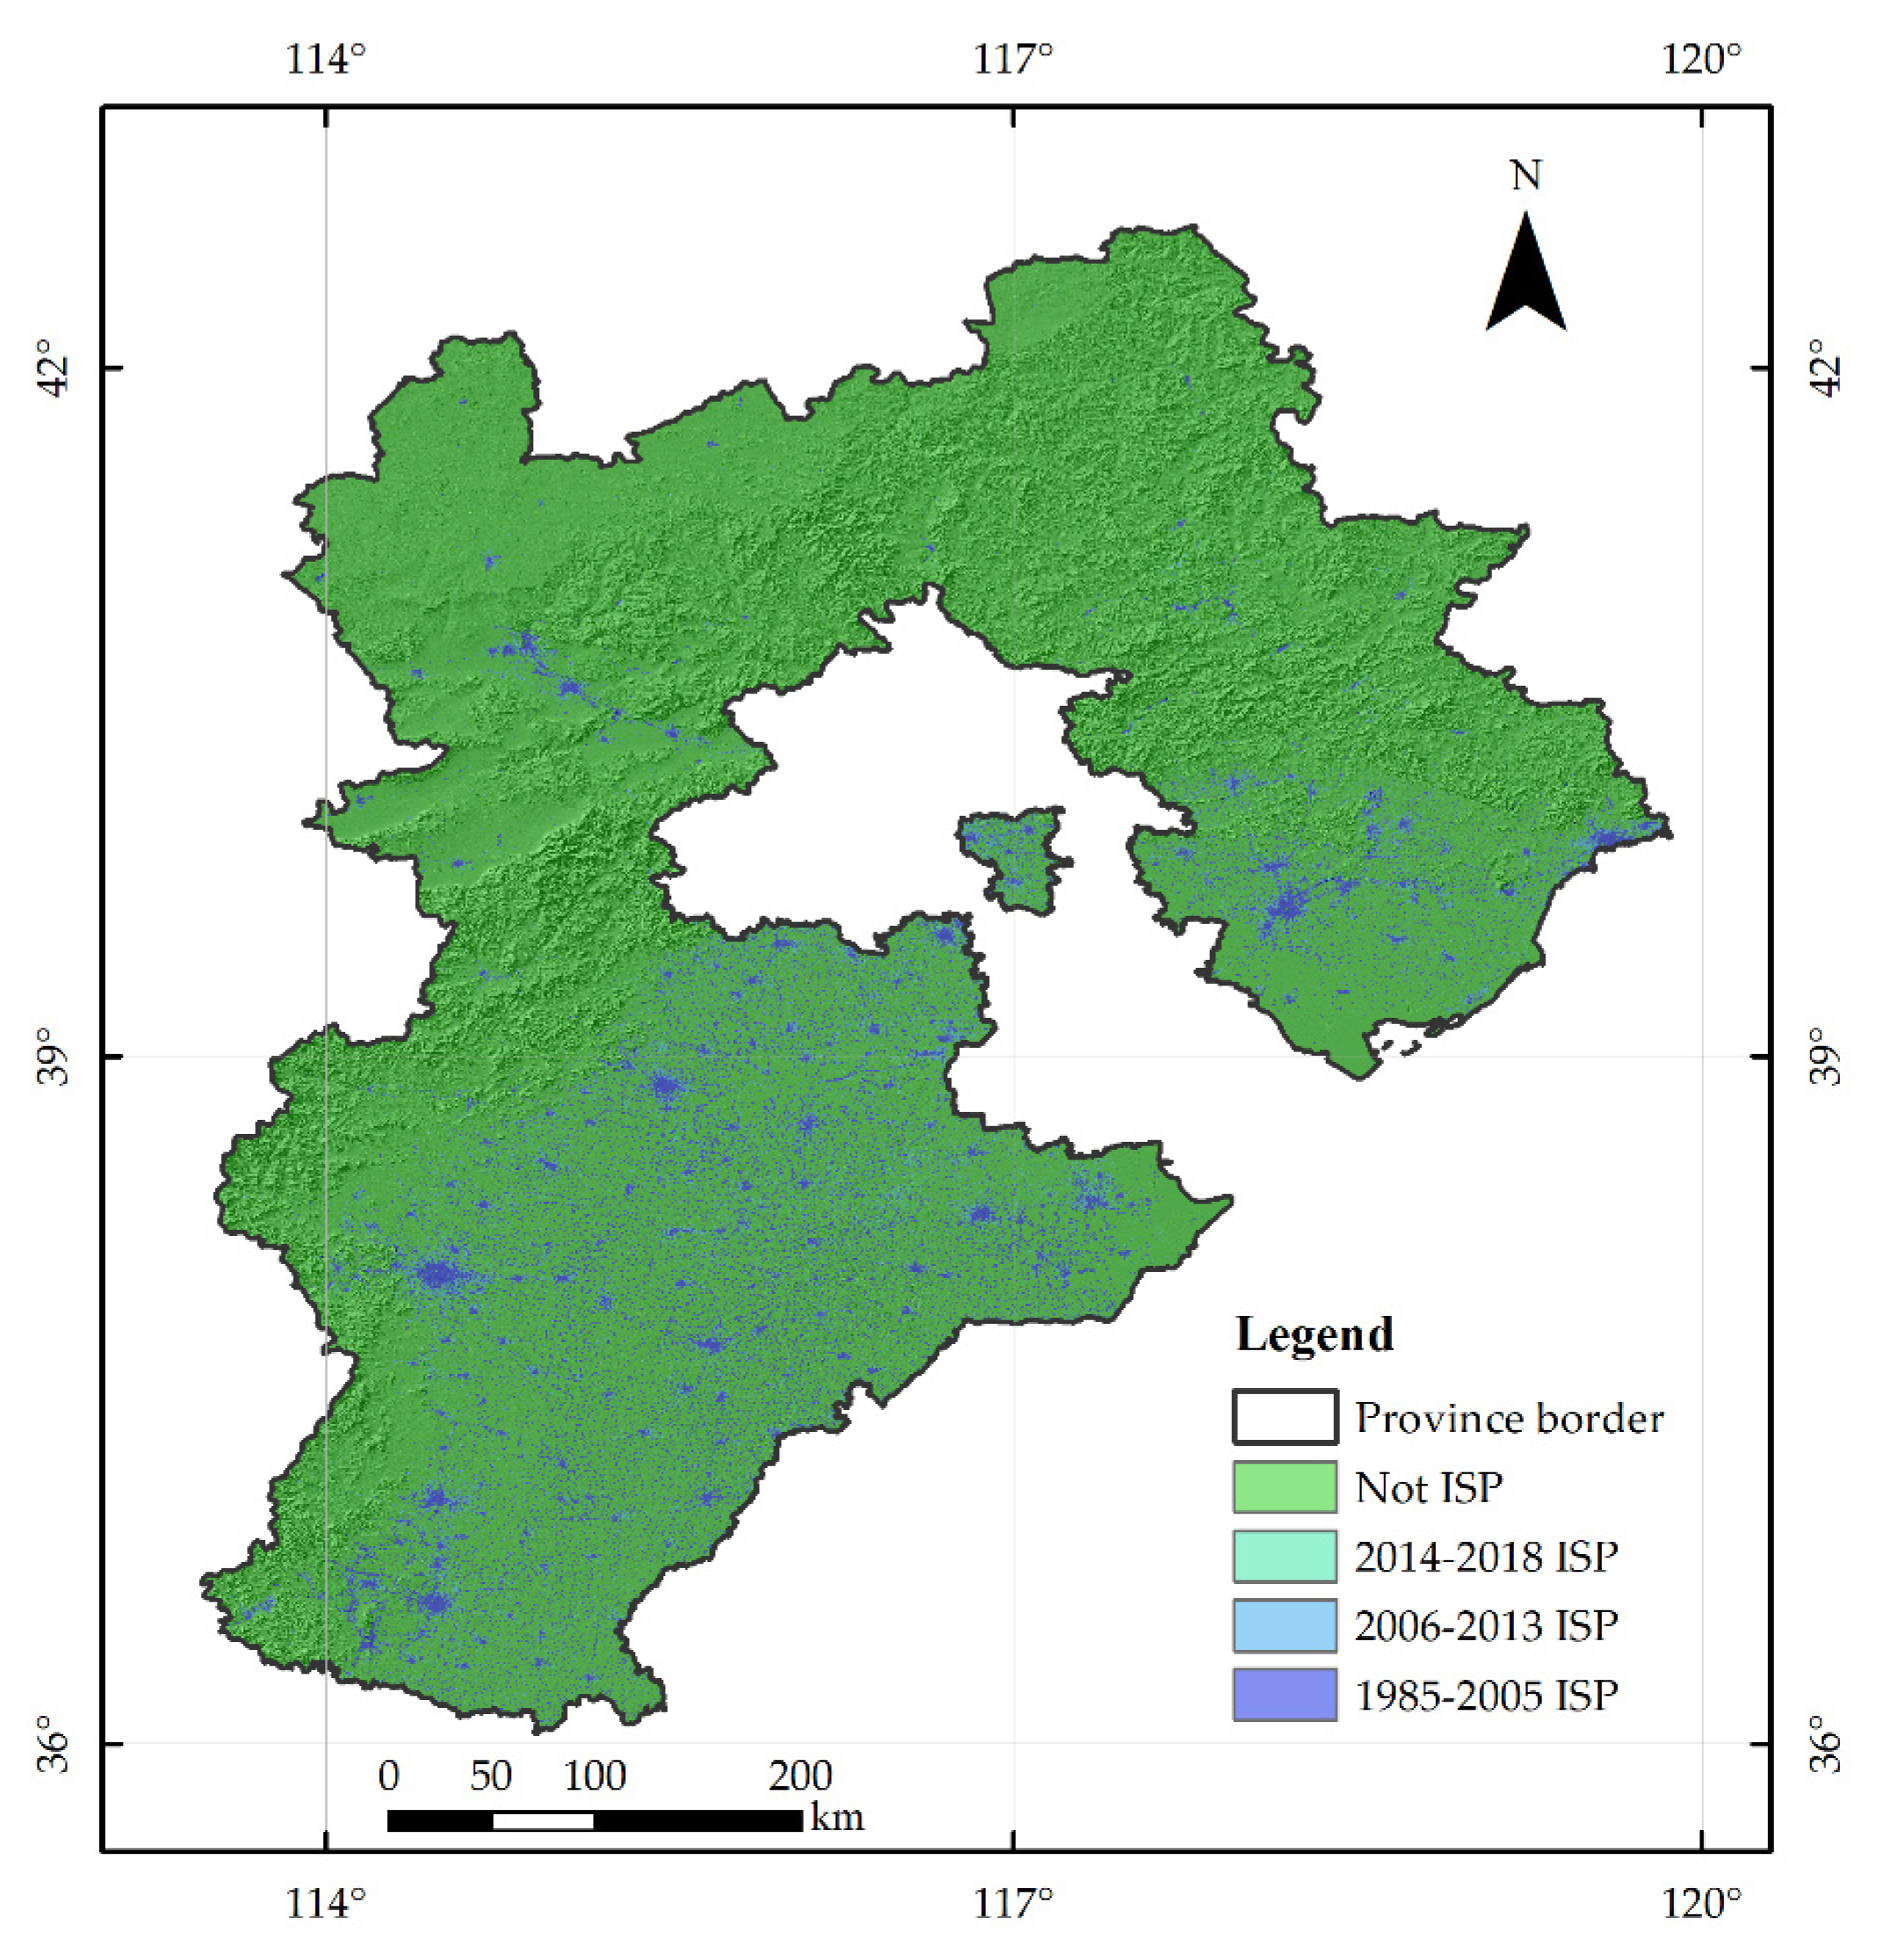
2.1. Overview of the Study Area

Hebei Province is in the North China Plain, between 36°0′–42°40′ N and 113°27′–119°50′ E. It surrounds the Chinese capital Beijing and is adjacent to Tianjin and the Bohai Sea. Its terrain is high in the northwest and low in the southeast, tilted from northwest to southeast (Figure 1). Hebei Province is the only one to have plateaus, mountains, hills, plains, lakes, and seashore. In 2019, the province had a gross national product of 35.145 billion Yuan. Its total resident population was 7.447 million, of which 43.77 million were urban residents, with an urbanization rate of 58.8%. With accelerated urbanization, Hebei Province promotes economic and social development. However, it is also facing environmental issues such as air pollution, water quality decline, land resources shortage and eco-environment pattern imbalance. All these issues restrict urbanization. Simultaneously, a low level of urbanization causes a rural life pollution problem, restricting sustainable development and the improvement of eco-environment quality in Hebei Province. As the main field and eco-environment support area of the national strategy of the Beijing-Tianjin-Hebei integration and the construction of Xiong’an New Area, the functional orientation of cities in Hebei Province has its individuality. Therefore, it is crucial to ensure and improve the coordinated level of urbanization and eco-environment in Hebei Province and promote the coordinated development of the Beijing-Tianjin-Hebei urban agglomeration as a whole.

2.2. Data Source

To examine the relationship between urbanization and the eco-environment, this study uses data for the Hebei Province from 1985 to 2019. Combined with a comprehensive evaluation index system of urbanization and eco-environment, the data source involves two aspects. The first is statistical data, obtained from the China Statistical Yearbook (1986–2020) [55], China Urban Statistical Yearbook (1986–2020) [56], Hebei Statistical Yearbook (2020) [57], Hebei Economic Yearbook (1986–2019) [58], and Hebei Water Resources Bulletin (http://slt.hebei.gov.cn/, accessed on 20 April 2022). The second source is remote sensing monitoring data. Impervious Surface Percent (ISP) is selected as the comprehensive evaluation index to reflect the eco-environment pressure. The ISP data are gathered from the Earth System Research Center of Tsinghua University (Finer Resolution Observation and Monitoring -Global Land Cover). The resolution is 30 m and is interpreted by the Landsat image (TM/ETM+/OLI) provided by the Google Earth Engine platform, with an overall accuracy higher than 90% [59].

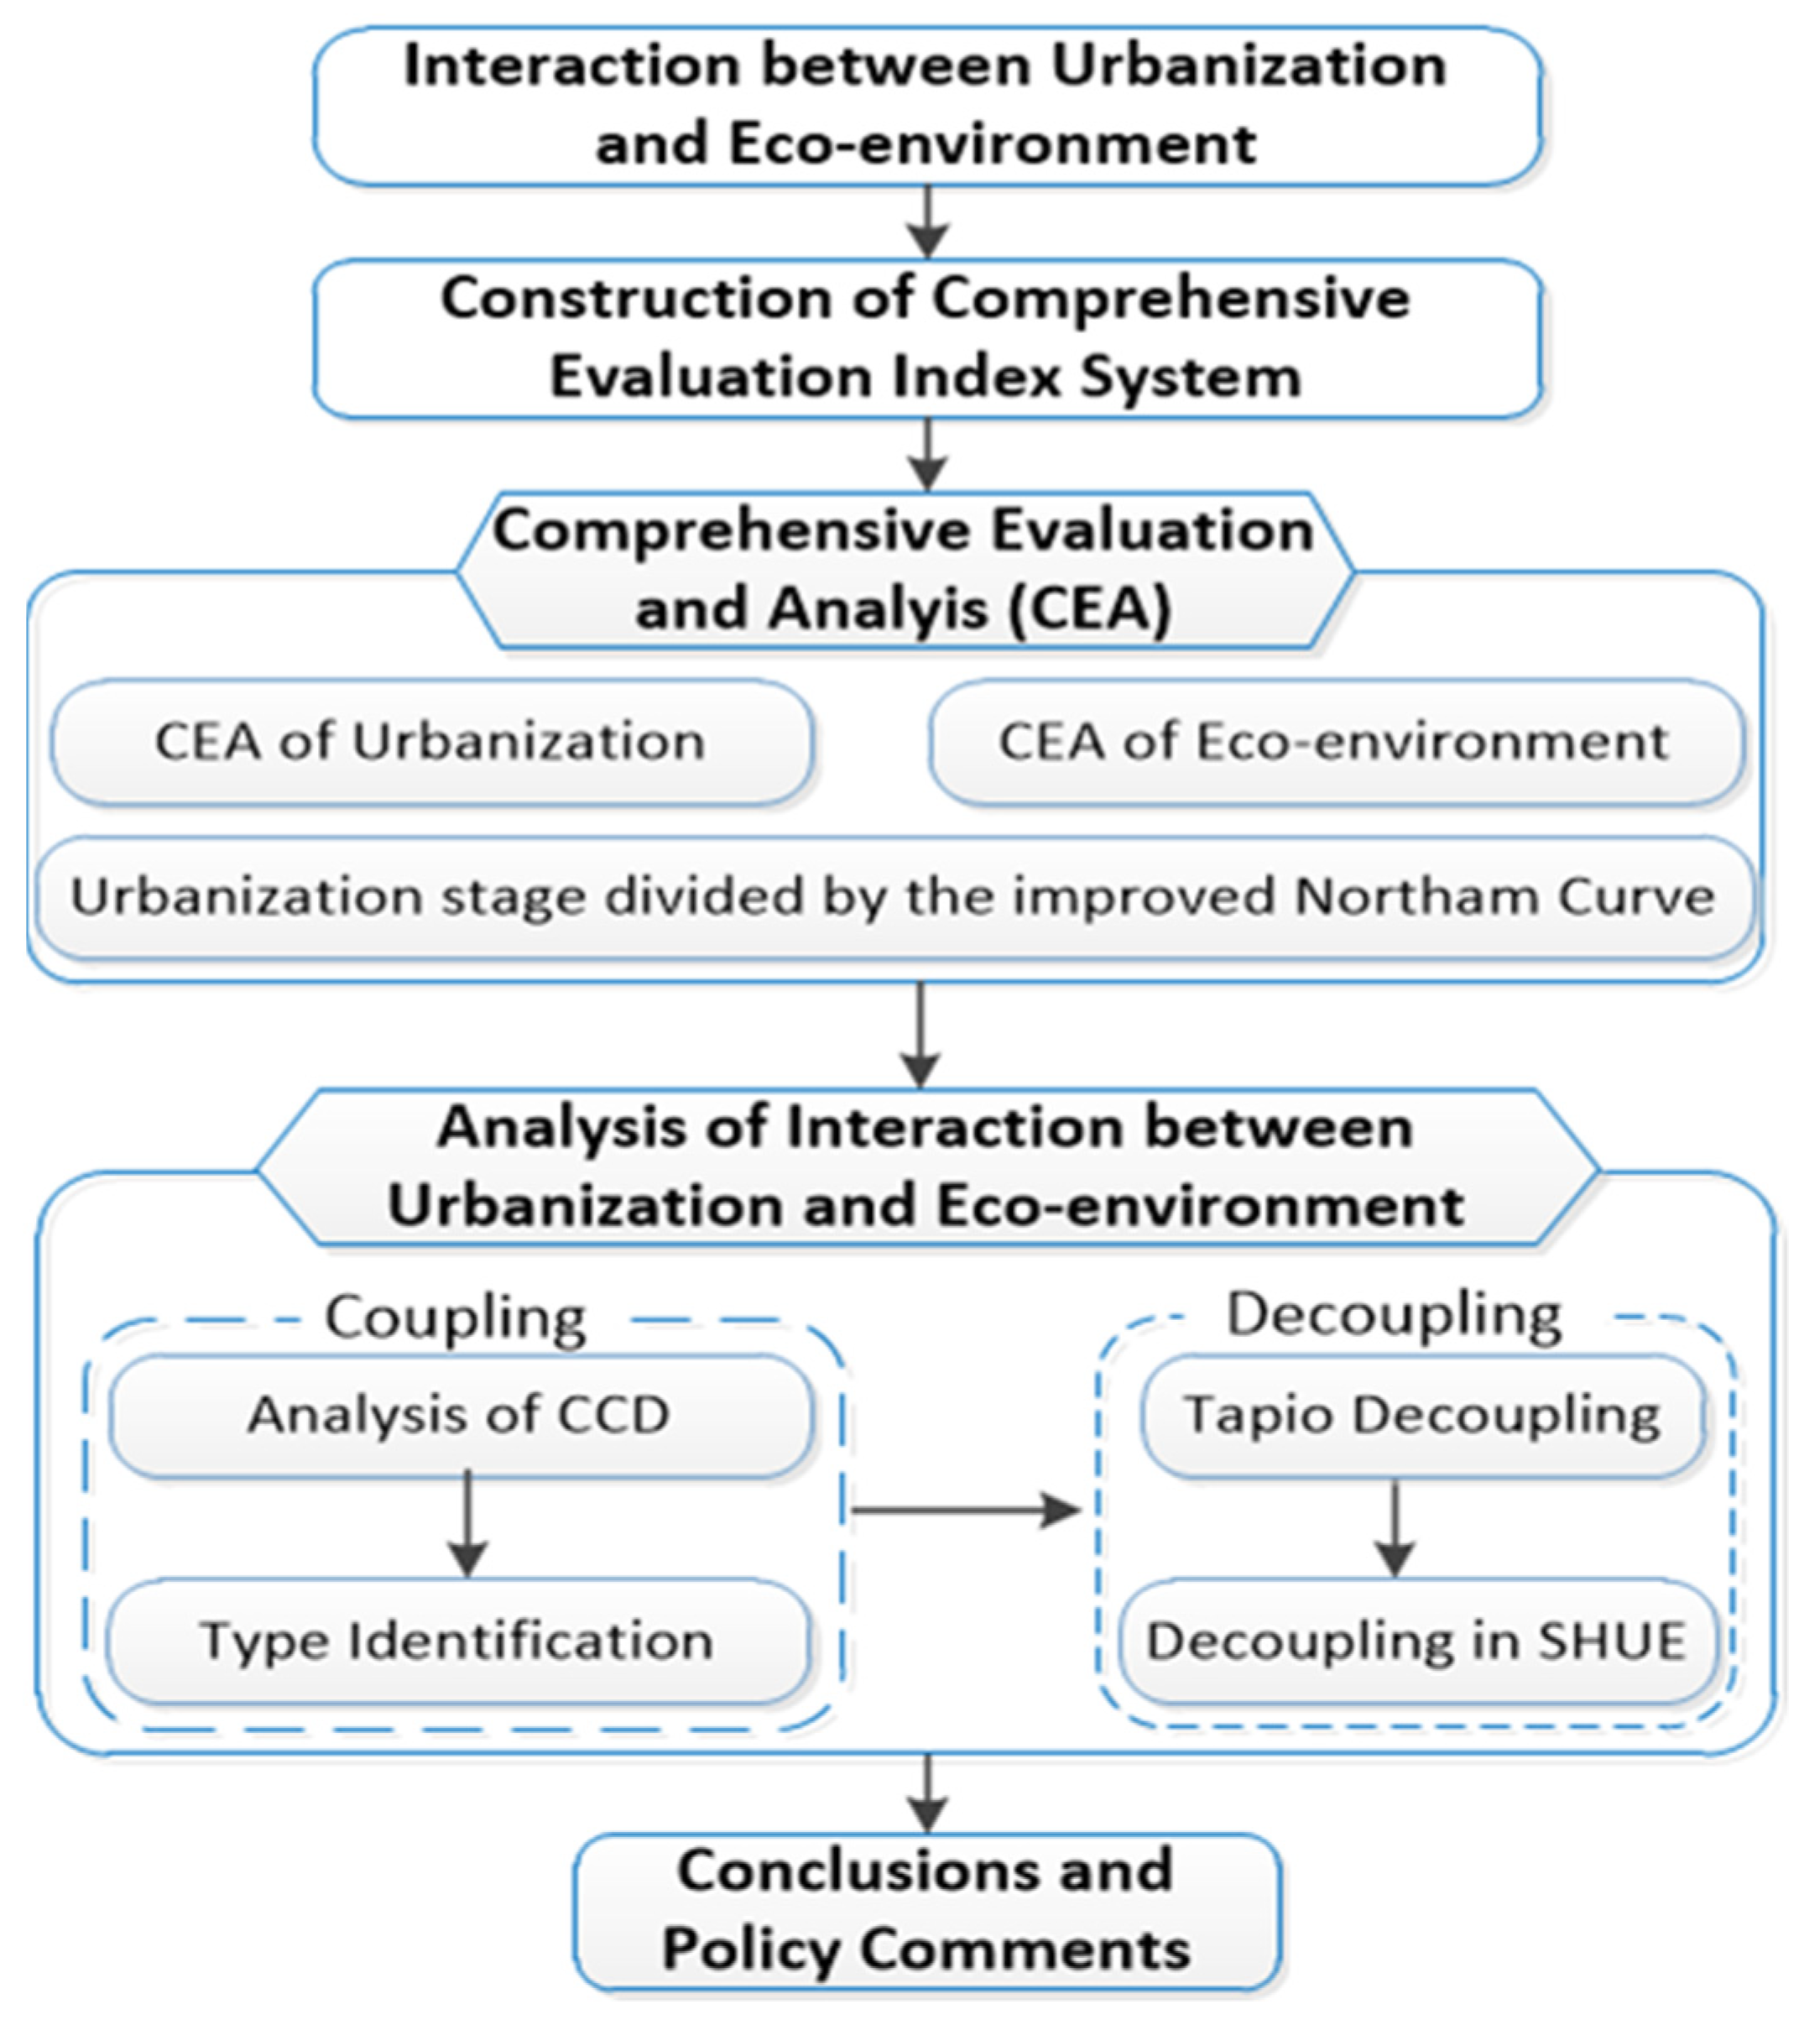
2.3. Research Method

Based on the symbiosis hypothesis, this study first divides the urbanization and eco-environment by using the comprehensive evaluation method and the improved ‘Northam Curve’. After, the distance coordination coupling model, the Tapio decoupling model and the symbiosis model are used to quantitatively measure the relationship between urbanization and eco-environment from two dimensions: coupling and decoupling. The study analyses its dynamic evolution characteristics. In accordance with the research results, suggestions are put forward, and the basic research ideas are shown in Figure 2.

2.3.1. A Comprehensive Evaluation Method of Urbanization and Eco-Environment

  • Construction of a Comprehensive Evaluation Index System.
Urbanization and eco-environment are two relatively complex subsystems within social development. Therefore, it is necessary to establish a reasonable evaluation index system for their analysis. Combined with existing research [60,61] and following the principles of scientific nature, data availability, representativeness and systematic processes, ten representative indicators were selected from four dimensions, those of population, economy, society, and spatial urbanization. Furthermore, to construct a comprehensive evaluation index system of eco-environment, thirteen specific indicators were selected from four aspects, those of resource elements, ecological elements, ecological pressure and ecological response. In addition, the urbanization process increases the impervious surface percent (ISP) [62], thus impacting the urban eco-environment. This study introduces ISP as the eco-environment pressure evaluation index. The comprehensive evaluation index system was constructed as shown in Table 1.
2.
Data Standardization and the Weighting Method.
To eliminate the influence of the dimensional difference of each index, the range standardization method was used to reduce the interference of random factors [63]. Considering that there are positive and negative indicators in the eco-environment index system, different standardized calculation formulas were adopted, as shown in Formula (1)
A i j = { X i j min ( X i j ) max ( X i j ) min ( X i j ) , X i j     i s     p o s i t i v e       i n d i c a t o r max ( X i j ) X i j max ( X i j ) min ( X i j ) , X i j     i s     n e g a t i v e     i n d i c a t o r
where i represents the indicator serial number, and j denotes the year. Furthermore, X i j represents the actual value, while max ( X i j ) and min ( X i j ) denote the maximum and minimum value of indicator i . After standardization, the greater the value of all the indicators is the better.
This study used a combination of a subjective and objective weight determination methods to obtain relatively accurate results. The former, the subjective weight was determined by an analytic hierarchy process (AHP), while the indexes in the comprehensive evaluation index system were scored according to existing literature [61,64]. On the other hand, the objective weight was determined by the entropy method (EM). To reduce the deviation, the minimum information entropy principle was used to calculate the comprehensive weight (CW), as shown in Formula (2) [65], Values for w 1 i , w 2 i were calculated by the entropy method and the analytic hierarchy process, respectively. The process of obtaining the index weight of urbanization and eco-environment comprehensive is shown in Table 1.
w i = ( w 1 i × w 2 i ) 1 2 i = 1 n ( w 1 i × w 2 i ) 1 2
3.
Comprehensive Evaluation Calculation Method.
Based on the comprehensive weight of each indicator, the study used the linear weighting method to calculate the results of population, economy, society and spatial urbanization. This method was also employed to calculate the evaluation index values of resource elements, ecological elements, ecological pressure, and ecological response subsystems. After these were determined, the results of urbanization and eco-environment system were obtained according to the weight of the basic grade indicator. The formulas for this are provided in Equations (3) and (4).
f ( x ) = i = 1 n w i × x i , g ( y ) = j = 1 m w j × y j
F ( x ) = i = 1 n W i × f ( x ) , G ( y ) = j = 1 m W j × g ( y )
where f ( x ) and g ( y ) denote the value of urbanization and eco-environment subsystem, while F ( x ) and G ( y ) represent the integrated value of urbanization and eco-environment system. Next, x i and y j denote the standardized value of the urbanization and eco-environment basic grade indicator, while w i , w j represent the CW of this indicator. Finally, W i and W j denote the CW of urbanization and eco-environment subsystem.

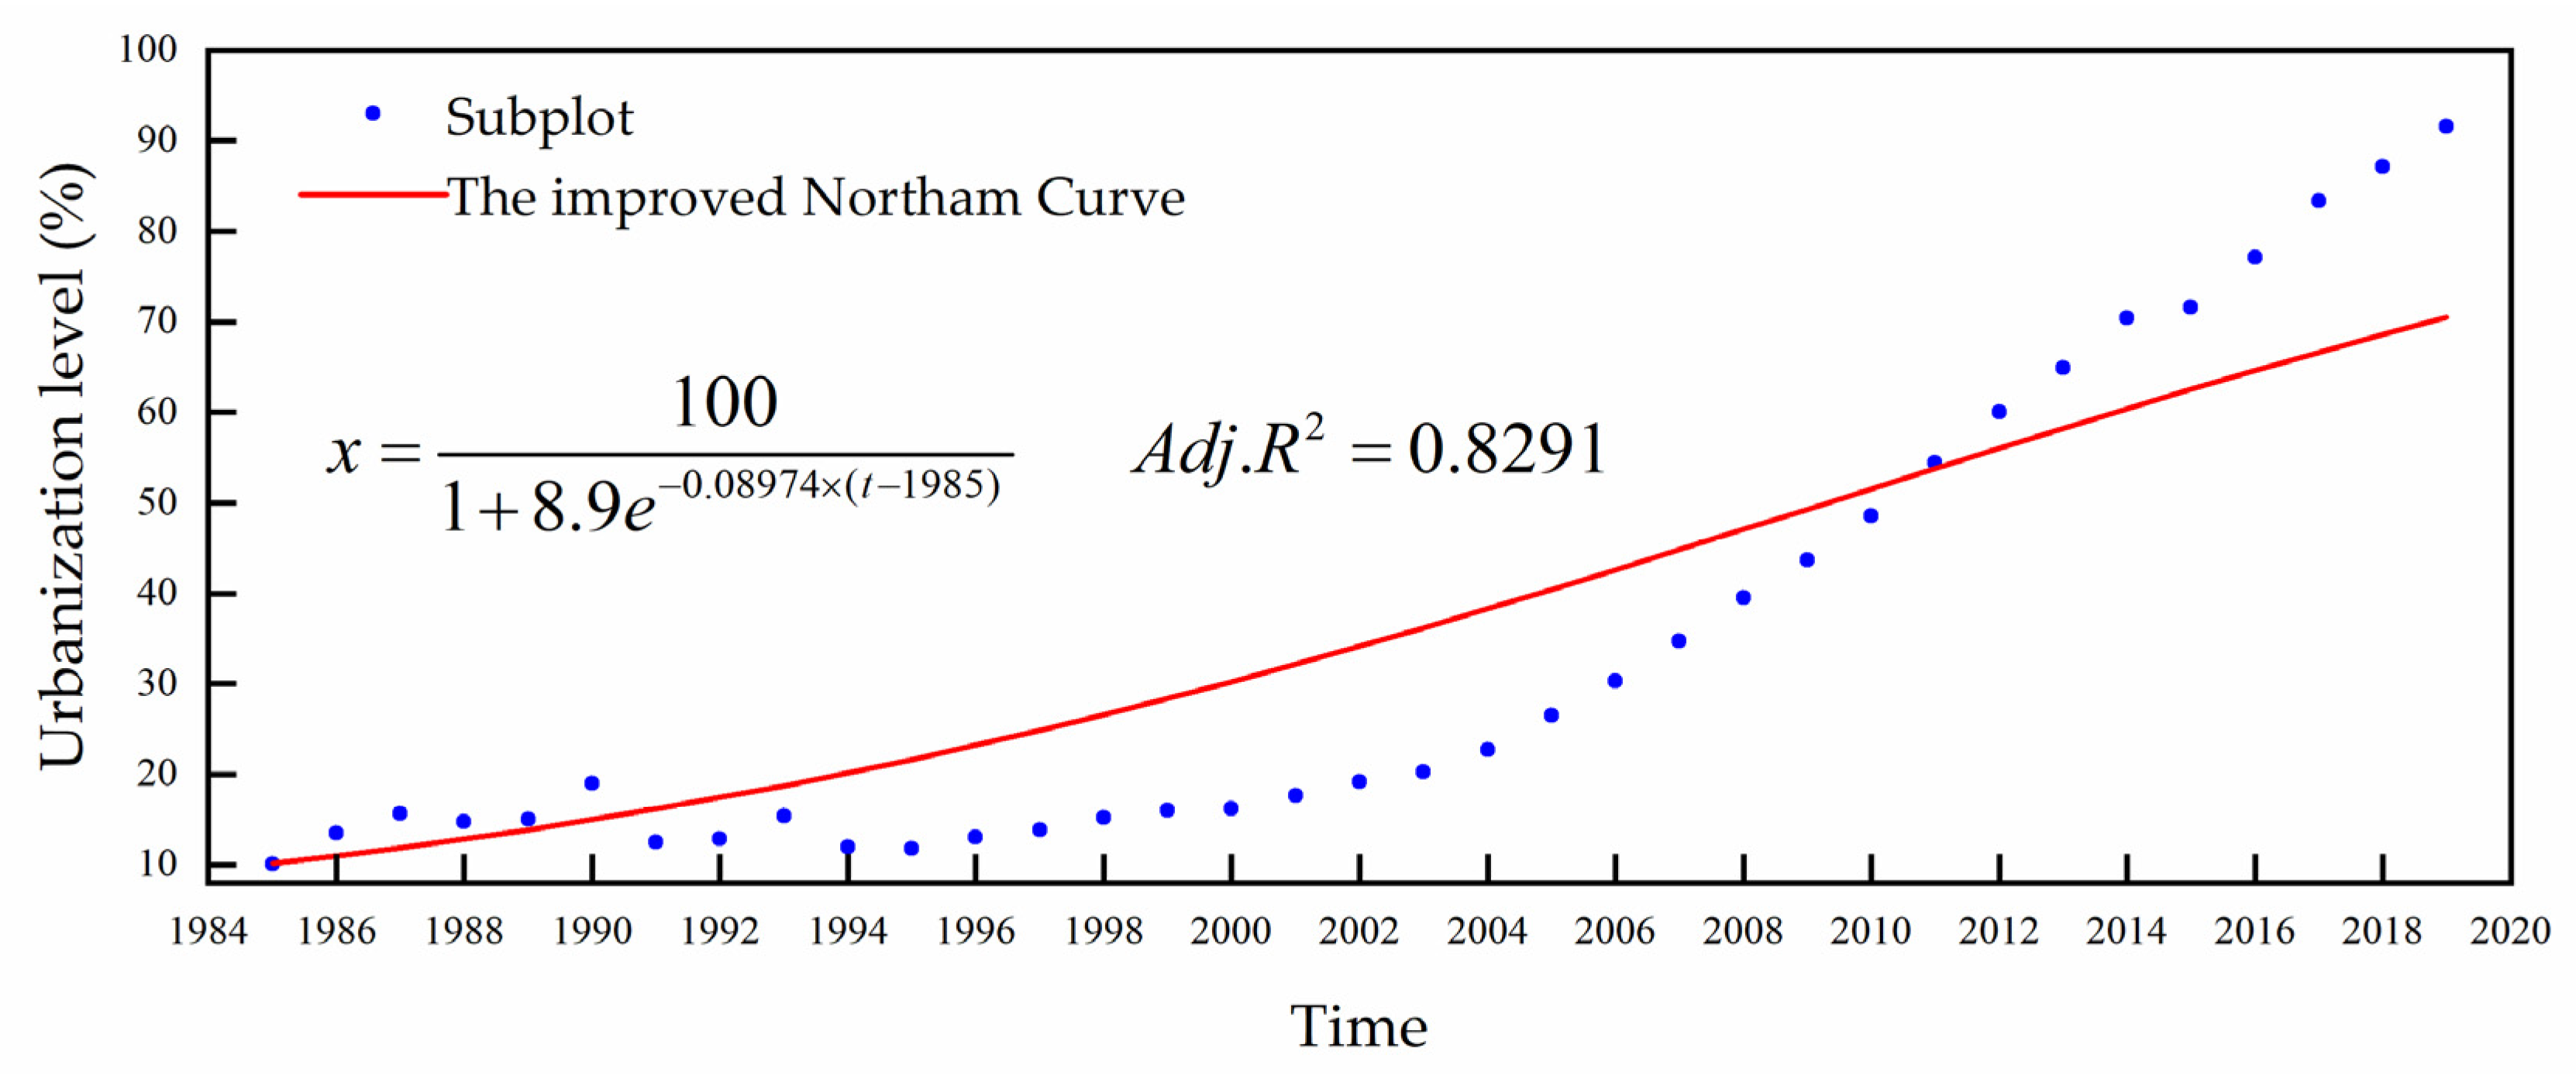
2.3.2. The Improved Northam Curve

In 1975, Northam used a logistic equation to conduct a regression analysis of the urbanization level of developed countries. He found that the level of urbanization satisfied the logistic equation and the proposed ‘Northam Curve’, namely, the urbanization process presented a flattened inverted S-shaped curve. Instead of urbanization rate, this study used the urbanization comprehensive evaluation index to characterize the level of urbanization. In addition, it also used the multivariate regression analysis method to quantitatively analyse the change law of urban level with time. The development stage of urbanization was divided in accordance with these calculations. The formula for this is shown in Equation (5):
y ( t ) = y max 1 + ( y max y 0 1 ) e r t
where y 0 represents the minimum level of the urbanization.

2.3.3. Distance Coordination Coupling Degree Model

The CCD model quantitatively evaluates the coordination degree of the interaction between the urbanization system and the eco-environment system. It can detail the problems within the development process. This paper employed the distance coordination coupling degree model to explore the degree of coordinated development of the urbanization and eco-environment system. Based on the CCD calculation, the Euclidean distance formula was introduced and measures the distance between the actual state and the ideal state of the system, and it is the deviation between the actual value and the ideal value of the evaluation variable. When the system is in ideal coordination, the two systems pull towards and are in the state of coordinated development. The symbols x 1 t , x 1 t , x 2 t , x 2 t were used to represent the actual and ideal values of the t t h year development degree of the urbanization system and eco-environment system. Furthermore, ( x 1 t , x 2 t ) T is equal to ( x 2 t , x 1 t ) T . Afterwards, it is necessary to construct Equation (6) [66]:
c t = ( 1 i = 1 2 ( x i t x i t ) 2 i = 1 2 S i 2 ) k
Assuming that the urbanization system is as important as the eco-environment one, S 1 ,   S 2 are taken to be 1. Furthermore, k is taken as 2 and represents the adjustment coefficient.
The distance coordination degree between urbanization and eco-environment system may be expressed by Equation (7):
c t = ( 1 ( x 1 t x 1 t ) 2 + ( x 2 t x 2 t ) 2 2 ) 2 = 1 | x 1 t x 2 t |
where c t represents the coordination degree of the system in the t t h year. The CCD of the system in the t t h year may be calculated by Equation (8). CCD reflects the coordinated development level of the system.
d t = D ( x t , c t ) = x t c t
In the above formula, d t denotes the CCD of the system in the t year. This study suggests that the higher its value, the better level of the coordinated development of the system.
Previous research [67,68] has divided the coordinated development of urbanization and eco-environment into three categories: coordinated development, transition, and the imbalance category (Table 2). According to specific values, the transition category is further divided into the category of barely coordinated development and the category of endangered imbalance. In total, the coordinated development of urbanization and eco-environment has four subcategories. Based on the difference between development level of urbanization and eco-environment and the actual situation, the coordinated development of urbanization and eco-environment was further divided into 12 basic types.

2.3.4. Tapio Decoupling Model

Decoupling comes from the field of physics, meaning that the initial relationship between two or more physical quantities is either reduced or no longer exists. The Organization for Economic Cooperation and Development (OECD) introduced the Tapio decoupling model into agricultural policy research. Shortly afterwards, resource and eco-environmental scholars used decoupling to describe the relationship between economic growth and eco-environmental pollution. At present, researchers have used the Tapio decoupling model to study the interaction between aforementioned factors. Guo et al. used it to examine the relationship between urbanization and resource environment in Beijing [69]. Furthermore, Wang et al. used the same model to analyse the decoupling elasticity between carbon emissions and economic growth [70]. Thus, to explore the complex relationship between urbanization and eco-environment at each coordinated development stage, this study employed the Tapio decoupling model and distance CCD model. The decoupling index of year t , ( D I t ) is calculated by the following formula [71]:
D I t = ( E t E t 1 ) / E t 1 ( U t U t 1 ) / U t 1
where E t and E t 1 represent the integrated value of the eco-environment in t and t 1 year, while U t and U t 1 denote the integrated values of urbanization in t and t 1 year.
The study obtained the decoupling index through the positive and negative growth rates of the eco-environment index and urbanization index. According to the critical values of 0, 0.8, 1.2, the decoupling types were divided into eight types: recession decoupling, strong decoupling, weak decoupling, expansion connection, recession connection, negative expansion decoupling, negative strong decoupling, negative weak decoupling. All of these are shown in Table 3.

2.3.5. The Symbiosis Hypothesis of Urbanization and Eco-Environment

A correlation between urbanization and the eco-environment has been proven by scholars [72]. Accordingly, this relationship may be studied by establishing a mathematical model. This study used the regression model to describe this quantitative relationship. The model itself lays the foundation for the construction of symbiosis model. The mathematical model was as follows:
x = 2.07 13.316 y + 28.172 y 2 16.803 y 3 A d j . R 2 = 0.937
y = 0.382 0.45 x + 2.419 x 2 1.666 x 3 A d j . R 2 = 0.895
where in Formulas (10) and (11), x denotes the level of the urbanization system, while y represent the development level of the eco-environment system.
The symbiosis degree model reflects the degree of correlation between two symbiotic units or systems. Using this degree may reveal the independence between the urbanization and eco-environment system. It is conducive to depicting the action and reaction between the urbanization and eco-environment system. Thus, this study used the comprehensive level of urbanization to represent the main parameters of the urbanization system. It also used the comprehensive level of eco-environment to represent the main parameters of the urbanization system. Then, the symbiosis degree of the urbanization system and eco-environment system may be calculated by the following formula [73,74,75]:
δ x y = d x / x d y / y = d x d y · y x
δ y x = d y / y d x / x = d y d x · x y
where δ x y represent the symbiosis degree of the urbanization system to the eco-environment system. In other words, it denotes the change that the main parameters of the eco-environment system cause to the main parameters of the urbanization system. Moreover, it reflects the contribution of the eco-environment system symbiosis unit to the urbanization system symbiosis unit. Next, δ y x denotes the symbiosis degree of the eco-environment system to the urbanization system. In other words, it represents the relative change that the main parameters of the urbanization system cause within the eco-environment system. This notion also reflects the contribution of the urbanization system symbiosis unit to the eco-environment system symbiosis unit.
Taking zero as the critical value, the symbiosis mode may be divided into four categories: parasitic symbiosis, partial symbiosis, asymmetric mutualism, and symmetric mutualism (Table 4).

3. Results and Interpretation

3.1. Comprehensive Evaluation of the Urbanization System and Eco-Environment

3.1.1. Analysis on the Evolution of the Comprehensive Urbanization Level

Based on the comprehensive weight of each index, the comprehensive level index of the urbanization system from 1985 to 2019 was calculated by Formulas (3) and (4). The present study proposes that this index be standardized and transformed into percentage mode rather than urbanization rate. The improved ‘Northam curve’ is obtained by fitting Equations (5) and (14). The parameter of the fitting equation is in line with expectations, while its adjusted determination coefficient R2 is 0.8291. In sum, the fitness of the improved ‘Northam curve’ is good. The curve in question obtained by our judgment satisfies the logistic equation. As Figure 3 shows, the curve describes the trend of urbanization with time and presents a flat inverted S-shaped curve. During 1985 to 2019, the overall level of urbanization was low, and tended to rise in Hebei Province. In terms of stages, between 1985 and 2005, the urbanization level was less than 30%, its changes were not evident, and urbanization development was in the initial stage. From 2006 to 2013, the level of urbanization was between 30~70%, indicating that it had increased significantly. Thus, this was a rapid development stage. Rapid urbanization was especially evident around 2008. To some extent, the 2008 Beijing Summer Olympic Games played a role in promoting the urbanization process in Hebei Province. Furthermore, from 2014 to 2019, the level of urbanization was more than 70%, meaning that the development of urbanization was in the mature stage. The change rate of urbanization was gradually slowing down, showing a relatively stable state. According to the above analysis, the urbanization process conformed to the standard S-shaped curve in Hebei Province.
x = 100 1 + 8.9 e 0.08974 × ( t 1985 ) A d j . R 2 = 0.8291

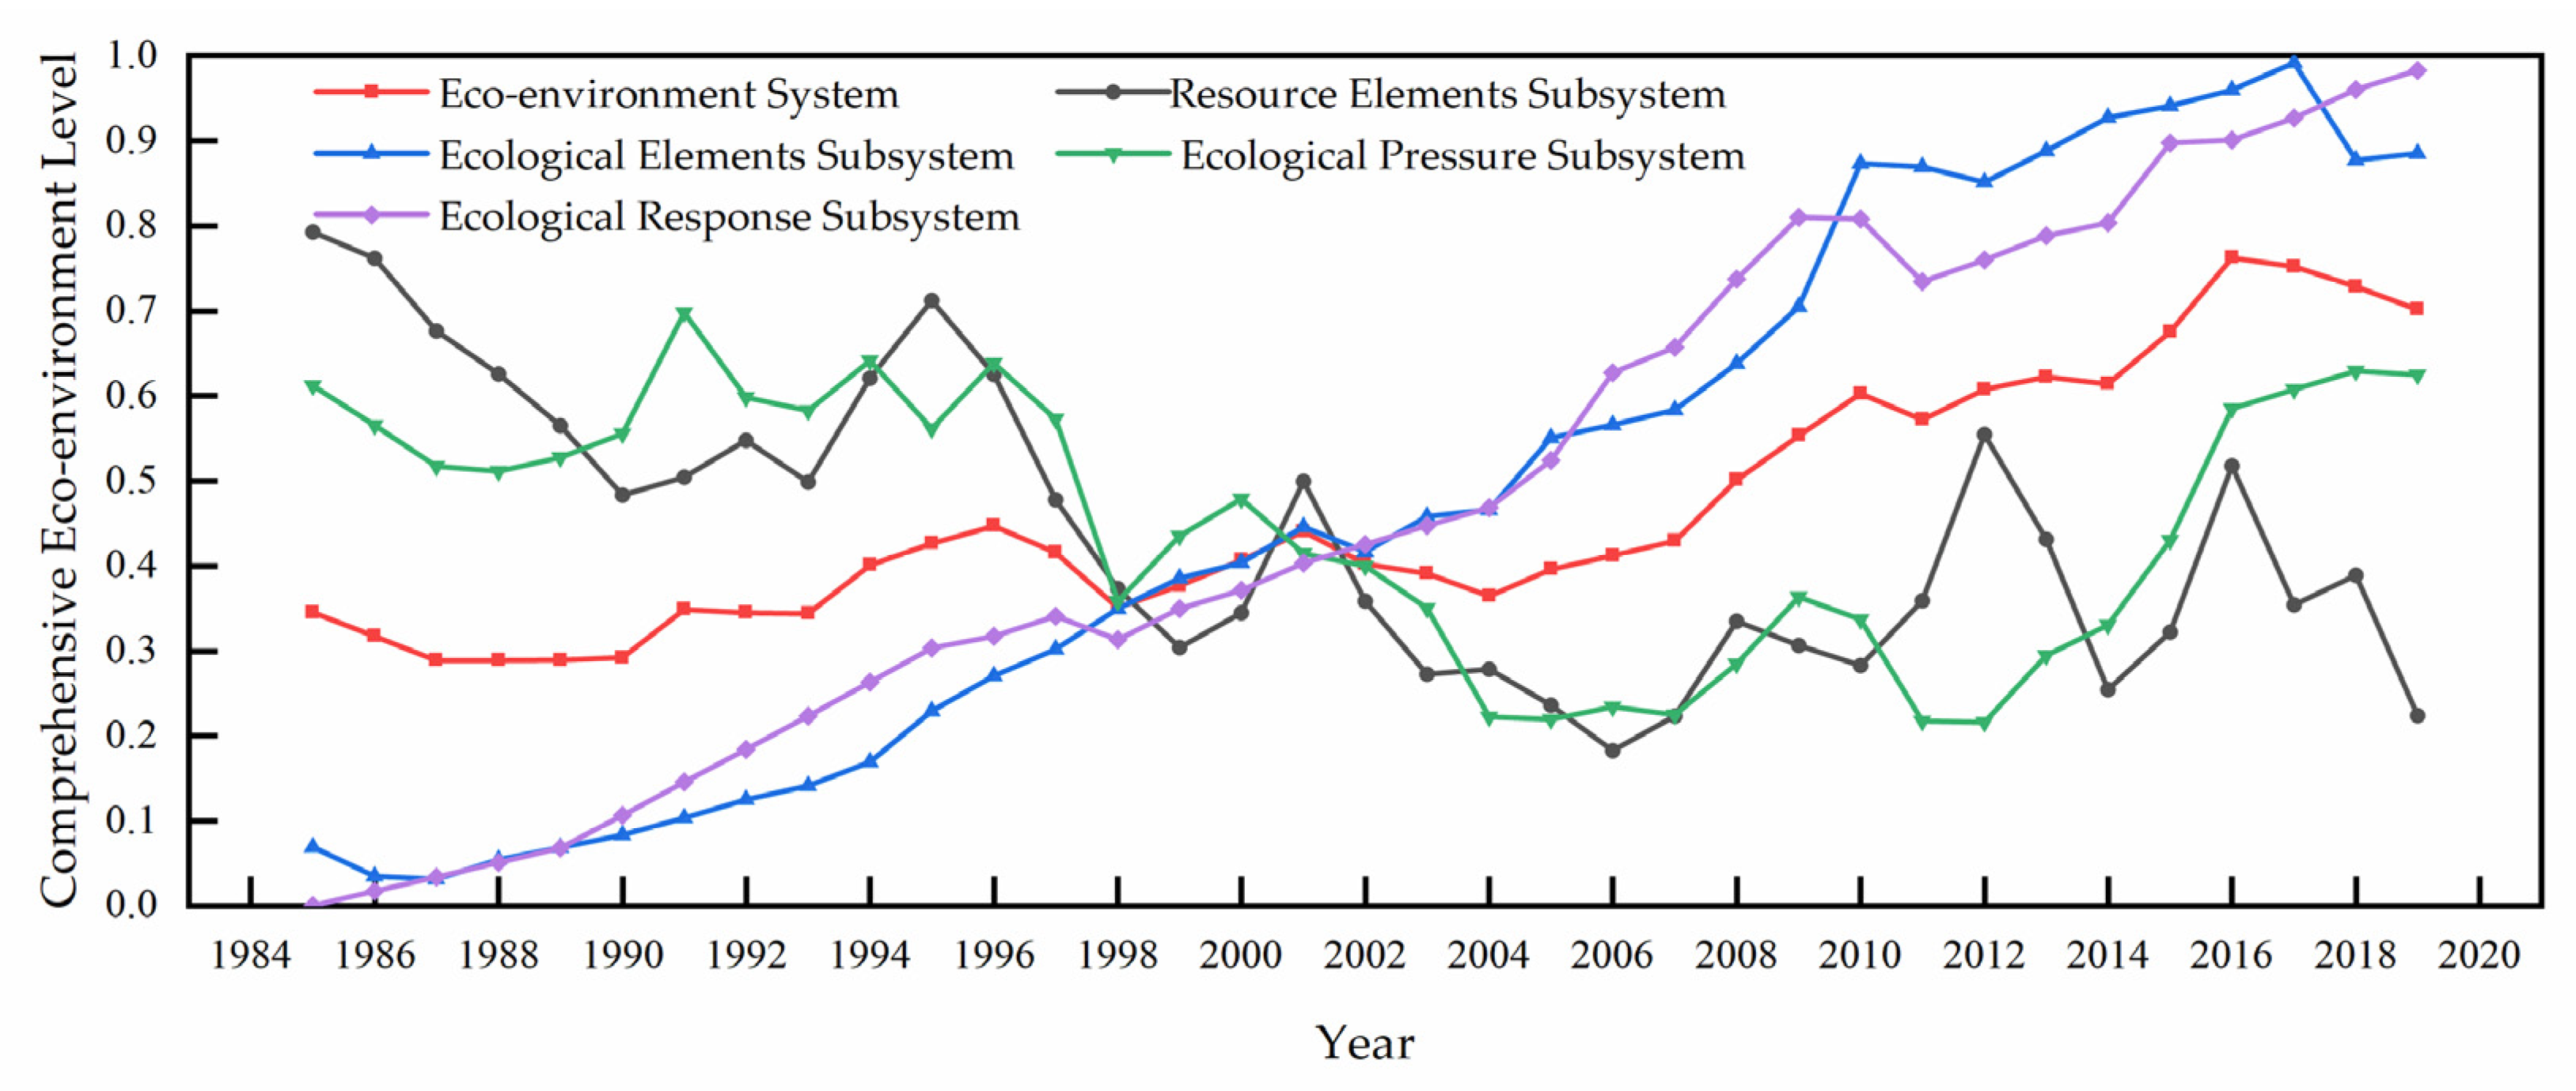
3.1.2. Analysis on the Evolution of the Comprehensive Eco-Environment Level

A similar process of urban comprehensive evaluation was used to calculate the comprehensive level index of eco-environment in Hebei Province from 1985 to 2019. The results are provided in Figure 4. The level of eco-environment showed a downward trend from 1985 to 1990. After 1990, it gradually increased, reaching its peak in 1996. However, it showed a downward trend once again until 1998. After this year, the comprehensive level of eco-environment steadily increased. Overall, the comprehensive level of eco-environment exhibited a fluctuating upward trend. Furthermore, the evaluation index of resource element subsystem exhibits large fluctuations in some parts, showing a general downward trend. These results indicate that the resource pressure was gradually increasing, which is consistent with the current water and land shortage in Hebei Province. Moreover, the evaluation index of the ecological pressure subsystem showed an initial decreasing trend, followed by an increase. This fluctuation was due to industrialization, urbanization, and the increase of pollutant emissions and ISP. Namely, all these factors led to the increase of ecological subsystem pressure. Fortunately, with the improvement of industrial emission reduction, consumption reduction and pollutant emission control level, the ecological pressure has been relatively reduced. Therefore, the ecological pressure index gradually increased. The evaluation index of the ecological response subsystem and ecological element subsystem showed a rising trend. It indicated that the increase of eco-environment protection investment, the implementation of pollution control measures and policies and the strengthening of urban green space construction had a positive effect on ecological element subsystems and ecological response subsystems.

3.2. Analysis of Coupling Relationship between Urbanization and Eco-Environment

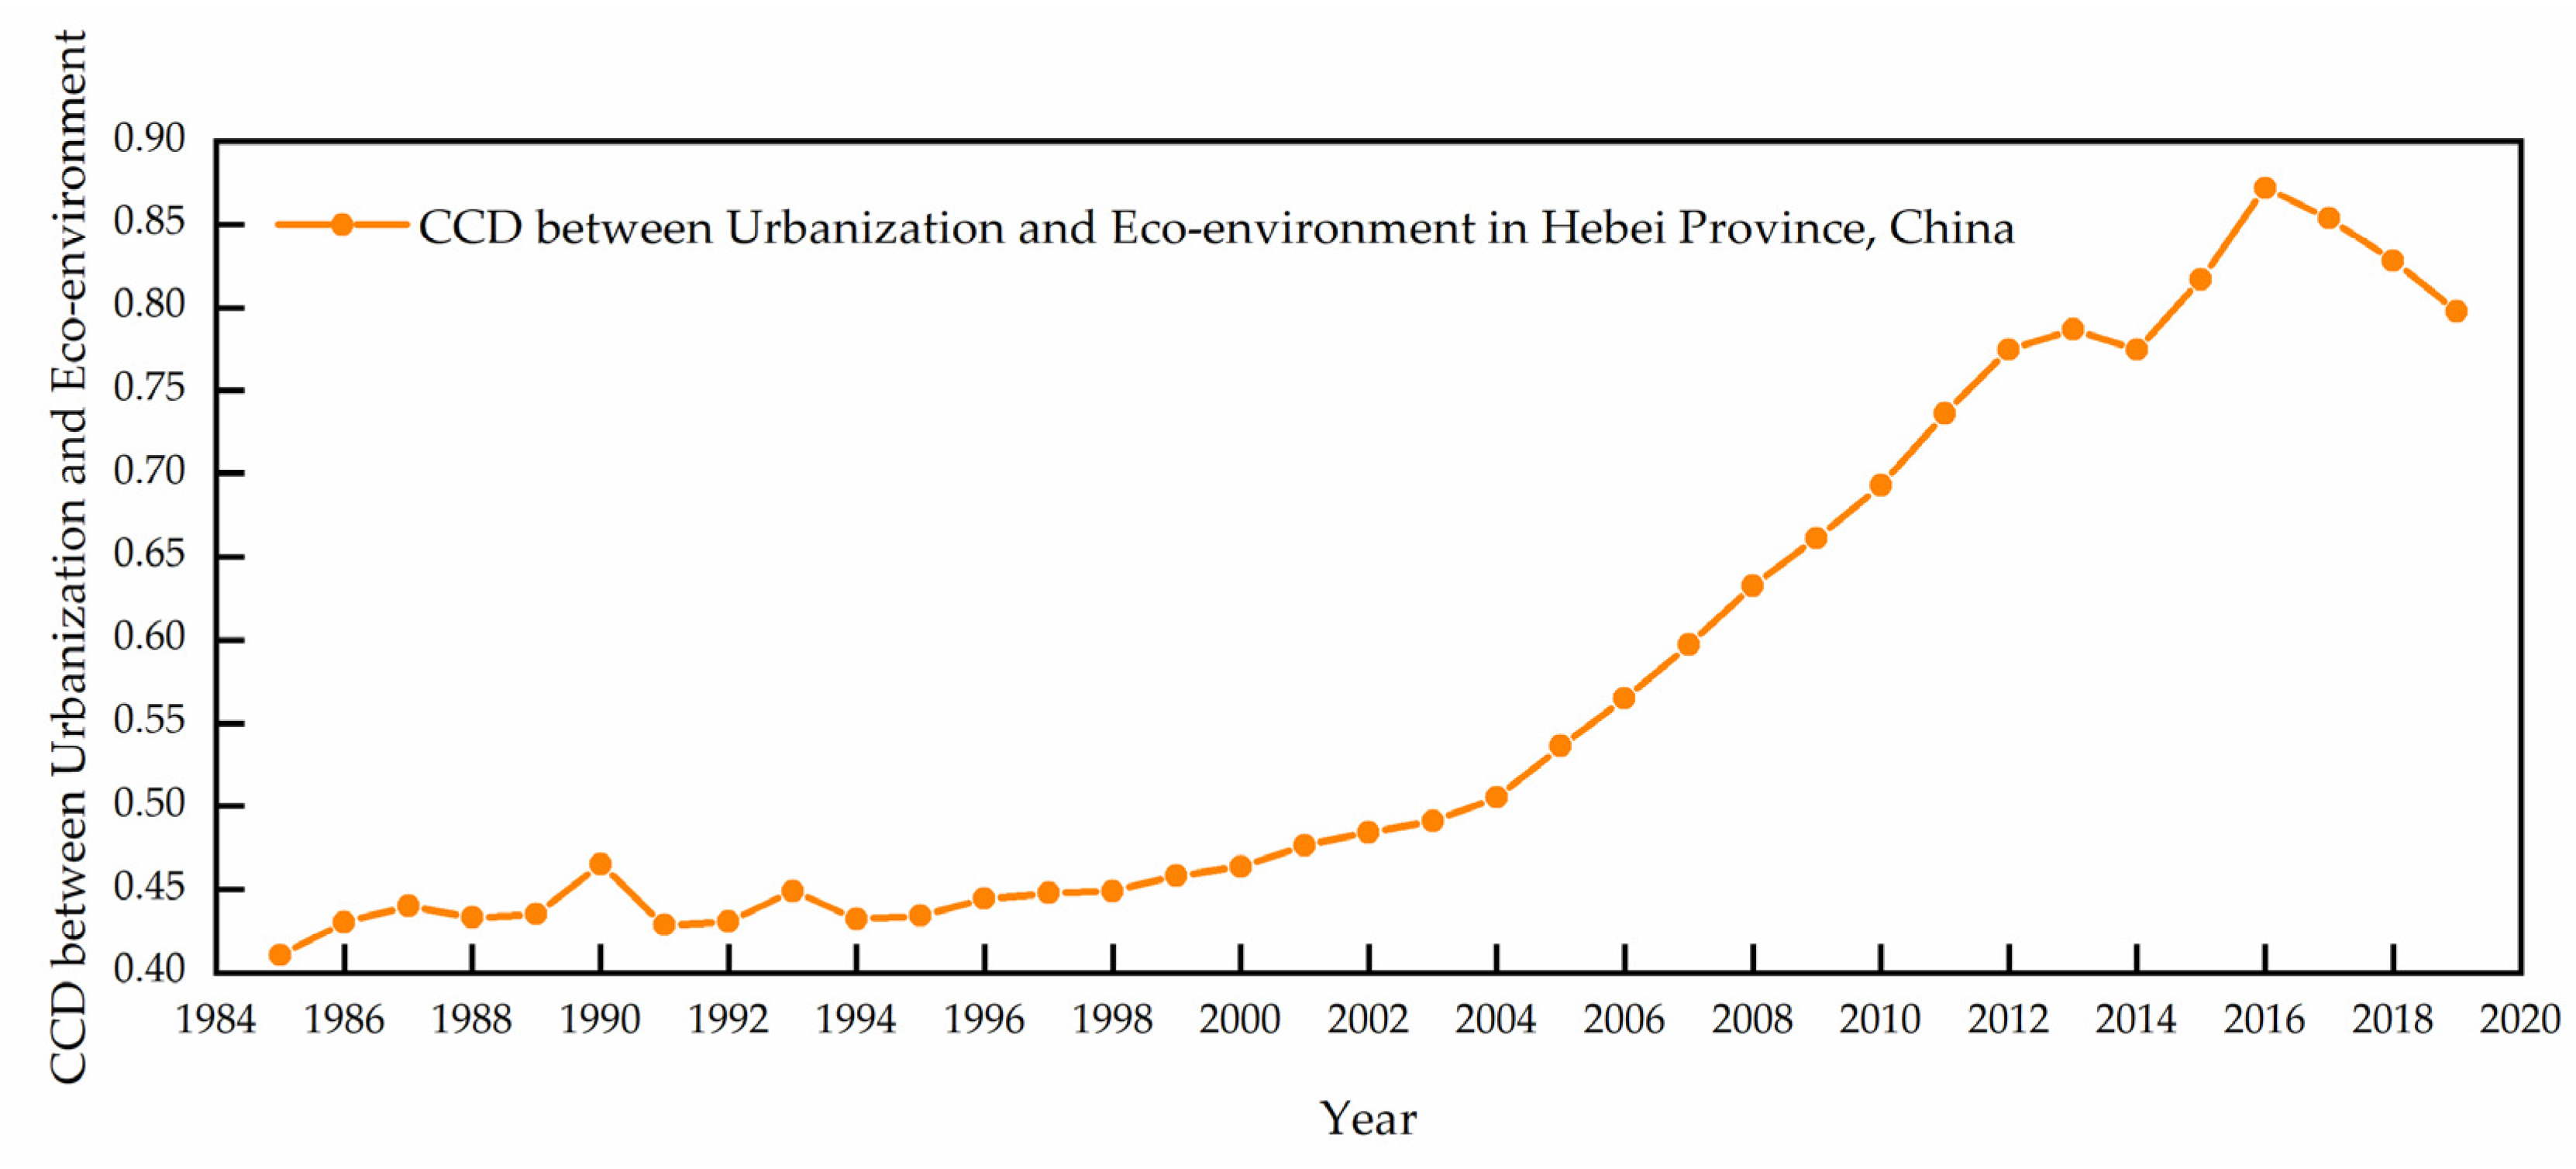
3.2.1. Analysis of Coupling Coordination Degree Change

The CCD is based on the comprehensive index of urbanization and eco-environment. It was calculated by the distance coordination coupling degree model. The results are provided in Figure 5. In general, the CCD between urbanization and eco-environment increased from 1985 to 2019. In terms of its stage, from 1985 to 2005, urbanization development was in its initial stage, and the development of urbanization is slow, while CCD between urbanization and eco-environment was low. From 2006 to 2013, urbanization development was in the rapid stage, the continuous improvement of urbanization had promoted the improvement of eco-environment to a certain extent, and the CCD rapidly increased. From 2014 to 2019, the development of urbanization was in the mature stage, while the level of urbanization had been further improved, it had a negative impact on eco-environment, and the quality of eco-environment first increased and then decreased, resulting in the same change trend of the CCD. Since 2016, the government has vigorously promoted new urbanization in Hebei Province. The urbanization speed is ahead of eco-environment construction, causing the CCD to decline.

3.2.2. Type Identification of Coupling Coordination Relation

Overall, the coordination degree between urbanization and the eco-environment in Hebei Province has continuously improved. However, it has been in the lagging stage of urbanization development for a long time (Table 5). Furthermore, the level of urbanization lags behind the level of eco-environment, the coupling coordination type (CCR) is constantly changing. From 1985 to 2003, the urbanization and eco-environment system was in the lagging stage, in the category of endangered imbalance. Between 2004 and 2006, the system was in the lagging stage again, defined this time as barely coordinated development urbanization. From 2007 to 2010, the CCR transited from the synchronous type of urbanization and eco-environment to the coordinated development type of lagging urbanization. Next, between 2011 and 2017, the urbanization and eco-environment system was in the synchronous stage of coordinated development. However, with water, soil, and other shortages, the eco-environment system lagged behind the development of the urbanization system. Finally, in 2018 and 2019, the CCR between urbanization and eco-environment shifted to the lagging type in the category of coordinated development. These changes show that urbanization in Hebei Province has advanced in recent years.

3.3. Decoupling Path of Interaction between Urbanization and Eco-Environment

The study calculated and classified the decoupling index of urbanization and eco-environment in Hebei Province from 1985 to 2019. Table 6 illustrates these results. During the research period, the state of index decoupling exhibited six states: strong decoupling, weak decoupling, negative expansion decoupling, expansion connection, negative strong decoupling, and negative weak decoupling. Furthermore, the degree of decoupling showed dynamic changes between strong and weak decoupling. In reference to the degree of decoupling, strong decoupling appeared 14 times, while other decoupling relations were recorded 20 times. The average annual growth rate of urbanization index was 0.074, making it higher than the average annual growth rate of eco-environment index (0.024). This discrepancy indicates that the growth rate of the former index is higher than that of the latter. Furthermore, in reference to the type of decoupling, the urbanization process in Hebei Province belongs to positive urbanization, while the development of urbanization and the implementation of corresponding policies have contributed positive forces to the sound development of eco-environment, and its eco-environment is gradually improved. In the initial and rapid development stages, the CCD between urbanization and eco-environment exhibited an overall upward trend, showing a positive urbanization in the decoupling type and indicating that the level of urbanization has significantly improved. Simultaneously, the level of eco-environment was also steadily improved at this stage. However, in the mature stage of urbanization, the comprehensive level of urbanization increases, while the comprehensive level of eco-environment decreases. Moreover, during this stage, the coupling and coordination degree of urbanization and eco-environment first increased and then decreased. The coupling type changed from a synchronous type to a lagging type during this stage. The number of strong decoupling was significantly higher than that of other decoupling degrees, exhibiting negative urbanization.

3.4. Symbiosis Degree Analysis of Interaction between Urbanization and Eco-Environment

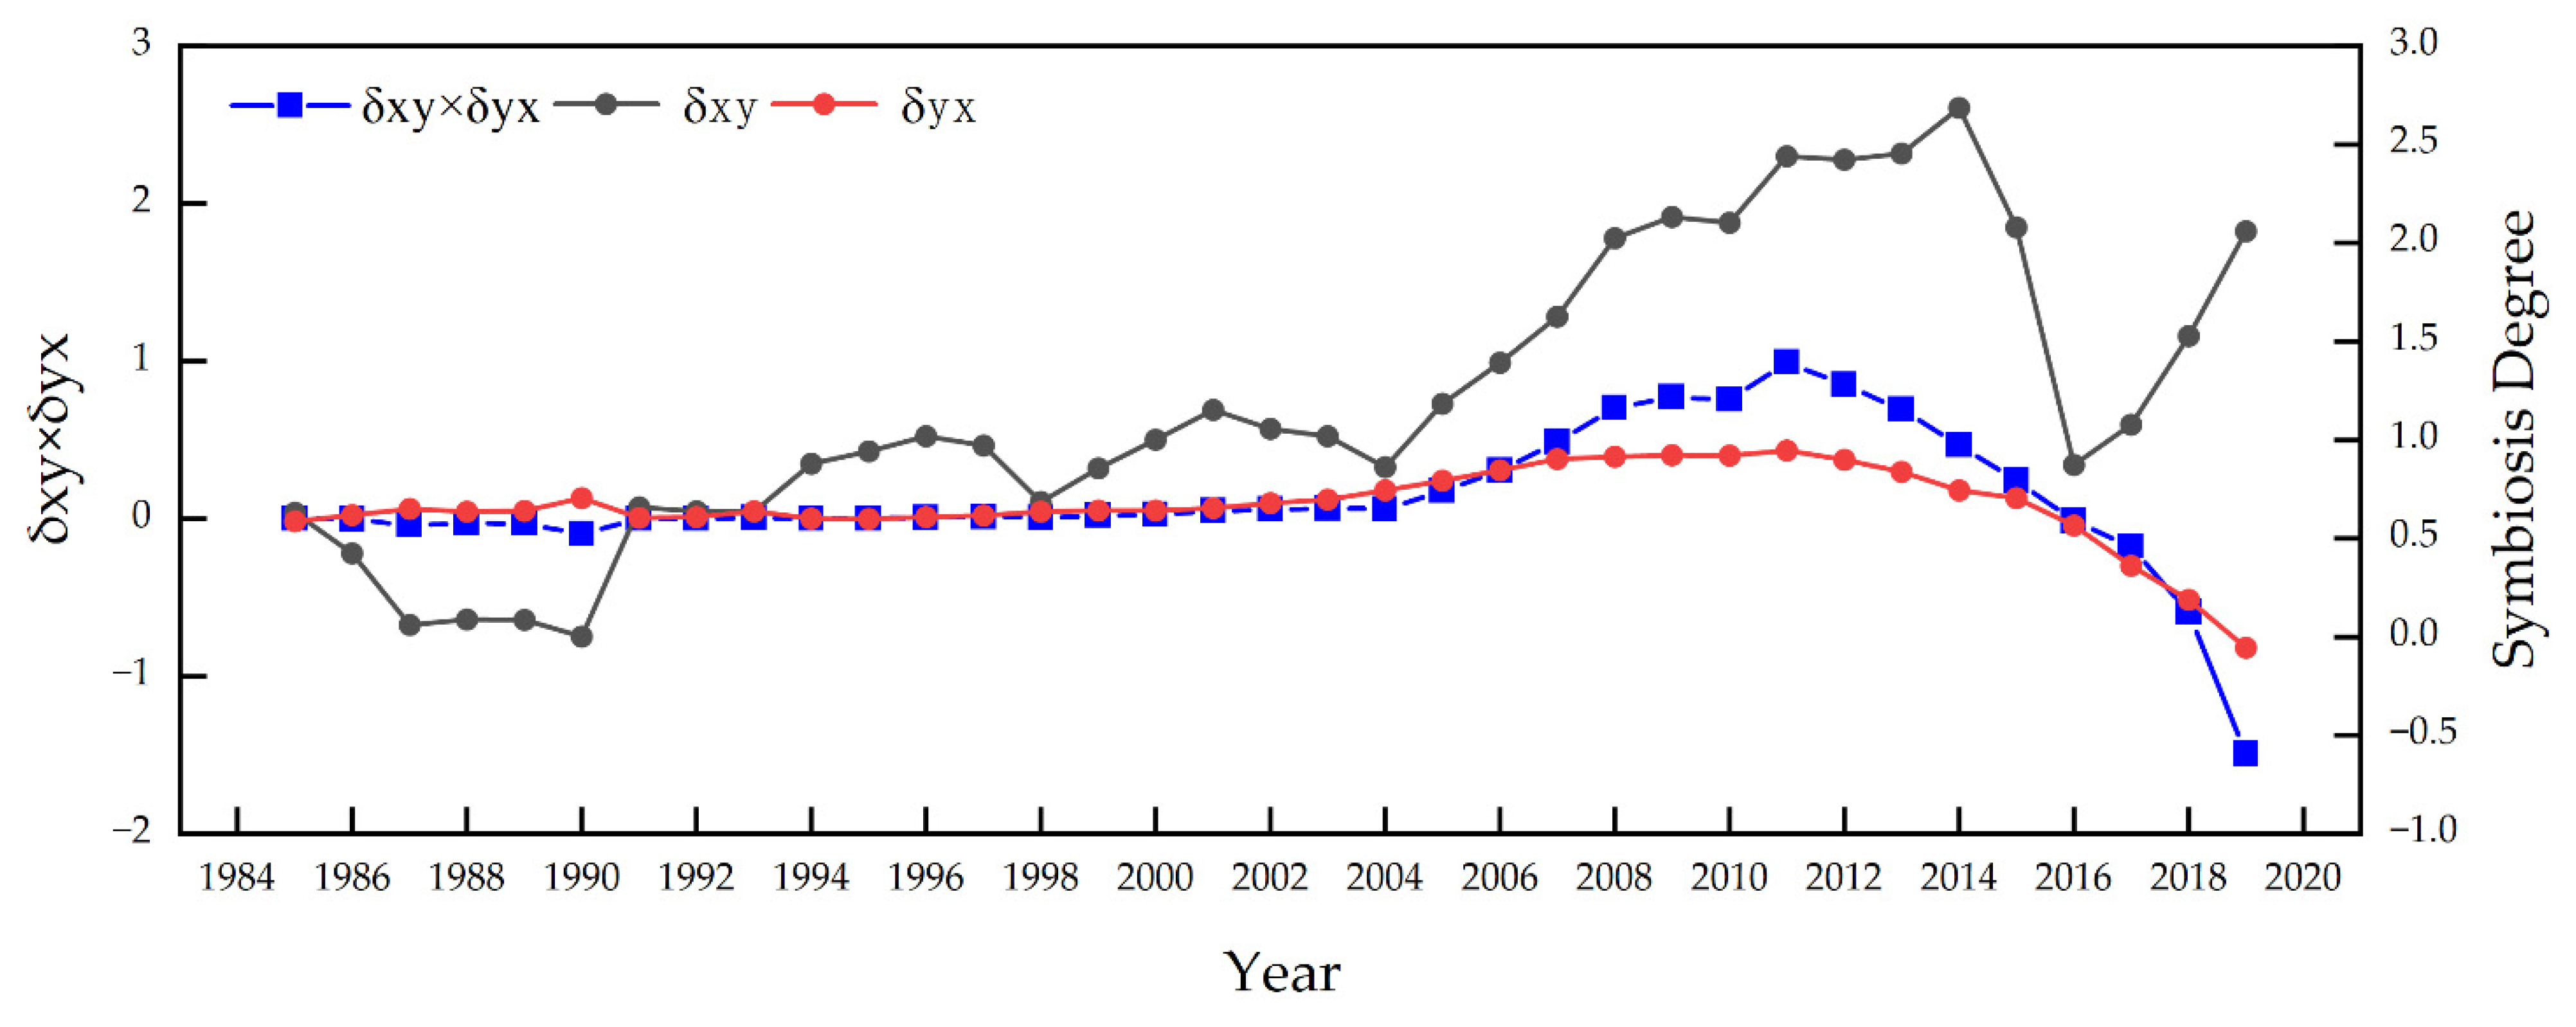
3.4.1. Analysis of Symbiosis Degree between Urbanization and Eco-Environment

As shown in Figure 6, the symbiosis degree model calculates the symbiosis degree of urbanization and eco-environment. The symbiosis degree of urbanization to eco-environment exhibits great fluctuations and shows an overall upward trend. Except for the negative values from 1986 to 1990, the symbiosis degree of urbanization to eco-environment was greater than zero. This indicates that the contribution of eco-environment to urbanization was negative, urbanization was inhibited by the eco-environment during the early period of urbanization, and after 1991, the contribution of eco-environment to urbanization was positive. Nevertheless, the eco-environment has a promoting role in urbanization. The symbiosis degree of eco-environment to urbanization shows a trend of an initial slow rise followed by a rapid decline. During the initial and rapid development stages, the symbiosis degree of eco-environment to urbanization exhibited a slow upward trend. Furthermore, this degree is mostly positive, indicating that the urbanization development promotes the improvement of the eco-environment level. During the mature stage of urbanization, the symbiotic degree shows a significant downward trend, specifically from 0.1795 in 2014 to −0.8194 in 2019. In 2016, the symbiosis degree of eco-environment to urbanization began to become negative, and the contribution of urbanization to eco-environment was negative. This shows that urbanization development between 2016 and 2019 focused on the eco-environment.

3.4.2. Pattern Recognition of Symbiosis between Urbanization and Eco-Environment

The symbiotic mode of urbanization and eco-environment in Hebei Province from 1985 to 2019 was based on the division standard of the symbiotic mode (Table 4), which are either asymmetric mutualism or parasitic mode (Table 7). In terms of the number of occurrences, the asymmetric mutual benefit symbiosis mode (24 times) was more present than the parasitic mode (11 times). Overall, urbanization and the eco-environment appear to promote each other, which is consistent with the results obtained by Wan et al. [76]. For the parasitic mode that occurred during the study period, the main performance was that the eco-environment parasitized over urbanization from 1986 to 1990, while urbanization development parasitizes over the eco-environment from 2016 to 2019. Together with the coupling, decoupling, and symbiosis analyses, during the initial stage and the rapid development stage, the coupling and coordination degree of urbanization and eco-environment exhibited an upward trend. Namely, it shows positive urbanization in the decoupling type, and mutually beneficial symbiosis in the symbiosis mode. Overall, both the urbanization level and eco-environment level have significantly improved. Within the mature stage, the CCD first increased and then decreased. The coupling type belongs to the synchronous type of coordinated development and coordinated development of the eco-environment lag type. Within the decoupling type, its type shows negative urbanization. Between 2016 and 2019, the symbiotic mode exhibited the parasitic mode. In other words, urbanization development parasitizes over the eco-environment and puts great strain on it. Finally, the coupling and coordinated development type changed from coordinated development to coordinated development of the eco-environment lag type category.

4. Discussion

In recent decades, the study on the two-way relationship between urbanization and eco-environment has never stopped at home and abroad. On the one hand, the impact of urbanization on resources and eco-environment was concerning [77]; on the other hand, the study paid attention to the constraints of land, water, energy, environmental capacity, and ecological security on the urbanization process [18]. Most scholars use mathematical models, such as the coupling coordination degree model, the grey correlation degree model, and the Tapio model, to measure the coupling coordination relationship between urbanization and eco-environment, and identify the types of coupling coordination development. For example, Zhao et al. used the improved environmental Kuznets curve (EKC) model and dynamic coordination coupling degree (CCD) model to discuss the relationship between urbanization and eco-environment in the Yangtze River Delta [73]; Tan et al. analysed the spatiotemporal changes of urbanization and eco-environment coupling types in different regions of Jilin Province by using the coupling coordination degree [78]. Of course, some scholars have discussed the relationship between urbanization and eco-environment from the single dimension of decoupling [39] or the two dimensions of coupling and decoupling [64]. However, at different stages of urbanization, the relationship between urbanization and eco-environment and the extent of their impact on each other have not been clearly answered, and the research on the relationship between urbanization and eco-environment from the two dimensions of coupling and decoupling has not been deep enough. Compared with existing studies, we used the standardized value of urbanization comprehensive evaluation index to replace population urbanization rate to improve the northern curve, which divided the urbanization of Hebei Province into three stages. On this basis, on the one hand, we put forward the hypothesis of symbiosis between urbanization and eco-environment, on the other hand, from the two dimensions of coupling and decoupling, the interaction between urbanization and eco-environment was discussed quantitatively in the whole process. At the same time, using the hypothesis of urbanization and eco-environment symbiosis to decouple, the decoupling method is innovative. To some extent, the study revealed the interaction relationship and the influence degree between urbanization and eco-environment in different stages of urbanization development. The results provided references for the harmonious development of urbanization and eco-environment in Hebei Province, and expanded the research methods and ideas of the relationship between urbanization and eco-environment.
The results indicate that the CCD between urbanization and eco-environment is on the rise in Hebei Province, and the urbanization process is a positive trend. Urbanization and eco-environment are reinforcing each other in Hebei Province. In addition, the eco-environment contributes more to the development of urbanization. However, due to rapid population urbanization and resource shortage, the main cause of the CCD decrease is the decrease of the evaluation index of the resource factor subsystem. The most obvious cause is the substantial decrease of the total available water resources per capita. This indicates that the water resource shortage has become one of the main factors restricting the coordinated development of urbanization and the eco-environment. Therefore, the government should work to optimize the provincial industrial and planting structure, rationally allocate water resources, implement water-saving measures, strengthen the utilization of recycled water, and improve the utilization efficiency of water resources. At the same time, it is necessary to consider the relationship between urbanization speed and urbanization quality in Hebei Province, and it is necessary to clarify the main problems the eco-environment is facing. The government should adhere to the problem and policy guidance by implementing measures from the aspects of water, soil, air, and eco-environmental protection. Furthermore, the eco-environment capacity should be expanded and the carrying capacity should be improved.
This study comprehensively used various models to identify that the shortage of water resources was the main limiting factor affecting the coordinated development of urbanization and eco-environment from the macro level. However, there was no detailed analysis of how water resources factors affect socio-economic factors, population factors and ecological factors, which made it difficult for us to put forward reasonable suggestions. System dynamics takes simulation technology as a means and combines qualitative and quantitative methods to analyse and study the internal feedback mechanism of complex systems, which can be used for the action relationship between the elements of different subsystems. This is also the way for us to explore the action relationship of the elements between urbanization and eco-environment in the next step.

5. Conclusions

Based on 35 years of panel data and a comprehensive evaluation index system, this study quantitatively examined the urbanization process and interaction between urbanization and the eco-environment in Hebei Province, China by employing the distance coordination coupling model, the Tapio decoupling model, and the symbiosis model, and verified the SHUE. The paper realized the whole process analysis of the interaction between urbanization and the eco-environment from two dimensions: coupling and decoupling. The following conclusions were obtained:
(i)
The comprehensive evaluation index of urbanization appears to be on the rise in Hebei Province. The improved ‘Northam curve’ equation satisfied the logistic equation, with the urbanization process presenting an inverted S-shaped curve in the province. Hebei Province has been actively promoting urbanization and has achieved remarkable results. Namely, its comprehensive evaluation index of urbanization has significantly improved. Furthermore, the overall level of the eco-environment also exhibited a fluctuating upward trend in the province. However, after 2016, the comprehensive evaluation index of the eco-environment declined. More specifically, during rapid urbanization, the ownership of per capita resources decreased, reducing the evaluation index of resources and the resource factor subsystem. These changes then further affect the comprehensive evaluation index of the eco-environment system.
(ii)
Overall, the CCD of urbanization and eco-environment had an upward trend, with visible phased changes. In the initial stage of urbanization, the CCD was low. Conversely, in the stage of rapid development, the CCD rapidly increased and reached its peak during the mature stage after which it decreased. With respect to coordination type, it shifted from the endangered imbalance type to the coordinated development type during the study period. However, in the mature stage of urbanization, the type of coordination gradually changed from the synchronous type to the lagging type. The level of urbanization was advanced, and the eco-environment pressure was gradually increasing.
(iii)
The degree of decoupling between urbanization and the eco-environment was evident in the dynamic changes of six states of strong and weak decoupling, including 14 strong decoupling relationships and 20 other decoupling relationships. During the study period, the urbanization process exhibited a positive type of urbanization, while the eco-environment gradually improved. With respect to the coupling and decoupling process, the level of urbanization significantly improved in the initial and rapid development stage of urbanization. In turn, this led to a steady improvement in the level of the eco-environment, with the positive effect of urbanization was significantly evident. During the mature stage of urbanization, the CCD initially increased and then decreased, with the number of strong decoupling being significantly higher than that of other decoupling degrees. These results point to a negative effect between urbanization and eco-environment.
(iv)
The results of this study verified SHUE. Namely, during the study period, the symbiosis mode of urbanization and eco-environment displayed the asymmetric mutualism mode and the parasitic mode. It also presented the fluctuation change of interaction. Furthermore, the number of asymmetric mutualism modes was higher than that of parasitic mode. Thus, the overall mutual contribution between urbanization and the eco-environment was positive, with the two demonstrating mutual promotion and mutualism. However, between 2016 and 2019, the symbiotic mode was parasitic. The development of urbanization placed stress on the eco-environment, which was consistent with the decreased CCD observed between them, the transformation from the coordination type to the lag type, and the increase in strong decoupling.

Author Contributions

H.W. and A.Z. participated in the design of this study. H.W. and A.Z. wrote the text. H.W. and Y.C. reviewed and edited the manuscript. Y.X. collected data. A.Z. and L.G. processed the relevant data. A.Z. drew diagrams. All authors have read and agreed to the published version of the manuscript.

Funding

This research was funded by Humanities & Social Sciences Youth Fund of Ministry of Education of China (No. 19YJCZH155) and Key Project of Educational Commission of Hebei Province of China (No. ZD2020312).

Institutional Review Board Statement

Not applicable.

Informed Consent Statement

Not applicable.

Data Availability Statement

The data presented in this study are available on request from the corresponding author.

Conflicts of Interest

The authors declare no conflict of interest.

References

  1. Luo, K.; Hu, X.B.; He, Q.; Wu, Z.; Cheng, H.; Hu, Z.; Mazumder, A. Impacts of rapid urbanization on the water quality and macroinvertebrate communities of streams: A case study in Liangjiang New Area, China. Sci. Total Environ. 2018, 621, 1601–1614. [Google Scholar] [CrossRef] [PubMed]
  2. Ouyang, X.; Lin, B. Carbon dioxide (CO2) emissions during urbanization: A comparative study between China and Japan. J. Clean. Prod. 2017, 143, 356–368. [Google Scholar] [CrossRef]
  3. Pacheco-Torres, R.; Roldán, J.; Gago, E.; Ordóñez, J. Assessing the relationship between urban planning options and carbon emissions at the use stage of new urbanized areas: A case study in a warm climate location. Energy Build. 2017, 136, 73–85. [Google Scholar] [CrossRef]
  4. Fang, C.L.; Ren, Y.F. Analysis of emergy-based metabolic efficiency and environmental pressure on the local coupling and telecoupling between urbanization and the eco-environment in the Beijing-Tianjin-Hebei urban agglomeration. Sci. China Earth Sci. 2017, 60, 1083–1097. [Google Scholar] [CrossRef]
  5. Uttara, S.; Bhuvandas, N.; Aggarwal, V. Impacts of urbanization on environment. Int. J. Res. Eng. Appl. Sci. 2012, 2, 1637–1645. [Google Scholar]
  6. Lowry, I.S. A Model of Metropolis; RAND Corporation: Santa Monica, CA, USA, 1964; pp. 8–18. [Google Scholar]
  7. Wilson, A.G. Urban and Regional Models in Geography and Planning; John Wiley & Sons: London, UK, 1974. [Google Scholar]
  8. Northam, R.M. Urban Geography; John Wiley & Sons: New York, NY, USA, 1975. [Google Scholar]
  9. Chen, M.; Zhang, H.; Liu, W.; Zhang, W. The Global Pattern of Urbanization and Economic Growth: Evidence from the Last Three Decades. PLoS ONE 2014, 9, e103799. [Google Scholar] [CrossRef] [Green Version]
  10. Molaei Qelichi, M.; Murgante, B.; Feshki, M.Y.; Zarghamfard, M. Urbanization patterns in Iran visualized through spatial auto-correlation analysis. Spat. Inf. Res. 2017, 25, 627–633. [Google Scholar] [CrossRef]
  11. Seto, K.C.; Parnell, S.; Elmqvist, T. A global outlook on urbanization. In Urbanization, Biodiversity and Ecosystem Services: Challenges and Opportunities; Springer: Dordrecht, The Netherlands, 2013; pp. 1–12. [Google Scholar]
  12. Harvey, D. Cities or urbanization? City 1996, 1, 38–61. [Google Scholar] [CrossRef]
  13. Fang, C.L.; Zhou, C.H.; Gu, C.L.; Chen, L.D.; Li, S.C. Theoretical analysis of interactive coupled effects between urbanization and eco-environment in mega-urban agglomerations. Acta Geogr. Sin. 2016, 71, 531–550. (In Chinese) [Google Scholar] [CrossRef]
  14. Grossman, G.M.; Krueger, A.B. Economic Growth and the Environment. Q. J. Econ. 1995, 110, 353–377. [Google Scholar] [CrossRef] [Green Version]
  15. Stern, D.I.; Common, M.S.; Barbier, E.B. Economic growth and environmental degradation: The environmental Kuznets curve and sustainable development. World Dev. 1996, 24, 1151–1160. [Google Scholar] [CrossRef]
  16. Delphin, S.; Escobedo, F.J.; Abd-Elrahman, A.; Cropper, W. Urbanization as a land use change driver of forest ecosystem services. Land Use Policy 2016, 54, 188–199. [Google Scholar] [CrossRef] [Green Version]
  17. Miller, J.D.; Hutchins, M. The impacts of urbanisation and climate change on urban flooding and urban water quality: A review of the evidence concerning the United Kingdom. J. Hydrol. Reg. Stud. 2017, 12, 345–362. [Google Scholar] [CrossRef] [Green Version]
  18. Pham, V.-M.; Van Nghiem, S.V.; Bui, Q.-T.; Pham, T.; Van Pham, C. Quantitative assessment of urbanization and impacts in the complex of Huế Monuments, Vietnam. Appl. Geogr. 2019, 112, 102096. [Google Scholar] [CrossRef]
  19. Juntti, M.; Costa, H.; Nascimento, N. Urban environmental quality and wellbeing in the context of incomplete urbanisation in Brazil: Integrating directly experienced ecosystem services into planning. Prog. Plan. 2019, 143, 100433. [Google Scholar] [CrossRef]
  20. Sun, C.; Zhang, S.; Song, C.; Xu, J.; Fan, F. Investigation of Dynamic Coupling Coordination between Urbanization and the Eco-Environment—A Case Study in the Pearl River Delta Area. Land 2021, 10, 190. [Google Scholar] [CrossRef]
  21. Lin, X.; Lu, C.; Song, K.; Su, Y.; Lei, Y.; Zhong, L.; Gao, Y. Analysis of Coupling Coordination Variance between Urbanization Quality and Eco-Environment Pressure: A Case Study of the West Taiwan Strait Urban Agglomeration, China. Sustainability 2020, 12, 2643. [Google Scholar] [CrossRef] [Green Version]
  22. Huang, J.C.; Fang, C.L. Analysis of coupling mechanism and rules between urbanization and eco-environment. Geo-Graph. Res. 2003, 22, 211–220. (In Chinese) [Google Scholar] [CrossRef]
  23. Liu, Y.B.; Li, R.D.; Song, X.F. Grey Associative Analysis of Regional Urbanization and Eco- environment Coupling in China. Acta Geogr. Sin. 2005, 60, 237–247. [Google Scholar] [CrossRef]
  24. Wang, J.; Zhao, M.; Zhong, W.; Li, J.; Zheng, C. Coupling Relationship of Urban Development and the Eco-Environment in Guanzhong Region, China. Sustainability 2022, 14, 2969. [Google Scholar] [CrossRef]
  25. Wang, S.J.; Fang, C.L.; Wang, Y.; Huang, Y.; Ma, H. Quantifying the relationship between urban development intensity and carbon dioxide emissions using a panel data analysis. Ecol. Indic. 2015, 49, 121–131. [Google Scholar] [CrossRef]
  26. Astaraie-Imani, M.; Kapelan, Z.; Fu, G.; Butler, D. Assessing the combined effects of urbanisation and climate change on the river water quality in an integrated urban wastewater system in the UK. J. Environ. Manag. 2012, 112, 1–9. [Google Scholar] [CrossRef]
  27. Enloe, H.A.; Lockaby, B.G.; Zipperer, W.C.; Somers, G.L. Urbanization effects on soil nitrogen transformations and microbial biomass in the subtropics. Urban Ecosyst. 2015, 18, 963–976. [Google Scholar] [CrossRef]
  28. Fang, C.-L.; Bao, C.; Huang, J.-C. Management Implications to Water Resources Constraint Force on Socio-economic System in Rapid Urbanization: A Case Study of the Hexi Corridor, NW China. Water Resour. Manag. 2007, 21, 1613–1633. [Google Scholar] [CrossRef] [Green Version]
  29. Fujii, H.; Managi, S. Economic development and multiple air pollutant emissions from the industrial sector. Environ. Sci. Pollut. Res. 2016, 23, 2802–2812. [Google Scholar] [CrossRef] [PubMed]
  30. Wang, S.J.; Li, Q.Y.; Fang, C.; Zhou, C. The relationship between economic growth, energy consumption, and CO2 emissions: Empirical evidence from China. Sci. Total Environ. 2016, 542, 360–371. [Google Scholar] [CrossRef] [PubMed]
  31. Wei, Y.-L.; Bao, L.-J.; Wu, C.-C.; He, Z.-C.; Zeng, E.Y. Assessing the effects of urbanization on the environment with soil legacy and current-use insecticides: A case study in the Pearl River Delta, China. Sci. Total Environ. 2015, 514, 409–417. [Google Scholar] [CrossRef] [PubMed]
  32. Ding, L.; Zhao, W.T.; Huang, Y.; Cheng, S.; Liu, C. Research on the Coupling Coordination Relationship between Urbanization and the Air Environment: A Case Study of the Area of Wuhan. Atmosphere 2015, 6, 1539–1558. [Google Scholar] [CrossRef] [Green Version]
  33. Li, Y.F.; Li, Y.; Zhou, Y.; Shi, Y.; Zhu, X. Investigation of a coupling model of coordination between urbanization and the environment. J. Environ. Manag. 2012, 98, 127–133. [Google Scholar] [CrossRef]
  34. Liu, Y.B.; Yao, C.S.; Wang, G.; Bao, S. An integrated sustainable development approach to modeling the eco-environmental effects from urbanization. Ecol. Indic. 2011, 11, 1599–1608. [Google Scholar] [CrossRef]
  35. Rojas, C.; Meulder, B.D.; Shannon, K. Water urbanism in Bogotá. Exploring the potentials of an interplay between settlement patterns and water management. Habitat Int. 2015, 48, 177–187. [Google Scholar] [CrossRef]
  36. Fang, C.L.; Cui, X.G.; Li, G.; Bao, C.; Wang, Z.; Ma, H.; Sun, S.; Liu, H.; Luo, K.; Ren, Y. Modeling regional sustainable development scenarios using the Urbanization and Eco-environment Coupler: Case study of Beijing-Tianjin-Hebei urban agglomeration, China. Sci. Total Environ. 2019, 689, 820–830. [Google Scholar] [CrossRef] [PubMed]
  37. Zhang, Y.; Yang, Q.Y.; Min, J. An analysis of coupling between the bearing capacity of the eco-environment and the quality of new urbanization in Chongqing. Acta Geogr. Sin. 2016, 71, 817–828. (In Chinese) [Google Scholar] [CrossRef]
  38. Wang, S.J.; Cui, Z.T.; Lin, J.; Xie, J.; Su, K. Coupling relationship between urbanization and ecological resilience in the Pearl River Delta. Acta Geogr. Sin. 2021, 76, 973–991. (In Chinese) [Google Scholar] [CrossRef]
  39. Cai, J.; Li, X.P.; Liu, L.; Chen, Y.; Wang, X.; Lu, S. Coupling and coordinated development of new urbanization and agro-ecological environment in China. Sci. Total Environ. 2021, 776, 145837. [Google Scholar] [CrossRef]
  40. Li, W.J.; Wang, Y.; Xie, S.; Cheng, X. Coupling coordination analysis and spatiotemporal heterogeneity between urbanization and ecosystem health in Chongqing municipality, China. Sci. Total Environ. 2021, 791, 148311. [Google Scholar] [CrossRef] [PubMed]
  41. Hurst, C.J. Discovering the Symbiotic Nature of Microbial Life: Summarizing Milestone Publications from 1866 through 1947. Adv. Environ. Microbiol. 2021, 8, 213–241. [Google Scholar] [CrossRef]
  42. Zhang, Z.G.; Liao, B.; Wu, L.; Liu, C.X.; Xu, Y.; Li, H.R.; Wu, Y.Z.; Yu, X.; Zhang, W.; Zhang, H.; et al. Ecological Civilization and Ecological Security; China Environment Publishing: Beijing, China, 2019. [Google Scholar]
  43. Sakanaka, M.; Hansen, M.E.; Gotoh, A.; Katoh, T.; Yoshida, K.; Odamaki, T.; Yachi, H.; Sugiyama, Y.; Kurihara, S.; Hirose, J.; et al. Evolutionary adaptation in fucosyllactose uptake systems supports bifidobacteria-infant symbiosis. Sci. Adv. 2019, 5, eaaw7696. [Google Scholar] [CrossRef] [Green Version]
  44. Thompson, A.W.; Foster, R.A.; Krupke, A.; Carter, B.J.; Musat, N.; Vaulot, D.; Kuypers, M.M.M.; Zehr, J.P. Unicellular Cyanobacterium Symbiotic with a Single-Celled Eukaryotic Alga. Science 2012, 337, 1546–1550. [Google Scholar] [CrossRef]
  45. Delaux, P.-M.; Schornack, S. Plant evolution driven by interactions with symbiotic and pathogenic microbes. Science 2021, 371, eaba6531. [Google Scholar] [CrossRef]
  46. Griesmann, M.; Chang, Y.; Liu, X.; Song, Y.; Haberer, G.; Crook, M.B.; Billault-Penneteau, B.; Lauressergues, D.; Keller, J.; Imanishi, L.; et al. Phylogenomics reveals multiple losses of nitrogen-fixing root nodule symbiosis. Science 2018, 361, eaat1743. [Google Scholar] [CrossRef] [PubMed] [Green Version]
  47. Gutjahr, C.; Gobbato, E.; Choi, J.; Riemann, M.; Johnston, M.G.; Summers, M.; Carbonnel, S.; Mansfield, C.; Yang, S.Y.; Nadal, M.; et al. Rice perception of symbiotic arbuscular mycorrhizal fungi requires the karrikin receptor complex. Science 2015, 350, 1521–1524. [Google Scholar] [CrossRef] [PubMed]
  48. Wang, Y.; Xie, Y.J.; Qi, L.; He, Y.; Bo, H. Synergies evaluation and influencing factors analysis of the water–energy–food nexus from symbiosis perspective: A case study in the Beijing–Tianjin–Hebei region. Sci. Total Environ. 2022, 818, 151731. [Google Scholar] [CrossRef] [PubMed]
  49. Wang, S.J.; Ma, H.T.; Zhao, Y. Exploring the relationship between urbanization and the eco-environment—A case study of Beijing–Tianjin–Hebei region. Ecol. Indic. 2014, 45, 171–183. [Google Scholar] [CrossRef]
  50. Li, M.; Mao, C. Spatial-Temporal Variance of Coupling Relationship between Population Modernization and Eco-Environment in Beijing-Tianjin-Hebei. Sustainability 2019, 11, 991. [Google Scholar] [CrossRef] [Green Version]
  51. Sun, X.; Zhang, Z. Coupling and Coordination Level of the Population, Land, Economy, Ecology and Society in the Process of Urbanization: Measurement and Spatial Differentiation. Sustainability 2021, 13, 3171. [Google Scholar] [CrossRef]
  52. Ren, F.; Yu, X. Coupling analysis of urbanization and ecological total factor energy efficiency—A case study from Hebei province in China. Sustain. Cities Soc. 2021, 74, 103183. [Google Scholar] [CrossRef]
  53. Zhang, C.L.; Du, L.J.; Ma, J.S. Research on Quality Evaluation of New-type Urbanization of County Territory. J. Hebei Univ. Econ. Trade 2019, 40, 102–108. (In Chinese) [Google Scholar] [CrossRef]
  54. Liu, Y.M.; Tian, M.; Yang, Y.J. Research on the Model and Characteristics of In Situ Urbanization: A Case Study of Four Villages in Hebei Province. Urban Dev. Res. 2021, 28, 10–16. (In Chinese) [Google Scholar]
  55. National Bureau of Statistics of China. China Statistical Yearbook 1986–2020; Chinese Statistics Press: Beijing, China, 2020. [Google Scholar]
  56. National Bureau of Statistics of China. China Urban Statistics Yearbook 1986–2020; Chinese Statistics Press: Beijing, China, 2020. [Google Scholar]
  57. National Bureau of Statistics of China. Hebei Statistical Book 2020; Chinese Statistics Press: Beijing, China, 2020. [Google Scholar]
  58. National Bureau of Statistics of China. Hebei Economic Yearbook 1986–2019; Chinese Statistics Press: Beijing, China, 2019. [Google Scholar]
  59. Gong, P.; Li, X.; Wang, J.; Bai, Y.; Chen, B.; Hu, T.; Liu, X.; Xu, B.; Yang, J.; Zhang, W.; et al. Annual maps of global artificial impervious area (GAIA) between 1985 and 2018. Remote Sens. Environ. 2019, 236, 111510. [Google Scholar] [CrossRef]
  60. Dong, S.C.; Zheng, J.; Li, Y.; Li, Z.; Li, F.; Jin, L.; Yang, Y.; Bilgaev, A. Quantitative Analysis of the Coupling Coordination Degree Between Urbanization and Eco-environment in Mongolia. Chin. Geogr. Sci. 2019, 29, 861–871. [Google Scholar] [CrossRef] [Green Version]
  61. Wang, S.J.; Fang, C.L.; Wang, Y. Quantitative investigation of the interactive coupling relationship between urbanization and eco-environment. Acta Ecol. Sin. 2015, 35, 2244–2254. (In Chinese) [Google Scholar] [CrossRef] [Green Version]
  62. American Association for the Advancement of Science. Rise of the City. Science 2016, 352, 906–907. [Google Scholar] [CrossRef]
  63. Liu, X.L.; Guo, P.B.; Yue, X.; Zhong, S.; Cao, X. Urban transition in China: Examining the coordination between urbanization and the eco-environment using a multi-model evaluation method. Ecol. Indic. 2021, 130, 108056. [Google Scholar] [CrossRef]
  64. Feng, Y.X.; Li, G.D. Interaction between urbanization and eco-environment in the Tibetan Plateau. J. Geogr. Sci. 2020, 75, 1386–1405. (In Chinese) [Google Scholar] [CrossRef]
  65. Liang, L.W.; Wang, Z.B.; Sun, Z. Spatiotemporal differentiation and coordinated development pattern of urbanization and the eco-environment of the Beijing-Tianjin-Hebei urban agglomeration. Acta Ecol. Sin. 2019, 39, 1212–1225. (In Chinese) [Google Scholar] [CrossRef]
  66. Tang, L.; Li, J.P.; Yu, L.A.; Tan, D.H. Quantitative evaluation methodology for system coordination development based on distance coor-dination degree model. Syst. Eng.-Theory Pract. 2010, 30, 594–602. (In Chinese) [Google Scholar]
  67. Liao, C.B. Quantitative Judgement and Classification System for Coordinated Development of Environment and Economy—A Case Study of the City Group in the Pearl River Delta. Trop. Geogr. 1999, 19, 76–82. (In Chinese) [Google Scholar]
  68. Huang, J.C.; Na, Y.; Guo, Y. Spatiotemporal characteristics and driving mechanism of the coupling coordination degree of urbanization and ecological environment in Kazakhstan. J. Geogr. Sci. 2020, 30, 1802–1824. [Google Scholar] [CrossRef]
  69. Guo, S.S.; Chen, M.X.; Liu, H. Coupling procedure and decoupling analysis of urbanization and resource environment: The study of Beijing. Geogr. Res. 2018, 37, 1599–1608. [Google Scholar] [CrossRef]
  70. Wang, J.; Li, Z.G.; Gu, J.J. Decoupling analysis between energy consumption and economic growth in BRICS countries: Based on Tapio decoupling and LMDI model analysis. World Reg. Stud. 2021, 30, 501–508. [Google Scholar]
  71. Tapio, P. Towards a theory of decoupling: Degrees of decoupling in the EU and the case of road traffic in Finland between 1970 and 2001. Transp. Policy 2005, 12, 137–151. [Google Scholar] [CrossRef] [Green Version]
  72. Zhao, Y.B.; Wang, S.J.; Zhou, C. Understanding the relation between urbanization and the eco-environment in China's Yangtze River Delta using an improved EKC model and coupling analysis. Sci. Total Environ. 2016, 571, 862–875. [Google Scholar] [CrossRef] [PubMed]
  73. Yuan, C.Q. Symbiosis theory and its application to small economy (Part II). Reform 1998, 3, 76–86. (In Chinese) [Google Scholar]
  74. Yuan, C.Q. Symbiosis theory and its application to small economy (Part I). Reform 1998, 2, 101–105. (In Chinese) [Google Scholar]
  75. Yuan, C.Q. Harmony and Symbiosis; Social Sicences Academic Press (China): Beijing, China, 2008. [Google Scholar]
  76. Wan, G.H.; Wang, C. Unprecedented Urbanisation in Asia and Its Impacts on the Environment. Aust. Econ. Rev. 2014, 47, 378–385. [Google Scholar] [CrossRef]
  77. Marco, A.; Luigi, C.; Francesco, C.; Sergio, U. Environmental driving forces of urban growth and development: An emergy-based assessment of the city of Rome, Italy. Landsc. Urban Plan. 2009, 93, 238–249. [Google Scholar] [CrossRef]
  78. Tan, J.T.; Zhang, P.Y.; Li, J.; Liu, S.W. Spatial-temporal evolution characteristic of coordination between urbanization and eco-environment in Jilin Province, Northeast China. J. Appl. Ecol. 2015, 26, 3827. [Google Scholar]
Figure 1. Distribution of ISP in Hebei Province, China.
Sustainability 14 09214 g001
Figure 2. Analysis Framework of Interaction between Urbanization and Eco-environment.
Sustainability 14 09214 g002
Figure 3. The improved ‘Northam curve’ of urbanization level from 1985 to 2019 in Hebei Province, China.
Sustainability 14 09214 g003
Figure 4. Comprehensive Eco-Environment Level in Hebei Province, China.
Sustainability 14 09214 g004
Figure 5. CCD between Urbanization and Eco-environment from 1985 to 2019 in Hebei Province, China.
Sustainability 14 09214 g005
Figure 6. Symbiosis Degree between Urbanization and Eco-environment from 1985 to 2019 in Hebei Province, China.
Sustainability 14 09214 g006
Table 1. Index System and Weight of Urbanization and Eco-environment.
SystemFirst Grade
Indicator
Weight CalculationBasic Grade IndicatorIndex Calculation
EMAHPCWEMAHPCW
UrbanizationPopulation0.1620.1230.142Urban Population Proportion0.3760.5520.463
Natural Growth Rate of Population0.6240.4480.537
Economy0.3970.3880.394Gross Regional Product Per Capita0.3050.4700.419
The Proportion of Second and Third Industries in GDP0.0700.2800.154
The Proportion of Fiscal Revenue in Regional GDP0.1620.1140.150
The Total Investment in Fixed Assets of the whole Society0.4630.1360.277
Space0.0590.1010.077Urban Built-up Area Per Capita111
Society0.3820.3880.387Disposable Urban Income Per Capita0.2980.5500.418
Number of Hospital Beds Per 10,000 People0.3410.2100.277
Total Retail Sales of Consumer Goods0.3610.2400.305
Eco-environmentResource Element0.2200.1700.198Total Available Water Resource Per Capita (+)0.3810.5500.484
Arable Land Per Capita (+)0.2230.3300.286
Total Food Production Per Capita (+)0.3960.1200.230
Ecological Element0.2760.4600.365Green Coverage Rate of Built District (+)0.2220.3700.292
Green Area Per Capita (+)0.4660.3000.381
Percentage of Forest Cover (+)0.3120.3300.327
Ecological Pressure0.2500.2700.266Industrial Wastewater Discharge Per Capita (-)0.2240.2500.242
SO2 Emissions Per Capita (-)0.3630.4800.427
Industrial Waste Production Per Capita (-)0.2050.0700.123
ISP (-)0.2080.2000.208
Ecological Response0.2540.1100.171Comprehensive Utilization Rate of Industrial Solid Waste (+)0.1920.3600.272
Urban Sewage Treatment Rate (+)0.4280.4600.458
Hazard-free treatment ratio for home refuse (+)0.3800.1800.270
Note that ‘+’ represents the positive indicator, while ‘-’ represents the negative indicator. EM, AHP and CW represent the entropy method, analytic hierarchy process and the comprehensive weight, respectively.
Table 2. Classification Criteria for Coordinated Development of Urbanization and Eco-environment.
CategoryCCDSubcategory Comparison   between   F ( x )   and   G ( y ) Basic Category
Coordinated Development0.60~1.00Coordinated Development (IV) F ( x ) G ( y ) > 0.1 Eco-environment Lag Type (IV-1)
| F ( x ) G ( y ) | 0.1 Synchronization of Urbanization and Eco-environment Type (IV-2)
G ( y ) F ( x ) > 0.1 Urbanization Lag Type (IV-3)
Transition0.50~0.59Barely Coordinated Development (III) F ( x ) G ( y ) > 0.1 Eco-environment Lag Type (III-1)
| F ( x ) G ( y ) | 0.1 Synchronization of Urbanization and Eco-environment Type (III-2)
G ( y ) F ( x ) > 0.1 Urbanization Lag Type (III-3)
0.40~0.49Endangered Imbalance (II) F ( x ) G ( y ) > 0.1 Eco-environment Lag Type (II-1)
| F ( x ) G ( y ) | 0.1 Synchronization of Urbanization and Eco-environment Type (II-2)
G ( y ) F ( x ) > 0.1 Urbanization Lag Type (II-3)
Imbalance0.00~0.39Imbalance (I) F ( x ) G ( y ) > 0.1 Eco-environment Lag Type (I-1)
| F ( x ) G ( y ) | 0.1 Co-dame of Urbanization and Eco-environment Type (I-2)
G ( y ) F ( x ) > 0.1 Urbanization Lag Type (I-3)
Table 3. Classification Criteria for Decoupling Types.
Status E / E U / U D I
DecouplingRecession Decoupling-- D I 1.2
Strong Decoupling-+ D I < 0
Weak Decoupling++ 0 D I < 0.8
ConnectionExpansion Connection++ 0.8 D I < 1.2
Recession Connection-- 0.8 D I < 1.2
Negative DecouplingNegative Expansion Decoupling++ D I 1.2
Negative Strong Decoupling+- D I < 0
Negative Weak Decoupling-- 0 D I < 0.8
E / E and U / U respectively represent the change rate of eco-environment and urbanization in t year relative to t 1 year. + indicates positive value and - indicates negative value.
Table 4. Classification Criteria for Symbiosis Mode.
Symbiosis Mode δ x y δ y x δ x y · δ y x Interpretative Statement
Parasitic Symbiosis-+<0Urbanization Promotes Eco-environment; Eco-environment Suppresses Urbanization.
+-<0Urbanization Suppresses Eco-environment, Eco-environment Promotes Urbanization.
Partial Symbiosis0+0Urbanization Promotes Eco-environment; The Influence of Eco-environment on Urbanization is offset.
+00Eco-environment Promotes Urbanization; The influence of Urbanization on Eco-environment is offset
Asymmetric Mutualism+ > δ x y >0Urbanization Promotes the other more than Eco-environment
> δ y x +>0Eco-environment Promotes the other more than Urbanization
Symmetric Mutualism+ = δ x y >0Urbanization and Eco-environment Promote Each Other in The Same Degree
Note: + indicates positive value and - indicates negative value.
Table 5. CCR between Urbanization and Eco-environment in Hebei Province, China.
Year19851986198719881989199019911992
CCR(II-3)(II-3)(II-3)(II-3)(II-3)(II-3)(II-3)(II-3)
Year19931994199519961997199819992000
CCR(II-3)(II-3)(II-3)(II-3)(II-3)(II-3)(II-3)(II-3)
Year20012002200320042005200620072008
CCR(II-3)(II-3)(II-3)(III-3)(III-3)(III-3)(III-2)(IV-3)
Year20092010201120122013201420152016
CCR(IV-3)(IV-3)(IV-2)(IV-2)(IV-2)(IV-2)(IV-2)(IV-2)
Year201720182019
CCR(IV-2)(IV-1)(IV-1)
IV-1, IV-2 and IV-3 respectively represent eco-environment lag type, synchronization of urbanization and eco-environment type, urbanization lag type of coordinated development; III-2 and III-3 respectively represent synchronization of urbanization and eco-environment type, urbanization lag type of barely coordinated development; II-3 represents urbanization lag type of endangered imbalance.
Table 6. Decoupling Index of Urbanization and Eco-environment in Hebei Province, China.
Year E / E U / U D I StatusYear E / E U / U D I Status
1986−0.08150.3394−0.2403Strong Decoupling2003−0.02800.0586−0.4770Strong Decoupling
1987−0.08910.1589−0.5608Strong Decoupling2004−0.06790.1178−0.5764Strong Decoupling
1988−0.0008−0.05820.0140Negative Weak Decoupling20050.08590.16780.5117Weak Decoupling
19890.00160.01770.0930Weak Decoupling20060.04140.14370.2883Weak Decoupling
19900.01090.26350.0414Weak Decoupling20070.04160.14560.2859Weak Decoupling
19910.1927−0.3433−0.5614Negative Strong Decoupling20080.16700.13651.2229Negative Expansion Decoupling
1992−0.01030.0281−0.3678Strong Decoupling20090.10420.10610.9825Expansion Connection
1993−0.00370.1991−0.0186Strong Decoupling20100.08930.11150.8008Expansion Connection
19940.1658−0.2238−0.7409Negative Strong Decoupling2011−0.05130.1205−0.4253Strong Decoupling
19950.0637−0.0111−5.7199Negative Strong Decoupling20120.06340.10460.6061Weak Decoupling
19960.04820.10490.4600Weak Decoupling20130.02430.08120.2988Weak Decoupling
1997−0.06950.0631−1.1015Strong Decoupling2014−0.01390.0838−0.1659Strong Decoupling
1998−0.15670.0981−1.5976Strong Decoupling20150.09970.01765.6705Negative Expansion Decoupling
19990.07430.05021.4798Negative Expansion Decoupling20160.12900.07621.6922Negative Expansion Decoupling
20000.07940.01306.1133Negative Expansion Decoupling2017−0.01330.0809−0.1642Strong Decoupling
20010.08450.08980.9404Expansion Connection2018−0.03120.0462−0.6759Strong Decoupling
2002−0.08760.0877−0.9988Strong Decoupling2019−0.03720.0500−0.7443Strong Decoupling
Table 7. Symbiosis Mode between Urbanization and Eco-environment in Hebei Province, China.
Year δ x y δ y x δ x y · δ y x Symbiosis ModeYear δ x y δ y x δ x y · δ y x Symbiosis Mode
19850.0384−0.0171−0.0007Parasitic20030.52450.12120.0636Asymmetric Mutualism
1986−0.21950.0217−0.0048Parasitic20040.32710.17860.0584Asymmetric Mutualism
1987−0.67450.0617−0.0416Parasitic20050.72950.24110.1759Asymmetric Mutualism
1988−0.63910.0448−0.0286Parasitic20060.98930.30790.3046Asymmetric Mutualism
1989−0.64260.0495−0.0318Parasitic20071.28120.37890.4855Asymmetric Mutualism
1990−0.74770.1307−0.0977Parasitic20081.78080.39410.7018Asymmetric Mutualism
19910.07230.00660.0005Asymmetric Mutualism20091.91520.40220.7702Asymmetric Mutualism
19920.04650.01090.0005Asymmetric Mutualism20101.87740.40140.7536Asymmetric Mutualism
19930.04370.04700.0020Asymmetric Mutualism20112.30150.43160.9933Asymmetric Mutualism
19940.34810.00040.0001Asymmetric Mutualism20122.27840.37300.8498Asymmetric Mutualism
19950.4270−0.0008−0.0003Parasitic20132.31720.29860.6920Asymmetric Mutualism
19960.52400.01050.0055Asymmetric Mutualism20142.60650.17950.4678Asymmetric Mutualism
19970.46560.02030.0094Asymmetric Mutualism20151.84890.13040.2411Asymmetric Mutualism
19980.10580.04370.0046Asymmetric Mutualism20160.3405−0.0443−0.0151Parasitic
19990.32080.05180.0166Asymmetric Mutualism20170.5977−0.2998−0.1792Parasitic
20000.50180.05090.0256Asymmetric Mutualism20181.1601−0.5142−0.5966Parasitic
20010.69130.06680.0462Asymmetric Mutualism20191.8232−0.8194−1.4940Parasitic
20020.56930.09840.0560Asymmetric Mutualism
Publisher’s Note: MDPI stays neutral with regard to jurisdictional claims in published maps and institutional affiliations.

