Article

Exploring the Impact of Different Port Governances on Smart Port Development Strategy in Taiwan and Spain

1
Department of Civil Engineering, National Yang Ming Chiao Tung University, Hsinchu City 30010, Taiwan
2
Taiwan International Ports Corporation, Ltd., Kaohsiung City 80443, Taiwan
*
Author to whom correspondence should be addressed.
Sustainability 2022, 14(15), 9158; https://doi.org/10.3390/su14159158
Submission received: 22 June 2022 / Revised: 13 July 2022 / Accepted: 22 July 2022 / Published: 26 July 2022

Abstract

:
With the rapid development of new technologies, such as automation, big data, and artificial intelligence, a port that utilizes these technologies can significantly improve its operational efficiency and make it economically more competitive. Despite its increasing importance, there is no standard definition of a smart port, resulting in each country having its own smart port development strategy. In this study, we explore how varied port governance of port authorities may impact the smart port development strategy. First, we established a set of evaluation criteria, using the Borda count and fuzzy analytic hierarchy process, to obtain the key indicators for the development of smart ports in Taiwan. Then, we compared the preferred indicators of Taiwan’s smart port development strategy with those of Spanish ports. An obvious difference in this ranking comparison is found. This indicates that Taiwan’s strategy focuses on optimizing maritime safety, while Spain’s strategy focuses on improving operational economics. Finally, we analyzed the differences between the smart port development strategies of these two countries using the latest port governance classification table. The results of the above analysis are also verified by comparing the differences in port legislation between them. It turns out that the private sector is deeply involved in the operation of ports in Taiwan compared with Spain. Our main contribution lies in providing a clear pathway for developing a smart port in Taiwan in the future and investigating the reasons for different smart port development strategies in different countries.

1. Introduction

Sea transportation is a port-to-port mode of transportation, which is not only an important means of transportation for global trade, but also an important node in the supply chain. According to the United Nations [1], sea transportation trade accounts for 90% of global trade by weight, which means that the efficiency of port operations will directly affect the efficiency of world trade. In recent years, owing to the global economic demand for maritime transport; the changing international, political, and economic situation; the impact of pandemics; and international competition, ports need to optimize their functionality in terms of economy, environment, energy, and security to enhance their competitiveness. In this context, a new concept of port governance (PG) has been proposed: the smart port (SP), which aims to realize a highly efficient and cost-effective port operation model through Industry 4.0 technologies [2]. To improve the competitiveness of ports, smart port development (SPD) has been currently regarded as the top priority for every international benchmark port. Singapore, Germany, and the Netherlands have all recently included SPD in their national plans [3,4,5]. In addition, Taiwan and Spain, two maritime-based countries, also need to change their port development strategies because their shipping accounts for a high proportion of the country’s total trade [6,7]. Taiwan is an island off the southeastern China coast, where its shipping accounts for more than 99% of the total trade volume [8]. Spain, on the other hand, is in southwestern Europe. It is not only the gateway to the Atlantic Ocean and the Mediterranean Sea, but also the main route between Europe and Asia because of the Suez Canal. Spanish shipping accounts for more than 80% of the total trade volume, and Spanish ports are important distribution centers for international logistics [9].
Although there are some studies on SPD [6,7,10,11,12], the definition of SP varies from country to country, and the existing studies on SPD may not meet the needs for Taiwan’s ports [7,12]. Thus, this study aims to first develop an evaluation method of SPD for Taiwan’s ports using the Borda count (BC) and fuzzy analytic hierarchy process (FAHP). Secondly, we aim to compare the main criteria for SPD obtained from those of the Spanish ports presented by Alberto et al. [6]. This is not only because of the different port management models of the Taiwan Port Authority (TPA) and the Spanish Port Authority (SPA)—both of which are government-owned, with the management and control of one port being delegated to a local government agency, while the other is managed by a corporatized entity [13]—but also because such a comparison can expand more studies and discussions, such as the differences in port management between European and Asian countries [14], or the differences in PG in a country between a single PA and multiple PAs [15]. In addition, both countries have a long history of ports and works on port development have been widely discussed internationally [11,14,15,16,17,18], so information on port development in both countries is relatively easy to obtain and examine. In recent years, both countries have made a strong push to automate and digitize their ports as an SP [8,19]. Thus, the objective of this paper is to fill the above-mentioned literature gaps with the following two points:
  • Using the BC and FAHP method to establish the evaluation indicators of Taiwan’s SP and reveal its priority.
  • Comparing the preferred indicators for SPD strategies between Taiwan and Spain and analyzing the differences from the perspective of the PG model through comparative analysis.
The remainder of the paper was structured as follows. Section 2 summarizes the theoretical background. Here, we present a conceptual model that informs our research hypotheses and survey design. Section 3 describes the details of our methodological approach. Section 4 reports our survey results and the empirical analysis of survey data. Finally, Section 5 concludes our research by discussing its practical and policy implications, acknowledging its limitations, and suggesting directions for future research.

2. Literature Review

2.1. The Role and Development History of Ports

With the advancement of technology and social development, the role and functions of ports are constantly evolving. In 1923, the Convention and Statute on the International Régime of Maritime Ports [20] defined a port as a berth for ocean-going vessels engaged in international trade; in 1989, the Dictionnaire Juridique des ports maritimes [21] defined a port as a natural or artificial berth. It was not until 2001, when the Brussels—2nd European White Paper on Transport [22] defined ports as nodes in the logistics supply chain of the transformation of transport modes, that ports were gradually transformed from mere berths or service berths to the important hubs of logistics and trade they are today. In the Brussels 2011—3rd European Transport White Paper [22], the concept of the network core is more explicitly included, considering the port as an integrated, network core logistics platform. As port functions evolve, more specific areas of port evolution are revealed. The United Nations Conference on Trade and Development (UNCTAD) defined third-generation ports (3GP) in a report published in 1992 [23]. UNCTAD mentioned that third-generation ports are considered as distribution centers for goods, offering more diversified services such as inventory, packaging, and other types of activities, generating additional employment opportunities and regional economic development. The fourth generation of ports was later mentioned in Port Express, No. 19, 1999 [1]. 4GPs were defined as the information and knowledge center of the supply chain to enable real-time information transfer and reduce logistics time beyond the past. Finally, fifth-generation ports (5GPs) incorporate the service functions of all of the first fourth-generation ports. The new concept is introduced by Train Motorways of Sea (TRAINMOS II) in Smart Cities and Smart Ports [24]. In 5GPs, communication technology (ICT) is used in multifaceted port management, focusing on issues other than logistics efficiency improvement such as environmental protection and security in ports. In addition, Lee et al. [25] adds in their study that the concept of customer-centric community ports is one of the important features of 5GPs, showing a trend towards more diversified and comprehensive port development.

2.2. Summary of Smart Ports

Before discussing SPs, we need to distinguish the difference between green ports (GPs) and SPs. Literally, a GP should focus on the maintenance of the port environment, such as protecting the flora and fauna in the port area, as well as efficient use of energy and reduction of marine pollution, while a SP should focus on using newly developed technologies to optimize port management and reduce various costs of the port. These two types of ports seem to be separate. However, the authors of [11,26,27] believe that GPs and SPs are inseparable. GPs and SPs will be integrated into operation and development because the trend of port development now is to take GP as the main goal and SP development as the main technical means. The green development of the port is based on low energy consumption, low emission, and low pollution as the main goal. The development of SPs is based on high-tech intelligent technology to improve the comprehensive efficiency and competitiveness of port operation. The green development of the port needs the support of port intelligence and technological innovation, and green development is also an important concept for the development of SPs. Without the concept of green development, it is difficult to realize sustainable development and the intelligent mode of the port. In general, green development is an important concept of SPs. Therefore, in this study, our evaluation index of SPs in Taiwan includes not only the use of intelligent technology, but also whether the port uses some technical means to reduce the environmental pollution of the port.
The term “smart port” was first introduced in 1994, when the concept of the intelligent transport system was introduced in the ports of maritime transportation hubs, where the most advanced information, communication, electronic control, and computer processing technologies were integrated into the traffic and transportation management system. However, to understand the nature and main structure of an SP, it is necessary to first explain the definition of smartness. In the field of technology, Spangler et al. [28] argue that smartness means that something behaves in accordance with the principles of automatic computing, such as self-protection, self-repair, and self-optimization. In urban planning, “smart growth” is a management approach to promote economic development without destroying the environment [29], while smart cities represent a management model for infrastructure integration and resource optimization [30]. In summary, this paper uses a quote from the Paris Innovation Review [31] to unify the concept of smartness: “Becoming smart means being more attractive and competitive, and doing more with less.” In other words, smartness stands for the concept of optimizing resources and finding the best solution to a problem in decision making.
To determine the definition of an SP, we refer to five recent studies on the subject. Bao [32] believed that an SP is the use of technology derived from Industry 4.0 to facilitate the exchange of information across the port. Wang et al. [10] argued that an SP usually uses high-level technologies such as the Internet of Things (IoT), ICT, and big data to improve the productivity and efficiency of ports. Anahita et al. [2] asserted that an SP is not only technology-oriented, but also defined as ports where the four fields of digital communication, new technology, environmental education, and public service intersect. Moreover, Lin [7] mentioned that though there is no unified framework for an SP; the overall planning in the international development trend can still be observed to be oriented towards the similar three major goals:
  • Improving the safety, efficiency, and sustainability of the port;
  • Innovation and integration of port functions;
  • Enhancing port service capabilities.
To date, although there is still no unified global standard to define an SP, the above literature review shows that the development of an SP is not only limited to optimizing the application of information and ICT, but also includes multiple services for social education, coastal environmental protection, and reducing energy consumption, aiming to create an SP to be “efficient”, “safe”, and “sustainable”.

2.3. Overview of International SPD Strategies and Evaluation Indicators’ Selection

To understand the extent of SPD, we first need to have a basic idea of the SPD strategy for each international benchmark port to ensure that our evaluation indicators are aligned with international trends. The information can be seen in Table 1. The Singapore government implemented the Smart Nation 2025 ten-year plan back in 2014 [4], which aims to establish a nationwide sensor network to enhance data collection, transmission, and sharing. In addition, the Maritime and Port Authority of Singapore (MPA) has partnered with IBM to develop Sense-making Analytics for Maritime Event Recognition (SAFER), a port and maritime event recognition system that will reduce the occurrence of maritime events through the use of seven smart technology systems. The systems are intended to reduce the occurrence of maritime disasters and have already completed three of seven trials in 2018. The Dutch port of Rotterdam and the German port of Hamburg are pioneers in the development of smart ports in Europe. In 2018, the Port of Rotterdam Authority (PRA) installed many sensors within 42 km of the port for the “Port Shipping Connect 2025” project [3]. Through these sensors, a large amount of weather data is collected, transmitted back, and analyzed, enabling the port management to make fast and accurate operational decisions, such as reducing ship waiting times, helping to determine the best ships to reduce ship waiting times, and helping to determine the best time to call at the port. The Port of Hamburg is the second largest container port in Europe and the improvement in logistics efficiency is considered by the Hamburg Port Authority (HPA) to be the most important factor for the port. In 2015, the HPA presented a smart port management program for achieving economic and ecological co-prosperity, emphasizing the logistics supply chain and energy development of the port [5]. In addition, since 2017, the Spanish port industry has also shown great interest in SPD [11]. It holds annual conferences to discuss the most relevant and innovative SP topics in the world. The Port Authority of Valencia (PAV), the greatest port in Spanish, presents the SP 2030 strategy in London, with the strategic objective of connectivity, efficiency, and responsibility. Its aim is to use the port community system (PCS) to reach cooperation and information transfer between the port and the community to improve the competitiveness and sustainability of its region of influence [33].
In Asia, seven of the top ten ports in the world in terms of cargo and container throughput are in China, which has also promoted digitization and automation in port construction and policy [34]. The advantages of zero-touch, low-risk, high-efficiency technology have not only increased traditional terminal operations by 30% and saved 70% of labor costs, but also avoided the risk of epidemic transmission with relatively low manpower requirements. Production and management can still be carried out through automated operations at the port. Meanwhile, Taiwan established an automated port gate system and RFID container e-seal, which saves one-quarter of the time compared with traditional paper-based manual customs clearance and tracks logistics status in real time, in 2012. In 2018, the Taiwan Port Authority (TPA) proposed the Transform Sustainable Modern and Advanced ports with Revolutionary Technology (Trans-SMART) plan, which is divided into two action plans for sea and land, including land testing to optimize logistics, security, and efficiency functions and the use of big data analysis and intelligent technology to enhance the international competitiveness of Taiwan’s ports [8].
Then, the selection and establishment of evaluation indicators is the most essential item in research. We reviewed three studies on SP and compared the method, main indicators, number of sub-indicators, weighting method, and study subjects, as shown in Table 2. Anahita et al. [2] developed four main indicators including 68 sub-indicators of SPD through an extensive literature analysis and collected official statistics from ports of various countries to arrive at the SP index for the top 14 international ports after normalization. Chen et al. [11] also constructed 6 major indicators and 20 sub-indicators affecting green ports and SPs and used the interpretative structural model method to establish the relationship between each indicator. Alberto et al. [6] invited a group of experts and scholars to agree on evaluation indicators for SP through the Delphi method and established weights for each indicator. Indicators such as digitization, ICT, and automation were considered relatively important in the SPD.
Based on the above review, we conclude that the main indicators, number of sub-indicators, and weighting of each indicator are different among the three studies. Thus, we used the intersection of the assessment indicators of these three studies to find common key indicators in this study. At the same time, we used a theoretical method to determine the reasonable weight of each indicator with different importance to improve the disadvantage that each indicator has the same weight.

2.4. A Brief Review of Port Governance

The world’s perception of port governance (PG) has changed over the past four decades. The devolution of publicly operated transport operations to the private sector in many countries starting in 1980 is a phenomenon that illustrates the impact of governance on the port industry. For example, the British government privatized ports [35], tendered management facilities with preferential policies, or delegated the management of ports and terminals to other government departments [36]. To define governance, the World Bank (2001) [37] considered governance structures as consisting of the systems, structures, and processes developed by a group to achieve common goals. The legislation imposed by the government on a business or nonprofit organization also shapes the governance structure in which the organization operates. Port governance, on the other hand, refers to the means or methods by which government or those in authority in the port industry own, manage, and control port operations [38].
Typically, PG can be divided into two cases according to its subject, namely port governance and port authority governance [18,39]. In the first case, port governance covers the way services and terminals are managed and their relationship with the port [37]; in the second case, it refers to the internal governance of the PA and its relationship with the government and external agencies [40]. In the latter, the governance process is defined as the interaction between policy makers and the PA: the greater the autonomy of the PA, the greater its own responsibility in terms of port management performance [41]. In exploring the relationship between PG and PA, Verhoeven [42] concludes that PG patterns are influenced by the size of the corresponding PA. The role of the PA has also attracted considerable academic interest in the literature on port governance, management efficiency, and logistics performance. Thus, owing to the strong link between PG and PA, in our study, PG is defined as the second case mentioned above, i.e., governed by the PA.

2.5. Impact of PG Model on Port Development Strategy and How to Analyze

Under the influence of globalization, Sanchez and Pinto [43] adapted the decision-making process of PG [44] and found that the technological innovation may change government strategies for port development, leading to the emergence of new governance models, which in turn led to port new development policies. Thus, the emergence of smart ports seems to be causally related to PG to some extent. This also aroused our interest to explore the relationship between PG and SPD.
The concept of PG models has evolved over time and space because of the convergence of several elements [42], including decentralization, corporate governance, operational status, functional autonomy, functional initiative, investment responsibility, and financial autonomy. This evolution has been reinforced since the 1990s with the development of decentralization programs around the world because it brings a lot of success in the port industry. For instance, Goss [45] pointed out that privatization of ports helps PA to maintain competition, and thus improve operational efficiency. Baird [35] also showed that the key factor for the increasing competitiveness of U.K. ports is the removal of control over the port labor market. Thus, it can be argued that changes in PG models have driven different port development strategies in ports and created different port performance. Currently, 80% of the world’s ports are landlord ports [39]. Unlike the tradition of full government responsibility, in this model, PA is like the landlord of the port, holding the ownership and leasing out the port infrastructure to private operators [37]. The PA is only responsible for economic development; long-term development of the land; and maintenance of the port infrastructure such as channels, berths, and terminals, while the private operator is responsible for the operation of the terminals.
However, even though the main challenges and objectives of ports around the world are very similar today, the reform of port governance has taken different paths. The same conclusion can be drawn in the case of the EU. The diversity of rules makes it impossible to identify a fixed European governance model [42]. Ng and Pallis [46] also find that the role of ports in PG practices varies within a group of countries, depending on the political traditions of each country. Therefore, it can be concluded that PG models evolve according to the socio-economic framework and the performance of ports [41]. That is, the evolution of PG is unique in each country, which leads to different port development strategies. For example, Bennathan and Walters [47] divided PG into two doctrines. The Anglo-Saxon doctrine and the European doctrine, which are distinguished by whether port profitability is the primary goal of PA. Lee and Flynn [14] investigated the characteristics of major container port developments in Asia and Europe and compared their port pricing systems, finding that there is a third doctrine driving port development policy, the Asian PG doctrine, in addition to the Anglo-Saxon and European doctrines. Likewise, Laxe et al. [18], by comparing the timeline of port reforms (legislation) and external causes of PG changes, found that PG in Latin America is currently still conceptually in the old definition and, therefore, illustrates that its port development strategy is less adaptive to port changes than its European counterparts.
Therefore, to analyze a country’s port development strategy, knowing its PG model is crucial; however, this matter is not simple. Although it would be easier to distinguish between different types of PG models using only classification tables [35,37,48], these frameworks are too simplistic to reflect the infinite diversity of today’s highly competitive port environment [44]. The division of PG models into neatly labeled packages is becoming increasingly unimportant as it does not adequately reflect the regional nature of a port system [39]. To sum up, based on our literature review, an extensive literature review with observational and comparative analysis would be a better choice for PG analysis rather than a standardized classification table.

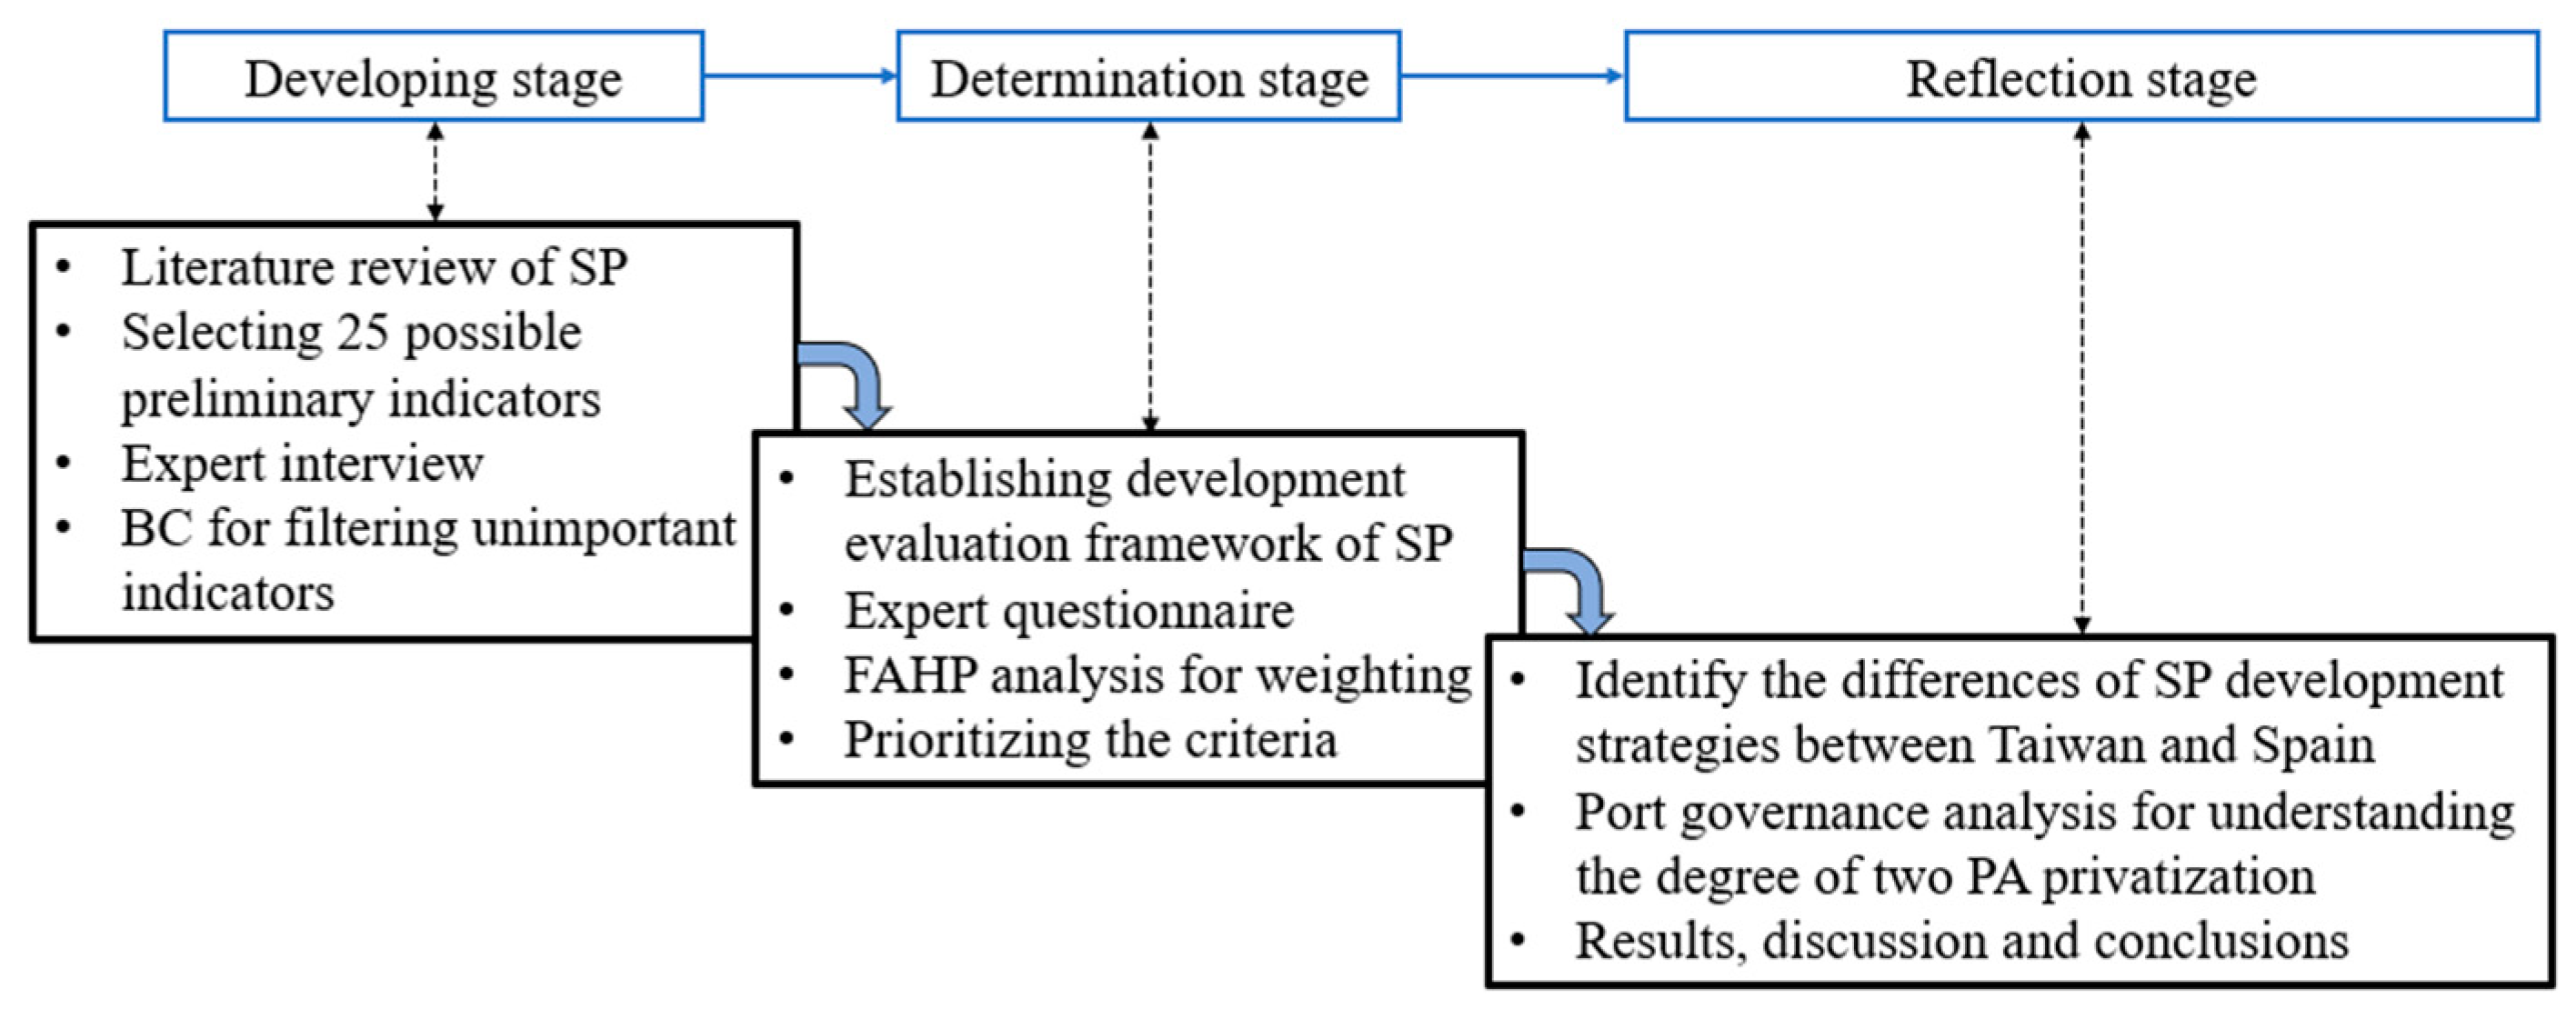
3. Research Methodology

We used a series of methods in three stages to obtain the criteria for SP development in Taiwan ports. The three stages of research methodology in this study are developing, determination, and reflection, in which the key methods used in each stage are the Borda count (BC), FAHP, and PG analysis. Figure 1 illustrates the flow sequence of our research methodology.

3.1. Developing Stage

To make the questionnaire more valid for FAHP analysis, the number of final indicators should not be too large. Saaty [48] mentioned that the maximum number of factors in each layer of FAHP should not exceed seven items. Miller [49] also pointed out that human psychological responses are limited to 7 ± 2 and suggested that the design of the assessment framework should be 3~5 elements per layer. Based on the above principles, we first collected all of the different indicators of SP from some previous works and finally decided on 25 pcs as possible preliminary indicators. Although those indicators have been approved in some European and American ports using a qualitative method, their applicability to Asian ports still needs to be discussed through a rigorous approach.
Therefore, at this stage, some indicators that are considered extremely unimportant are removed in the preliminary indicators through Borda count (BC). BC has a higher degree of fairness to elect a more consensual candidate compared with a plurality voting system [50]. It indicates that the BC is more likely to integrate the opinions of experts in group-decision making problems. The rule of BC is to give the candidates points according to their places on each ballot. Its calculation is expressed as Equation (1). Each indicator is assigned a rank from each decision-maker equal to the score of the indicator he or she prefers, so that, with n indicators, each one receives n − 1 point for a first preference, n − 2 for a second, and so on. After quantifying all rankings, the final score for each indicator was obtained by summing.
f B ( x ) = Y A ( i : x P i y )
where   f B ( x ) is the final score of indicator x ;  y is the total number of preference x P i cases in the set A; and x P i   is the point of indicator x   in the i-th y.
The interview of BC was scored by 10 experts, including senior engineers and university scholars in harbor engineering (as shown in Table 3). The job tenure and their diverse expertise indicate that the respondents have sufficient knowledge and expertise, with the ability to offer reliable observations and comprehensive information about the selection of smart port evaluation indicators in Taiwan. Most respondents have more than 20 years of work experience and are familiar with port affairs. Interviewees were asked to rank these preliminary indicators of each dimension considering whether they are suitable for local conditions or follow the international trend of SP development. The interview with one respondent lasted one hour, and this time was used to explain to the respondent how to answer the questionnaire and to answer their concerns about the questions. A total of 10 questionnaires were distributed and 10 usable questionnaires were received. This results in a response rate of 100%, which is satisfactory for this type of survey-based study [51]. After BC calculation, the scores of the whole indicators were obtained. Then, we use a z-score to determine the importance of the indicators. The detailed filtering process will be described in Section 4.1 and the z-score is defined as follows:
z = x x ¯ S
where x is the raw score of the sample, x ¯ is the mean of the total samples, and s is the standard deviation of the sample.

3.2. Determination Stage

After the first stage, we then established the SPD evaluation framework and developed an expert questionnaire, which is designed to form the pairwise comparison matrices for grouped sub-criteria and dimensions. The respondents are the same as those in the developing stage.
Multi-criteria decision making (MCDM) is widely used in many fields such as textbook selection, engineering risk assessment, transportation system design, market research, and energy policy planning. The most common applications are the selection of factors or indicators and the evaluation of factor weights. Analytic hierarchy process (AHP), fuzzy analytic hierarchy process (FAHP), and analytic network process (ANP) are three extensively used methods for MCDM and have been refined since they were proposed [48,52,53]. AHP was first introduced to numerically select decision options from unquantifiable factors by Saaty [48]. FAHP is an extended application of AHP, which features fuzzy numbers to align the analysis results more with natural human semantics. ANP is often used to solve problems that cannot be expressed in terms of hierarchical structure. The relationship of interdependence between the criteria should be seriously considered in ANP, but is not needed for AHP and FAHP. Thus, ANP requires more complex calculations than AHP and FAHP. Although these three methods are still widely used in the field of maritime policy and management [54,55], FAHP, which can reflect the real semantic meaning of human beings by simple calculation, is more suitable for the needs of this study rather than AHP and ANP, and is thus chosen for further analysis in this study. Thus, FAHP is the key method to determine the weight and the priority of all selected criteria in our study. The FAHP procedure was adopted from Yu and Wei [56] and a brief introduction to its theory and calculation is provided as follows.

3.2.1. Establishing a Fuzzy Number

Zadeh [57] defined a fuzzy set as a class of objects with a continuum of grades of membership ranging between zero and one. According to Liu et al. [58], 99 out of 109 papers surveyed used triangular fuzzy number (TFN), and the high percentage of 91% indicated that triangular fuzzy number is an accepted method in academics. A TFN is represented by three points and denoted simply as (l, m, u). The parameters l, m, and u denote the smallest possible value, the most promising value, and the largest possible value, respectively. A triangular membership function is defined as Equation (3):
U A ( x ) = { x l m l ,   l x m 1 ,     x = m u x u m ,   m x u             0 ,     l x u

3.2.2. Determining the Linguistic Number

The concept of linguistic variables is very practical in handling ill-defined or complex situations reasonably described in conventional quantitative expressions. We followed the equivalent fuzzy numbers and linguistic comparison terms of [59] shown in Table 4.

3.2.3. Building the Fuzzy Positive Reciprocal Matrix

The fuzzy positive reciprocal matrix may be expressed in the following form:
A ˜ = [ a ˜ i j ]
where n is the number of sub-factors of each dimension, and a ˜ i j represent the pairwise comparison between criterion i and j using fuzzy numbers and where i ,   j = 1 , 2 , , n
a ˜ i j = { 1 ,   i = j , 1 / a ˜ j i ,   i j

3.2.4. Calculating the Fuzzy Weights

The fuzzy weights of each criterion in the fuzzy positive reciprocal comparison matrix are obtained using the geometric mean method, where the geometric mean of the fuzzy comparison value of criterion i to each other criterion is derived as follows:
Z i = ( a i 1 × a i 2 × × a i n ) 1 / n     i = 1 , 2 , , n
The fuzzy weight of the i th criterion, as represented by a TFN, is then computed as follows:
W i = Z i × ( Z 1 × Z 2 × × Z n ) 1     i = 1 , 2 , , n

3.2.5. Defuzzification

Because the criteria weights are still in the form of fuzzy triangular values, there is a need to translate them into non-fuzzy values through a process of defuzzification. A common method is the maximum mean method, centre of area (CoA) method, and alpha-cut method. CoA proved to be better for defuzzification than the other [58], and is thus used in this study. The defuzzification weight of the i th evaluation criterion of CoA is defined as follows:
D F i = U i + 2 × M i + L i 4   i = 1 , 2 , , n

3.2.6. Normalization and Synthetic Analysis

Although the previous step yields a non-fuzzy number, normalization is required to represent the relative importance between factors. The normalization weight of the i th criteria, N W i , is expressed by the following equation.
N W i = D F i i = 1 n D F i   i = 1 , 2 , , n

3.3. Reflection Stage

Although in the literature review, we mentioned that the existing PG classification tables do not satisfy all PG models around the world, it is possible to find some variables that can distinguish trends in the application of classical models in different regions of the world [15]. Similarly, while Brooks [60] acknowledges that there are many differences and regional variations in PG, they still insist on proposing and applying discrete categories of PG. However, further analysis of PG practices, styles, and patterns requires a more continuous and fluid approach to the subject, such as exploring its variation over time and space [39]. Therefore, at this stage, a set of analytical methods is going to be conducted to fill this gap. First, we will examine the PG characteristics of Spain and Taiwan through a latest and simple PG classification table. Second, to compensate for the discrete nature as well as the incompleteness of the PG classification framework, we will use a comparative analysis to examine the extent to which PAs are allowed to intervene in port services in these two countries from the aspect of port legislation or regulation. This is because national laws and specific port legislation have a direct impact on the decision-making process of PG model mechanisms [61,62]. Likewise, national policies have an impact on the decision-making of ports and port governance models [63].
Finally, using the results of the above analysis, we will explore whether the different PGs in these two countries have contributed to the differences in SPD. Given the relative novelty of the study and the analytical approach adapted from the main literature within the last 20 years [44,64,65], we use the PG classification table of Caldeirinha et al. [15] in our study. The variables we used include PA type, PA power, PA focus, PA relationship, PA geo-organization, PA function, PA competition pattern, PA managers’ selection, PA management/legal structure, PA nature, and PA financing, as shown in Table 5.
Using these 11 variables from the literature, four major governance models can be identified, categorized as private, liberal, control, and centralized, which can give us a little insight into the degree of port privatization in a country. Then, the subsequent comparative analysis of PG is collated from an extensive literature review, while the main criteria of SPD in Taiwan, obtained by FAHP at the last stage, were compared with those in Spain [6] to derive the SPD differences between the two countries.

4. Results and Findings

4.1. Determination of Final Indicators

In this section, we determined the final indicators based on the BC method. Table 6 indicates the item code, cumulative score, calculated z-score of each indicator from BC, and the determination of pass or fail. We used the first letter of the name of these dimensions as the item code. The local z-score is obtained from the in-group comparison (IGC) of sub-indicators in each dimension. The global z-score is considered by the whole-group comparison (WGC) of 25 indicators. Z-score is the value after standardization of the data, which indicates the distance between that raw score of the indicator and the sample mean in units of the standard deviation. Tam [66] showed that an indicator with a lower negative z-score indicates an insignificant one in a normal distribution. For a sample size of 25 indicators, minus one is valid as a threshold value of z-score to remove some insignificant indicators. Therefore, the threshold of the z-score was set to −1 for both IGC and WGC in the study. If both z-scores of an indicator are lower than −1, it cannot pass the threshold. Failed indicators being quite unimportant through local and global z-scores were removed from 25 indicators.
Table 6 showed that all the indicators in the operational economics dimension passed both thresholds and were accepted for further analysis. Only four indicators failed and were removed from 25 preliminary indicators. These are “Degree of ecological protection”, “Renewable energy production”, “Compliance with ISPS training requirements”, and “Free WIFI service”, which are specially marked as the grayscale bottom for easy identification. Thus, 21 indicators remained for the FAHP analysis.

4.2. Weight and Prioritizing of the Criteria

FAHP commonly includes three layers: goal, dimension, and criterion, as shown in Appendix A. The goal is set to be the “Taiwan Smart Port Development Evaluation Model”. The main dimension includes five aspects: operational economics, environmental protection, energy sustainability, maritime safety, and community service. Each dimension contains four to six sub-criteria, which are distinguished by numbers. The evaluation variables of each sub-criterion are shown in Table A1. The number indicates the cited literature whose sources are listed below this table. After the 21 indicators were selected, their weights were obtained by FAHP analysis and are presented in Table 7. The consistency ratio of the pairwise comparison matrix is examined to be a value of 0.1 which is commonly used in FAHP. The obtained consistency ratio of 0.051 indicates that all weights obtained are consistent and acceptable.
For the second layer, the weight of each dimension is presented in the second column of Table 7. The largest weight is 0.3511. The result shows that the dimension of operational economics is the most important among the five dimensions. The dimension of maritime safety has a weight of 0.3457, which is slightly lower than 0.3511. The next three sorted dimensions are environmental protection, energy sustainability, and community services, which have weights of 0.1458, 0.1025, and 0.0550, respectively. The result shows that the dimensions of operation economics and maritime safety have similar importance and the dimension of community service is the least important.
For the third layer, the weight of each criterion is listed in the fourth column of Table 7, where the corresponding weight of each dimension is considered. Thus, the sum of all these weights is one. Prioritizing of all criteria is represented by numbers from 1 to 21, according to the largest to smallest weights. The result listed in the last column of Table 7 reveals that the top three most important criteria are navigation aid systems, docking line efficiency, and working environment safety, of which the corresponding weights are 0.1270, 0.1213, and 0.1000, respectively.

4.3. Comparative Analysis of the SPD Strategies in Taiwan and Spain

4.3.1. Comparison of Main Criteria

To understand the differences in SPD strategies between Taiwan and Spain, we compare the criteria priorities of SPD in Taiwan obtained by FAHP with those of Spanish ports. The number of evaluation criteria for the SPD in the two studies is 21 and 32. Higher priority criteria represent important guidelines for SPD. Table 8 shows the comparison of the top 3 and 16th priority criteria for SPD between the two countries.
For the Taiwanese ports, navigation aid systems and working environment safety in the maritime safety dimension are evaluated as the two most important criteria for SPD. Then, the third important criterion is docking line efficiency in the operational economics dimension. Lin [7] pointed out that the infrastructure costs of building an SP are usually high, and the benefits are difficult to estimate. However, according to Anahita et al. [2], the degree of SPD is positively correlated with national R&D funding expenditures, indicating that, the more a country is open and committed to the innovation of new systems, the more it can promote the SPD. Thus, based on Taiwan’s existing software strength, the development of navigation aid systems is relatively simple to implement and has real benefits for Taiwan. Nevertheless, the top 3 criteria for the Spanish ports are all in the operational economics dimension. These are logistics process digitalization, degree of mechanical systems automation, and docking line efficiency. The navigation aid system in the maritime safety dimension was ranked 16th out of 32 priority criteria. The ranking is significantly different from the top ranking for the Taiwanese ports. The ranking difference can be interpreted as SPA emphasizing much more port operation efficiency compared with TPA in SPD. The ranking difference arouses our great interest in the study.

4.3.2. Comparison of PG

In this subsection, we use the PG model proposed by Caldeirinha et al. [15] to explain this difference. In classifying PA, four main models of governance emerge, namely, the private model, the liberal model, the control model, and the centralized model. The private model is based on the Anglo-Saxon model and consists of an autonomous private PA and a private operator with minimal government control over the contract. The liberal model is based on the Hanseatic model and consists of a public PA and a private concessionaire or leaser with considerable autonomy and a corporate oversight body controlling internal finances. The controlled model, on the other hand, is based on the Latin model and relies on a public capital PA and an entirely private public service concession terminal operator with controlled decentralization and a financial and investment strategy controlled by the government. The centralized model relies on the PA as the government agency that controls all or part of the nation’s ports, with tight control over finances, economics, operations, and investment or strategy [15,44].
Table 9 shows the comparison of variables between TPA and SPA regarding PA. The data sources for this table are from [67,68] and the official port legislation website. Although the labels provided in the Table 5 do not perfectly match the governance models of these two countries, this comparison still reveals some characteristics of their PG. The words under grayscale represent that they are different from the original labels and show the governance characteristics of the two PAs. Overall, based on the results of the table’s classification, it can infer that TPA governance seems to be more privatized than SPA because TPA has more labels on the liberal model and SPA has more on the controlled model. Furthermore, Taiwan has only one PA because the country is too small, not for political reasons. Thus, it would be easier for port management if the old PA were merged.
In terms of the grayscale labels, we can obtain a better understanding of the differences between the two PAs. TPA is currently in a hypocritical state of PG, as it established the goal of moving to a private governance model in the 2012 port reform, but the PA has publicly owned bureaus that retain most of the governance structure [67]. This led to difficulties in policy implementation, and although the PA was consolidated into one department for efficiency, the newly created branches under the PA resulted in increased time and cost to adopt a decision. Meanwhile, the governance model of the SPA is considered by scholars as a more centralized governance framework (Latin model), in which the PA is more influenced by central government decisions and planning [68]. The Spanish national port system consists of 46 ports of public interest, managed by 28 PAs. Their coordination and control of efficiency correspond to the national port public authorities, responsible for implementing the government’s port policies [69]. Thus, TPA’s PG seems to fall between the liberal and controlled model, while SPA’s PG falls between the controlled and centralist model, which also suggests that TPA is more privatized than SPA.

4.3.3. Verification and Discussion

To verify the above results, we would like to discuss them more precisely in the context of port legislation. Given that the two PAs are essentially a landlord PG, the PAs are only responsible for the maintenance of port facilities, while port operations are the responsibility of private companies or terminal operators. This decentralization is usually through concession agreements [68], or contracts whereby the government transfers operating rights to a private company, which then engages in activities under the terms of the contract with government approval [70]. This means that, in the landlord port model, the PA is actually the concessionaire. Consequently, in this liberalized environment, concession contracts are one of the most important tools through which PAs under the landlord type can directly or indirectly influence port activities [68]. Therefore, we set out to find evidence and examples of indirect involvement of both countries in port activities using concessions, starting from information or laws on port concessions, and found that Spanish ports have more power to intervene in port operations.
According to Article 109, Section 3 of Royal Legislative Decree 2011 [71], the Spanish government would take the necessary measures to ensure the provision of adequate port services when port services from private companies are insufficient. This article gives the SPA the right to participate in the operation of port logistics and the responsibility to provide port services directly. For example, the holder of a license issued by a PA borrows pilotage services in a private legal system. Given that anyone can challenge the granting of a license, the port authority must assume, directly or indirectly, the obligation to provide the service [72]. Thus, in the Spanish port system, the relationship between the provider, the public administration, and the recipient of the service may have different legal implications in terms of legacy liability. However, there is no similar law in Taiwan’s port regulations that enables the TPA to participate indirectly in port operations. Most cargo handling and warehousing operations originally in charge of the public sector were transferred to private companies [73]. Cargo management and shipping has already been already controlled by private shipping companies and cargo contractors since TPA transformed from a public institution to a private company in 2012. Although both Taiwanese and Spanish ports are classified as landlord ports, SPA has less privatization than TPA and still can involve several port services as an operator based on their port legislation. Through the PG analysis on TPA and SPA, we found two reasons for different strategies of SPD.
  • TPA has little power to improve cargo stevedoring efficiency, so TPA can only focus on maritime safety to prioritize SPD.
  • SPA must be directly involved in the port logistics market, thus most of the proposed policies need to improve the operational economics of the ports.
Based on the above discussion, we finally inferred that a different degree of port privatization is the key factor indirectly affecting the SPD strategies.

5. Conclusions

5.1. Practical and Policy Implications

In this paper, the key indicators of SPD in Taiwanese ports were studied and compared with those of Spanish ports. The FAHP method was applied to determine the ranking criteria of the SPD strategy for TPA. The result showed that advancing the navigation aid systems for SPD in Taiwan is at the top of the list. Two main reasons were determined for the SPD strategy for the ports in Taiwan. First, the primary operator in Taiwan’s ports has been transformed from a public sector to a private sector since 2012 to enhance its competitiveness. As a result, TPA mainly focuses on the optimization of maritime safety and is not interested in improving operational economics. Second, its cost is relatively low in Taiwan compared with other countries. According to the president of TPA, Taiwan has been building its shipping database since 2011, so it has the advantage of focusing on upgrading, developing, and integrating the original system compared with other countries that spend more money on infrastructure.
The other aim of this paper is to compare the main priority criteria of SPD in Taiwan and Spain and explore the reasons for their differences. The difference in the top priority criteria of SPD is that SPA is most concerned with operational economics, but TPA is more concerned with maritime safety. Through the PG analysis, it is found that the different degrees of port privatization in the two countries result in different PG types, which leads to differences in SPD strategies.

5.2. Limitations and Future Research

The obtained criteria for SPD in this study were based on the survey from port experts, the empirical analysis of survey data, and collected data from literature. The result may include a potential bias of self-selection in this survey method. Differences in experience and understanding of SP among respondents of the questionnaire can also lead to skewed results. Despite these limitations, we provided an applicable evaluation model for SPD. The results can be used to assist the government and port authorities to formulate, adapt, and develop effective SPD strategies based on their own country’s port governance model. In addition, as this study was conducted only in Taiwan, similar studies should be conducted in other ports in different geographical regions using the methodology of this study in the future to make the theoretical and practical contributions of this study more meaningful. Another future research direction could be to study the differences in SPD strategies between various countries, such as Asian ports and U.S. ports, based on the PG analysis method in current research.
Our study only discusses the impact of PG of PA on port development, but in fact, ports are a complex system, and thus involve many stakeholders such as terminal operators, customers, and supply chain participants. It is also mentioned in the literature [39] that, under the current most common mode of operation, the landlord type, if the PA does not perform its due duties, these private companies will also take on more responsibilities of the port because of their interests, which may also cause innovations in PG and port development, so future studies can select one of the stakeholders for analysis.

Author Contributions

Conceptualization, S.-C.L. and H.-K.C.; resources, Y.-F.C.; methodology, S.-C.L., H.-K.C. and Y.-F.C.; database curation, S.-C.L.; software and formal analysis, S.-C.L.; validation and supervision, H.-K.C. and Y.-F.C.; writing—original draft preparation, S.-C.L., H.-K.C. and Y.-F.C.; visualization, S.-C.L.; funding acquisition, H.-K.C.; writing—review and editing S.-C.L. and H.-K.C. All authors have read and agreed to the published version of the manuscript.

Funding

This research received no external funding.

Institutional Review Board Statement

Not applicable.

Informed Consent Statement

Not applicable.

Data Availability Statement

Not applicable.

Conflicts of Interest

The authors declare no conflict of interest.

Appendix A

Table A1. Selected indicators and evaluation variables in the developing stage.
Goal: Taiwan Smart Port Development Evaluation Model
DimensionCriteriaEvaluation Variables
Operational economicsLogistics process digitalization
  • Automated clearance lane ratio
  • Use of RFID container seal rate
  • Use of single customs window (SCW) or not
Degree of mechanical systems’ automation
  • Container terminal automation ratio
Docking line efficiency
  • Berth occupancy rate
  • Annual TEUs/meter of container quay
  • Annual cargo/meter of quay
Use of storage capacity
  • Annual TEUs/total storage or yard area
  • Annual cargo/total storage or yard area
Number of reception capacity of large ship Two conditions must be met at the same time:
  • Pier draft ≥14.5 m
  • The pier has ≥250 m of parking space
Environmental protectionReduction in greenhouse gas emissions
  • (This year, 2008)/2008 emissions
Number of automations of environmental quality monitor
  • Number of water quality, air pollution, and noise sensors
Amount of recycled wasted
  • Recycle amount/total waste yield
Certification of environment management system
  • ISO14001 certification or not
Energy SustainabilityAnnual electricity and fuel conservation rate For office and work area usage:
  • Total electricity and oil consumption should not exceed the previous year
Number of energy conservation
  • LED streetlight number/port lighting equipment
  • Inductive streetlight/port lighting equipment
Usage of shore power system
  • Proportion of shore power used by ships in port
  • Number of onshore power stations (OPSs)
Certification of energy management
  • ISO50001 certified or not
Maritime safetyWorking environment safety
  • Average training hours of workers
  • Frequency of workplace accidents
  • Number of AEDs
Navigation aid systems
  • Number of meteorological stations
  • Number of undersea robots
  • Whether or not VTMIS is introduced to the vessel maneuvering system
Real-time monitor security system
  • The number of CCTV surveillance devices in AI
Hazardous cargo management system
  • Time consuming query for storage location
  • Number of regular checks and audits
Community serviceWork environment equality and friendly in the work force
  • Annual employee turnover rate
  • Number of female employees/totals
  • Number of employees over 50 years old/totals
  • Number of employees with physical and mental disabilities ≥ 3% of the total number of employees
Data and information transparency and accessibility
  • Official website for open-source data
  • Provide historical port statistics
Connectivity with neighbor community
  • Number of public and educational lectures
  • Waterfront park area
Social media engagement
  • Social media management
  • Regularly publish and update related news

References

  1. UNCTAD. Ports Newsletter N°19; UNCTAD: Geneva, Switzerland, 1999; Volume 19, pp. 9–10. [Google Scholar]
  2. Molavi, A.; Lim, G.J.; Race, B. A Framework for Building a Smart Port and Smart Port Index. Int. J. Sustain. Transp. 2019, 14, 686–700. [Google Scholar] [CrossRef]
  3. Port of Rotterdam. Port of Rotterdam Authority Launches New Pronto Application. Available online: https://www.portofrotterdam.com/en/news-and-press-releases/port-of-rotterdam-authority-launches-new-pronto-application (accessed on 8 August 2019).
  4. Port of Singapore. Port Development of Singapore. Available online: http://www.mpforum.org/uploads/xcpdf/2018-06-19/5b29085fa4083.pdf (accessed on 13 June 2018).
  5. Port of Hamburg. Paves the Way with Europe’s First smartROAD. Available online: https://newsroom.cisco.com/c/r/newsroom/en/us/a/y2015/m06/port-of-hamburg-paves-the-way-with-europe-s-first-smartroad.html (accessed on 3 June 2015).
  6. González, A.R.; González-Cancelas, N.; Serrano, B.M.; Orive, A.C. Preparation of a Smart Port Indicator and Calculation of a Ranking for the Spanish Port System. Logistics 2020, 4, 9. [Google Scholar] [CrossRef]
  7. Lin, J.Y. Application of Internet of Things Technology to Smart Port and Terminal Operations; Ministry of Transportation and Communications Institute: Taipei, Taiwan, 2019. [Google Scholar]
  8. Taiwan International Ports Corporation, Ltd. Taiwan International Business Port Future Development and Construction Plan Master Plan Report; Taiwan International Ports Corporation, Ltd.: Kaohsiung City, Taiwan, 2020; pp. 1–67. [Google Scholar]
  9. Del Estado, P. Informe de Gestio’n del Sistema Portuario de Titularidad Estatal; Ministerio de Fomento: Madrid, Spain, 2008. [Google Scholar]
  10. Jun, W.K.; Lee, M.K.; Choi, J.Y. Impact of the smart port industry on the Korean national economy using input-output analysis. Trans. Res. Part. A Policy Prac. 2018, 108, 80–493. [Google Scholar] [CrossRef]
  11. Chen, J.; Huang, T.; Xie, X.; Lee, P.T.-W.; Hua, C. Constructing Governance Framework of a Green and Smart Port. Mar. Sci. Eng. 2019, 7, 83. [Google Scholar] [CrossRef] [Green Version]
  12. Chang, C.S. Smart Sustainable Harbor Development. J. Chin. Inst. Eng. 2021, 94, 1. Available online: http://www.cie.org.tw/cms/JournalFiles/11003_all.pdf (accessed on 21 June 2022).
  13. Brooks, M.R.; Cullinane, K. (Eds.) Devolution, Port Governance and Port Performance; Elsevier: Amsterdam, The Netherlands, 2006; Volume 17. [Google Scholar]
  14. Lee, P.T.W.; Flynn, M. Charting a New Paradigm of Container Hub Port Development Policy: The Asian Doctrine. Transp. Rev. 2011, 31, 791–806. [Google Scholar] [CrossRef]
  15. Caldeirinha, V.R.; Felício, J.A.; Cunha, S.F.; Luz, L.M. The nexus between port governance and performance. Marit. Policy Manag. 2018, 45, 877–892. [Google Scholar] [CrossRef]
  16. Taiwan International Ports Corporation, Ltd. Port of Kaohsiung Environmental Report. Available online: Chrome-extension://efaidnbmnnnibpcajpcglclefindmkaj/https://www.twport.com.tw/Upload/A/RelFile/CustomPage/2920/f367460f-55e8-416c-a4ef-9c3597715001.pdf (accessed on 20 January 2020).
  17. Mendo, J.B.; Orive, A.C.; Nicoletta, G.C.; Serrano, B.M. Update of the strategic framework for the Spanish port system using a SWOT analysis. Cuadernos de Administración 2020, 36, 96–111. [Google Scholar] [CrossRef]
  18. Laxe, F.G.; Sánchez, R.J.; Alonso, L.G. The adaptation process in port governance: The case of the Latin countries in South America and Europe. J. Shipp. Trade 2016, 1, 177. [Google Scholar] [CrossRef] [Green Version]
  19. Grupo XXI de Communication Empresarial. Transporte XXI. Available online: https://www.transportexxi.com/puertos-2020/ (accessed on 1 April 2020).
  20. Convention and Statute on the International Regime of Maritime Ports. Available online: https://www.ssatp.org/sites/ssatp/files/publications/HTML/legal_review/Annexes/Annexes%20II/Annex%20II-13.pdf (accessed on 9 December 2020).
  21. Bécet, J.-M.; Rézenthel, R. Dictionnaire Juridique des Ports Maritimes et de l’Environnement Littoral. Available online: https://www.pur-editions.fr/product/1135/dictionnaire-juridique-des-ports-maritimes-et-de-l-environnement-littoral (accessed on 9 September 2004).
  22. White Paper Roadmap to a Single European Transport Area—Towards a Competitive and Resource Efficient Transport System. Available online: https://eur-lex.europa.eu/legal-content/EN/ALL/?uri=CELEX%3A52011DC0144 (accessed on 28 March 2011).
  23. UNCTAD. Port Marketing and the Third Generation Port; UNCTAD: Geneva, Switzerland, 1992; Volume 2, p. 23. [Google Scholar]
  24. TrainMoS II. Smart Cities and Intelligent Ports; UNCTAD: Geneva, Switzerland, 2013; Volume 3, p. 4:12. [Google Scholar]
  25. Lee, P.T.W.; Lam, J.S.L.; Lin, C.W.; Hu, K.C.; Cheong, I. Developing the fifth-generation port concept model: An empirical test. Int. J. Logist. Manag. 2018, 29, 1098–1120. [Google Scholar] [CrossRef]
  26. Girard, L.F. Toward a smart sustainable development of port cities/areas: The role of the “Historic Urban Landscape” approach. Sustainability 2013, 5, 4329–4348. [Google Scholar] [CrossRef] [Green Version]
  27. Kia, M.; Shayan, E.; Ghotb, F. The importance of information technology in port terminal operations. Int. J. Phys. Distrib. Logist. Manag. 2000, 30, 331–344. [Google Scholar] [CrossRef] [Green Version]
  28. Spangler, W.S.; Kreulen, J.T.; Chen, Y.; Proctor, L.; Alba, A.; Lelescu, A.; Behal, A. A smarter process for sensing the information space. IBM J. Res. Dev. 2010, 54, 1–13. [Google Scholar] [CrossRef]
  29. Taewoo, N.; Theresa, A.P. Conceptualizing Smart City with Dimensions of Technology, People, and Institutions. In Proceedings of the 12th Annual International Digital Government Research Conference: Digital Government Innovation in Challenging Times, College Park, MD, USA, 12–15 June 2011; pp. 282–291. [Google Scholar] [CrossRef]
  30. Hall, R.E.; Bowerman, B.; Braveman, J.; Taylor, J.; Todosow, H.; Wimmersperg, U.V. The Vision of a Smart City. In Proceedings of the 2nd International Life Extension Technology Workshop, Paris, France, 28 September 2000. [Google Scholar]
  31. Yann, A. What Is a Smart Port? Paris Innov. Rev. 2017. Available online: http://www.parisinnovationreview.com/articles-en/what-is-a-smart-port (accessed on 21 June 2022).
  32. Bao, S.K. Concept of Intelligent Port and Its Systematic Structure. Navig. China 2013, 36, 120–123. Available online: http://www.cqvip.com/qk/97883x/201302/46487027.html (accessed on 21 June 2022).
  33. PAV. Valencia Port Presents Its Smart Ports 2030 Strategy in London. Available online: https://www.valenciaport.com/en/valenciaport-presents-its-smart-ports-2030-strategy-in-london/ (accessed on 21 November 2021).
  34. Taiwan International Ports Corporation, Ltd. Study Report on Automated Container Terminal Operations in Xiamen, Shanghai and Qingdao Ports; Taiwan International Ports Corporation, Ltd.: Kaohsiung City, Taiwan, 2017. Available online: https://report.nat.gov.tw/ReportFront/ReportDetail/detail?sysId=C10601932 (accessed on 21 June 2022).
  35. Baird, A.J. Port Privatisation: Objectives, Extent, Process and the U.K. Experience. Int. J. Marit. Econ. 2000, 2, 177–194. [Google Scholar] [CrossRef]
  36. Kent, P.E.; Hochstein, A. Port reform and privatization in conditions of limited competition: The experience in Colombia, Costa Rica and Nicaragua. Marit. Policy Manag. 1998, 25, 313–333. [Google Scholar] [CrossRef]
  37. World Bank. Port Reform Toolkit; World Bank: Washington, DC, USA, 2001. [Google Scholar]
  38. Talley, W.K. Port Economic; Routledge: London, UK, 2009; p. 232. [Google Scholar] [CrossRef]
  39. Notteboom, T.E.; Haralambides, H.E. Port management and governance in a post-COVID-19 era: Quo vadis? Marit. Econ. Logist. 2020, 22, 329–352. [Google Scholar] [CrossRef]
  40. Verhoeven, P. Chapter 6—Port Privatisation in the United Kingdom and Continental Europe: An Evaluation of Past Experience and New Drivers. In Port Infrastructure Finance; CRC Press: Boca Raton, FL, USA, 2014; Volume 20, p. 111. [Google Scholar]
  41. Brooks, M.R.; Pallis, A. Assessing port governance models: Process and performance components. Marit. Policy Manag. 2008, 35, 411–432. [Google Scholar] [CrossRef]
  42. Verhoeven, P. European Port Governance. Brussel. 2011. Available online: Chrome-extension://efaidnbmnnnibpcajpcglclefindmkaj/https://www.espo.be/media/espopublications/espofactfindingreport2010.pdf (accessed on 21 June 2022).
  43. Sanchez, R.J.; Pinto, F. El gran Desafío para los Puertos: La Hora de Pensar una Nueva Gobernanza Portuaria ha Llegado. In FAL Bulletin: Facilitación del Transporte y el Comercio en América Latina y el Caribe; CEPAL, Naciones Unidas: Santiago, Chile, 2015; Volume 37, pp. 1–9. Available online: https://www.cepal.org/es/publicaciones/37847-gran-desafio-puertos-la-hora-pensar-nueva-gobernanza-portuaria-ha-llegado (accessed on 21 June 2022).
  44. Brooks, M.R.; Cullinane, K. Governance Models Defined. In Research in Transportation Economics; Brooks, M.R., Cullinane, K., Eds.; Elsevier: Amsterdam, The Netherlands, 2007; Volume 17, pp. 405–435. [Google Scholar]
  45. Goss, R.O. Economic policies and seaports: Are port authorities necessary? Marit. Policy Manag. 1990, 17, 257–271. [Google Scholar] [CrossRef]
  46. Ng, A.K.Y.; Pallis, A.A. Port Governance Reforms in Diversified Institutional Frameworks: Generic Solutions, Implementation Asymmetries. Environ. Plan. Econ. Space 2010, 42, 2147–2167. [Google Scholar] [CrossRef] [Green Version]
  47. Bennathan, E.; Walters, A.A. Port Pricing and Investment Policy for Developing Countries. Econ. J. 1980, 90, 944–946. [Google Scholar] [CrossRef]
  48. Saaty, R.W. The analytic hierarchy process—what it is and how it is used. Math. Model. 1987, 9, 161–176. [Google Scholar] [CrossRef]
  49. Miller, G.A. The magical number seven, plus or minus two: Some limits on our capacity for processing information. Psychol. Rev. 1956, 63, 81–97. [Google Scholar] [CrossRef] [Green Version]
  50. Emerson, P. The original Borda count and partial voting. Soc. Choice Welf. 2011, 40, 353–358. [Google Scholar] [CrossRef]
  51. Deng, Z.Y.; Zeng, H.K. The inner characteristics and application of the hierarchical analysis method (AHP). Chin. J. Statis. 1989, 27, 5–22. [Google Scholar]
  52. Buckley, J.J. Fuzzy hierarchical analysis. Fuzzy Sets Syst. 1985, 17, 233–247. [Google Scholar] [CrossRef]
  53. Saaty, T.L. The Analytic Process; RWS Publication: Pittsburgh, PA, USA, 1996. [Google Scholar]
  54. Zhang, X.; Lam, J.S.L. A fuzzy Delphi-AHP-TOPSIS framework to identify barriers in big data analytics adoption: Case of maritime organizations. Marit. Policy Manag. 2019, 46, 781–801. [Google Scholar] [CrossRef]
  55. Gavalas, D.; Syriopoulos, T.; Tsatsaronis, M. Assessing key performance indicators in the shipbuilding industry: An MCDM approach. Marit. Policy Manag. 2021, 49, 463–491. [Google Scholar] [CrossRef]
  56. Yu, F.J.; Wei, Y.R. Combining fuzzy analytical hierarchy process and similarity ideal solution to the sequential preference method for the sequential ordering of the remaining Chinese car options. J. Sci. Eng. Tech. 2017, 13, 1–11. Available online: chrome-extension://efaidnbmnnnibpcajpcglclefindmkaj/http://libwri.nhu.edu.tw:8081/Ejournal/AL03130101.pdf (accessed on 21 June 2022).
  57. Zadeh, L.A. The Concept of a Linguistic Variable and Its Application to Approximate Reasoning. Inf. Sci. 1975, 8, 199–249. [Google Scholar] [CrossRef]
  58. Liu, Y.; Eckert, C.M.; Earl, C. A Review of fuzzy AHP methods for decision-making with subjective judgments. Expert. Syst. Appl. 2020, 161, 113738. [Google Scholar] [CrossRef]
  59. Gumus, A.T. Evaluation of Hazardous Waste Transportation Firms by Using a Two Step Fuzzy-AHP and TOPSIS Methodology. Expert. Syst. Appl. 2009, 36, 4067–4074. [Google Scholar] [CrossRef]
  60. Brooks, M.R. The governance structure of ports. Rev. Netw. Econ. 2004, 3, 168–183. [Google Scholar] [CrossRef]
  61. Caldeirinha, V.; Felício, J.A.; da Cunha, S.F. Government Policies and Portuguese Port Governance in the Period from 2005 to 2015. Res. Transp. Bus. Manag. 2017, 22, 11–20. [Google Scholar] [CrossRef]
  62. Rodrigue, J.-P. The Governance of Intermediacy: The Insertion of Panama in the Global Liner Shipping Network. Res. Transp. Bus. Manag. 2017, 22, 21–26. [Google Scholar] [CrossRef]
  63. Pallis, A.A.; Vaggelas, G.K. A Greek Prototype of Port Governance. Res. Transp. Bus. Manag. 2017, 22, 49–57. [Google Scholar] [CrossRef]
  64. Baltazar, R.; Brooks, M.R. Chapter 17—Port Governance, Devolution and the Matching Framework: A Configuration Theory Approach. Res. Transp. Econ. 2006, 17, 379–403. [Google Scholar] [CrossRef]
  65. Bandara, Y.M.; Nguyen, H.-O.; Chen, S.-L. Determinants of Port Infrastructure Pricing. Asian J. Shipp. Logist. 2013, 29, 187–206. [Google Scholar] [CrossRef] [Green Version]
  66. Tam, H.P. Introduction of extreme value judgment method. NTTU Edu. Res. J. 2008, 19, 131–150. [Google Scholar] [CrossRef]
  67. Tseng, P.-H.; Pilcher, N. Port governance in Taiwan: How hypocrisy helps meet aspirations of change. Res. Transp. Bus. Manag. 2017, 22, 38–48. [Google Scholar] [CrossRef]
  68. Ferrari, C.; Parola, F.; Tei, A. Governance models and port concessions in Europe: Commonalities, critical issues and policy perspectives. Transp. Policy. 2015, 41, 60–67. [Google Scholar] [CrossRef]
  69. Molina, B.; Segura, A.; Serrano, J.P.; Alonso, F.J.; Molina, L.; Pérez-Borrego, Y.A.; Ugarte, M.I.; Oliviero, A. Cognitive performance of people with traumatic spinal cord injury: A cross-sectional study comparing people with subacute and chronic injuries. Spinal Cord. 2018, 56, 796–805. [Google Scholar] [CrossRef] [PubMed] [Green Version]
  70. Notteboom, T. Chapter 19—Concession agreements as port governance tools. Res. Transp. Econ. 2006, 17, 437–455. [Google Scholar] [CrossRef]
  71. Ministerio de Economía y Hacienda. Real Decreto Legislativo 3/2011, de 14 de Noviembre, Por el Que se Aprueba el Texto Refundido de la Ley de Contratos del Sector Público. Available online: https://www.boe.es/buscar/act.php?id=BOE-A-2011-17887 (accessed on 14 November 2011).
  72. Ángel, E.; Ernesto, M.; Jesus, M.M. Juridical regime of pilotage’s service in Spain. J. Marit. Res. 2013, 10, 85–92. [Google Scholar]
  73. Yu, T.F. Research Report on the Competitiveness of Taiwan’s International Business Port. Supervisory. Available online: https://cybsbox.cy.gov.tw/CYBSBoxSSL/edoc/download/49592 (accessed on 15 April 2013).
Figure 1. Flow sequence of the research methodology.
Sustainability 14 09158 g001
Table 1. Overview of international SPD strategies.
Port & CountrySPD Strategy
Singapore port
(Singapore)
The Maritime and Port Authority of Singapore (MPA) and IBM jointly developed the SAFER system in 2017. Aiming to reduce navigation accidents through intelligent traffic monitoring.
Rotterdam port
(Dutch)
The goal is to achieve connected shipping by 2025, which will enable ships to navigate the waterways of ports automatically.
Hamburg port
(Germany)
Smart Energy: To reduce port-related energy consumption and pollution, and to encourage the use of renewable energy.
Smart Logistics: To improve the economic efficiency of ports and apply IT technology to optimize port efficiency.
Valencia port
(Spain)
Strengthen cooperation between ports and cities through PCS. Reduce pollution and increase efficiency through automated processes, aiming to make ports into sustainable, efficient, carbon-neutral smart ports.
Qingdao port
(China)
The goal is to achieve a fully automated terminal that can increase operating capacity by 30% and save 70% of labor compared with a traditional terminal.
Xiamen port
(China)
It is the first fully automated container terminal in China, featuring full intelligence and zero emissions. It is electrically powered and can save more than 25% of energy compared with traditional terminals.
Kaohsiung port
(Taiwan)
With a port design that targets automated terminals, future terminal operators can introduce automated equipment such as automated guided vehicles (AGVs) and remote-control loaders.
Table 2. Literature review of the establishment of SP evaluation indicators.
ItemAnahita et al. [2]Alberto et al. [6]Chen et al. [11]
MethodLiterature AnalysisDelphi MethodLiterature Analysis
Main indicatorsOperation, Environment, Energy, Safety, and SecurityOperational economic, Social, Political, EnvironmentGreenness, Agility, Personalization, Cooperation, Intelligence, Liberalization
Sub indicators68 pcs32 pcs20 pcs
Weighting methodequal distributionexpert consensus-
Study subjects14 international ports10 Spanish ports14 international ports
Table 3. Respondents’ profile.
Job TitleNumberAffiliationJob TenureExpertise
Vice director1Taiwan port authority≥20 yearsPort development planning
Senior manager311–20 yearsPort operation and energy management
Senior engineer3Construction consultant≥20 yearsPort engineering and design
Academia3University professor≥20 yearsLogistics management and environmental assessment
Table 4. Fuzzy comparison measures.
TFNLinguisticTFNLinguistic
1 ˜ = ( 1 , 1 , 1 ) Equal 6 ˜ = ( 5 , 6 , 7 ) Fairly good
2 ˜ = ( 1 , 2 , 3 ) Weak advantage 7 ˜ = ( 6 , 7 , 8 ) Very good
3 ˜ = ( 2 , 3 , 4 ) Not bad 8 ˜ = ( 7 , 8 , 9 ) Absolute
4 ˜ = ( 3 , 4 , 5 ) Preferable 9 ˜ = ( 8 , 9 , 10 ) Perfect
5 ˜ = ( 4 , 5 , 6 ) Good--
Table 5. Classification of the main models of PG.
Main Port Governance Models CharacteristicsPrivateLiberalControlledCentralist
PA typeFull privateLandlordLandlord Tool/Service port
PA powerPrivate powerDevolution/AutonomyControlled devolutionCentralist
PA focusCoreRegionalRegionalCore
PA’s relationsCompetitionCompetitionCooperationIntegration
PA geo-organizationEach port PAEach port PAPA regional fusionOne PA
PA functionsLand managerDevelopmentFacilitatorOperator
PA competition modelLiberalizationLiberalizationLimitationMonopoly
PA managers’ selectionTechnicalMixPoliticalPolitical
PA management/Legal structure control typeMinimalInternal controlFinance and investTotal control
PA natureFull privateGovernment companyGovernment companyGovernment department
PA financingPay to
government
Balanced accountsGovernment aidPublic money
Table 6. The local and global z-scores for each indicator and the decision to pass.
DimensionPreliminary CriteriaScoreZ-ScorePass/Fail
IGCWGC
Operational economicsO-1. Logistics process digitalization171.100.65P
O-2. Degree of mechanical systems automation160.730.73P
O-3. Docking line efficiency140.000.00P
O-4. Use of storage capacity130.37−0.37P
O-5. Number of reception capacity of large ship10−1.46−0.79P
Environmental
protection
E-1. Reduction of greenhouse gas emissions180.950.86P
E-2. Number of automations of environmental quality monitor160.480.45P
E-3. Amount of recycled wasted130.24−0.17P
E-4. Certification of environment management system12−0.48−0.38P
E-5. Degree of ecological protection 17−1.66−1.41F
Energy SustainabilityS-1. Annual electricity and fuel conservation rate211.431.48P
S-2. Number of energy conservation170.610.65P
S-3. Usage of shore power system12−0.41−0.38P
S-4. Certification of energy management11−0.61−0.59P
S-5. Renewable energy production 29−1.02−1.00F
Maritime safetyM-1. Working environment safety231.491.89P
M-2. Navigation aid systems140.000.00P
M-3. Real-time monitor security system140.000.00P
M-4. Hazardous cargo management system13−0.17−0.17P
M-5. Compliance with ISPS training requirements 36−1.32−1.62F
Community serviceC-1. Work environment equality and friendly in the workforce231.221.89P
C-2. Data and information transparency and accessibility180.540.86P
C-3. Connectivity with neighbor community160.270.27P
C-4. Social media engagement8−0.81−1.21P
C-5. Free WIFI service 45−1.22−1.82F
1–4 These four indicators marked as the grayscale bottom failed and were removed from 25 preliminary indicators through the BC method. Thus, 21 indicators remained for the FAHP analysis.
Table 7. Weights and ranking of 21 criteria.
Second LayerThird Layer
DimensionFAHPCriteriaWeightRanking
Operational economics0.3511O-1. Logistics process digitalization0.07684
O-2. Degree of mechanical systems’ automation0.06846
O-3. Docking line efficiency0.12132
O-4. Use of storage capacity0.048610
O-5. Number of reception capacity of large ship0.036011
Environmental protection0.1458E-1. Reduction of greenhouse gas emissions0.06945
E-2. Number of automations of environmental quality monitor0.025113
E-3. Amount of recycled wasted0.029612
E-4. Certification of environment management system0.021714
Energy Sustainability 0.1025S-1. Annual electricity and fuel conservation rate0.04869
S-2. Number of energy conservation0.022015
S-3. Usage of shore power system0.017217
S-4. Certification of energy management0.014718
Maritime safety0.3457M-1. Working environment safety0.10003
M-2. Navigation aid systems0.12701
M-3. Real-time monitor security system0.05488
M-4. Hazardous cargo management system0.06397
Community service0.0550C-1. Work environment equality and friendly in the work force0.023816
C-2. Data and information transparency and accessibility0.012320
C-3. Connectivity with neighbor community0.012819
C-4. Social media engagement0.006121
Table 8. Main indicators between two countries in smart port development.
RankTaiwanSpain
1stM-2. Navigation aid systemsO-1. Logistics process digitalization
2ndM-1. Working environment safetyO-2. Degree in mechanical systems automation
3rdO-3. Docking line efficiencyO-3. Docking line efficiency
16thC-1. Work environment equality and friendly in the workforceM-2. Navigation aid systems
Table 9. Classification of the main models of PG in TPA and SPA.
Main Port Governance Models CharacteristicsTaiwanese Port Authority
(More Like Liberal)
Spanish Port Authority
(More Like Controlled)
PA typeLandlord, but partial hypocrisy 5Landlord based on Latin tradition 6
PA powerDevolutionDevolution
PA focusCore 7
(Only one PA responsible for a whole country)
Regional 8
(46 public interest ports, managed by 28 PAs)
PA’s relationsIntegration 9Cooperation
PA geo-organizationOne PA 10PA regional fusion
PA functionsDevelopmentFacilitator
PA competition modelLiberalizationLimitation
PA managers selectionMixMix
PA managementInternal controlInternal control
PA natureGovernment companyGovernment company
PA financingBalanced accountsOwn receipts
(Set on yearly 2.5% profitability of PAs)
5–10 The variables marked as the grayscale bottom show the difference between TPA and SPA.
Publisher’s Note: MDPI stays neutral with regard to jurisdictional claims in published maps and institutional affiliations.

