Article

Urban Sustainability: Integrating Socioeconomic and Environmental Data for Multi-Objective Assessment

1
Department of Geography and Geology, Eastern Michigan University, Ypsilanti, MI 48197, USA
2
School of Spatial Informatics and Geomatics Engineering, Anhui University of Science and Technology, Huainan 232001, China
3
Inner Mongolia Key Laboratory of Remote Sensing of Grassland and Emergency Response Technic, Inner Mongolia Forestry and Grassland Monitoring and Planning Institute, Hohhot 010020, China
4
Division of GIScience, Faculty of Engineering and Sustainable Development, University of Gävle, SE-80176 Gävle, Sweden
*
Author to whom correspondence should be addressed.
Sustainability 2022, 14(15), 9142; https://doi.org/10.3390/su14159142
Submission received: 31 May 2022 / Revised: 12 July 2022 / Accepted: 13 July 2022 / Published: 26 July 2022
(This article belongs to the Special Issue The New Science of Cities and Urban Growth Sustainability)

Abstract

:
The large concentration of the world’s population in cities, along with rapid urbanization, have brought numerous environmental and socioeconomic challenges to sustainable urban systems (SUS). However, current SUS studies focus heavily on ecological aspects, rely on SUS indicators that are not supported by available data, lack comprehensive analytical frameworks, and neglect SUS regional differences. This paper develops a novel approach to assessing urban sustainability from regional perspectives using commonly enumerated socioeconomic statistics. It integrates land use and land cover change data and ecosystem service values, applies data mining analytics to derive SUS indicators, and evaluates SUS states as trade-offs among relevant SUS indicators. This synthetic approach is called the integrated socioeconomic and land-use data mining–based multi-objective assessment (ISL-DM-MOA). The paper presents a case study of urban sustainability development in cities and counties in Inner Mongolia, China, which face many environmental and sustainable development problems. The case study identifies two SUS types: (1) several large cities that boast well-developed economies, diversified industrial sectors, vital transportation locations, good living conditions, and cleaner environments; and (2) a few small counties that have a small population, small urban construction areas, extensive natural grasslands, and primary grazing economies. The ISL-DM-MOA framework innovatively synthesizes currently available socioeconomic statistics and environmental data as a unified dataset to assess urban sustainability as a total socio-environmental system. ISL-DM-MOA deviates from the current indicator approach and advocates the notion of a data-mining-driven approach to derive urban sustainability dimensions. Furthermore, ISL-DM-MOA diverges from the concept of a composite score for determining urban sustainability. Instead, it promotes the concept of Pareto Front as a choice set of sustainability candidates, because sustainability varies among nations, regions, and locations and differs between political, economic, environmental, and cultural systems.

1. Introduction

Approximately 55 percent of the world’s population (4.2 billion inhabitants) lives in cities (World Bank Urban Development 2020 [1]), and the urban population could add another 2.5 billion people by 2050 (United Nations 2018 [2]). Continued rapid urban expansion brings numerous challenges, such as accelerated demand for affordable housing, transport systems, basic services, and jobs. On the other hand, rapid and unplanned urbanization creates many environmental problems, including deterioration of natural resources, accelerated air and water pollution, climate change, and excessive emission of greenhouse gases (Sarigai et al., 2021 [3]). As a result, the interest in and literature on sustainable urban system (SUS) research have grown exponentially in recent years (Goodwin et al., 2021 [4]).
Urban sustainability is a comparatively new research theme compared to the topic of ecosystem sustainability (Corredor-Ochoa et al., 2020 [5]), which has been at the front of scientific inquiries and societal discussions for decades. A common feature of urban sustainability studies has stemmed from ecosystem or environmental sustainability studies (McPhearson et al., 2016 [6]). For instance, the three-pillar model of ecosystem sustainability consists of the environment, economy, and social system (Costanza, 1991 [7]). This concept of sustainability has been widely accepted in urban sustainability studies and expanded in the context of urban systems. A new dimension of culture has been added and called the four-pillar model (Hawkes, 2001 [8]). Various concepts such as governance (Lozano, 2008 [9]), institutional function (Higgins, 2015 [10]), public health, and community safety (Mapar et al., 2017 [11]) have been gradually added into the dimensions of urban sustainability. However, these cultural, economic, environmental, and social pillars of SUS are measured or modeled relatively independently, like silos (Gibson et al., 2005 [12]; von Edmund, 2012 [13]). To a large degree, these sub-themes of urban sustainability are relatively loosely coupled rather than closely integrated as a whole system based on a conceptual model (Ali-Toudert and Ji, 2017 [14]).
Urban sustainability is an emergent concept for designing inner city-built structures and managing broad urban environments (Batty, 2018) [15]. Architects, urban planners, and civil and environmental engineers have developed many well-known systems to rate and certify sustainable urban development. Good examples include Brandon and Lombardi (2009) [16], Cole and Valdebenito (2013) [17], Benson and Bereitschaft (2019) [18], Sharifi and Murayama (2013) [19], and Ali-Toudert et al. (2020) [20]. Many of these SUS rating systems use multicriteria-based or indicator-based approaches (Chan and Lee, 2019) [21] Chan, 2020) [22]. These green infrastructure-based SUS evaluation systems judiciously select multicriteria in the context of sustainability goals. They focus on articulating the system conceptualization and illuminating the measurability of various system components. However, the final judgment often falls upon a summative score that has difficulty preserving the measurable complexity of SUS. This inner-city structure approach starts from building design and focuses on urban design and its surrounding communities, which is excellent from a civil engineering point of view, but different from the perspectives of socio-ecological, socio-environmental, or coupled human–natural approaches. In addition, renewable energy, and energy efficiency have been added as critical urban sustainability elements in recent years (Lucchi and Buda, 2022 [23]; Razmjoo et al., 2019a [24], 2019b [25], 2021 [26]; Tomoiagă et al., 2013 [27]). Furthermore, the concepts of sustainable development goals (SDGs) have been adopted to achieve a holistic approach for evaluating sustainable development, both for developing and developed countries (Griggs et al., 2013 [28]; Kumar et al., 2017 [29]). SDGs are the prioritized goals or targets for sustainable development at national scales; they include local conditions while complying with internationally accepted norms (Le Blanck, 2015 [30]). For example, the United Nations proposed a large set of sustainable development goals consisting of 17 broad dimensions and 169 interconnected targets based on national priorities (UN-Habitat, 2015 [31]). Most current urban sustainability dimensions and targets are selected or evaluated based on a large set of urban sustainability indicators.
However, several deficiencies have been identified in this exploding volume of literature. First, the large body of current studies ignores major socioeconomic issues such as equity, justice, and public engagement (Sharifi, 2021 [32]). Second, most current SUS assessments rely heavily on selecting and evaluating SUS indicators (Shen et al., 2011 [33]). However, the selections of SUS indicators are often challenged by the limitation of available data, the ambiguity of SUS targets and thresholds, and the lack of a conceptual framework for indicator selection (Verma and Raghubanshi, 2018 [34]). Third, there is general ignorance about national and regional differences in understanding the contextual meanings and interpretations of the SUS assessment (Verma and Raghubanshi, 2018 [34]).
This paper develops a novel and synthetic approach to assessing urban sustainability—called integrated socioeconomic and land-use data mining–based multi-objective assessment (ISL-DM-MOA)—from regional perspectives but with national (and international) comparison considerations. First, this new approach examines SUS by analyzing commonly enumerated socioeconomic statistics and integrating them with land use and land cover data detected from remote sensing technologies. Second, this new method synthesizes SUS dimensional indicators by applying current data mining analytics. Third, it also adopts the popular environmental approach of assessing urban sustainability based on ecosystem service values. Finally, the new approach advocates the notion that SUS should not be a precise quantity, but an evaluation framework that enables assessing the trade-offs of a set of indicators closely related to SUS. However, due to the limitation of data availability, the cultural dimension of urban sustainability was not examined in this study.
The remainder of this paper is structured as follows. Section 2 introduces current urban sustainability measurement methods and related indexes. Section 3 describes our new measurement framework of ISL-DM-MOA. To verify the proposed framework, Section 4 reports a case study applied to Inner Mongolia, China. In Section 5 we further discuss and speculate on the implications of the research. Finally, Section 6 draws conclusions and points to future work.

2. Urban Sustainability and Related Measuring Indexes

From the perspective of evaluating or measuring urban sustainability, the critical terminology in sustainable urban system studies is the notion of sustainability indicators (Huang et al., 2015 [35]; Liu et al., 2018 [36]; Michalina et al., 2021 [37]). Quantifiable indicators are needed to measure progress towards sustainable development in the context of sustainable development goals and targets (Bai et al., 2016 [38]; Liu et al., 2015 [39]; Pupphachai et al., 2017 [40]). These quantifiable sustainable development indicators are called sustainability indicators (SIs) (Cutaia, 2016 [41]). SIs can be some simple socioeconomic indicators like gross domestic product (GDP) or highly complex quantities such as the genuine progress indicator (GPI) and the inclusive wealth index (IWI). GDP is extremely limited in terms of quantifying social welfare and environmental sustainability (Bagstad and Shammin, 2012 [42]). GPI is a national-level measure of economic growth and prosperity and accounts for externalities, such as environmental and carbon footprints, resource depletion, pollution, and long-term environmental damage (Kubiszewski et al., 2013 [43]). IWI is developed as a synthetic indicator to supersede or complement the iconic Human Development Index (HDI) (Dasgupta, 2009 [44]). IWI measures the wealth of nations, including all of the assets from which human well-being is derived, including manufactured, human, and natural capital (Roman and Thiry, 2016 [45]).
Another good example is the City Prosperity Index (CPI) for measuring the overall achievement of a city (UN-HABITAT, 2015 [31]). The CPI is a composite index covering six dimensions of city prosperity: productivity, infrastructure, quality of life, equity and social inclusion, environmental sustainability, and governance and legislation. Each dimension consists of between two and four measurable indicators. CPI can be calculated at four scales: (1) global city ranking for global and regional monitoring; (2) basic CPI as an initial diagnosis that is internationally comparable; (3) extended CPI for in-depth diagnosis that is comparable within a specific country; and (4) contextual CPI that is policy implementation-oriented as an urban monitoring tool. CPI articulates a robust and flexible indicator framework that provides methodological and conceptual solutions for developing a comprehensive index and connecting healthy cities’ indicators with the needs of policy and governance (Wong, 2015 [46]).
The urban sustainability index (USI) is also a type of SI. Numerous indicators have been proposed to measure urban sustainability (Merino-Saum et al., 2020 [47]), and many methods have been developed to calculate USI (Kaur and Garg, 2019 [48]). One GIS remote sensing-based calculation method estimates USI through dynamic ecosystem service values (DESVs) (Liang et al., 2020 [49]). Urban sustainability is the square root of the sum squares of DESVs, GDP, and per capita net income (PCNI) (Fu et al., 2016 [50]; Xue & Luo, 2015 [51]). Although the estimation of DESVs is relatively sophisticated, the ecosystem service value (ESV)-based USI has firm roots in the concepts of ecosystem sustainability and ecological economics. The ESV-USI indicator represents a different perspective of interpreting urban sustainability.
In general, many SIs are based on the statistical data at the national scale and involve a large number of macroeconomic variables. The calculations or definitions of these SIs require much socioeconomic information, which is not enumerated at local and regional scales. As a result, it is hard to use SIs to quantitatively examine cities’ urban sustainability at a regional or provincial scale. On the other hand, ESV-USI describes urban sustainability at a regional scale, prioritizing ecosystem sustainability.
Analytically, there are three groups of analytical methods for examining sustainable urban systems (SUS). The first group consists of multivariate statistics (Verma and Raghubanshi, 2018 [34]). Factor analysis (Huang et al., 2015 [35]) and principal component analysis (Mascarenhas et al., 2015 [52]) are the most useful methodologies. Unfortunately, these statistical analyses are often ad hoc and do not support a coherent and proven methodological design (Zhou et al., 2022 [53]). Many of these statistical methods, such as analysis of variance, principal component analysis, Pearson correlations, multiple regression analysis, and redundancy analysis (Chen and Lu, 2014 [54]) have been adopted. However, the unique insights provided by each analysis and the added values of integrating these analyses have not been addressed.
The second group emphasizes geospatial technologies, including geographic information science, remote sensing, and spatial statistics, which have been increasingly used to model and discern the coupled socio-environmental system (CSES) processes (Anselin and Rey, 2014 [55]; Lechner et al., 2019 [56]; Gupta et al., 2020 [57]). Recent developments in remotely sensed earth observation data are becoming increasingly advantageous in indicator studies because these new data sources add new approaches to detect ecological conditions and land use and land cover changes to support CSES studies (Xie et al., 2008 [58]; Salvati and Carlucci, 2014 [59]; Liang et al., 2020 [49]). These information and system approaches provide richer data and better analytical methods for describing, interpreting, and simulating feedback between subsystems and are less confined within traditional disciplinary domains (Turner and Robbins, 2008 [60]; Li, 2012 [61]). The indicator of ESV-USI is an excellent example of this approach.
The third group focuses on big data analytics (Kong et al., 2020 [62]). Big data analytics includes many techniques, which are re-empowering traditional statistical techniques with big data. For instance, classification, clustering, regression, association rules analysis, and social network analysis are commonly used (Hassani et al., 2016 [63]). Different methods extract information for distinct perspectives and may produce different findings. A good review can be found in the recent work by Kong and his colleagues (2020). However, big data applications in SUS evaluation mainly focus on specific subsystem applications, such as environmental sustainability, public health and safety, social equity, resources, energy utilization, real estate, or retail planning. Many current discussions elaborate on potential advantages and possible future directions for using big data in SUS studies. Comprehensive assessments of SUS based on big data analytics are still missing.

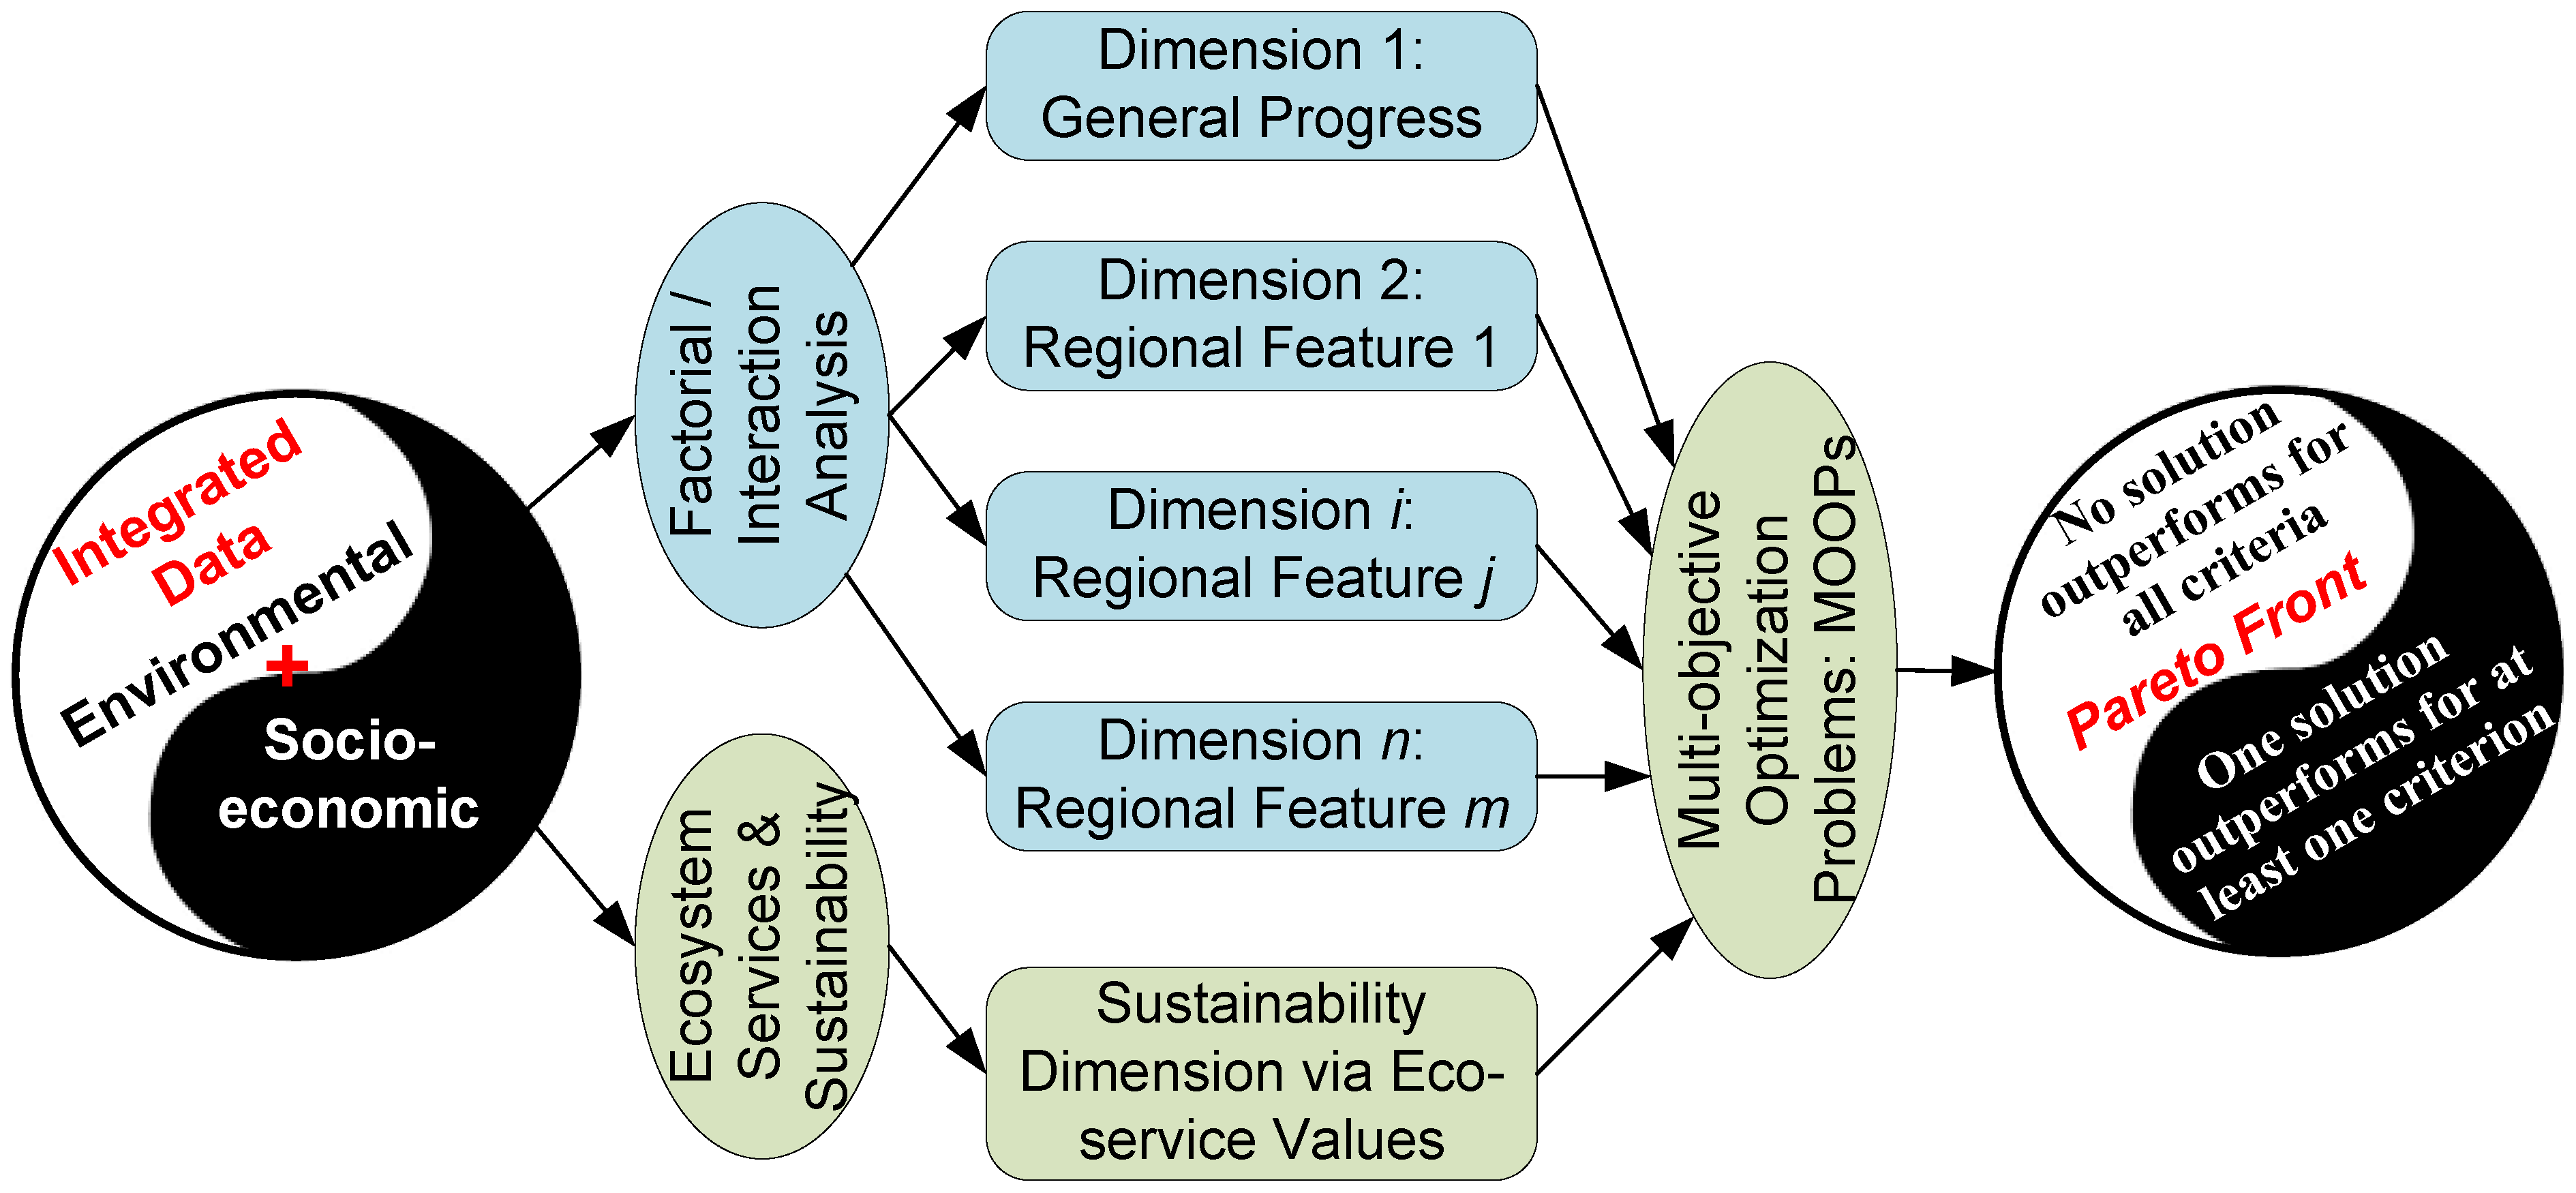
3. The New Method—Integrated Socioeconomic and Environmental Data Mining–Based Multi-Objective Assessment (ISL-DM-MOA)

The ISL-DM-MOA analytical framework is designed based on an integrated socioeconomic and environmental database (Figure 1). Current sustainability indicators (like IWI, GPI and CPI) are computationally sophisticated, require too much data, and are only available at the national level. Data gaps exist between available socioeconomic statistics and the required information for calculating sustainability indicators proposed by the United Nations (Roman and Thiry, 2016 [45]). On the other hand, socioeconomic statistics throughout the world are collected for demographic and economic analyses, educational and human resource planning, and assessing progress toward national and regional objectives. They contain much information about the health and progress of urban development.
On the other hand, the environmental data include land-use-land-cover (LULC) changes, ecosystem service values, and additional related environmental status information, depending on availability. In particular, remote sensing technologies have provided much data about land use and land cover changes (LULC). The socioeconomic statistics in combination with LULC data can provide rich information revealing sustainable or unsustainable urban development. However, they are not collected for computing the sophisticated sustainability indicators advocated by the United Nations. More importantly, the socioeconomic statistics have been collected over a long period, while remote sensing–based LULC data can be traced back to the early 1970s (Xie et al., 2008 [58]). Therefore, socioeconomic statistics and LULC data compose a sizeable urban development dataset and can support a long time-series examination of urban sustainability progress. The ISL-DM-MOA analytical framework deviates from the current indicator approach. ISL-DM-MOA does not recommend a pre-determined set of urban sustainability indicators. ISL-DM-MOA advocates the notion of a data-mining-driven approach to derive urban sustainability dimensions. The availability, completeness, and fine administration or geographic scales of an integrated socioeconomic and environmental database determines the granularity of urban sustainable dimensions. Moreover, ISL-DM-MOA diverges from the concept of a composite score for determining urban sustainability. Instead, ISL-DM-MOA promotes the concept of Pareto Front as a choice set of sustainability candidates because sustainability varies among nations, regions, and locations. The perception and acceptance of urban sustainability differs between political, economic, environmental, and cultural systems. Therefore, beyond the foundation of integrated data, ISL-DM-MOA provides three interconnected analytical functions to realize its implementation. The inspirations, descriptions, and implementation of these functions are provided below.

3.1. Identify Interaction Dimensions Embedded in Regional Integrated Environmental and Socioeconomic Data

The ISL-DM-MOA framework supports assessing SUS over a region, province, or state as a whole. This procedure will apply the commonly used data mining technique of principal component analysis (PCA) to mine how the synthesized socioeconomic and environmental variables interact. PCA has long been an applicable statistical procedure in urban sustainability studies (Mascarenhas et al., 2015 [52]). Large datasets are increasingly common and are often difficult to interpret. PCA is commonly recognized as a technique for reducing the dimensionality of a large dataset and revealing associations between the dimensions and the variables in the large dataset with minimized information loss (Jolliffe and Cadima, 2016 [64]). These dimensions are the newly created factors (principal components) that do not correlate among themselves. Each dimension includes a subset of variables in the original big dataset, while the variables in this subset interact with (or correlate with) this dimension. More importantly, the new dimensions are generated by the dataset in the study, but not a priori. Therefore, PCA is an adaptive data analysis method and an essential big data mining technique (Sarigai, et al., 2021 [3]). It is expected that these PCA-derived dimensions shall approximate the newly proposed indicators, such as genuine progress indicator (GPI), inclusive wealth index (IWI), and city prosperity index (CPI). The GPI, IWI, and CPI indices are built based on the national economic and environmental data that are usually not available at regional or provincial scales. The advantage of PCA is that it can overcome data limitations because it can be conducted with whatever variables are available in a study area. The PCA-generated dimensions or factors synthesize the interactions embedded in the available variables. These dimensions are called derived urban development indicators (DUDI) in the context of SYS studies.

3.2. Ecosystem Service Values and Urban Sustainability Index

As we discussed in the introduction section, evaluating the urban sustainability index (USI) from the perspective of ecosystem service values (ESV) has a long tradition in ecological and environmental studies of SUS. Therefore, the ISL-DM-MOA framework incorporates the concept of ESV-USI and uses remotely sensed land use and land cover data to compute ESV-USI as an ecological method for computing USI. The USI can be calculated in numerous ways (Sharifi and Murayama, 2013 [19]; Mapar et al., 2017 [11]; Ali-Toudert et al., 2020 [20]). The present paper adopts the approach of computing USI based on ecosystem service value (ESV) to assess the integrated interactions and feedback between environmental and socioeconomic systems. It was confirmed that the use of ESV for computing USI is a comprehensive approach to examine the ecological consequences of urban expansion (Liang et al., 2020 [49]).

3.3. Multi-Objective Optimization Analysis—Pareto Front
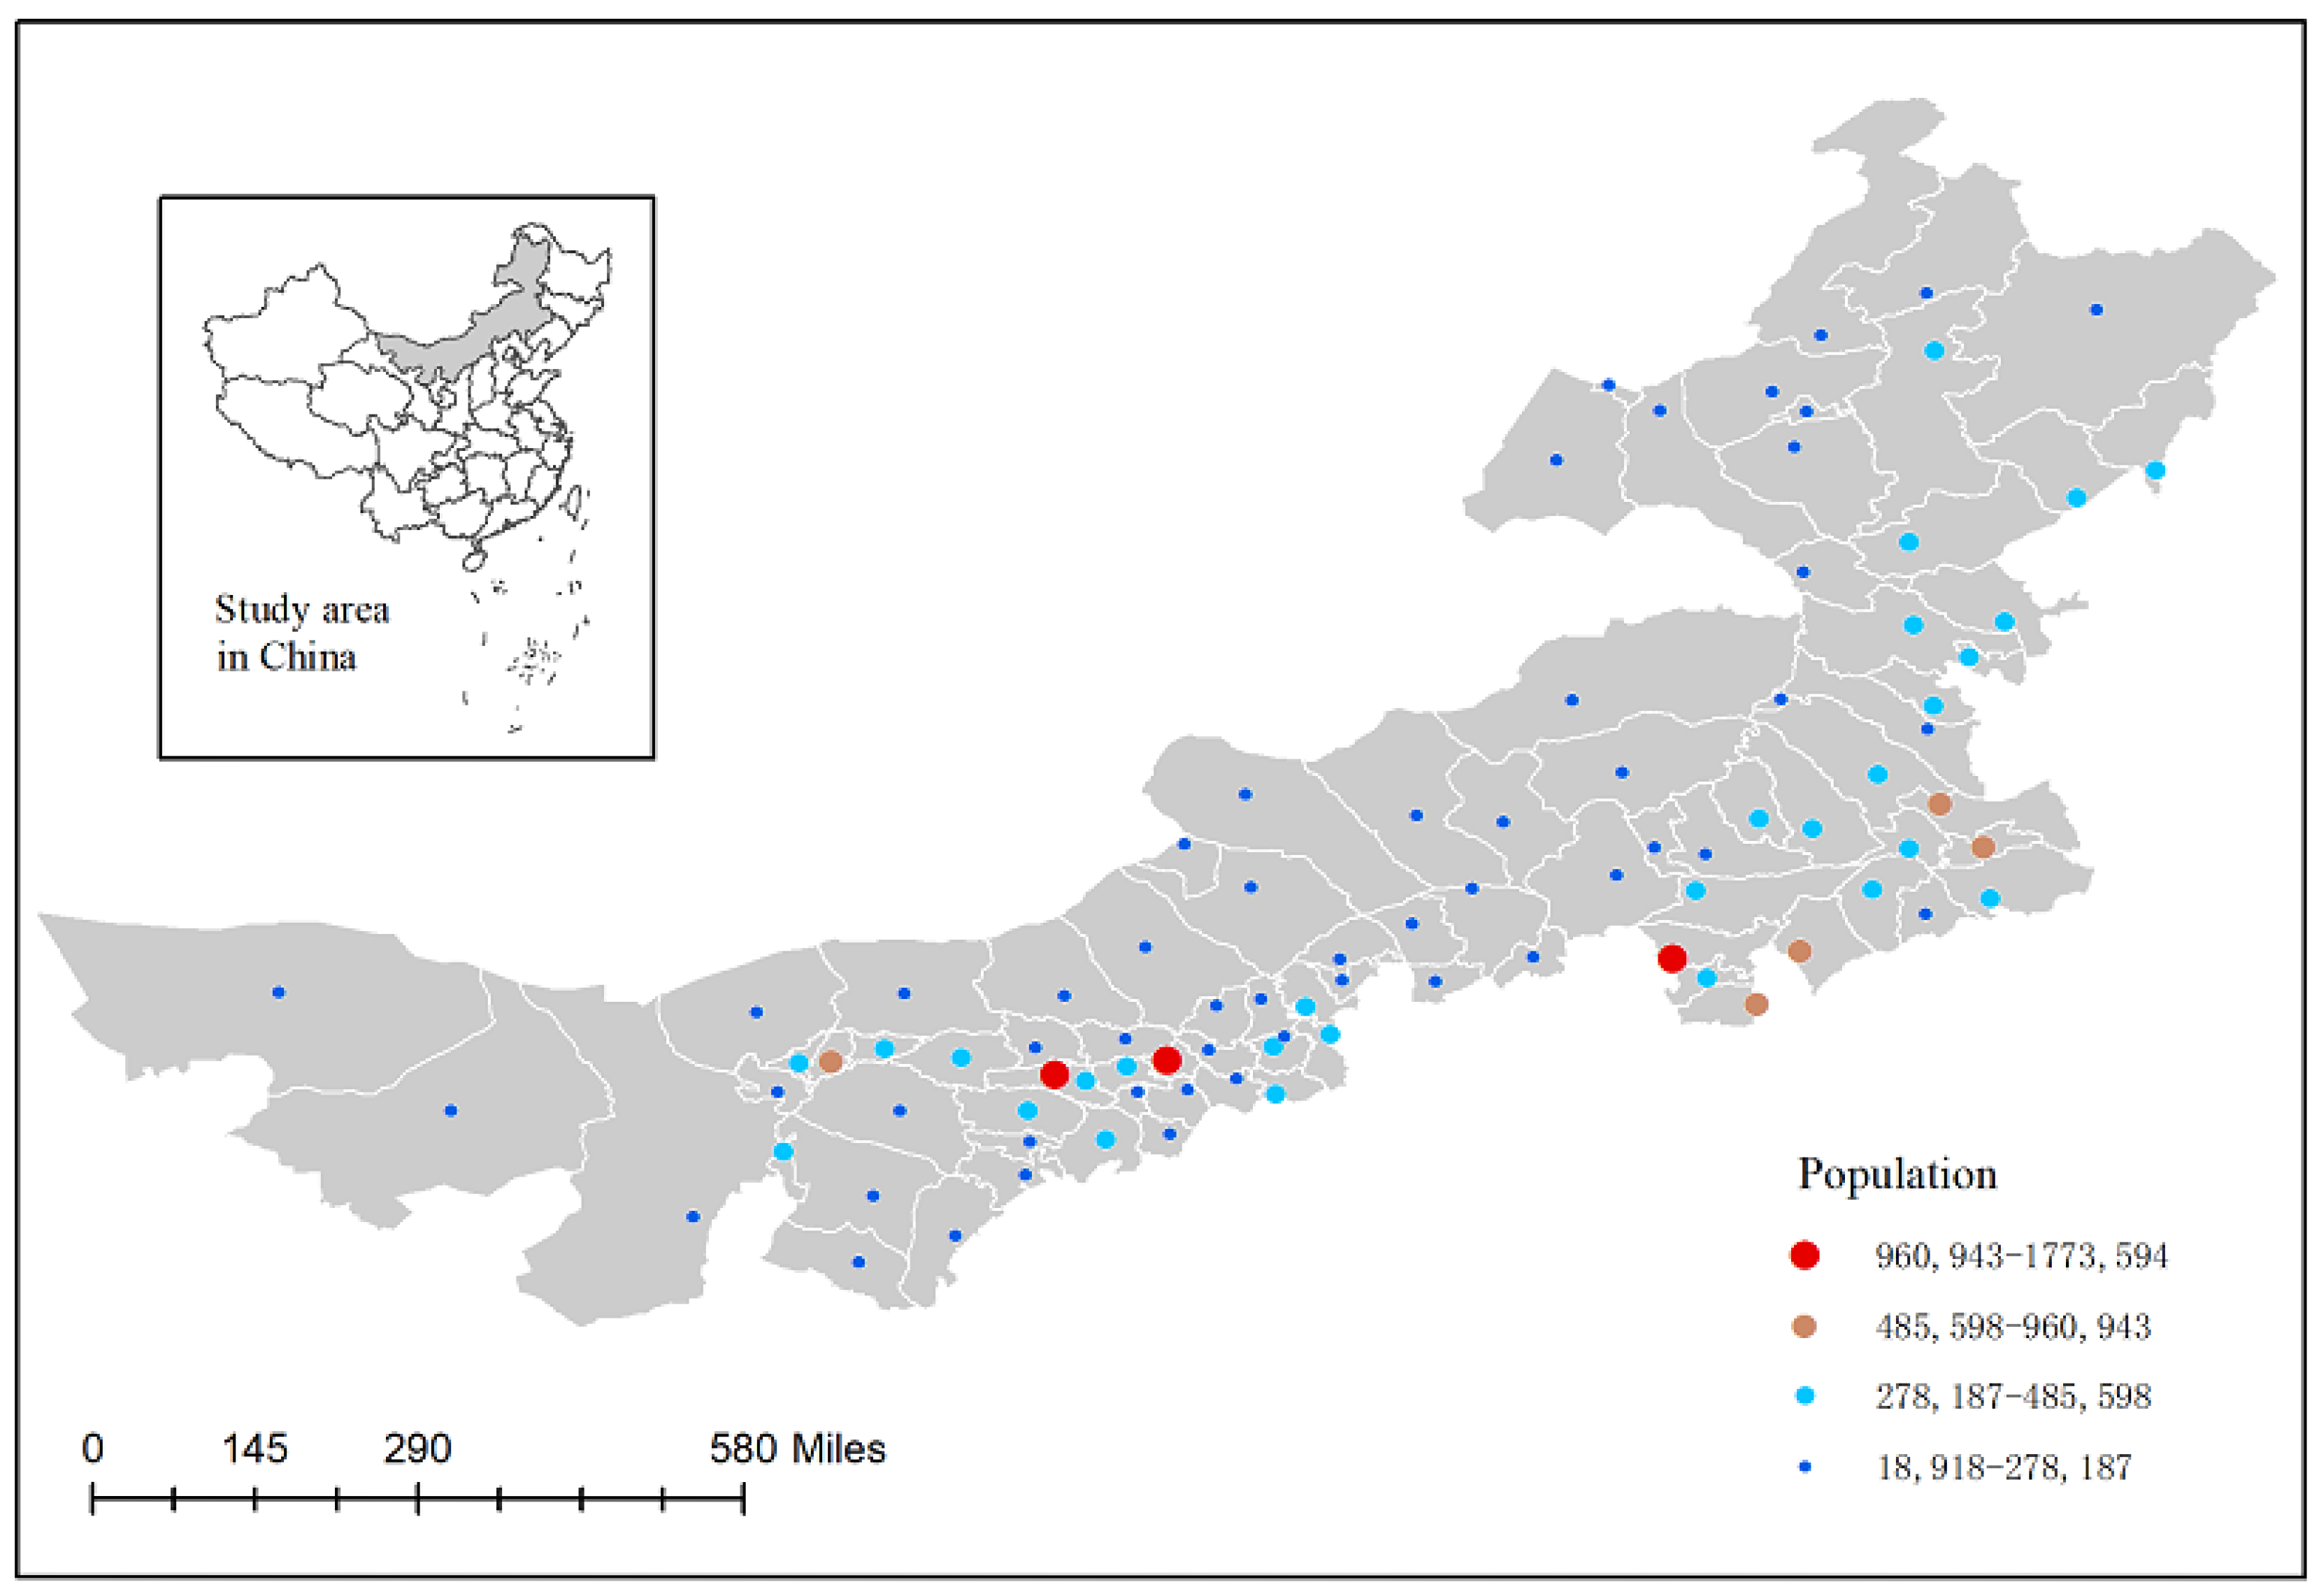
When PCA generates the dimensions (principal components) in a dataset that includes variables of socioeconomics and LULC changes related to sustainable or unsustainable urban development, all of these dimensions are related to urban development. Since the variables are both socioeconomic and environmental, these dimensions are called socio-environmental dimensions. It is difficult to differentiate which dimension is more important in terms of contributing to urban sustainability than any other dimension. Moreover, the USI based on ecosystem service values is a standard ecological method to estimate urban sustainability. ESV-USI is different from the dimensions reflecting urban socioeconomic development and environmental status generated by PCA. Similarly, it is not appropriate to compare ESV-USI with the socio-environmental dimensions in terms of their contribution to or influence urban sustainability. Since all of these indicators are related to urban sustainability, there is a need for a new evaluation approach to evaluate how these indicators relate to urban sustainability.
From the perspective of multi-objective optimization, the socioenvironmental dimensions from PCA and ESV-USI consist of a vector of decision candidates affecting urban sustainability. These decision candidates usually complement or conflict with each other. Consequently, minimizing or optimizing each decision candidate could give a different solution. As a result, the answers to a set of decision candidates comprise a set of trade-off solutions that are considered equally important or optimal. In other words, it could be the case that Solution A outperforms Solution B according to one criterion, but that Solution B is better than Solution A considering another criterion. Therefore, the outputs of multi-objective optimization include a set of optimal but non-dominant solutions, which are often called multi-objective optimization problems (MOOPs). As a result, MOOPs comprise a Pareto front that consists of a set of solutions. One solution outperforms all other solutions for at least one criterion, but will not surpass all other solutions for all criteria.
Multi-objective optimization problems (MOOPs) are a technique specifically developed to find a vector of decision candidates that optimizes an objective function (Longo et al., 2019 [65]). MOOPs are widely adopted in scientific research and engineering application projects, such as water resources utilization (Reed et al., 2013 [66]), gene selection (Rajapakse & Mundra, 2013 [67]), industrial scheduling (Han et al., 2017 [68]), and energy allocation (Tomoiagă et al., 2013 [27]).
Many multi-objective evolutionary algorithms have been developed to solve MOOPs (Deb, 2011 [69]). A mathematical programming method was initially applied to transform MOOPs into single-objective problems. Typical scenarios include the weighted sum method, the Tchebycheff approach, and the boundary intersection method (Zadeh, 1963 [70]; Geoffrion, 1968 [71]). Later, an evolutionary optimization algorithm was adopted to solve MOOPs. As a result, multi-objective optimization began to develop rapidly, resulting in many methods for solving MOOPs. These methods can be roughly divided into two categories. The first category mainly focuses on the Pareto-dominant individual selection and fitness value sharing. Good examples include the multi-objective genetic algorithm (MOGA) (Fonseca & Fleming, 1993 [72]), the non-dominated sorting genetic algorithm (NSGA) (Srinivas & De, 1994 [73]), and the Niched Pareto genetic algorithm (NPGA) (Horn et al., 1994 [74]). The other category mainly emphasizes the non-dominated solutions or individuals in the evolution process to preserve the explicit diversity. Its typical samples include the Strength Pareto evolutionary algorithm II (SPEA-II) (Zitzler et al., 2001 [75]), the non-dominated sorting genetic algorithm II (NSGA-II) (Deb et al., 2002 [76]), the non-dominated sorting genetic algorithm III (NSGA-III) (Deb & Jain, 2014 [77]), and the Pareto envelop-based selection algorithm-II (PESA-II) (Corne, 2001 [78]).
The NSGA-III algorithm was adopted in the present study. Annual Pareto fronts were calculated with four PCA factors of GP (Figure 2)—AP, SLS, and GR and ESV-USI—for 89 counties in Inner Mongolia from 2001 to 2017. GP, GR, and USI should be maximized in Pareto front analysis among the five vectors, while AP and SLS should be minimized. Take the multi-objective problem of minimization as an example. The vector f ¯ X ¯ = f 1 X ¯ , f 2 X ¯ , , f n X ¯ consists of n objective components f i X ¯ i = 1 , , n , and two decision variables X ¯ u and X ¯ v are arbitrarily given. For i 1 , , n , when f i X ¯ u < f i X ¯ v , then X ¯ u dominates X ¯ v . For i 1 , , n , when f i X ¯ u f i X ¯ v , and there is at least one f j X ¯ u f j X ¯ v , j 1 , , n at the same time, then X ¯ u weakly dominates X ¯ v . Under the constraints of the above conditions, we screened 89 counties by years to obtain the corresponding city set (that is, the Pareto front) and then counted the occurrences of each of 89 cities and counties in the Pareto front from 2001 to 2017. Based on the occurrences, these cities and counties’ urban sustainability status was assessed.

4. The Case Studies

The Inner Mongolia Autonomous Region (IMAR) (37°24′~53°23′ N, 97°12′~126°04′ E) is located on the northern border of China and the southern portion of the Mongolia Plateau, with a total area of about 1.18 million km2 (Figure 3). The average elevation of the study area was 1000–1200 m, and it is predominantly covered by the temperate steppe. The terrain is flat, with the Greater Khingan Range in the east and Yinshan and Henan Mountains in the south. The climate in the steppe area is a typical temperate continental climate, with an annual precipitation of 50–450 mm and an annual average temperature ranging from −1 °C to 10 °C. The weather gradually transitions from humid and semi-humid in the east to semi-arid and arid in the west. The average precipitation decreases from the northeast to the southwest, but the temperature increases. The whole area extends diagonally from the northeast to the southwest in a long and narrow shape. The IMAR temperate grasslands account for about 67 percent of the region’s total area and 22 percent of the grassland area of China.
Together, IMAR and Mongolia comprise one of the most extensive remaining grasslands in the world. The study area covers all 89 banners (counties) in IMAR. IMAR grassland has witnessed severe degradation due to excessive population growth and economic development in recent decades. For example, IMAR witnessed dramatic economic growth from 2000 to 2017. Although the total population increased by almost 9.35 percent during this period, from 23.10 million to 25.26 million, the GDP increased 1040.87 percent, from 14.26 billion Chinese Yuan in 2000 to 16.28 trillion Chinese Yuan in 2017 (IMAR Statistical Bureau, 2001–2018 [79]). Livestock numbers increased by 127.9 percent, from 49.36 million sheep units in 2000 to 112.50 million units in 2017. The urban construction area increased 114.23 percent from 2000 to 2017. The excessive socioeconomic activities and urban expansion have threatened the grassland ecological security and urban sustainability development. Therefore, IMAR is one of the best sites in which to study coupled human and natural systems due to its fragile semi-arid environment and excessive human activities (Brown, et al. 2013 [80]).
The data of LULC primarily came from the NASA MCD12Q1 Data Product (https://lPCAac.usgs.gov/products/mcd12q1v006/, 15 January 2022) at 500 m resolution. Sixteen out of the 17 International Geosphere-Biosphere Program LULC types were found in the study area (the exception was “Evergreen Broadleaf Forest”) (http://www.igbp.net/, 15 January 2022). However, the urban land areas in the NASA MCD12Q1 Data Product were the values in 2000, and no further updates were provided. Therefore, we replaced the urban land data in the NASA MCD12Q1 Data Product with the yearly urban and build-up impervious surface data (Gong, et al., 2019 [81]). This dataset is open-source and can be downloaded from http://data.ess.tsinghua.edu.cn, 15 January 2022.
The socioeconomic variables were extracted from the statistic yearbooks of the IMAR from 2000 to 2017 (IMAR Statistical Bureau, 2001–2018 [79]). The variables included total area, population, rural population, arable and grazable area, grain production, livestock, length of highway, farming income, GDP, local government revenue, governmental investment, retail, infrastructure, and social capitals. There are 31 variables in total, and the explanations of these variables are provided in Table 1. The z-scores are applied to standardize these variables for statistical analysis. (Note: The classification of population is based on the head/tail breaks (Jiang 2013 [82]) in order to show the inherent hierarchy or living structure of the cities.)
The analytical method proposed in the paper is a synthetic approach consisting of three analytical methods: (1) principal component analysis to identify interaction dimensions embedded in the regional integrated environmental and socioeconomic data; (2) ecosystem service value-based urban sustainability assessment for a precise accounting of ecosystem functionalities for urban sustainability; and (3) a multi-objective optimization problems (MOOPs) solution to evaluate how socioeconomic interactions and ecosystem service functions impact regional urban sustainability.

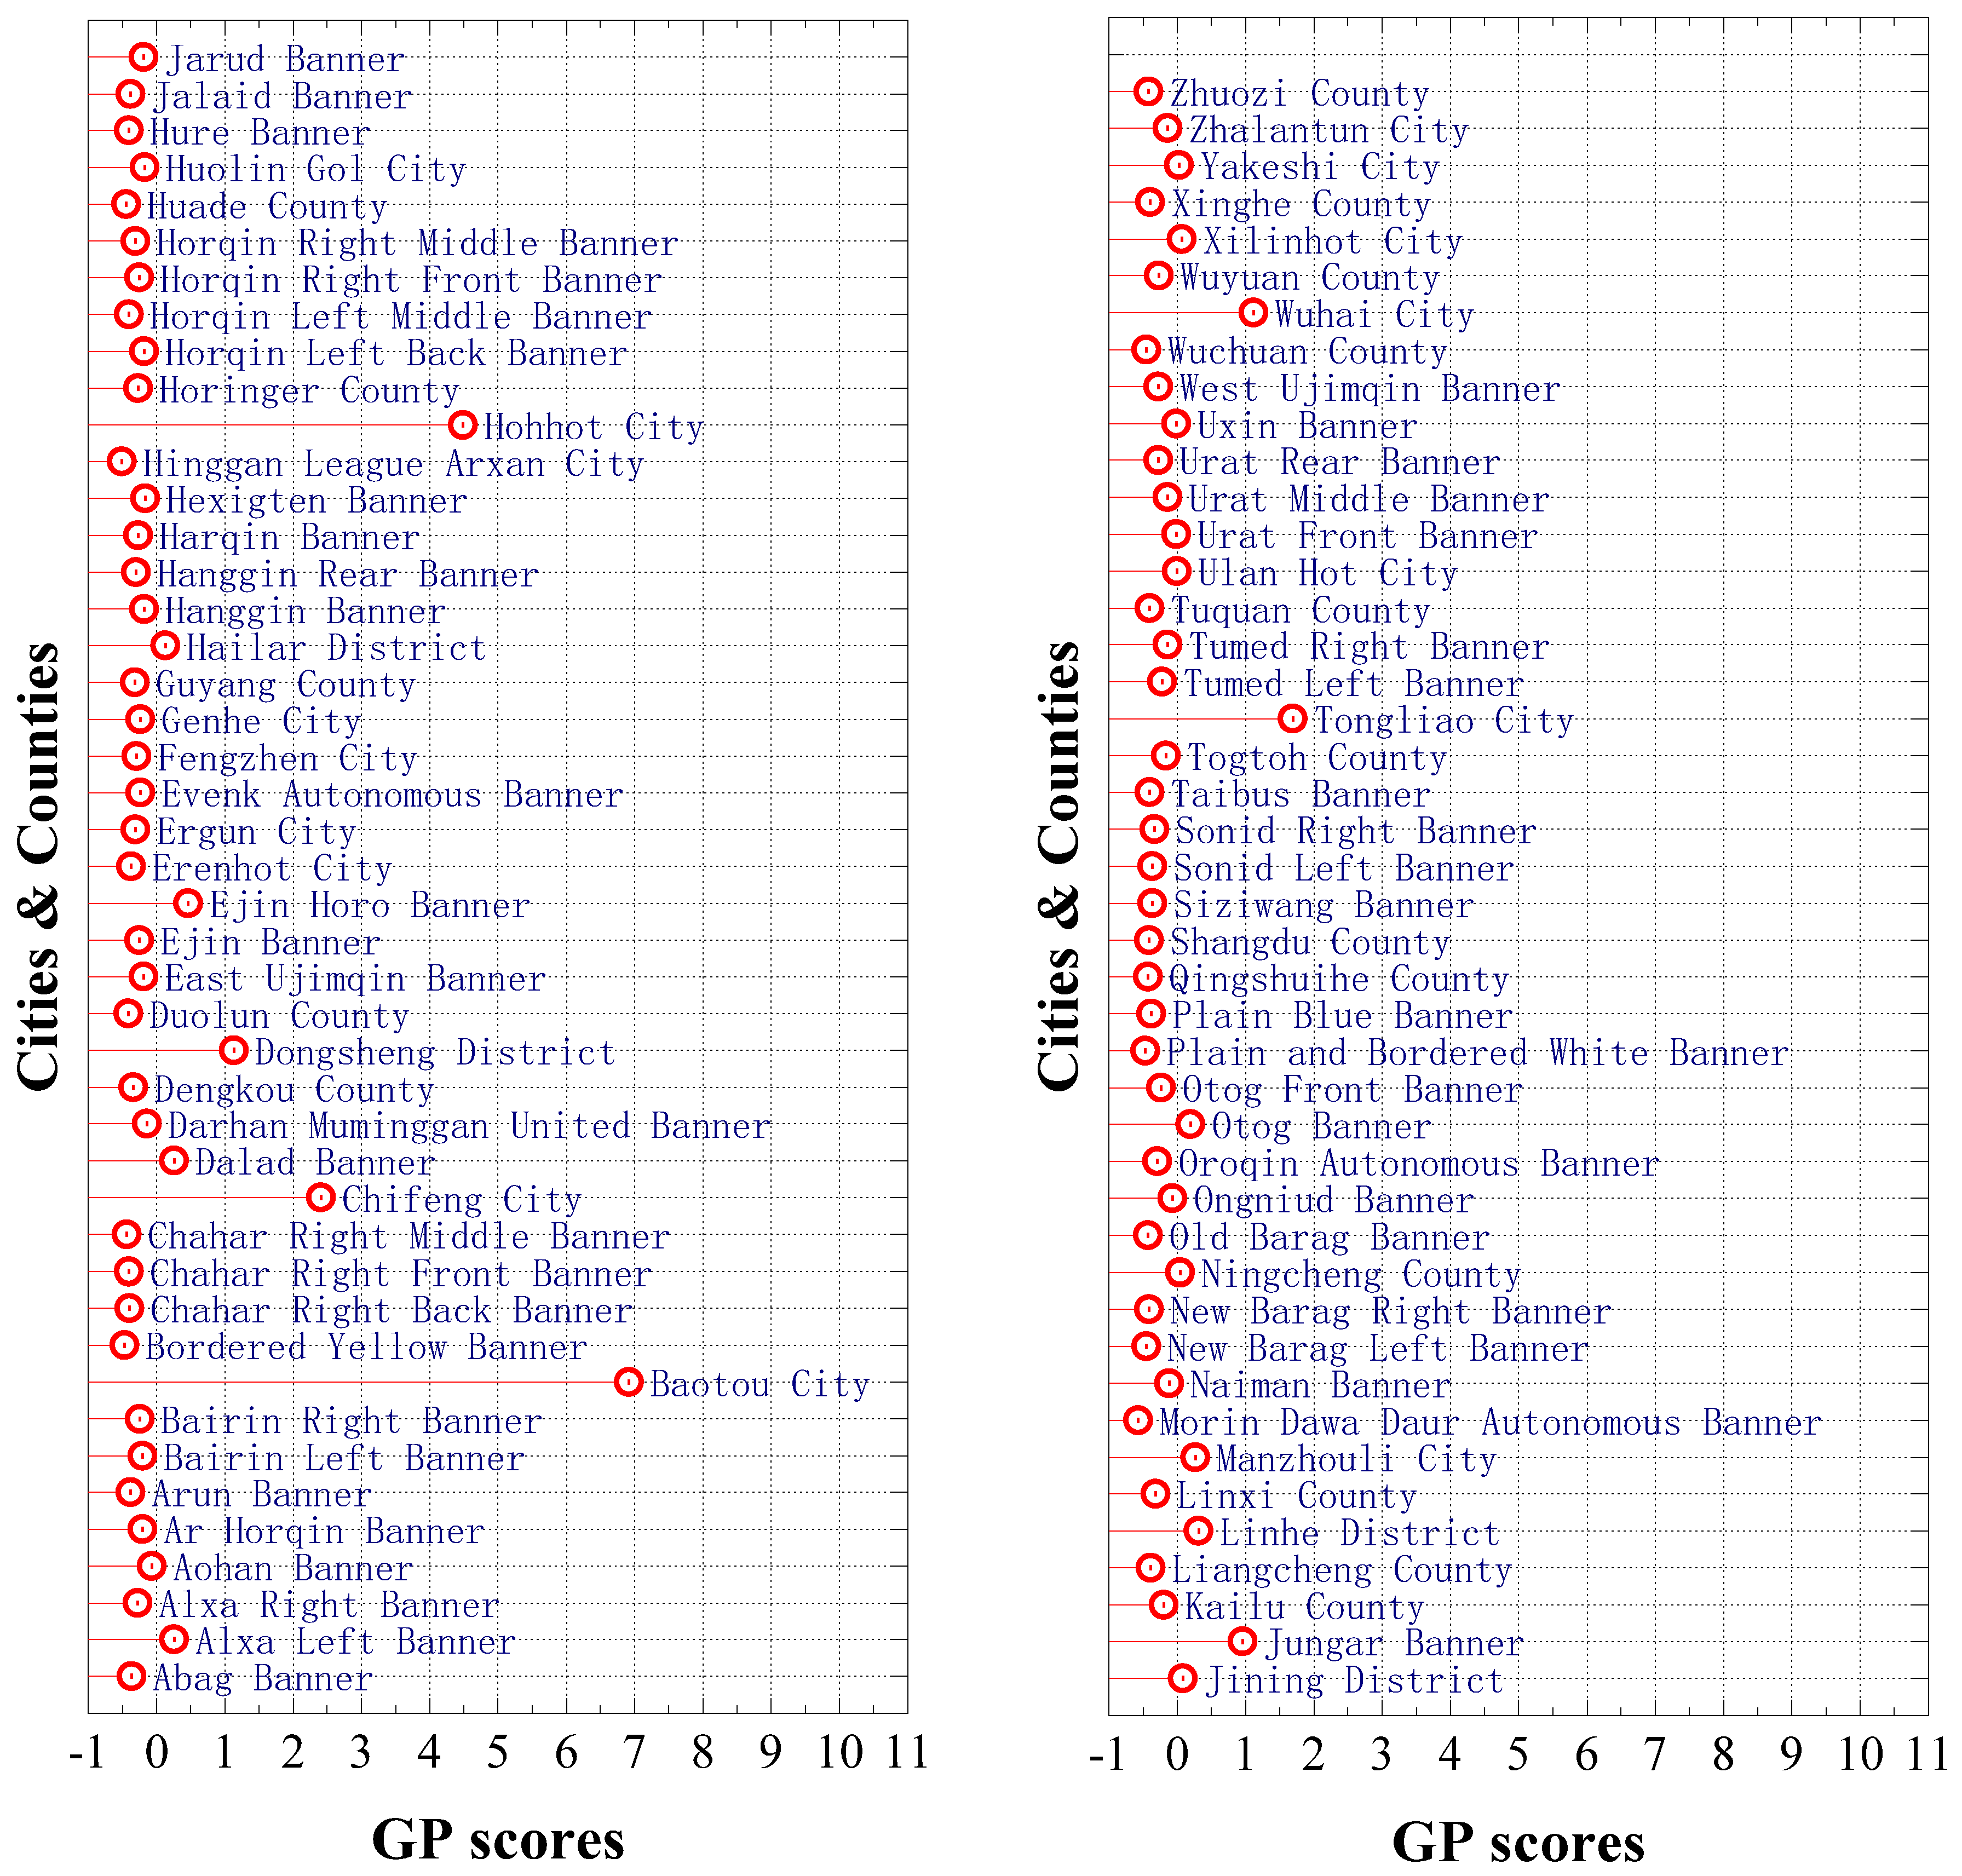
4.1. PCA and Four Derived Urban Development Indicators (DUDI)

PCA generated four dimensions (factors) with the eigenvalues larger than 1.0, which is the common criterion for determining how many dimensions are chosen to explain the total variance in the original data. Four dimensions had >1.0 eigenvalues and cumulatively explained 81.26 percent total variance (Table 2).
Furthermore, the PCA rotated component matrix exhibited how the variables in the original data interacted in each dimension (factor) (Table 3). Eleven variables interrelated with Dimension 1 (D1) and explained almost half (46.77 percent) of the total variance. The variables included gross domestic production (zgdp), tertiary industrial output (zTIO), secondary industrial output (zSIO), fixed assets investment (zfai), local government revenue (zlgr), per capita disposable income of permanent urban residents (zPCUREI), total consumer retail value (zTCRV), number of health and medical professionals (zHMP), number of professional and technical employment positions (zPTE), number of middle and high school teachers (zMHT), and total population (zPP). Obviously, D1 represented the development progress in production, wealth, commerce, health, technology, education, and human resources. Therefore, D1 was analogous to the genuine progress indicator (GPI) and was named “General Progress” in this paper.
Six variables interacted with Dimension 2 (D2), and all of them were various indicators reflecting agricultural growth. Thus, D2 indicated the agricultural growth dimension. Three variables (the total length of highway—zloh, urban land percentage—zUrban, and the amount of livestock—zls) reflected the stress or consumption of natural land supplies. They were interrelated with Dimension 3 (D3), which revealed the land resource consumption. Dimension 4 (D4) related to a single variable, grassland percentage (zGrass), and thus represented the grassland resource dimension.

4.2. Ecosystem Service Value-based Urban Sustainability Index (ESV-USI)

The values of USI by years and banners (counties) were calculated based on the formulas and parameters developed for assessing sustainable urban development in the same study area by Liang and colleagues (2020) [49] and using the yearly land-use data compiled for this paper (Table 4).

4.3. The Results of Multi-Objective Optimization Problems Solution—Pareto Front Analysis

The PCA and the USI analyses generated five composite indicators that were closely related to the sustainable conditions of urban growth: general progress (GP), agricultural progress (AP), stress on land supply (SLS), grassland resource (GR), and urban sustainability index (USI). These indicators interacted in different ways with sustainable urban states. For instance, GP reflected the general socioeconomic health of urban development and was a positive sign of sustainable urban development. Thus, GP is a maximization function in PFA. AP, in general, had negative feedback with sustainable urban growth in IMAR because grazing was the primary economic activity that fitted with the grassland ecosystem (Li and Xie, 2013 [83]). AP consisted of a minimizing function in PFA, and SLS negated sustainable urban growth and was a minimizing function.
On the contrary, GR was the most important natural resource in IMR and should be preserved toward ecosystem sustainability. Therefore, GR comprised a maximization function in PFA. Furthermore, USI was an eco-economic indicator of urban sustainability with joint consideration of urban economic development and LULC consumption. Hence, USI should be a maximization function in PFA. The discussions above further confirmed no absolute solutions concerning which of the five composite indicators was more decisive in determining sustainable urban growth. They were a set of trade-off solutions in which no one was dominant, but merely consisted of a trade-off included in PFA.
Eighty-nine cities and counties in IMAR were evaluated from 2001 to 2017 through PFA with five functions of GP, AP, SLS, GR, and USI. We report the positions of 89 cities and counties falling within the Pareto Front for 17 years in Table 5 and Figure 3.
Overall, the urban sustainability states in IMAR gradually worsened. A good number of cities and counties were within the Pareto Fronts (PFs) before 2010. However, the number of the PFs entries decreased sharply after 2010. In particular, some traditional large pastoral banners and cities, such as East Ujumqin Banner, Jarut Banner, and Xilinhot City were no longer in PFs. After 2010, only a few cities, such as Baotou, Chifeng, and Jining, remained in PFS because they were large cities with rich ecological resources, comprehensive and robust economic foundations, and balanced urban economic development. The inaugural year of China’s ecological compensation policy launched in IMAR was 2010 (Chen et al., 2017 [84]; Deng et al., 2017 [85]). However, it was surprising that this year marked a turning point of deteriorating urban sustainability. In other words, this policy did not promote healthy recovery of regional ecology and balanced economic development in traditional animal husbandry banners. These traditional grazing banners were known for their rich mineral resources. In economic transformation, industrial development and mining activities were the main streams. The newly established industrial and mining parks and subsequent expansion of cities and towns further damaged grassland resources. They generated a severe negative impact on the sustainable utilization of grassland and other natural resources (Liu et al., 2021 [86]). Over the past three decades, but especially in the past 10 years, the development of coal mines in the Inner Mongolia Autonomous Region has contributed to economic growth, grassland destruction, and ecological deterioration.
The top five cities and banners that often fell within PFs are analyzed below to illustrate sustainable urban growth in IMAR. The most frequent city in PFs is Baotou City, located in the western part of the Inner Mongolia Autonomous Region, bordering Mongolia to the north, the Yellow River to the south, the Tumochuan Plain to the east, and the Hetao Plain to the west. In 2005, Baotou became the first batch of civilized cities in China. Baotou is an important hub connecting North China and Northwest China, a key development area for the country and Inner Mongolia to open up to the outside world. Along with Hohhot and Ordos, Baotou constitutes the most vigorous development area in Inner Mongolia. Baotou has won many awards and titles, including the United Nations Habitat Award, the Chinese Living Environment Model Award, the National Forest City, the National Garden City, the National Sanitary City, the Third China Environment Award, the National Soil and Water Conservation and Ecological Environment Construction Demonstration City, and the China Excellent Tourism City. Baotou has the largest steel, aluminum, equipment manufacturing, and rare earth processing enterprises in Inner Mongolia. It is a vital energy, raw material, rare earth, new coal chemical and equipment manufacturing base in the country and Inner Mongolia. It is also one of the 20 most suitable cities for industrial development and one of the 50 best cities in the national investment priorities. Baotou is the leader in sustainable urban development in IMAR, because Baotou is notable in terms of industrial development, environmental governance, and per capita income.
The second most frequent city in PFs is Chifeng City. Since 2000, GP, AP, and USI have displayed continuous increases. However, GR declined, and as a result, SLS increased. Chifeng City is the most populous city in IMAR. The grassland reclamation areas in Chifeng from 2000 to 2009 were the largest in the region. The number of livestock has also shown an increasing trend since 2000; urban expansion was dramatic, and industrial development was at the autonomous region’s forefront. Clearly, GP was the primary function that placed Chifeng City in PFs numerous years since 2001. On the other hand, according to the indicators of GR and SLS, there are questions regarding the urban sustainability in Chifeng, which will be discussed below.
Jining District, the third most frequent city in PFs, is the capital city of Wulanchabu League. It is located in “the Golden Triangle” junction between the Bohai Rim Economic Circle, the “Hubao’e” Economic Zone, and the “Wudazhang” Great Wall Economic Belt. Among the 12 league cities of IMAR, Jining is the closest one to the national capital Beijing. As a result, Jining is the transportation hub that connects the three major economic zones of North China, Northeast China, and Northwest China. It is also an essential passage to Mongolia, Russia, and Eastern European countries. Thus, it is an important node city of the national “Belt and Road” strategic planning initiative and the China-Russia-Mongolia Economic Corridor. Jining has made rigorous progress in sustainable urban development. It has been described variously as a “National Greening Model County (District)”, “National Garden City”, and “National Sanitary City”. It is also known as the “Beautiful Garden City Built on Basalt”. In particular, with the strategic opportunity of the integrated development of Beijing-Tianjin-Hebei and the active construction of the inland port by connecting the Tianjin Port, Jining has reached the forefront of undertaking industrial transfer from developed areas such as Beijing-Tianjin-Hebei to China’s hinterland. Therefore, Jining enjoys the preferential policies of the development of the western region, regional autonomy for ethnic minorities, and support for the development of deeply impoverished areas. Jinin City was constantly ranked high in the Urban Sustainability Index (USI), which was the most important driving function to place it in PFs.
Ejinna Banner is the fourth most frequent county in PFs. However, Ejinna is a small banner with a permanent population of 20,000–30,000 people and therefore has a small urban area. Ejinna has a mixed agriculture and grazing economy. Its natural grassland area is about 120 million mu, which is the largest grassland area among the three banners in the Alxa League. Agriculture is mainly concentrated in the areas with irrigation, and the main products are cantaloupe and cotton. In addition, Ejinna has a border port, called Ceke. This port is the third largest inland port between China and Mongolia and also plays a positive role in promoting its economic development. In recent years, tourism around the “Euphrates Forest, Juyanhai Lake, and Black City” has flourished, which has promoted the popularity of Ejinna and driven the development of the surrounding economy. The entry of Ejinna into PFs were mainly driven by its good values in GR and USI.
The East Ujimqin Banner boasts a large natural grassland area of 59.41 million mu. Grassland vegetation cover there is better than the adjacent West Wuzhu Muqin Banner (many open-pit coal mines, including the famous Baiyinhua Coal Mine). East Ujimqin is a premium animal husbandry banner that manages its natural grasslands well. The number of livestock in the stock has consistently ranked among the top five banners in IMAR. In recent years, the number of horses raised has gradually increased. The per capita net income of farmers and herders has been on the top banner in IMAR. On the other hand, urban expansion in East Ujimqin is not apparent overall. At the same time, the economic growth rate is relatively stable compared with other banners in IMAR, which have sought fast economic growth rates. GR has been the factor contributing most to its entry into PFs.

5. Implications of the Study

The study area of IMAR is located on the southern portion of the Mongolian Plateau, which faces many problems in terms of the environment and sustainable development. For example, rapid urbanization, fast population growth, grassland degradation and desertification, over-grazing, unplanned and uncontrolled mining, soil erosion, and water pollution have caused severe environmental and social consequences in IMAR (Brown et al. 2013 [80]; Wu et al. 2015 [87]). IMAR has faced a constant increase in urban construction, cultivated land, and rural residential land and a decrease in grasslands and water bodies (Xie et al., 2021 [88]). Therefore, IMAR is an excellent site for measuring SUS. Our case study confirmed this finding. Especially since 2010, the SUS status has dramatically worsened. Ironically, 2010 marked a significant policy change in the study area, as the ecological compensation policy was enacted (Deng et al., 2017 [85]). Unfortunately, between 1987 and 2015, water resource use in IMAR increased four-fold, energy consumption increased approximately seven-fold, and large areas of natural grasslands were converted to agricultural, industrial, and urban land use (Shang et al.,2019 [89]). These trends have continued, even after implementation of the eco-compensation policy in 2010.
Moreover, the IMAR case study identified two types of SUS systems. The first group includes large cities such as Baotou, Chifeng, Jining, Wuhai, and Hohhot. They boast certain common characteristics, including a well-developed economy, diversified industrial sectors, vital transportation location, good living conditions, and a clean environment. They represent successful modern urban growth and development. The second group consists of small counties such as Ejinna Banner and East Ujimqin Banner. These counties have a small population, small urban construction area, large natural grassland stretches, and a primary grazing economy. They are largely traditional rural economic counties with little industrial growth. This type of sustainable urban development aligns well with the conservation point view of sustainable urban development (Kowarik et al., 2020 [90]). In short, the integrated ISL-DM-MOA framework identifies what cities and counties display sustainable urban growth and can examine comprehensive trade-offs among several critical sustainability dimensions that available data can support. Therefore, this analytical framework can analyze SUS involving many integrated ecological, environmental, and socioeconomic variables. ISL-DM-MOA strongly recommends that urban sustainability should be assessed based on local or regional conditions (Tanguay et al., 2010 [91]). Only at a fine geographical scale is the SUS assessment meaningful to guide policy decisions.
As shown above, the analytical framework is shown to be of value for effectively assessing SUS, as it involves many variables from the perspectives of ecology, he environment, and even socioeconomics. What are the next steps? Logically, we would like to see our cities or communities become more sustainable or more livable. So far, this study has not offered a solution or direction regarding how the cities should be developed, despite its effectiveness in assessing SUS. This observation adds a potential limitation of the study or this kind of analytical study in general. This kind of analytical study is developed according to the present sustainable paradigm, the one-sided technical notion of sustainability, which may sound technically good on one hand but is very one-sided on the other, according to Alexander (2004) [92]. There is an alternative, perhaps better, sustainable paradigm based on morphogenesis or living structure (Alexander 2004 [92], Alexander 2002–2005 [93]) under which our interaction with the land or the Earth’s surface is treated as a sacrament.
Living structure is a physical phenomenon that exists pervasively in surroundings such as rooms, buildings, gardens, streets, and cities. It consists of numerous recursively defined substructures with an inherent hierarchy. Across different levels of the hierarchy, there are far more small substructures than large ones, yet on each level of the hierarchy, substructures are more or less similar in size. Living structure is conceived under the third view of space: space is neither lifeless nor neutral, but a living structure capable of being more living or less living (Alexander 2002–2005 [93]). Seen from the perspective of a living structure, sustainability is about making the Earth’s surface living or more living. Note that the notion of livingness can be objectively or structurally measured and quantified (Jiang and de Rijke 2022 [94]), assessed from a holistic point of view of space. Under the notion of living structure, many urban issues, such as sprawl, traffic, and social segregation, are inevitable outcomes of the underlying living structure. In other words, the underlying living structure needs to be developed further. Under the notion of living structure or the third view of space, we no longer fragmentedly consider individual issues or parameters but holistically make and remake the Earth’s surface living or more living. This is a new kind of city science (Jiang 2022 [95]), a sort of generative science that deals with not only the understanding of city structure and dynamics, but also—probably more importantly—sustainable urban planning and design towards a sustainable society. This speculation points to our future work on urban sustainability.

6. Conclusions

The new urban sustainability framework, ISL-DM-MOA, innovatively synthesizes currently available socioeconomic statistics and environmental data as a unified dataset to assess urban sustainability as a coupled human–nature system or a total socio-environmental system (Xie et al., 2019 [96]). ISL-DM-MOA uses socioeconomic statistics that are officially published annually by census bureaus or statistical bureaus and integrates them with environmental data extracted from remotely sensed images. ISL-DM-MOA breaks the strict definitions of current comprehensive SUS indicators. It acknowledges that urban sustainability is not a universal measurement; it varies at different geographical scales. It varies between continents, nations, regions, and communities. The ISL-DM-MOA framework adopts PCA’s data mining technique to derive underlying urban sustainable development or economic growth dimensions based on available coupled regional economic-environmental dataset. These PCA-derived dimensions approximate the current comprehensive SUS indicators and add additional aspects of sustainable urban growth. In addition, this framework integrates two dominant SUS research approaches: the comprehensive indicators and the ecosystem services. Therefore, this framework extends the current evaluation of SUS from the national scale to a regional scale by bridging the data gaps required to calculate SUS indicators.
Furthermore, the ISL-DM-MOA framework promotes a new vision of urban sustainability. Urban sustainability is a complex and dynamic state of urban development (Batty, 2013 [97]). Urban systems as complex human-natural systems consist of numerous demographic, ecological, environmental, socioeconomic, and political (policy) processes that form various levels of reaction chains. These interconnected chains determine why some subsystems correspond to other subsystem changes, because these subsystems coexist and interact together to create causal structures to determine positive or negative trade-offs between them. Therefore, the SUS measurement is neither a precise value nor a single modeling function. A meaningful SUS evaluation involves assessing trade-offs among a set of urban sustainability factors, goals, or targets. In other words, urban sustainability involves a set of choice candidates that are derived from an integrated socioeconomic and environmental dataset, which is available in a study area. As a result, ISL-DM-MOA advocates that the perception and acceptance of urban sustainability differs among different political, administrative, historical, and cultural systems. The paper has made an excellent empirical case study of the ISL-DM-MOA framework in IMAR.
However, the ISL-DM-MOA framework is the first experiment of this type of urban sustainability assessment. Due to the data availability and the complexity of urban sustainability, many elements of urban sustainability, such as the cultural dimension and renewal energy, are not examined by the current framework. Although this framework is open to all available data and information by its design, the next steps are more tests and validation studies. Moreover, since this approach breaks with two currently popular practices of using indicators and comprehensive scoring methods, it is currently challenging to compare this framework with other similar urban sustainability studies.

Author Contributions

Conceptualization, Y.X., C.L., S.C. and B.J.; Data curation, C.L.; Formal analysis, Y.X., C.L. and S.C.; Investigation, Y.X., C.L. and B.J.; Methodology, Y.X., C.L., S.C. and B.J.; Validation, Y.X., C.L., S.C. and B.J.; Visualization, Y.X., C.L., S.C. and B.J.; Writing—original draft, Y.X., C.L. and B.J.; Writing—review & editing, Y.X., C.L., S.C. and B.J. All authors have read and agreed to the published version of the manuscript.

Funding

This research received no external funding.

Informed Consent Statement

Not applicable.

Data Availability Statement

The data presented in this study are available on request from the corresponding author.

Conflicts of Interest

The authors declare no conflict of interest.

References

  1. World Bank Urban Development. 2020. Available online: https://www.worldbank.org/en/topic/urbandevelopment/overview#1 (accessed on 29 December 2021).
  2. United Nations 68% of the World Population Projected to Live in Urban Areas by 2050. Available online: https://www.un.org/development/desa/en/news/population/2018-revision-of-world-urbanization-prospects.html (accessed on 26 June 2022).
  3. Sarigai, E.; Yang, J.; Zhou, A.; Han, L.; Li, Y.; Xie, Y. Monitoring urban black-odorous water by using hyperspectral data and machine learning. Environ. Pollut. 2021, 269, 116166. [Google Scholar] [CrossRef] [PubMed]
  4. Goodwin, K.; Wiedmann, T.; Chen, G.; Teh, S.H. Benchmarking urban performance against absolute measures of sustainability—A review. J. Clean. Prod. 2021, 314, 128020. [Google Scholar] [CrossRef]
  5. Corredor-Ochoa, A.; Antuña-Rozado, C.; Fariña-Tojo, J.; Rajaniemi, J. Challenges in assessing urban sustainability. In Urban Ecology: Emerging Patterns and Social-Ecological Systems; Verma, P., Singh, P., Singh, R., Raghubanshi, A.S., Eds.; Elsevier: Amsterdam, The Netherlands, 2008; pp. 355–374. ISBN 9780128207307. [Google Scholar] [CrossRef]
  6. McPhearson, T.; Pickett, S.T.A.; Grimm, N.B.; Niemelä, J.; Alberti, M.; Elmqvist, T.; Weber, C.; Haase, D.; Breuste, J.; Qureshi, S. Advancing Urban Ecology toward a Science of Cities. BioScience 2016, 66, 198–212. [Google Scholar] [CrossRef] [Green Version]
  7. Costanza, R. Ecological Economics: The Science and Management of Sustainability; Columbia University Press: New York, NY, USA, 1992. [Google Scholar]
  8. Hawkes, J. Cultural Development Network. In The fourth Pillar of Sustainability: Culture’s Essential Role in Public Planning; Common Ground: Melbourne, VIC, Australia, 2001. [Google Scholar]
  9. Lozano, R. Envisioning sustainability three-dimensionally. J. Clean. Prod. 2008, 16, 1838–1846. [Google Scholar] [CrossRef]
  10. Higgins, K.L. From bud to blossom: Nurturing sustainable stewardship. In Economic Growth and Sustainability; Higgins, K.L., Ed.; Academic Press: SanDiego, CA, USA, 2015; pp. 167–180. [Google Scholar]
  11. Mapar, M.; Jafari, M.J.; Mansouri, N.; Arjmandi, R.; Azizinejad, R.; Ramos, T.B. Sustainability indicators for municipalities of megacities: Integrating health, safety and environmental performance. Ecol. Indic. 2017, 83, 271–291. [Google Scholar] [CrossRef]
  12. Gibson, R.B.; Hassan, S.; Holtz, S.; Tansey, J.; Whitelaw, G. Sustainability Assessment: Criteria and Processes; Earthscan: London, UK, 2013. [Google Scholar]
  13. von Edmund, A.S. Geschichte der Nachhaltigkeit: Vom Werden und Wirkeneines Beliebten Begriffes. Available online: https://www.nachhaltigkeit.info/media/1326279587phpeJPyvC.pdf (accessed on 12 July 2022).
  14. Ali-Toudert, F.; Ji, L. Modeling and measuring urban sustainability in multi-criteria based systems—A challenging issue. Ecol. Indic. 2017, 73, 597–611. [Google Scholar] [CrossRef]
  15. Batty, M. Inventing Future Cities; MIT Press: Cambridge, MA, USA, 2018. [Google Scholar]
  16. Brandon, P.S.; Lombardi, P. Evaluating Sustainable Development in the Built Environment; John Wiley & Sons: New York, NY, USA, 2009. [Google Scholar]
  17. Cole, R.J.; Valdebenito, M.J. The importation of building environmental certification systems: International usages of BREEAM and LEED. Build. Res. Inf. 2013, 41, 662–676. [Google Scholar] [CrossRef]
  18. Benson, E.M.; Bereitschaft, B. Are LEED-ND developments catalysts of neighborhood gentrification? Int. J. Urban Sustain. Dev. 2019, 12, 73–88. [Google Scholar] [CrossRef]
  19. Sharifi, A.; Murayama, A. A critical review of seven selected neighborhood sustainability assessment tools. Environ. Impact Assess. Rev. 2013, 38, 73–87. [Google Scholar] [CrossRef]
  20. Ali-Toudert, F.; Ji, L.; Fährmann, L.; Czempik, S. Comprehensive Assessment Method for Sustainable Urban Development (CAMSUD)—A New Multi-Criteria System for Planning, Evaluation and Decision-Making. Prog. Plan. 2020, 140, 100430. [Google Scholar] [CrossRef]
  21. Chan, P.; Lee, M.-H. Prioritizing Sustainable City Indicators for Cambodia. Urban Sci. 2019, 3, 104. [Google Scholar] [CrossRef] [Green Version]
  22. Chan, P. Assessing Sustainability of the Capital and Emerging Secondary Cities of Cambodia Based on the 2018 Commune Database. Data 2020, 5, 79. [Google Scholar] [CrossRef]
  23. Lucchi, E.; Buda, A. Urban green rating systems: Insights for balancing sustainable principles and heritage conservation for neighbourhood and cities renovation planning. Renew. Sustain. Energy Rev. 2022, 161, 112324. [Google Scholar] [CrossRef]
  24. Razmjoo, A.A.; Sumper, A.; Davarpanah, A. Development of sustainable energy indexes by the utilization of new indicators: A comparative study. Energy Rep. 2019, 5, 375–383. [Google Scholar] [CrossRef]
  25. Razmjoo, A.; Sumper, A.; Marzband, M.; Davarpanah, A.; Shahhoseini, A.; Sarlak, S. Energy sustainability analyses using feasible indicators for urban areas. Int. J. Energy Water Resour. 2019, 3, 127–140. [Google Scholar] [CrossRef]
  26. Razmjoo, A.; Østergaard, P.A.; Denaï, M.; Nezhad, M.M.; Mirjalili, S. Effective policies to overcome barriers in the development of smart cities. Energy Res. Soc. Sci. 2021, 79, 102175. [Google Scholar] [CrossRef]
  27. Tomoiagă, B.; Chindriş, M.; Sumper, A.; Sudria-Andreu, A.; Ila-Robles, R.V.F. Pareto optimal reconfiguration of power distribution systems using a genetic algorithm based on NSGA-II. Energies 2013, 6, 1439–1455. [Google Scholar] [CrossRef] [Green Version]
  28. Griggs, D.; Stafford-Smith, M.; Gaffney, O.; Rockström, J.; Öhman, M.C.; Shyamsundar, P.; Steffen, W.; Glaser, G.; Kanie, N.; Noble, I. Sustainable development goals for people and planet. Nature 2013, 495, 305–307. [Google Scholar] [CrossRef]
  29. Kumar, P.; Thakur, P.K.; Bansod, B.K.S.; Debnath, S.K. Groundwater: A regional resource and a regional governance. Environ. Dev. Sustain. 2017, 20, 1133–1151. [Google Scholar] [CrossRef]
  30. Le Blanck, D. The sustainable development goals as a network of targets. Monit. Eval. NEWS 2015, 1, 1–4. Available online: http://www.un.org/esa/desa/papers/2015/wp141_2015.pdf (accessed on 12 July 2022).
  31. UN-HABITAT The City Prosperity Initiative (CPI) Global City Report—2015. Available online: https://smartnet.niua.org/content/ba3a1dcb-3012-44d6-87b5-fbaa28318de7 (accessed on 12 July 2022).
  32. Sharifi, A. Urban sustainability assessment: An overview and bibliometric analysis. Ecol. Indic. 2021, 121, 107102. [Google Scholar] [CrossRef]
  33. Shen, L.Y.; Ochoa, J.J.; Shah, M.N.; Zhang, X. The application of urban sustainability indicators—A comparison between various practices. Habitat Int. 2011, 35, 17–29. [Google Scholar] [CrossRef]
  34. Verma, P.; Raghubanshi, A.S. Urban sustainability indicators: Challenges and opportunities. Ecol. Indic. 2018, 93, 282–291. [Google Scholar] [CrossRef]
  35. Huang, L.; Wu, J.; Yan, L. Defining and measuring urban sustainability: A review of indicators. Landsc. Ecol. 2015, 30, 1175–1193. [Google Scholar] [CrossRef]
  36. Liu, J.; Dou, Y.; Batistella, M.; Challies, E.; Connor, T.; Friis, C.; DA Millington, J.; Parish, E.; Romulo, C.L.; Silva, R.F.B.; et al. Spillover systems in a telecoupled Anthropocene: Typology, methods, and governance for global sustainability. Curr. Opin. Environ. Sustain. 2018, 33, 58–69. [Google Scholar] [CrossRef] [Green Version]
  37. Michalina, D.; Mederly, P.; Diefenbacher, H.; Held, B. Sustainable Urban Development: A Review of Urban Sustainability Indicator Frameworks. Sustainability 2021, 13, 9348. [Google Scholar] [CrossRef]
  38. Bai, X.; Surveyer, A.; Elmqvist, T.; Gatzweiler, F.W.; Güneralp, B.; Parnell, S.; Prieur-Richard, A.-H.; Shrivastava, P.; Siri, J.G.; Stafford-Smith, M.; et al. Defining and advancing a systems approach for sustainable cities. Curr. Opin. Environ. Sustain. 2016, 23, 69–78. [Google Scholar] [CrossRef]
  39. Liu, J.; Mooney, H.; Hull, V.; Davis, S.J.; Gaskell, J.; Hertel, T.; Lubchenco, J.; Seto, K.C.; Gleick, P.; Kremen, C.; et al. Systems integration for global sustainability. Science 2015, 347, 1258832. [Google Scholar] [CrossRef] [Green Version]
  40. Pupphachai, U.; Zuidema, C. Sustainability indicators: A tool to generate learning and adaptation in sustainable urban development. Ecol. Ind. 2017, 72, 784–793. [Google Scholar] [CrossRef]
  41. Cutaia, F. The Use of Landscape Indicators in Environmental Assessment BT. In Strategic Environmental Assessment: Integrating Landscape and Urban PlanningStrategic Environmental Assessment: Integrating Landscape and Urban Planning; Cutaia, F., Ed.; Springer International Publishing: Cham, Switzerland, 2016; pp. 29–43. [Google Scholar] [CrossRef]
  42. Bagstad, K.J.; Shammin, M.R. Can the Genuine Progress Indicator better inform sustainable regional progress? A case study for Northeast Ohio. Ecol. Indic. 2012, 18, 330–341. [Google Scholar] [CrossRef]
  43. Kubiszewski, I.; Costanza, R.; Franco, C.; Lawn, P.; Talberth, J.; Jackson, T.; Aylmer, C. Beyond GDP: Measuring and achieving global genuine progress. Ecol. Econ. 2013, 93, 57–68. [Google Scholar] [CrossRef] [Green Version]
  44. Dasgupta, P. The welfare economic theory of green national accounts. Environ. Resour. Econ. 2009, 42, 3–38. [Google Scholar] [CrossRef]
  45. Roman, P.; Thiry, G. The inclusive wealth index. A critical appraisal. Ecol. Econ. 2016, 124, 185–192. [Google Scholar] [CrossRef]
  46. Wong, C. A framework for ‘City Prosperity Index’: Linking indicators, analysis and policy. Habitat Int. 2015, 45, 3–9. [Google Scholar] [CrossRef]
  47. Merino-Saum, A.; Halla, P.; Superti, V.; Boesch, A.; Binder, C. Indicators for urban sustainability: Key lessons from a systematic analysis of 67 measurement initiatives. Ecol. Indic. 2020, 119, 106879. [Google Scholar] [CrossRef]
  48. Kaur, H.; Garg, P. Urban sustainability assessment tools: A review. J. Clean. Prod. 2019, 210, 146–158. [Google Scholar] [CrossRef]
  49. Liang, J.; Xie, Y.; Sha, Z.; Zhou, A. Modeling urban growth sustainability in the cloud by augmenting Google Earth Engine (GEE). Comput. Environ. Urban Syst. 2020, 84, 101542. [Google Scholar] [CrossRef]
  50. Fu, B.; Li, Y.; Wang, Y.; Zhang, B.; Yin, S.; Zhu, H.; Xing, Z. Evaluation of ecosystem service value of riparian zone using land use data from 1986 to 2012. Ecol. Indic. 2016, 69, 873–881. [Google Scholar] [CrossRef]
  51. Xue, M.; Luo, Y. Dynamic variations in ecosystem service value and sustainability of urban system: A case study for Tianjin city, China. Cities 2015, 46, 85–93. [Google Scholar] [CrossRef]
  52. Mascarenhas, A.; Nunes, L.; Ramos, T. Selection of sustainability indicators for planning: Combining stakeholders’ participation and data reduction techniques. J. Clean. Prod. 2015, 92, 295–307. [Google Scholar] [CrossRef]
  53. Zhou, C.; Xie, Y.; Zhang, A.; Liu, C.; Yang, J. Spatiotemporal analysis of interactions between seasonal water, climate, land use, policy, and socioeconomic changes: Hulun-Buir Steppe as a Case Study. Water Res. 2022, 209, 117937. Available online: https://authors.elsevier.com/a/1eFRN9pi-SbLn (accessed on 12 July 2022). [CrossRef]
  54. Chen, J.; Lu, J. Effects of Land Use, Topography and Socioeconomic factors on River Water Quality in a Mountainous Watershed with Intensive Agricultural Production in East China. PLoS ONE 2014, 9, e102714. [Google Scholar] [CrossRef]
  55. Anselin, L.; Rey, R. Modern spatial econometrics in practice, A guide to GeoDa. In GeoDaSpace and PySAL; GeoDa Press: Chicago, IL, USA, 2014. [Google Scholar]
  56. Lechner, A.M.; Owen, J.; Ang, M.L.E.; Edraki, M.; Awang, N.A.C.; Kemp, D. Historical socio-environmental assessment of resource development footprints using remote sensing. Remote Sens. Appl. Soc. Environ. 2019, 15, 100236. [Google Scholar] [CrossRef]
  57. Gupta, A.K.; Negi, M.; Nandy, S.; Kumar, M.; Singh, V.; Valente, D.; Petrosillo, I.; Pandey, R. Mapping socio-environmental vulnerability to climate change in different altitude zones in the Indian Himalayas. Ecol. Indic. 2020, 109, 105787. [Google Scholar] [CrossRef]
  58. Xie, Y.; Sha, Z.; Yu, M. Remote sensing imagery in vegetation mapping: A review. J. Plant Ecol. 2008, 1, 9–23. [Google Scholar] [CrossRef]
  59. Salvati, L.; Carlucci, M. A composite index of sustainable development at the local scale: Italy as a case study. Ecol. Indic. 2014, 43, 162–171. [Google Scholar] [CrossRef]
  60. Turner, B.L., II; Robbins, P. Land-change science and political ecology: Similarities, differences, and implications for sustainability science. Annu. Rev. Environ. Resour. 2008, 33, 295–316. [Google Scholar] [CrossRef]
  61. Li, A. Modeling human decisions in coupled human and natural systems: Review of agent-based models. Ecol. Model. 2012, 229, 25–36. [Google Scholar]
  62. Kong, L.; Liu, Z.; Wu, J. A systematic review of big data-based urban sustainability research: State-of-the-science and future directions. J. Clean. Prod. 2020, 273, 123142. [Google Scholar] [CrossRef]
  63. Hassani, H.; Huang, X.; Silva, E.S.; Ghodsi, M. A review of data mining applications in crime. Stat. Anal. Data Min. ASA Data Sci. J. 2016, 9, 139–154. [Google Scholar] [CrossRef]
  64. Jolliffe, I.T.; Cadima, J. Principal component analysis: A review and recent developments. Philos. Trans. R. Soc. A Math. Phys. Eng. Sci. 2016, 374, 20150202. [Google Scholar] [CrossRef]
  65. Longo, S.; Montana, S.L.F.; Sanseverino, E.R. A review on optimization and cost-optimal methodologies in low-energy buildings design and environmental considerations. Sustain. Cities Soc. 2019, 45, 87–104. [Google Scholar] [CrossRef]
  66. Reed, P.M.; Hadka, D.; Herman, J.D.; Kasprzyk, J.R.; Kollat, J.B. Evolutionary multi-objective optimization in water resources: The past, present, and future. Adv. Water Resour. 2013, 51, 438–456. [Google Scholar] [CrossRef] [Green Version]
  67. Rajapakse, J.C.; Mundra, P.A. Multiclass gene selection using pareto-fronts. IEEE/ACM Trans. Comput. Biol. Bioinform. 2013, 10, 87–97. [Google Scholar] [CrossRef]
  68. Han, Y.; Gong, D.; Jin, Y.; Pan, Q. Evolutionary multi-objective blocking lot-streaming flow shop scheduling with machine breakdowns. IEEE Trans. Cybern. 2017, 49, 184–1967. [Google Scholar] [CrossRef] [PubMed]
  69. Deb, K. Multi-Objective Optimization Using Evolutionary Algorithms; John Wiley & Sons: New York, NY, USA, 2011. [Google Scholar]
  70. Zadeh, L.A. Optimality and non-scalar-valued performance criteria. IEEE Trans. Autom. Control. 1963, 8, 59–60. [Google Scholar] [CrossRef]
  71. Geoffrion, A.M. Proper efficiency and the theory of vector maximization. J. Math. Anal. Appl. 1968, 22, 618–630. [Google Scholar] [CrossRef] [Green Version]
  72. Fonseca, C.M.; Fleming, P.J. Multiobjective genetic algorithms. In Proceedings of the IEE Colloquium on Genetic Algorithms for Control Systems Engineering, London, UK, 28 May 1993; pp. 6/1–6/5. [Google Scholar]
  73. Srinivas, N.; Deb, K. Multi-objective optimization using nondominated sorting in genetic algorithms. Evol. Comput. 1994, 2, 221–248. [Google Scholar] [CrossRef]
  74. Horn, J.; Nafpliotis, N.; Goldberg, D.E. A Niched Pareto Genetic Algorithm for Multiobjective Optimization. In Proceedings of the First IEEE Conference on Evolutionary Computation, Orlando, FL, USA, 27–29 June 1994. [Google Scholar]
  75. Zitzler, E.; Laumanns, M.; Thiele, L. SPEA2: Improving the strength pareto evolutionary algorithm. TIK-Report 2001, 103. [Google Scholar] [CrossRef]
  76. Deb, K.; Pratap, A.; Agarwal, S.; Meyarivan, T. A fast and elitist multi-objective genetic algorithm: NSGA-II. IEEE Trans. Evol. Comput. 2002, 6, 182–197. [Google Scholar] [CrossRef] [Green Version]
  77. Deb, K.; Jain, H. An evolutionary many-objective optimization algorithm using reference-point-based nondominated sorting approach, Part I: Solving problems with box constraints. IEEE Trans. Evol. Comput. 2014, 18, 577–601. [Google Scholar] [CrossRef]
  78. Corne, D.W.; Jerram, N.R.; Knowles, J.D.; Oates, M.J. PESA-II: Region-based selection in evolutionary multi-objective optimization. In Proceedings of the 3rd Annual Conference on Genetic and Evolutionary Computation, San Francisco, CA, USA, 7–11 July 2001; pp. 283–290. [Google Scholar]
  79. IMAR Statistical Bureau. Inner Mongolia Statistical Yearbook. 2000–2017; China Statistical Press: Beijing, China. Available online: http://tj.nmg.gov.cn/files_pub/content/PAGEPACK/b85658190a3644f8b192e45f5221f2fa/indexeh.htm (accessed on 12 July 2022).
  80. Brown, D.G.; Agrawal, A.; Sass, D.A.; Wang, J.; Hua, J.; Xie, Y. Responses to climate and economic risks and opportunities across national and ecological boundaries: Changing household strategies on the Mongolian Plateau. Environ. Res. Lett. 2013, 8, 045011. [Google Scholar] [CrossRef] [PubMed]
  81. Gong, P.; Li, X.; Zhang, W. 40-Year (1978–2017) human settlement changes in China reflected by impervious surfaces from satellite remote sensing. Sci. Bull. 2019, 64, 756–763. [Google Scholar] [CrossRef] [Green Version]
  82. Jiang, B. Head/Tail Breaks: A New Classification Scheme for Data with a Heavy-Tailed Distribution. Prof. Geogr. 2013, 65, 482–494. [Google Scholar] [CrossRef]
  83. Li, S.; Xie, Y. Investigating Coupled Impacts of Climate Change and Socioeconomic Transformation on Desertification by Using Multi-temporal Landsat Images: A Case Study in Central Xilingol, China. IEEE Geosci. Remote Sens. Lett. 2013, 10, 1244–1248. [Google Scholar] [CrossRef]
  84. Chen, H.; Shao, L.; Zhao, M.; Zhang, X.; Zhang, D. Grassland conservation programs, vegetation rehabilitation and spatial dependency in Inner Mongolia, China. Land Use Policy 2017, 64, 429–439. [Google Scholar] [CrossRef]
  85. Deng, L.; Shanguan, Z.; Wu, G.; Chang, X. Effects of grazing exclusion on carbon sequestration in China’s grassland. Earth-Sci. Rev. 2017, 173, 84–95. [Google Scholar] [CrossRef]
  86. Liu, H.; Wu, Q.; Chen, J.; Wang, M.; Zhao, D.; Duan, C. Environmental Impacts Related to Closed Mines in Inner Mongolia. Sustainability 2021, 13, 13473. [Google Scholar] [CrossRef]
  87. Wu, J.; Zhang, Q.; Li, A.; Liang, C. Historical landscape dynamics of Inner Mongolia: Patterns, drivers, and impacts. Landsc. Ecol. 2015, 30, 1579–1598. [Google Scholar] [CrossRef]
  88. Xie, Y.; Fan, S.; Zhou, C. Examining ecosystem deterioration using a Total socioenvironmental system approach. Sci. Total Environ. 2021, 784, 147171. Available online: https://authors.elsevier.com/a/1cyVJB8ccquVR (accessed on 12 July 2022). [CrossRef]
  89. Shang, C.; Wu, T.; Huang, G.; Wu, J. Weak sustainability is not sustainable: Socioeconomic and environmental assessment of Inner Mongolia for the past three decades. Resour. Conserv. Recycl. 2019, 141, 243–252. [Google Scholar] [CrossRef]
  90. Kowarik, I.; Fischer, L.K.; Kendal, D. Biodiversity Conservation and Sustainable Urban Development. Sustainability 2020, 12, 4964. [Google Scholar] [CrossRef]
  91. Tanguay, G.A.; Rajaonson, J.; Lefebvre, J.-F.; Lanoie, P. Measuring the sustainability of cities: An analysis of the use of local indicators. Ecol. Indic. 2010, 10, 407–418. [Google Scholar] [CrossRef]
  92. Alexander, C. Sustainability and Morphogenesis: The Birth of a Living world; Schumacher Lecture: Bristol, UK, 2004; Available online: https://www.livingneighborhoods.org/library/schumacher-pages-1-28.pdf (accessed on 12 July 2022).
  93. Alexander, C. The Nature of Order: An Essay on the Art of Building and the Nature of the Universe; Center for Environmental Structure: Berkeley, CA, USA, 2002–2005. [Google Scholar]
  94. Jiang, B.; de Rijke, C. Representing geographic space as a hierarchy of recursively defined subspaces for computing the degree of order. Comput. Environ. Urban Syst. 2022, 92, 101750. [Google Scholar] [CrossRef]
  95. Jiang, B. Geography as a science of the Earth’s surface founded on the third view of space. Ann. GIS 2022, 28, 31–43, Reprinted under the new title “A new kind of city science built on living structure and on the third view of space”, as the cover story in the magazine. Coordinates 2022, February issue, 16–25. [Google Scholar] [CrossRef]
  96. Xie, Y.; Crary, D.; Bai, Y.; Cui, X.; Zhang, A. Modeling Grassland Ecosystem Responses to Coupled Climate and Socioeconomic Influences in Multi-Spatial-And-Temporal Scales. J. Environ. Inform. 2016, 33, 337. [Google Scholar] [CrossRef]
  97. Batty, M. The New Science of Cities; MIT Press: Cambridge, MA, USA, 2013. [Google Scholar]
Figure 1. Integrated Socioeconomic and Land-use Data Mining–based Multi-objective Assessment (ISL-DM-MOA).
Sustainability 14 09142 g001
Figure 2. General Progress (GP) scores of different Cities/Counties in IMAR.
Sustainability 14 09142 g002
Figure 3. The Study Area and the Cities/Counties in the Pareto Front.
Sustainability 14 09142 g003
Table 1. The list of variables.
AbbreviationExplanationUnit
POPPopulation (PP)10,000 people
GDPGross Domestic Product (GDP) 201610,000 yuan
GOVAGross Output Value of Farming, Forestry, Animal Husbandry and Fishery (Agriculture) GOVA-201610,000 yuan
AAArable Area (AA)Hectare
GRAINGrain Production (GP)Ton
LIVESTOCKThe amount of the livestock by the end of the year (ls)10,000 head
FAIFixed Assets Investment (FAI)—201410,000 yuan
LGRLocal Government Revenue (LGR)—201410,000 yuan
IOFPPer capita net income of farmers and pastoralists (IOFP)Yuan
LOHThe total length of highways (LOH)Kilometer
RPOPRural Population—RPOP10,000 people
TCRVTotal consumer retail value10,000
PTENumber of professional and technical workersPerson
MHTNumber of middle and high school teachersPerson
HPBNumber of hospital bedsOne
HMPNumber of health and medical professionals Person
PCURDIThe per capita disposable income of urban permanent residentsYuan
PIOTotal Output Value—Primary Industry (10,000 yuan)10,000
SIOTotal Output Value—Secondary Industry (10,000 yuan)10,000
TIOTotal Output Value—Tertiary Industry (10,000 yuan)10,000
LandAreaTotal Land Area Sq. kilometers
WaterWater AreaSq. kilometers
ForestForestland AreaSq. kilometers
ShrubShrubland AreaSq. kilometers
GrassGrassland AreaSq. kilometers
WetlandWetland AreaSq. kilometers
CropCrop Area without Planted Grassland for HarvestSq. kilometers
ACropCrop Area + Planted Grassland for HarvestSq. kilometers
UrbanUrban Land AreaSq. kilometers
SnowSnow Covered AreaSq. kilometers
SandSandy Land AreaSq. kilometers
Table 2. Total Variance Explained.
FactorEigenvalues% of VarianceCumulative %
110.28946.76846.768
25.23023.77370.541
31.3306.04576.586
41.0284.67381.259
50.8163.70884.967
Factors 6–21 were deleted because of their Eigenvalues < 1.0
220.0050.024100.000
Table 3. PCA Rotated Component Matrix a.
General ProgressAgricultural ProgressStress on Land SupplyGrassland Resource
zgdp0.974 b0.086−0.0320.024
zfai0.9620.055−0.0090.035
zlgr0.961−0.015−0.0380.019
zTCRV0.9550.089−0.0950.020
zTIO0.947−0.023−0.0660.015
zHMP0.9290.154−0.121−0.084
zPCUREI0.927−0.072−0.013−0.006
zPTE0.9080.1420.021−0.043
zSIO0.902−0.0710.0740.036
zMHT0.8880.368−0.100−0.017
zpp0.8160.496−0.0600.062
ziofp0.433−0.126−0.281−0.052
zPIO0.2250.9090.169−0.069
zgova0.2140.8950.163−0.048
zrpop0.2070.8510.0840.208
zaa−0.0650.8140.180−0.142
zgp−0.1740.7920.215−0.189
zACrop0.0250.738−0.077−0.491
zloh0.1620.2360.821−0.180
zUrban0.335−0.141−0.579−0.066
zls−0.0680.5110.5680.142
zGrass0.010−0.190−0.0350.944
Extraction Method: Principal Component Analysis. Rotation Method: Varimax with Kaiser Normalization. a Rotation converged in 6 iterations. b the bold numbers indicate these variables closely correlate with this factor.
Table 4. The equations and parameters used to compute USI.
Calculation Steps Equations Explanation
1 unit price per hectare (2219.48) = average actual food production of cropland (4415) × 1/7 × average price for grain (3.519) 4415 kg/ha2 is the average value from 2005 to 2016; 3.519 Yuan/kg is the grain price of 2005.
2 VCkf = unit price per hectare (2219.48) × total equivalent weight factorVCkf is the value coefficient for category k and service function type f. Total equivalent weight factors include 7 land-use types: Forest, Grass, Shrub, Crop, Wetland, Water, and Urban; Forest replaced woodland and Urban replaced built-up.
3 ESV S = k f A k × VC k f ESV S refer to the total static ecosystem value. A k represents the area of LULC category k.
4 ESV S = ESV S E a v g × E a n
E a n = E m / i = n m i
E a v g ,   E a n ,   E m are economic values of one weight factor, while E a v g is the average value and E a n is calculated by the E m in current year m during the study period, n refers to the start year. i is GDP index.
5 ESV d = ESV c × A c
A c = 1 / 1 + exp ( t )
t = 1 / E n 3
E n indicates Engel coefficient of cities and towns of entire Inner Mongolia.
6 USI = GDP 2 + PCNI 2 + ESV d 2 / 3 IOFP was used to replace PCNI.
The parameters and calculations were based on Jianyuan Liang, Yichun Xie, Zongyao Sha, and Alicia Zhou, Modeling urban growth sustainability in the cloud by augmenting Google Earth Engine (GEE), Computers, Environment and Urban Systems 84 (2020) 101542 [49].
Table 5. The list of cities and banners in the Pareto Fronts by years.
City/County NameOccurrence in PFAOccurrence Year
Baotou City142001,2002,2003,2004,2005,2006,2008,2009,2010,2011,2012,2014,2015,2016
Chifeng City132001,2003,2004,2005,2006,2007,2008,2009,2010,2011,2012,2013,2016
Jining District92003,2004,2005,2006,2009,2010,2011,2013,2014
Ejinna Banner92002,2003,2004,2006,2010,2014,2015,2016,2017
East Ujimqin Banner72001,2002,2003,2004,2006,2007,2008
Wuhai City52004,2005,2010,2013,2014
Otog Banner52001,2002,2003,2006,2007
Hohhot City42001,2002,2003,2011
Jarud Banner42003,2004,2005,2007
Yakeshi City42001,2002,2003,2005
Genhe City32001,2002,2003
Manzhouli City32004,2005,2006
Ergun City32001,2002,2003
Dongsheng District22009,2011
Jungar Banner22001,2002
Horqin Right Front Banner22001,2003
Oroqin Autonomous Banner22001,2002
Xilinhot City22001,2004
Erenhot City12001
Hexigten Banner12005
Zhalantun City12001
Ongniud Banner12001
Dalad Banner12001
Ar Horqin Banner12005
Publisher’s Note: MDPI stays neutral with regard to jurisdictional claims in published maps and institutional affiliations.

