Article

Measurement and Evaluation of Convergence of Japan’s Marine Fisheries and Marine Tourism

1
Graduate School of Marine Science and Technology, Tokyo University of Marine Science and Technology, Tokyo 108-8477, Japan
2
Mangrove Institute, Lingnan Normal University, Zhanjiang 524088, China
3
School of Economics & Trade, Guangdong University of Finance, Guangzhou 510520, China
4
Department of Global Agriculture Science, The University of Tokyo, Tokyo 113-8657, Japan
*
Author to whom correspondence should be addressed.
Sustainability 2022, 14(15), 9108; https://doi.org/10.3390/su14159108
Submission received: 30 May 2022 / Revised: 14 July 2022 / Accepted: 22 July 2022 / Published: 25 July 2022

Abstract

:
This study attempts to examine the convergence development of the marine fishery (MF) and marine tourism (MT) industries of Japan through the theory of industrial relevance. First, the current MF and MT situation in Japan is introduced to analyze the mechanism of the integration of the two industries. Second, a Vector Autoregression Model (VAR) is built to examine the relationship between MF and MT. In addition, the shock potential contributions of the MF and MT industries are identified using impulse response and variance decomposition. Results show that the impact of MF on MT is more significant than that of MT on MF. However, the interaction between MF and MT tends to stabilize in the long run. Third, the industrial integration case of Japan’s Himakajima Island is selected to analyze the MF and MT integration mechanism. The integration of MF and MT can reduce transaction costs, make full use of labor, and promote the development of the local economy. Therefore, attention should be paid to the integration of the MF and MT industries, rather than partial implementation, to balance the development of the marine economy. Finally, relevant suggestions and measures are presented for marine industry transformation and upgrading, industrial integration, and green ecological development.

1. Introduction

Japan has an area of only 380,000 square kilometers (ranking 61st in the world), with the scope of its territorial waters and exclusive economic zone reaching 4.47 million square kilometers (ranking sixth in the world) [1,2]. Japan has unique advantages in terms of developing its marine economy compared with other countries. Since the 1960s, Japan has attached considerable importance to the development of its marine economy. Thus, the country formed a modern marine economic system consisting of the marine fishery (MF) industry, marine shipbuilding industry, marine tourism (MT) industry, and other emerging marine industries, as expenditures contribute significantly to Japan’s GDP. In the 1980s, Japan’s marine economy ranked first in the world [3]. However, since the 1990s, Japan’s marine economic development has stagnated and has been surpassed by that of the United States and China, but the country remains a world marine power.
Since the 21st century, Japan has regarded marine development and utilization as the foundation of its economy and society, with its goal of “building a nation on the ocean”, thereby accelerating the process of formulating ocean legislation and planning [4]. The Japanese government implemented the Basic Act on Ocean Policy in 2007 and released the Basic Ocean Plan in March 2008 [5]. The plan includes laws and regulations, industrial plans, and specific policy measures and involves various levels, such as the industrial economy, environmental resources, transportation, national defense and security, international cooperation, and science. Japan developed a wide-ranging and systematic policy system to strengthen its solid marine economy, including its modern marine industry, with fisheries, shipbuilding, tourism, and so on. In recent years, the development of Japan’s marine industry demonstrated a refined division of labor, expanded fields, and development trend of traditional and emerging industries. One of the distinctive features of this development is the convergence of the MF and MT industries.
The advancement of Japan’s MF has a long history, and the industry is one of the pillar industries of the country’s marine economy [6]. Japan is located in the northwest Pacific Ocean, close to the Hokkaido fishing grounds, which is one of the three major fishing grounds in the world [7,8], and it is rich in fishery resources. Aquatic products have also been among the essential food sources of the Japanese nation since ancient times [9,10]. Over the past century, Japan’s MF output developed steadily and sustainably [11], with an annual production between 1.75 and 2.27 million tons [12,13]. However, since the 1990s, Japan’s MF has declined owing to the proposed 200-nautical-mile-long exclusive economic zone, rising fuel prices, and the East Japan Earthquake [14,15]. In recent years, the Japanese government issued a series of policies, hoping to revitalize the development of its MF. In 2021, the Japanese Fisheries Agency (JFA) released its latest fishery development plan and related promotion policies. For example, the agency plans to expand the scale of aquatic product aquaculture, strengthen the production and circulation of aquatic products, improve preferential policies for individuals employed in outlying islands, and revitalize the economic development of the MF of outlying islands and other aspects. The agency hopes that such measures will promote the development of the Japanese MF industry [16].
At the same time, the Japanese government recently paid special attention to developing the country’s MT [17,18]. To promote the development of MT, the Japanese government has taken some measures. For example, in 1996, the Japanese government designated July 20 as “Marine Day” mainly to raise awareness of marine life by holding large-scale activities related to the ocean. In addition, the Ministry of Land, Infrastructure, Transport and Tourism promote MT by organizing photo contests with themes such as marine customs, fisheries, and food culture. According to the “Survey on National Maritime Awareness 2019” published by the Japan Maritime Center, about 73% of Japanese citizens between the ages of 10 and 20 years, and 62% of citizens between the ages of 20 and 30 years are enthusiastic about MT, and a vast potential market exists for ocean tourism [19]. The survey also showed that 95.2% of Japanese nationals have experience in domestic MT and overseas tourism [20]. The Japanese government also formulated a “tourism building plan” to accelerate the development of recommended MT resources and actively adopt measures to attract foreign tourists to visit the country [21]. The number of foreign tourists visiting Japan reached 10 million in 2012 and 21.88 million in 2019 (since the beginning of 2020, this number has decreased dramatically owing to the COVID-19 pandemic). MT is vital for driving the social and economic development of coastal areas and improving residents’ quality of life [22].
Other coastal countries worldwide also attach considerable importance to the integrated development of MF and MT. In 2019, the added value of MF and MT in the United States was USD 162.14 billion, accounting for about 35% of the gross marine economic output and absorbing up to 2.295 million people for employment [23]. On the Gold Coast of California, MF in coastal areas is driven by tourism development, thereby forming a perfect marine industry belt. Fishing, sightseeing, and other activities can meet people’s diversified needs. In the early 21st century, China’s MF industry developed rapidly, thereby becoming the world’s largest MF industry. The Chinese government attached considerable importance to the use of coastal fishery resources to drive tourism development. According to China’s 2019 marine economy statistics, MT and MF became pillar industries of the country, accounting for 50.6% and 13.2% of the total marine economy [24]. The development of the MF and MT of Japan differs from that of the MF and MT of the United States and China. In the 1960s, when the Japanese fishing industry began to develop rapidly, the Japanese government implemented the development strategy of “ocean-oriented and multifaceted utilization.” National legislation was enacted to implement an access system for fishing, and considerable investments were made to build artificial fishing grounds and improve the environment of fishing villages as well as ports. Furthermore, Japan is the first country to provide legal and organizational support for the integration of MF and MT. Thus, examining the integration of MF and MT in Japan has been a considerable issue to the development of marine economy.

2. Literature Review

The phenomenon of industrial integration appeared in the 1960s. Since the emergence of the concept of industrial integration, many scholars have conducted theoretical analysis and empirical research on the topic [25,26], and results mainly included the connotation, mechanism, mode, and influence of industrial integration. Uekusa (2001) believed that, from the perspective of economics, industrial integration is due to technological innovation, which results in products initially belonging to different industries or markets, with a mutual substitution relationship [27]. Rosenberg (1963) defined technical integration as the gradual dependence of various sectors of the same production technology in the production process to closely link previously separate industries [28]. Greenstein (1997) pointed out that as an economic phenomenon, industrial integration refers to the shrinking or disappearing of industrial boundaries to adapt to industrial growth, and divided industrial integration into alternative integration and complementary integration [29]. Regarding its impact, industrial integration can break through the fragmentation of industries, make full use of asset reorganization and factors, strengthen competition and cooperation among sectors, and reduce barriers to entry among industries [30].
At the same time, many scholars conducted in-depth studies on the integration and development of MF and MT. Lewin et al. (2006) summarized and analyzed the ecological and economic impacts of MF and MT. Gao (2012) summarized and investigated the integration mechanism of China’s tourism industry from internal and external environments and believes that convergence between MF and MT is possible in terms of resources and products [31]. Meanwhile, Zhao (2016) evaluated the economic growth relationship between China’s MF and MT and empirically analyzed the mutual promotion of tourism and recreational fishing [32]. Respectively, some scholars demonstrate that the economic benefits of industrial integration are apparent. The mutual integration of MF and MT can increase the income of local fishermen and promote the economic development of fishing areas while providing opportunities for strengthening local infrastructure and promoting the wellbeing of local communities [33]. However, some scholars believe that the development of MT will disrupt normal MF production activities, and the increase in the number of tourists will bring pollution to the marine environment, which may affect the sustainable development of MF [34].
Research on MF and MT has formed a relatively complete theoretical system. However, studies on the internal economic relationship between the two major industries are few. Therefore, this study explores the relationship between MF and MT development and Vector Autoregressive Models (VAR) referring to the reflection for interaction between variables responding to time term based on industry convergence theory. Clarifying the law of the development of MF and MT can provide a reference for the sustainable development of the two industries.
To this end, we propose the following hypothesis.
H1. 
MF and MT are mutually infiltrated, mutually reinforcing, and integrated development.
H2. 
The growth of MT will not hinder the sustainable development of MF.

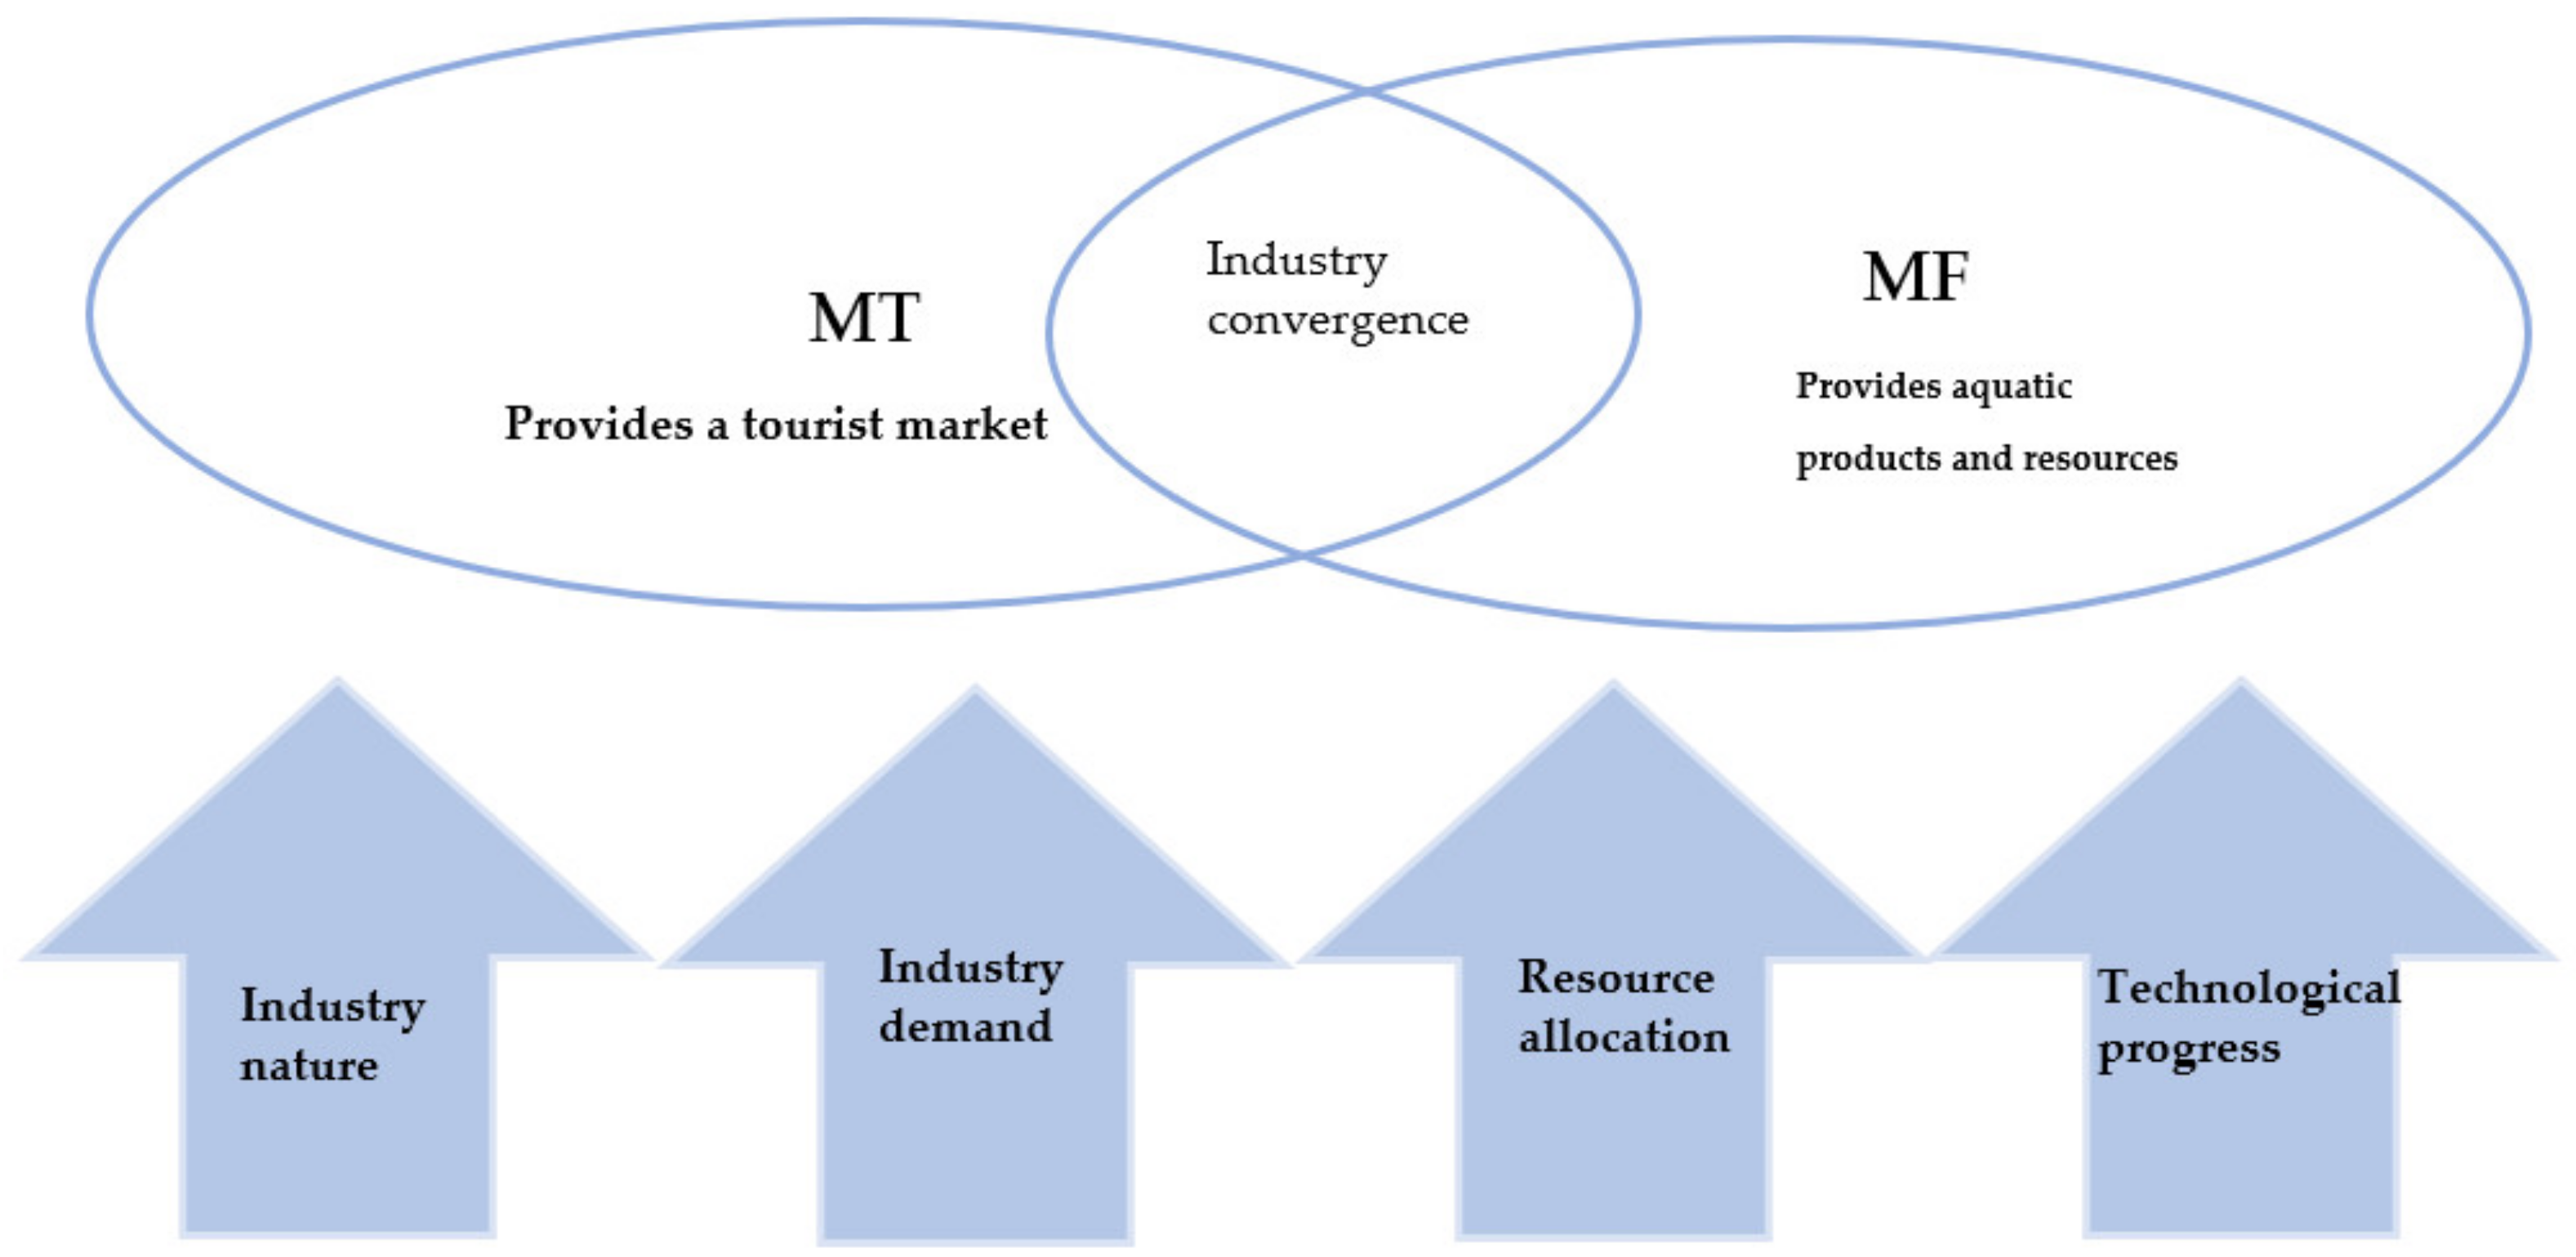
3. Industry Convergence Mechanism

This study analyzes the process of MF and MT convergence from four aspects: industry nature, market demand, resource allocation, and technological progress (see Figure 1).
(1)
Industry nature
MF relies mainly on a large amount of input from labor, capital, natural resources, and so on. In addition, MF is highly dependent on natural resources and is a traditional primary industry. Meanwhile, MT is an emerging service industry involving tourism, entertainment, accommodation, aquatic product consumption, and other aspects. MT is also interdependent with many industries, such as information services, finance, and exhibitions [35,36]. The development of MT needs the support and coordination of other industries. Moreover, MF and MT have a strong correlation and permeability in the development process. Generally, the stronger the correlation between industries, the higher the resource utilization rate between the industries [37,38].
(2)
Market demand
MF aquatic products are the primary resource input of some MT projects (e.g., ornamental fish, fishing, catering, and so on), which can meet the market development needs of MT to a certain extent and have a specific promotional effect on the development of MT. At the same time, local aquatic product brands can promote MT and attract tourists. In the integration process, MF provides the resources and products for tourism, and MT offers a market for MF [39,40].
(3)
Resource allocation
In classical economics, resource elements mainly include land, capital, and labor. In the marine industry, land can be understood as marine natural resources. First, in the absence of an MT market, MF can provide sufficient financial support to MT. MT is a typical capital-intensive industry with high market barriers, and starting it up must be based on a certain amount of capital. Profits from MF must provide the funds needed to develop MT. Second, the development of MT requires a certain amount of labor, which often involves the transformation of MF from the beginning. Third, MF natural resources can promote MT. Meanwhile, MT development can optimize the allocation of marine resources and effectively use the surplus labor from MF to a certain extent [41].
(4)
Technological progress
Since the 1990s, digital technology, communication, and computer technology have developed rapidly, blurring the boundaries of many industries [42]. In recent years, a new MF and MT integration trend emerged. The scope of the integration of the two industries is gradually expanding, from the penetration of industries to the reorganization of sectors. Modern technology, which is an essential external promoter of industrial integration, has continuously expanded the scope of MF and MT integration, which is conducive to the continuous formation of new companies, and has become a bridge and link to industrial integration.

4. Evaluation of Market Development Degree of MF and MT

4.1. Data Sources and Descriptive Statistics

Currently, no statistics exist on MF and MT. The MF and MT data in this studyare estimated as follows. First, MF is the combined value of surface boat fisheries and aquaculture. Second, MT mainly includes various fields such as fishing, rowing, boat racing, fishers’ inns, restaurants, and so on. Readers should refer to the “2010 Marine Industry Activity Status Survey Report” and “2018 Marine Industry Structure and Scale System Survey Report” for the MT method [43,44]. The data are mainly obtained from the annual report of Japan’s fishery and aquaculture production statistics, “Leisure White Paper,” and “Japan Input–Output Table” [45] (Table 1).
Descriptive statistics are utilized for all the variables tested in the econometric model of this study, as shown in Table 2. The results indicate that for MF, the mean is 2,819,604, the maximum value is 3,992,638, and the minimum value is 1,845,710. With regard to MT, the mean is 1,829,882, the maximum value is 2,697,635, and the minimum value is 1,309,774. These results show that a significant difference exists between the two variables.

4.2. Methods

The VAR model was first introduced by Sims in the field of economics in 1980 [46]. The technical reference used for the VAR models is Lutkepohl (1991) [47], and the updated surveys on VAR techniques are from Watson (1994) [48], Lutkepohl (1999) [49], and Waggoner and Zha (1998) [50]. The VAR model is a statistical model that captures the relationship among multiple quantities over time. Similar to an AR model, each variable in a VAR model has an equation modeling its evolution over time. This equation includes a variable’s lagged (past) values, the lagged values of the other variables in the model, and an error term, as follows:
y t = c + A 1 y t 1 + A 2 y t 2 + + A p y t p + e t
where the variables of form y t 1 indicate the variables’ value from previous periods, called the “ith lag” of y t ; c is a k-vector of the constant serving as the model’s intercept; A i is a time-invariant (k × k) matrix; and et is a k-vector of the error terms [51].

4.3. Data Testing

  • Stationarity test
A prerequisite for using the VAR model is that the data must be stable. Typically, MF and MT data are unstable. Therefore, testing the stationarity of the variable data is necessary. Augmented Dickey–Fuller (ADF) [52] tests are performed in this study for the inspection, and the test results are presented in Table 1.
From the results of the ADF tests in Table 3, it can be seen that at the 5% level, variables lnY and lnX have unit roots, indicating that they are not stable. After the first-order difference of variables lnY and lnX is determined, the null hypothesis of the existence of unit roots is rejected at the 5% significance level, thereby indicating that the variables have first-order single integers, namely, lnY~I (1) and lnX~I (1). This result is in line with the VAR modeling conditions.
2.
Cointegration test and Granger causality test
Conducting a cointegration test is necessary to determine whether a long-term equilibrium relationship exists between the two variables. In this study, the Johansen maximum likelihood method is used to estimate the variables for the cointegration test. Table 4 shows that at the 5% significance level, the two variables have a cointegration relationship, that is, a long-term stable equilibrium relationship exists between MF and MT, thereby satisfying the conditions for establishing the VAR model [53,54,55].
The Granger causality test must be passed to determine the causal relationship between the variables. The Granger causality test can be performed, because variables lnY and lnX have a cointegration relationship of the same order [56,57,58]. The test results are presented in Table 5. At the 5% significance level and subsequent order of 2, MF and MT have a causal relationship. Thus, the development of MF can promote the rapid growth of MT to a certain extent, and at the same time, the development of MT can enable the development of MF.
3.
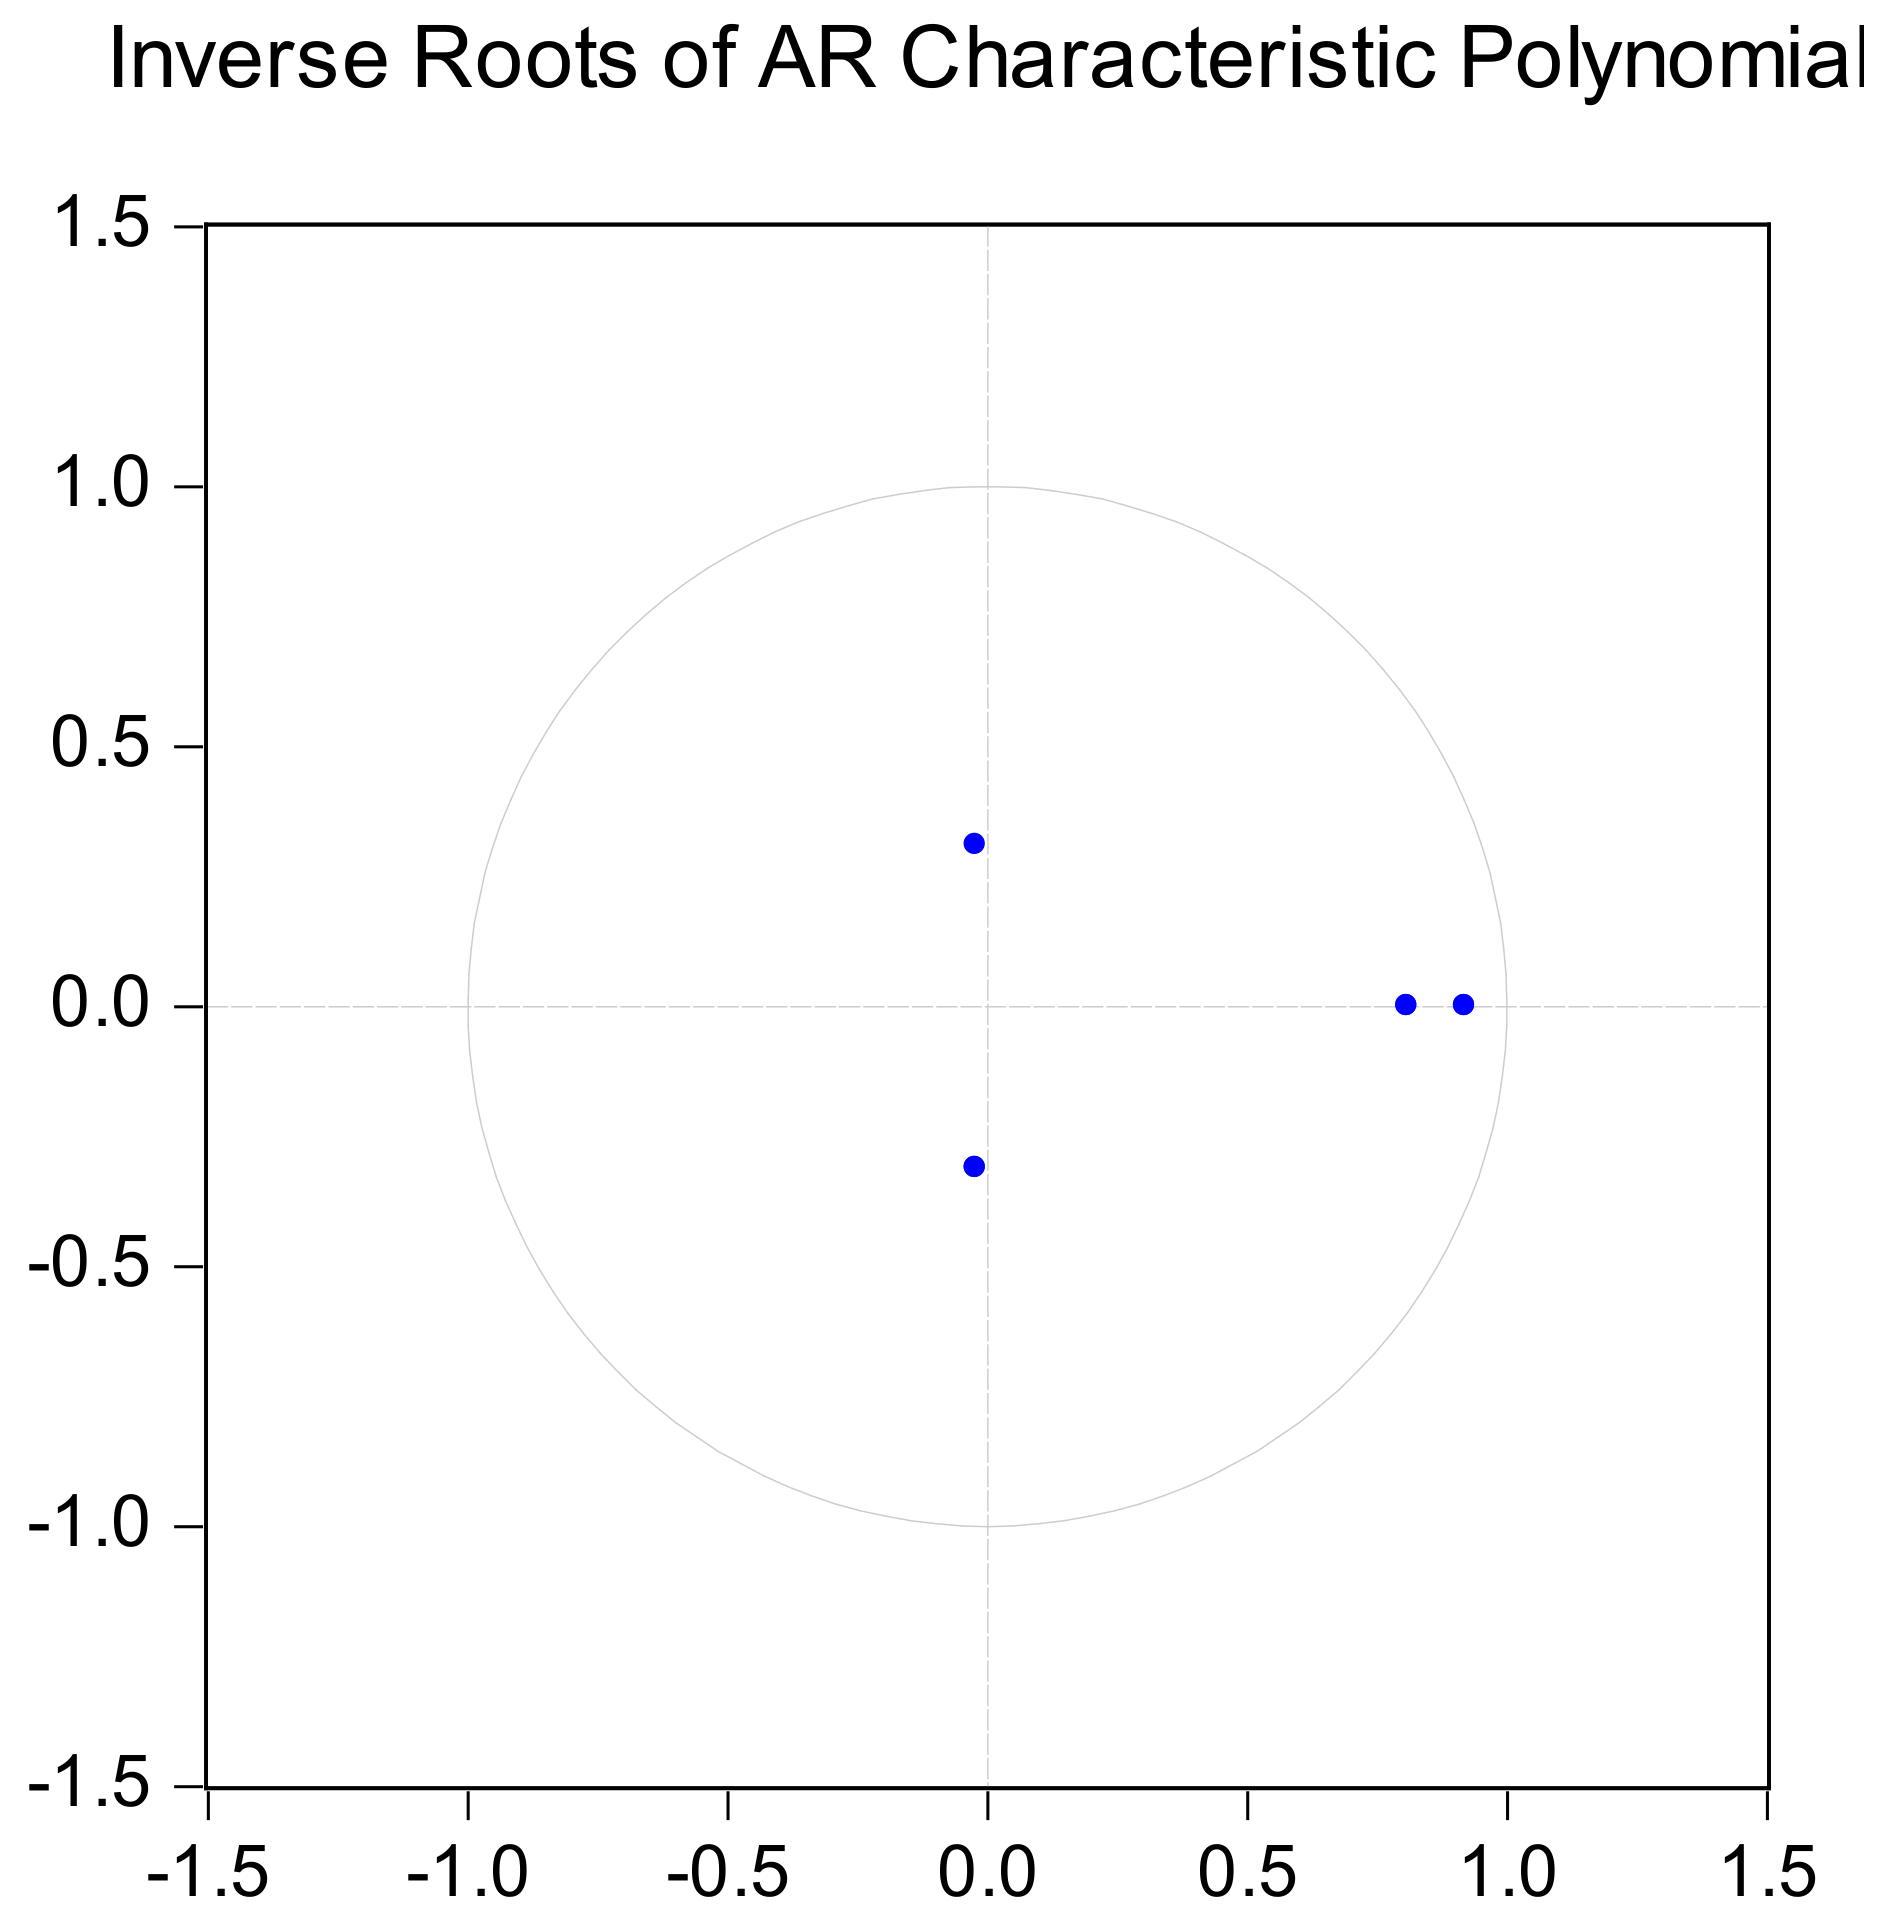
Stability test for VAR model
After the first-order difference is determined, it can be seen that the MF and MT data are stable. In addition, a long-term long-lasting equilibrium relationship exists between the two variables, thereby meeting the conditions for establishing the VAR model. In this study, EViews 8.0 updated by IHS Global INC (Englewood, CO, USA) in 2020 is used to select the VAR(1) model with a lag order of 1. Figure 2 reveals that the shared values of all the characteristic roots of the VAR(1) model are less than 1 and are located in the unit circle. The estimated VAR(1) model is stable and valid, and the subsequent impulse response function and variance decomposition can be performed to analyze the dynamic relationship between the variables [59].

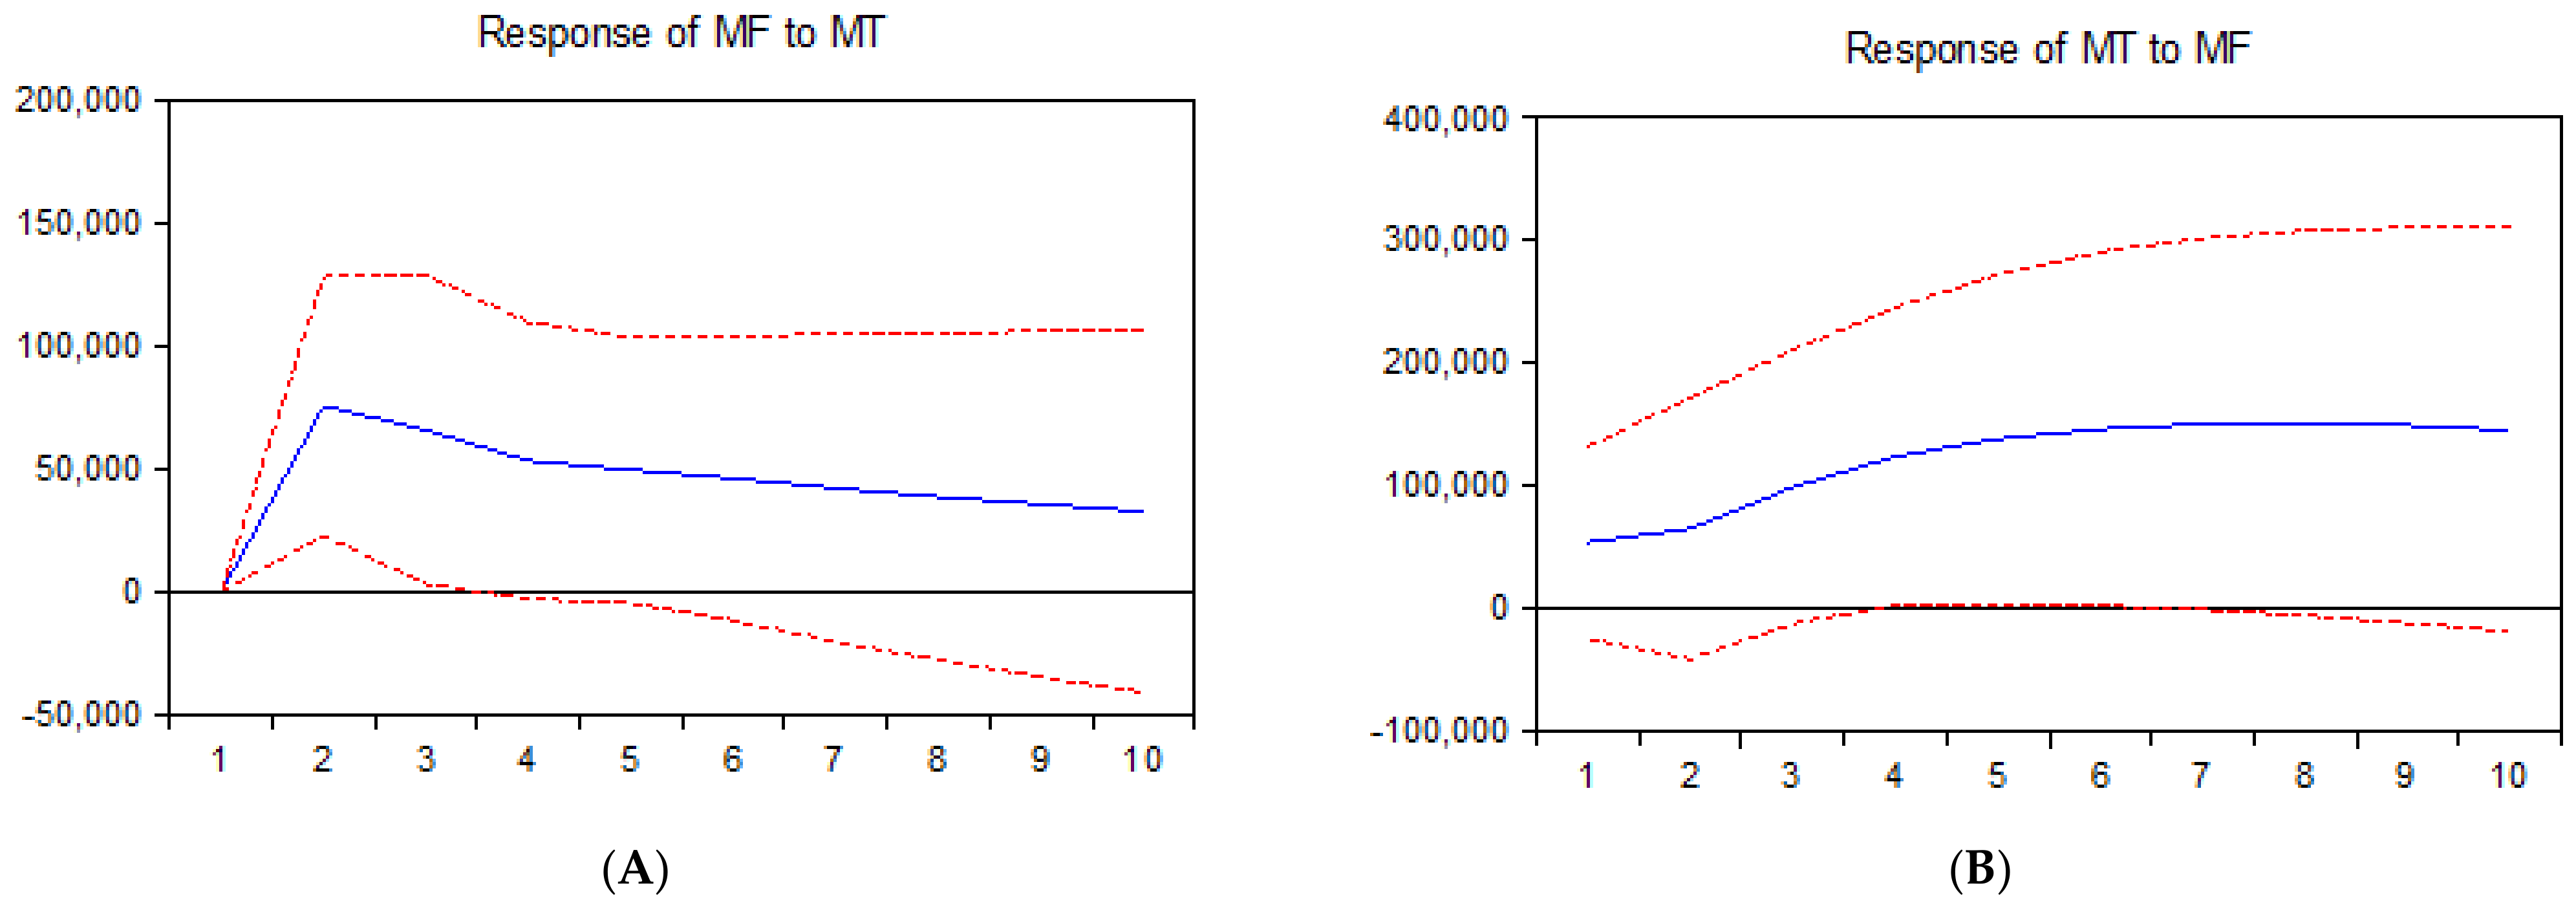
4.4. Impulse Response Analysis

The impulse response function describes the response of the endogenous variable to the impact of the error term plus a standard deviation [60,61]. In this study, the VAR model is analyzed with EViews 8.0, and the MF and MT impulse response function curve is obtained. According to the AR characteristic root test, 30 years is chosen for the tracking in this study. In Figure 3, the horizontal coordinate expresses the number of response lags, the vertical coordinate expresses the degree of response to the shock variable, the blue line represents the effect of the response of the variable to the shock, and the red dashed line is the 95% confidence interval.
As shown in Figure 3A, the impact of MF on MT demonstrates a sharp upward trend in the first five periods (the blue line is the impulse response estimates for a horizon of up t time, and the two red lines are the one-standard error confidence bands). Thus, the development of MF positively impacts MT, reaching the highest point in the fifth period. This hysteresis weakens and gradually approaches zero, because in the early stage, owing to the investment and support of the MF industry and other favorable factors, MT can respond quickly and drive itself. However, with the continuous improvement of the MT mechanism, a decline process begins, and the pull of the industry is weakened significantly. Owing to the impression of marginal effects, the role of MF in promoting MT also declines.
It can be seen from Figure 3B that MT increases slowly during the first eight periods in terms of its impact on MF, and MT has an economic impact on MF. The impact reaches its highest point in the eighth period, where the hysteresis slowly weakens and approaches zero. Thus, MF plays a substantial role in promoting MT within a short period of time. In the long run, the impact of MF on MT tends to be stable, because the MT market and consumer demand cannot immediately promote the growth of MF. A specific time course is necessary, so a time lag exists. Hence, the H1 has been verified.

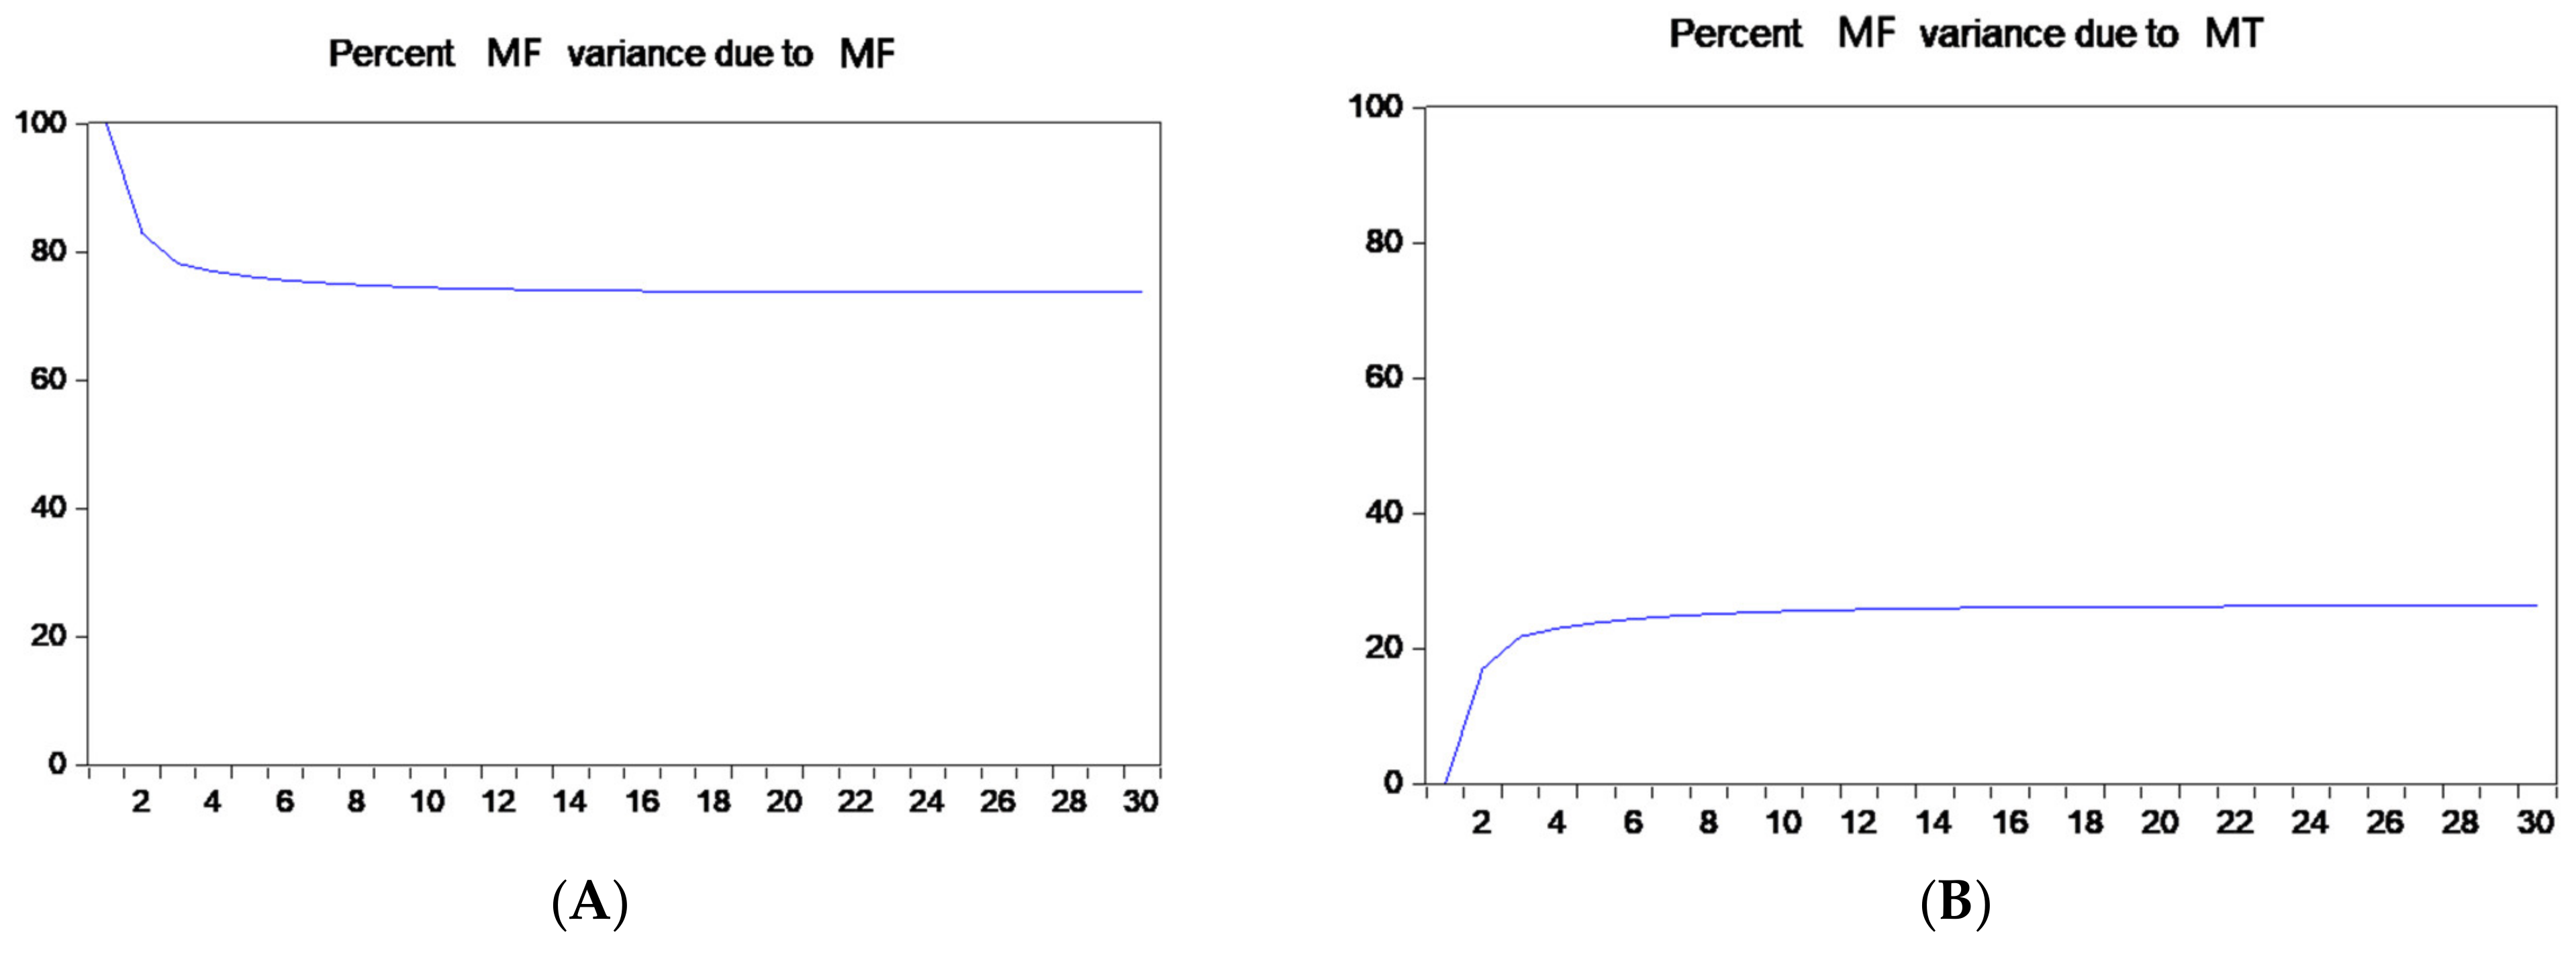
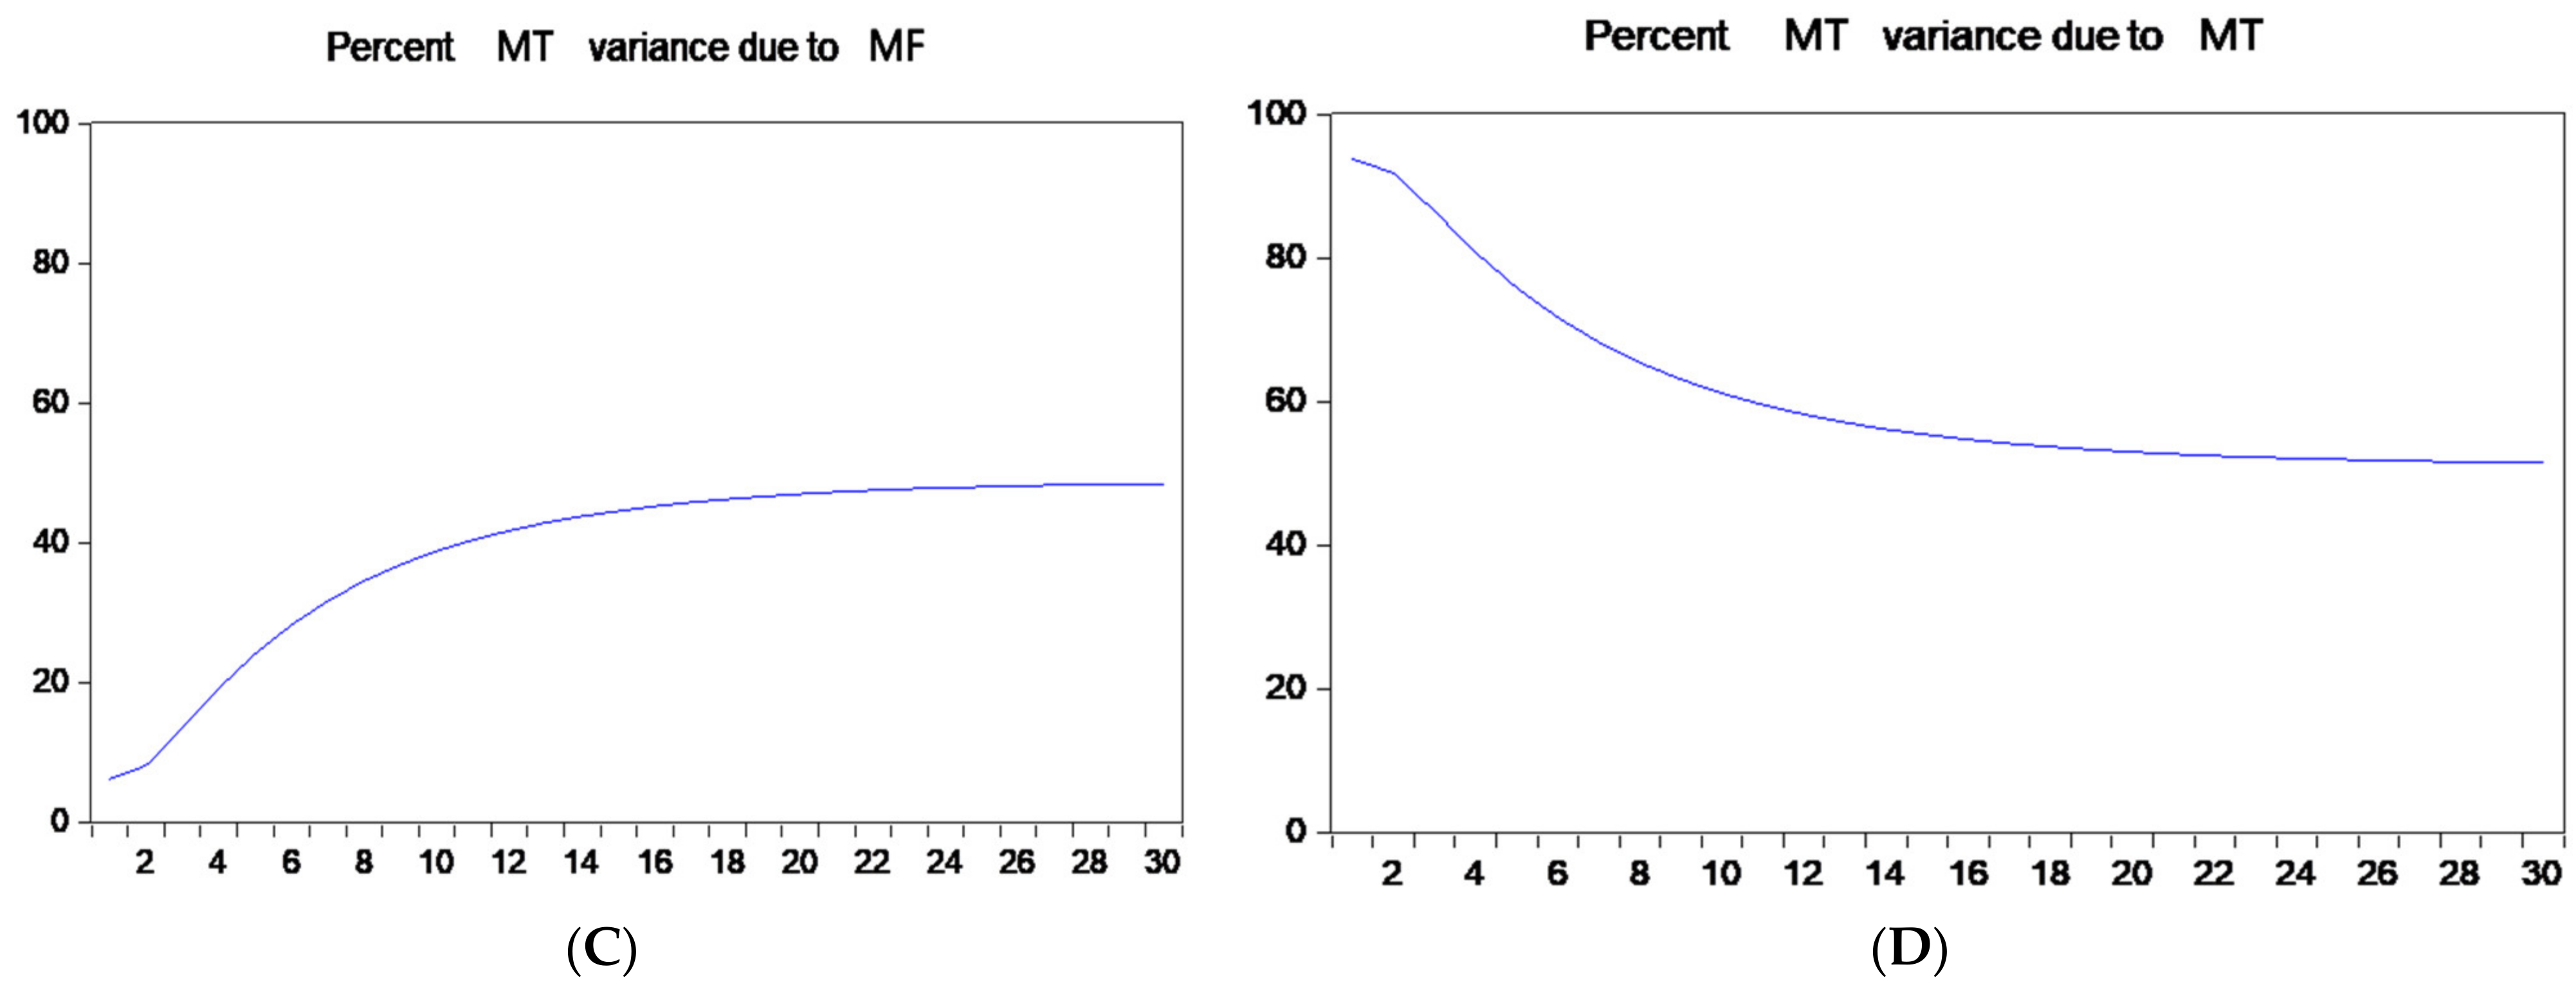
4.5. Variance Decomposition

In econometrics and other multivariate time series analysis applications, a variance decomposition is used to interpret a VAR model once it has been fitted. The variance decomposition indicates the amount of information each variable contributes to the other variables in the AR [62,63]. In addition, it determines how much the exogenous shock can explain the forecast error variance of each variable to the other variables. Figure 4 illustrates the variance decomposition diagram of DlnY and DlnX.
Figure 4A illustrates the MF variance decomposition time path. In the current period, the contribution of MF comes from the industry. Subsequently, it begins to decline, and from the fifth year, it remains at 74%, which is a relatively large proportion. Figure 4B is the time path of the variance decomposition of MF to MT. In the current period, MT does not contribute to MF, but the contribution gradually increases and stabilizes in the fifth period. The contribution of MT to MF accounts for about 26%. Figure 4C shows the variance decomposition of MF by MT. The contribution of MF to MT increases and decreases year by year and stabilizes in the 10th period, remaining at 45%. This result shows that MF can explain the 48% fluctuation in the MT. Figure 4D is the variance decomposition of MT, which decreases year by year and finally remains at the 51% level.
The results show that the contribution of MF to MT is more significant than that of MT to MF, meeting the assumption of H2. The results of the variance decomposition and impulse response analysis are consistent.

5. Japan’s MF and MT Integration Model

From the perspective of industrial integration, the theory of industrial integration is used in this section to summarize and analyze the integration mechanism of Japan’s MF and MT.

5.1. Characteristics of Japanese Industrial Convergence

In recent years, Japan attached considerable importance to the development of industrial integration and adopted some MF and MT safeguard measures effectively.
(1)
Legal support
Regarding the legal system measures for integrating MF and MT, the examination begins with the six industries of Japan. Since the presentation of Japanese scholar Imamura Naraomi of the “six industrializations” in the 1990s, the Japanese government has attached considerable importance to related process industrialization policies. In 2008, the Japanese government presented a policy outline to develop the sixth industry for the first time in the “Development Goals of the Sixth Industry in Agriculture, Mountain and Fishing Villages”. Industry practitioners joined SMEs to explore the development of the sixth industry. In 2009, the Ministry of Agriculture, Forestry and Fisheries issued the “Sixth Industrialization White Paper”, and in 2010, to promote the sixth industrialization nationwide, the Japanese government implemented several regulations and policies, such as the “Outline for the Implementation of the Sixth Industrialization Policy for Agricultural, Mountain and Fishing Villages” and “Outline for the Delivery of Subsidies Related to the Sixth Industrialization of Agricultural and Fishing Villages”. The regulations and policies involve the government, agricultural associations and agricultural practitioners, and other parties, and include preparation, implementation outlines, support measures, sixth-industry certification, development plans, and other information. The development of the six industries extensively promoted the rapid development of MF and MT.
(2)
Fisheries associations and tourism associations
The JFA is an autonomous and interactive cooperative organization for fishermen and has a history of more than 100 years. As of 2012, the number of fisheries associations in Japan totaled 1935. In the industrial integration, the JFA plays an irreplaceable role in providing development funds, production technology, marketing channels, and so on. Meanwhile, the Japan Travel Association was established in 1959 to protect the rights and interests of tourists and provide guidance and advice on the business management and operation of travel agencies.
(3)
Financial support
The Japanese government introduced a series of fiscal subsidies to strengthen industrial integration, including fixed and proportional subsidies. For example, the expenditure subsidy for new product development and market expansion increased from 1/2 to 2/3, and a 50% subsidy is given for construction and the purchase of equipment required for the processing and selling of new products. Financial support also includes policy measures such as extending the term of interest-free agricultural improvement loans and increasing the maximum loan amount. In 2010, the Japanese Cabinet passed the “Agriculture, Forestry and Fishery Growth Industrialization Support Agency” bill. The state and enterprises jointly funded the establishment of the Agriculture, Forestry and Fishery Growth Fund to provide investment support to policy subsidies, “bad-end” loans, and equity investments, thereby promoting the development of industrial integration.

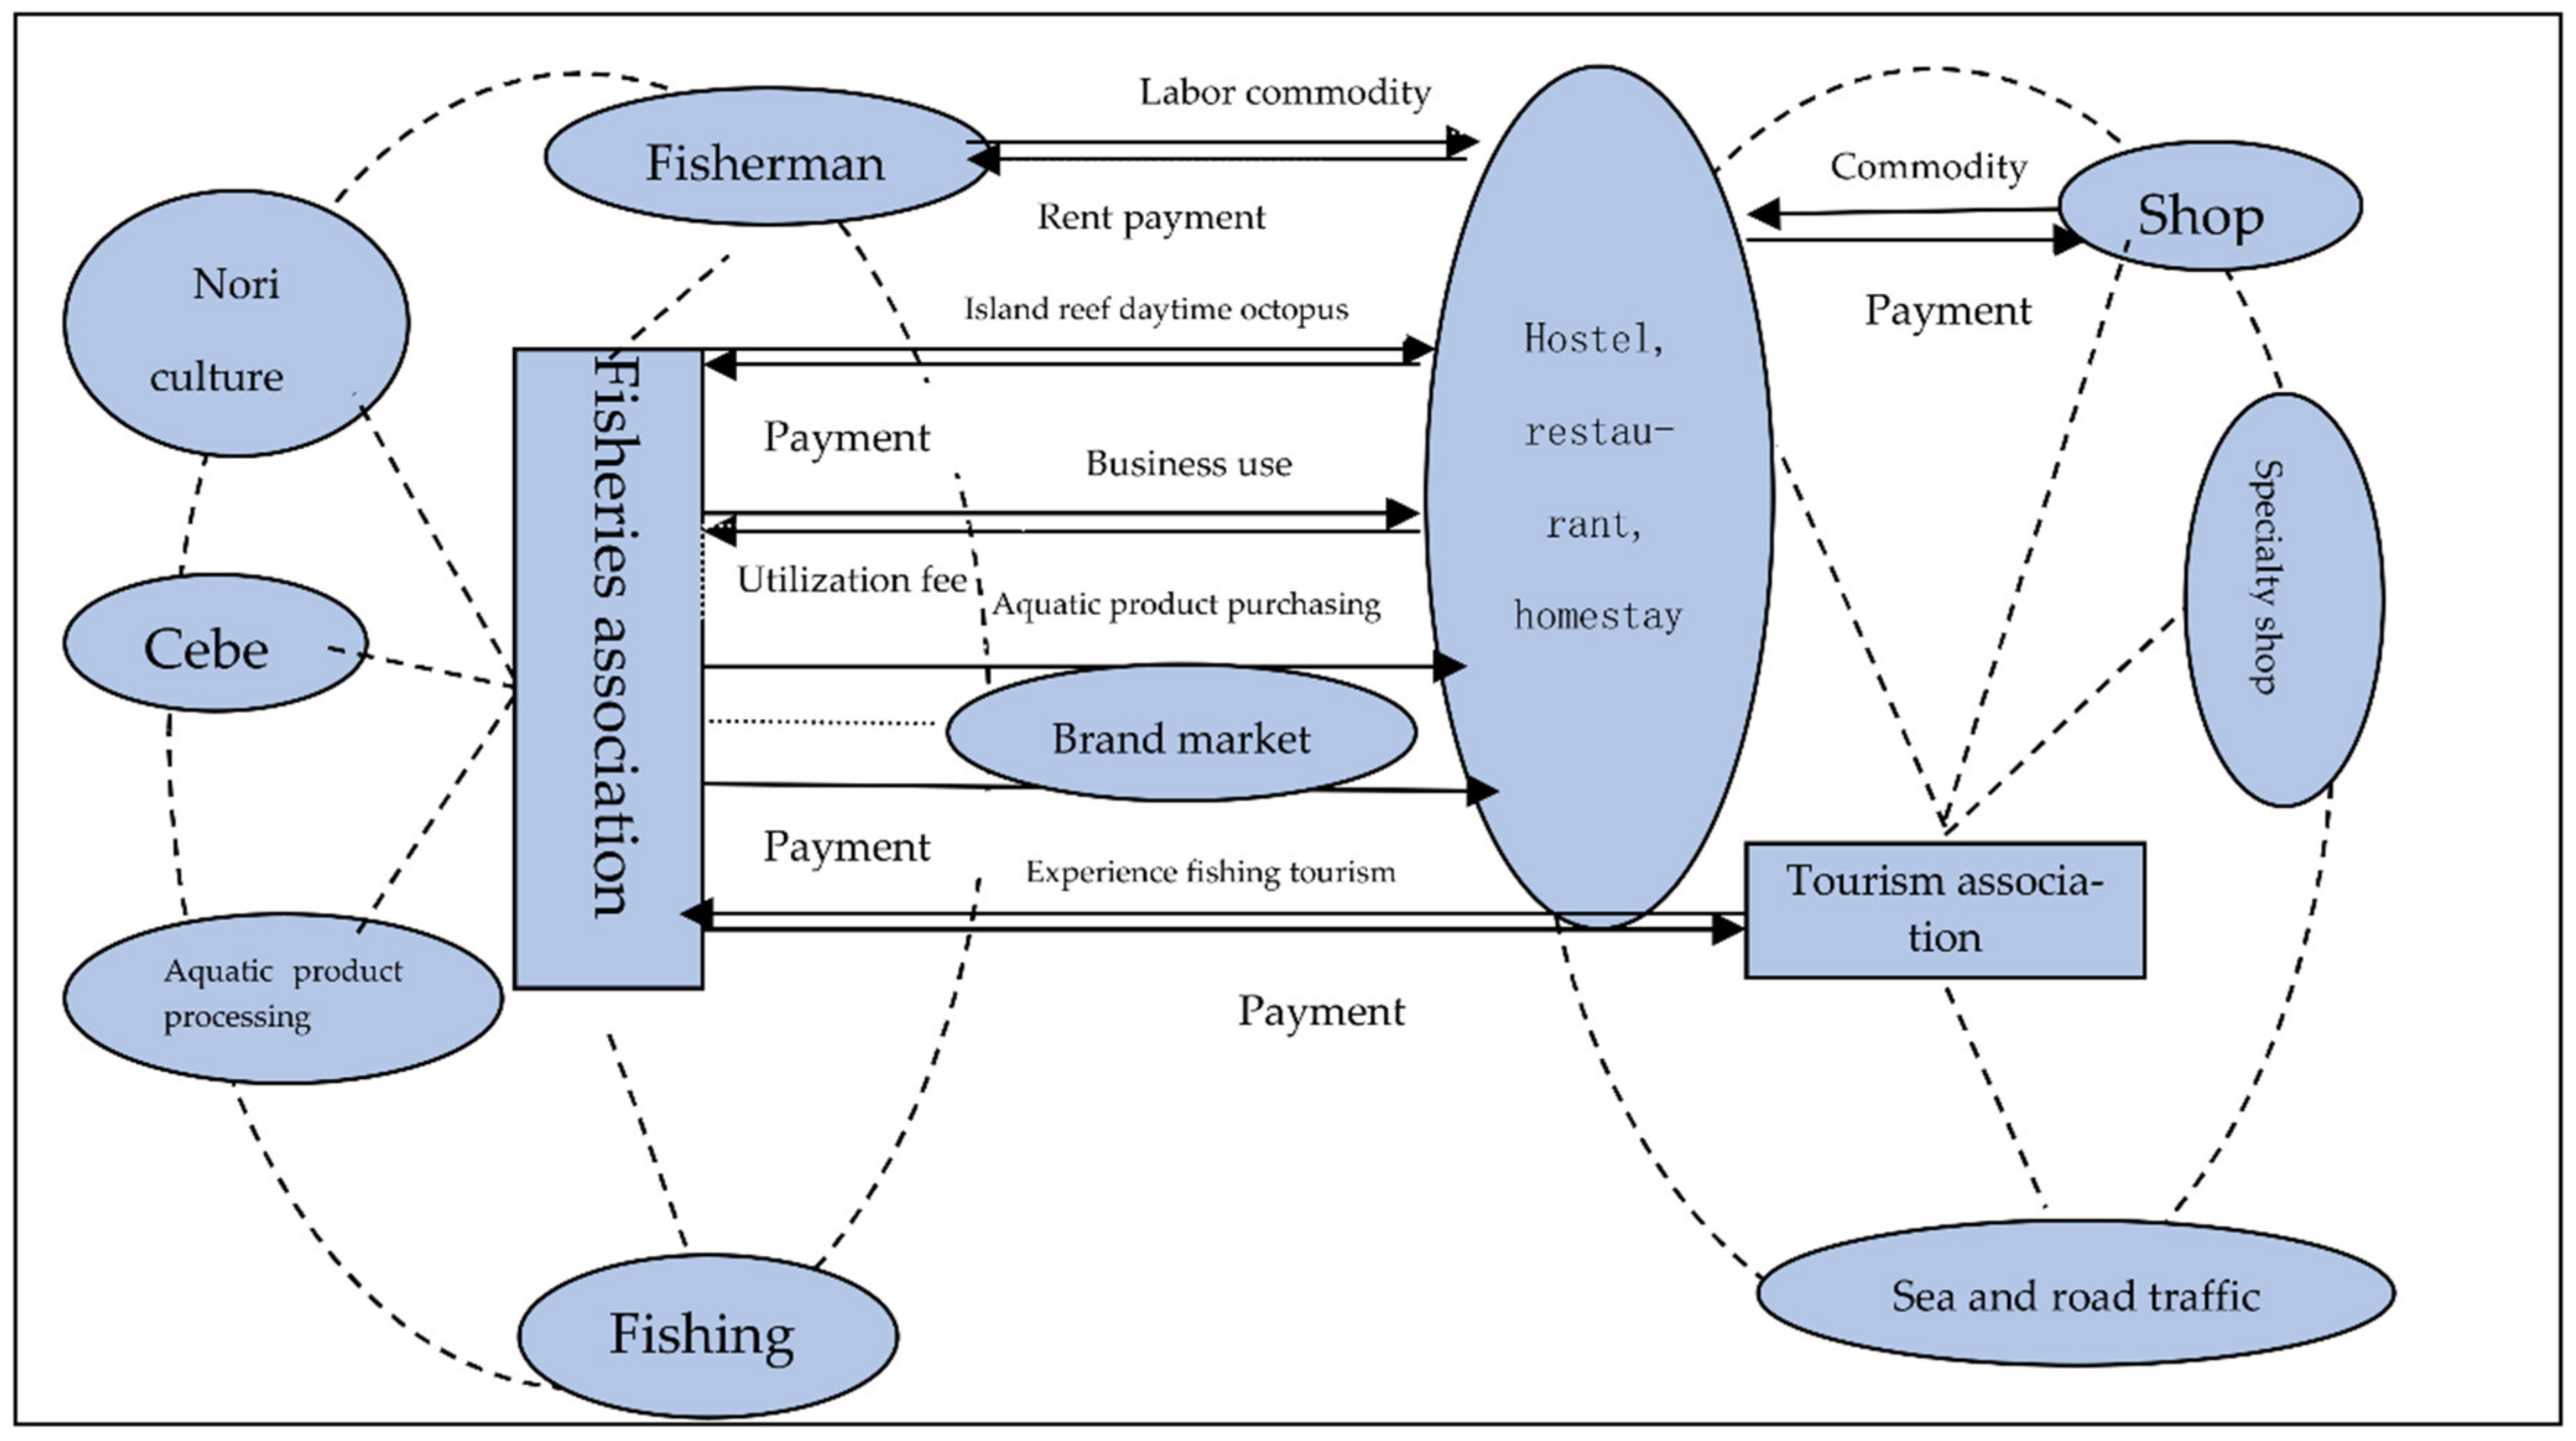
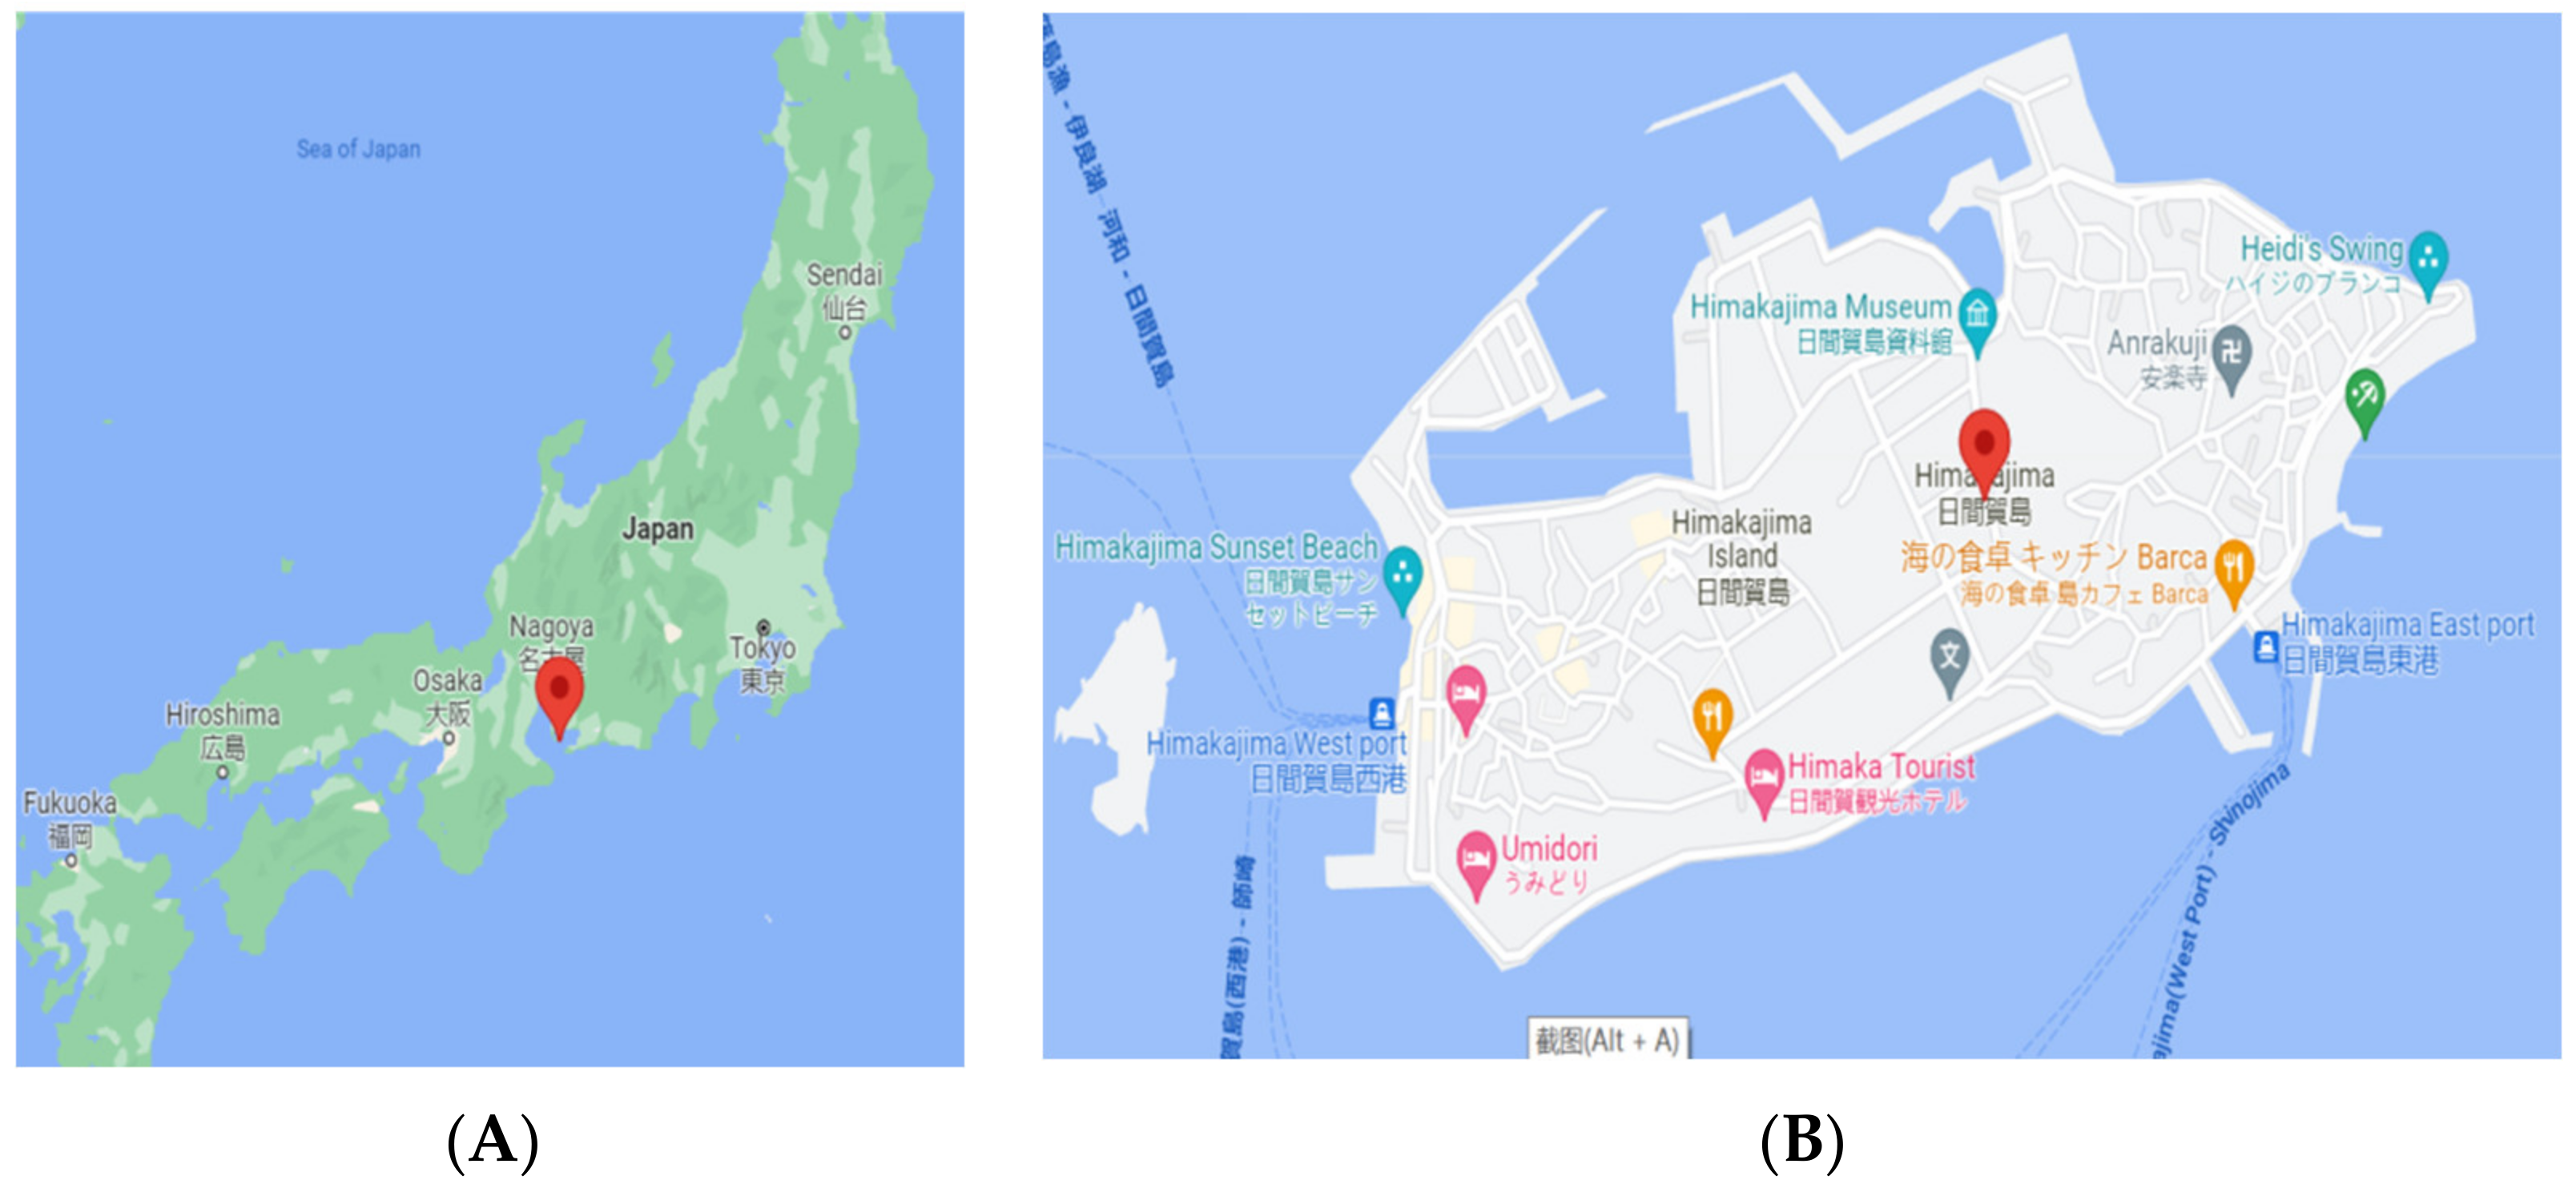
5.2. Industrial Convergence Case Study—Himakajima

Himakajima Island is located in the central region of Japan, close to Nagoya, and is dominated by fishing and tourism. The island has a circumference of about 5.5 km, a warm climate, abundant fish and shellfish, and beautiful scenery (Figure 5).
In recent years, Himakajima Island obtained certain economic benefits through MF and MT integration. Himakajima Island’s industrial integration system consists of four parts: (1) realizing the integration of fisheries and tourism through the trading of aquatic products, (2) realizing the integration of individual fishermen and tourism operators through employment, (3) realizing the sightseeing integration of industry players and fisheries associations, and (4) realizing the integration of tourism industry players (Figure 6).
(1)
Integration of products. This type of integration mainly involves tourism practitioners using the local aquatic products caught by fishery practitioners as ingredients in their menu and a transaction relationship between the two industries. Particular emphasis is placed on the cooperation between tourism and fishery professionals in the building of aquatic product brands. Initially, the tourism practitioners proposed the branding of the island’s aquatic products for sale, and the local fishery practitioners actively responded to their idea. The local aquatic product brands play an important role in promoting the tourism industry. Well-known aquatic product brands include “HimaKajima Octopus”, “HimaKajima Pufferfish”, “Island Laver”, and “Pompei Bay”. By building the aquatic product brands in the Japanese production area, the prices of the aquatic products in this area are higher than those of products in other areas in the same period. Well-known aquatic products include “Hikaga octopus” and “Hikashima pufferfish”. The fishery products purchased by fisheries associations are provided to tourism practitioners at a pre-negotiated price throughout the year.
(2)
Integration of industrial sectors. The integration of industrial sectors mainly involves the use of the procurement business and credit business of fisheries associations by the tourism industry as quasi-members. This integration can reduce business risks to a certain extent and considerably benefit the tourism industry and fisheries associations. This type of integration is mainly manifested in four aspects: (a) in the process of aquatic product trading and economic cycle within the individual fishery sector and tourism sector, (b) in the labor cycle, (c) in the economic cycle between the fisheries associations and tourism associations, and (d) in the internal circulation of tourism associations. Through the economic cycle of the four aspects, the interest cycle between the economic entities is realized, and the economic benefits of various departments are ensured for subsequent contributions. In recent years, the integration mechanism of Himakajima Island reduced the operational risks of fisheries and tourism while bringing new opportunities to develop the local tourism and fisheries.
(3)
Employment integration in the industrial sector. This integration is mainly achieved by employing homemakers from fishers’ homes in the tourism sector. That is, letting the “foreign currency” earned by the tourism industry realize regional circulation through employment and maintain the stability of fishermen’s self-employment. As MF is an industry that targets nature, fishery production is highly susceptible to natural conditions such as weather and seasonal changes, thereby making the livelihood of individual fishermen unstable. By providing work to homemakers from fishers’ homes, the income from the work can be used as a stabilizer for fishermen’s self-employment. In other words, if a sideline income exists, despite the change in the catch, the stability of a fisherman’s business can be ensured to a certain extent. The formation and maintenance of the regional labor market also play a specific role in mitigating the decline and aging of the island’s population.
(4)
Cooperation among tourism companies by teaching and popularizing cooking skills through joint cooking lectures; implementing standard menus, standard prices, and daily publicity activities in the region; and determining ways to use island businesses for purchasing food, supporting new entrepreneurs (recommendations for processing and sales and related service industries when opening new stores), and other cooperative and collaborative relationships. Among such measures, “default rules” for purchasing food ingredients exist in the region, which can be considered as an essential economic cycle that formed the current Higashima Island. The core players in this integration are hotels, inns, homestays, and other business operators. When purchasing materials/ingredients for their business, such entities try their best to buy from local stores/providers.

5.3. Impact of Industrial Integration

(1)
Reduction of transaction costs
The convergence development of MF and MT improved resource allocation efficiency. At the same time, the convergence expanded and extended the industrial value chain of both industries to a certain extent, giving full play to their economies of scale. The merging of MF and MT achieved optimal development in the industrial value chain and reduced the market transaction costs of each link in the single development process and across the industry chain.
(2)
Creation of aquatic product brands
With the in-depth development of MF and MT, the spatial agglomeration of related companies and value chain support departments and regional characteristics of the converged industries will become increasingly apparent, providing a solid industrial foundation for building an influential aquatic product brand. At the same time, once a regional marine product industry brand is formed and recognized by the market, it will bring stable consumer groups and operating profits, drive regional economic development, and promote government departments to improve related public services. In addition, effective government public services will further help facilitate the agglomeration and allocation of production factors, such as technology and capital, and promote information sharing and cooperation among affiliated companies, thereby enhancing the market competitiveness of agricultural industry brands and forming a benign relationship between industrial integration and industrial branding.
(3)
Promotion of social and economic development in fishing areas
The convergence development of MF and MT enabled fishermen to diversify their income instead of relying on a single source, that is, marine fishing. At the same time, owing to the extension of the industrial chain, the added value of aquatic products (e.g., brand value) increased as well as the income of the fishermen in the fishing community.

6. Conclusions

In this study, first, the industrial integration relationship between MF and MT is analyzed through a VAR model based on industry association theory. The research results show a long-term stable equilibrium relationship between MF and MT, and the linkage development between the two industries is in a long-term change process. In the analysis of the impulse response function, it is found that in the short term, the impact of MF on MT is more significant than the impact of MT on MF after the effect. However, the degree of influence gradually decreases and eventually levels off. The results of the variance analysis reveal that the contribution of MF to MT is more significant than the contribution of MT to MF. Second, through a case analysis of the MF and MT integration methods of Japan’s Himakajima Island, it is found that Himakajima obtains certain economic benefits through the convergence development of its MF and MT in recent years. The converged development of tourism expanded the industrial value chain of both industries to a certain extent, reduced transaction costs, shaped various aquatic product brands, and promoted the social and economic development of fishing areas. Based on the research results, three recommendations are presented:
(1)
Industrial transformation and upgrading. The transformation and upgrading of MF should be accelerated, and space for fishery development should be vigorously expanded. MT must be developed extensively, and the traditional development model should be improved. The advantages of MT resources should be given full play, the development and management of tourism resources should be improved, and the industrial value chain should be extended.
(2)
Industrial integration and development. The industrial linkage between MF and MT is the primary condition for industrial integration. Thus, the scientific and reasonable layout of marine industries and recycling of marine resources are necessary. Investment in marine science and technology should be increased to improve the efficiency of the use of marine resources. In addition, the marine industry chain should be expanded and improved gradually, the marine industry integration mechanism should be innovated, and the integration of MF and MT internal resources, technology, products, and markets should be enhanced. The marine industry development model should be optimized, and new marine industry sectors should be innovated. Furthermore, areas with special conditions should be encouraged to take the traditional fishing culture as their foundation and fishing and ecological aquaculture waters as their landscape, vigorously develop recreational fisheries, and develop in-depth recreational fishery demonstration bases.
(3)
Green ecological development. Coastlines and sea areas are the spatial carriers of MF and MT development. The advantages and disadvantages of their environment can determine the sustainability of the development of the two major industries. Maintaining the marine ecological environment, accelerating the construction of marine environments classified as protection or access systems, reasonably controlling the number of marine aquaculture and tourism firms, improving pollution prevention and control capabilities, implementing pollutant discharge assessment and accountability systems for marine-related enterprises, and strengthening management are necessary. Finally, the pollution and destruction of the marine environment should be prevented, and the protection of marine resources should be improved.

Author Contributions

For research articles with several authors, the following statement should be used: Conceptualization—W.Y. and W.Z.; methodology—W.Y.; software—W.Y.; validation—W.Y. and P.L.; formal analysis—W.Y.; investigation—W.Y.; resources—W.L.; data curation—W.Y.; writing (original draft preparation)—W.Y.; writing (review and editing)—W.Y.; visualization—W.Y.; supervision W.L.; project administration—W.Z.; funding acquisition—W.L. All authors have read and agreed to the published version of the manuscript.

Funding

This research was funded by Japan Science and Technology SPRING (Grant Number JPMJSP2147). Also, this study was supported by National Natural Science Foundation Project (Grant Number: 71873040), Key Scientific Research Platform and Scientific Research Project of Guangdong Colleges and Universities (Grant Number:2019WZJD004), and the Open Project of Mangrove Institute, Lingnan Normal University (Grant Number: PYXM03).

Institutional Review Board Statement

Not applicable.

Informed Consent Statement

Not applicable.

Data Availability Statement

Not applicable.

Conflicts of Interest

The authors declare no conflict of interest.

References

  1. Ikegawa, Y.; Tobase, T. Estimation of potential oceanic regions and possible CO2 amounts for storage using self-sealing of CO2 hydrate around Japan. J. JSCE 2021, 9, 276–283. [Google Scholar] [CrossRef]
  2. Yang, B.; Liu, Y. Japan’s marine economic development and competition with China. Ccamlr. Sci. 2018, 25, 83–96. [Google Scholar]
  3. Karan, P.P. Japan in the 21st Century: Environment, Economy, and Society; University Press of Kentucky: Lexington, KY, USA, 2005; p. 416. [Google Scholar]
  4. Henocque, Y. Towards Integrated Coastal and Ocean Policies in France: A Parallel with Japan. In Global Change: Mankind-Marine Environment Interactions; Springer: Berlin/Heidelberg, Germany, 2011; pp. 191–196. [Google Scholar]
  5. Makino, M.; Matsuda, H.; Sakurai, Y. Expanding fisheries co-management to ecosystem-based management: A case in the Shiretoko World Natural Heritage area, Japan. Mar. Policy 2009, 2, 207–214. [Google Scholar] [CrossRef] [Green Version]
  6. Kuroda, H.; Setou, T. Extensive Marine Heatwaves at the Sea Surface in the Northwestern Pacific Ocean in Summer 2021. Remote Sens. 2021, 19, 3989. [Google Scholar] [CrossRef]
  7. Koyano, M. Revitalization of Japan’s Fishing Industry: A Legal Perspective—The Cases of Rishiri and Rebun Islands. In Economic Challenges Facing Japan’s Regional Areas; Springer: Berlin/Heidelberg, Germany, 2018; pp. 51–64. [Google Scholar]
  8. Hudson, M.J. Globalization and the Historical Evolution of Japanese Fisheries. In Maritime Prehistory of Northeast Asia; Springer: Berlin/Heidelberg, Germany, 2022; pp. 97–122. [Google Scholar]
  9. Tacon, A.G.J.; Metian, M. Fish Matters: Importance of Aquatic Foods in Human Nutrition and Global Food Supply. Rev. Fish Scir. 2013, 1, 22–38. [Google Scholar] [CrossRef]
  10. Anderson, C.A.M.; Appel, L.J. Dietary sources of sodium in China, Japan, the United Kingdom, and the United States, women and men aged 40 to 59 years: The Intermap study. J. Am. Diet Assoc. 2010, 5, 736–745. [Google Scholar] [CrossRef] [Green Version]
  11. Frankic, A.; Hershner, C. Sustainable aquaculture: Developing the promise of aquaculture. Aquacult. Int. 2003, 6, 517–530. [Google Scholar] [CrossRef]
  12. Tigchelaar, M.; Leape, J.; Micheli, F. The vital roles of blue foods in the global food system. Glob. Food Secur. Agric. 2022, 33, 1–11. [Google Scholar] [CrossRef]
  13. Ministry of Agriculture, Forestry and Fisheries. Fishery Output Statistics 1985–2018. Available online: https://www.maff.go.jp/j/tokei/kouhyou/gyogyou_seigaku/ (accessed on 15 March 2022).
  14. Sakamoto, S. Japan and the Law of the Sea: Key Historical and Contemporary Milestones. In Implementation of the United Nations Convention on the Law of the Sea; Springer: Berlin/Heidelberg, Germany, 2021; pp. 17–38. [Google Scholar]
  15. Nakamura, M.; Hattori, T.; Kariya, M. Comparison of structural changes in the agriculture and fisheries industries before and after the Great East Japan Earthquake: A case study of Iwate Prefecture’s coastal area. Fish. Sci. 2022, 2, 345–361. [Google Scholar] [CrossRef]
  16. Ganseforth, S. Blue revitalization or dispossession? Reform of common resource management in Japanese small-scale fisheries. Geogr. J. 2021, 1–13. [Google Scholar] [CrossRef]
  17. Kim, H.; Kim, E.J. Tourism as a Key for Regional Revitalization? A Quantitative Evaluation of Tourism Zone Development in Japan. Sustainability 2021, 13, 7478. [Google Scholar] [CrossRef]
  18. Kitamura, Y.; Ichisugi, Y.; Karkour, S. Carbon Footprint Evaluation Based on Tourist Consumption toward Sustainable Tourism in Japan. Sustainability 2020, 12, 2219. [Google Scholar] [CrossRef] [Green Version]
  19. Survey on National Maritime Awareness 2019. Available online: https://www.nippon-foundation.or.jp/what/projects/uminohi (accessed on 19 March 2022).
  20. Japan Maritime Center. Survey on National Maritime Awareness 2019. Available online: https://www.nippon-foundation.or.jp/app/uploads/2019/07/new_pr_20190708_01.pdf (accessed on 23 May 2022).
  21. The Japan Tourism Country Policy Aims to Make Full Use of the Characteristics of Each Region, Strive to Create Attractive Tourist Spots, Spread the Charm of the Traditions and Cultures of Each Region at Home and Abroad, and Promote International and Domestic Tourism. Systematically Promote Measures Related to the Realization of a Tourism-Oriented State. Available online: https://www.mlit.go.jp/common/000058546.pdf (accessed on 30 May 2022).
  22. Statistics from the Ministry of Land, Infrastructure, Transport and Tourism of Japan. Available online: https://www.mlit.go.jp/kankocho/siryou/toukei/in_out.html (accessed on 30 May 2022).
  23. White Paper on the Oceans and Ocean Policy in Japan. Available online: https://www.spf.org/global-data/20181107105524314.pdf (accessed on 2 June 2022).
  24. Department of Marine Strategic Planning and Economy; Ministry of Natural Resources of China. The Statistical Communique of Chinese Marine Economy in 2019. Available online: http://gi.mnr.gov.cn/202005/t20200509_2511614.html (accessed on 22 June 2022).
  25. Rosenberg, N. Technological Change in the Machine Tool Industry, 1840–1910. J. Econ. Hist. 1963, 23, 414–443. [Google Scholar] [CrossRef]
  26. Lu, Y. Industrial Integration: A Literature Review. J. Ind. Integr. Manag. 2016, 2, 1650007. [Google Scholar] [CrossRef]
  27. Uekusa. Industrial Convergence of Information and Communication Industry. China Ind. Econ. 2001, 2, 24–27. [Google Scholar]
  28. Han, S.; Li, X. Research of industrial evolution and division based on industrial convergence. China Ind. Econ. 2009, 12, 66–75. [Google Scholar]
  29. Greenstein, S.; Khanna, T. What does industry convergence mean? In Competing in an Age of Digital Convergence; Yoffie, D., Ed.; Harvard Business Press: Brighton, MA, USA, 1997; p. 2010226. [Google Scholar]
  30. Dai, S. Study on the industrial convergence and enhancing industrial competitiveness. J. Shandong I. Bus. Technol. 2004, 18, 14–17. [Google Scholar]
  31. Gao, L.; Xia, J. The dynamic mechanism, path, and policy choice of the integration of China’s tourism industry. J. Cap. Univ. Econ. Bus. 2012, 14, 52–57. [Google Scholar]
  32. Zhao, J. Research on the Influencing Factors and Spatial Spillover Effects of China’s Regional Tourism Economic Growth—Based on the Spatial Dubin Panel Model. Soft Sci. 2016, 30, 53–57. [Google Scholar]
  33. Miret-Pastor, L.; Molina-García, A.; García-Aranda, C.; Herrera-Racionero, P. The connection between recreational fishing and the traditional fishing sector in the emerging area of marine tourism: Challenges and opportunities for diversification with the European Fisheries Fund (EFF). ICES J. Mar. Sci. 2020, 77, 2369–2374. [Google Scholar] [CrossRef]
  34. Funck, C. Conflicts over Space for Marine Leisure: A Case Study of Recreational Boating in Japan. Curr. Issues Tourc. 2006, 4, 459–480. [Google Scholar] [CrossRef]
  35. Tsai, F.M.; Bui, T.-D.; Tseng, M.-L.; Lim, M.; Tan, K.; Raymond, R. Sustainable solid-waste management in coastal and marine tourism cities in Vietnam: A hierarchical-level approach. Resour. Conserv. Recycl. 2021, 168, 105266. [Google Scholar] [CrossRef]
  36. Liu, P.; Sun, J. Marketing Strategy of Marine Resort: An Exploratory Study. J. Coast. Res. 2020, 106, 42–44. [Google Scholar] [CrossRef]
  37. Yi, L. The Measurement of High-Quality Development Level of Tourism: Based on the Perspective of Industrial Integration. Sustainability 2022, 14, 3355. [Google Scholar]
  38. Ma, H.J.; Sun, Q.; Gao, Y.; Gao, Y. Resource Integration, Reconfiguration, and Sustainable Competitive Advantages: The Differences between Traditional and Emerging Industries. Sustainability 2019, 11, 551. [Google Scholar] [CrossRef] [Green Version]
  39. Sick, N.; Brring, S. Exploring the research landscape of convergence from a TIM perspective: A review and research agenda. Technol. Forecast. Soc. 2022, 175, 121321. [Google Scholar] [CrossRef]
  40. Lee, S.M.; Lim, S. Convergence Revolution. In Living Innovation; Emerald Publishing Limited: Bingley, UK, 2018; pp. 63–76. [Google Scholar]
  41. Wang, L.; Zhang, H. The Impact of Marine Tourism Resources Development on Sustainable Development of Marine Economy. J. Coast. Res. 2021, 94, 589–592. [Google Scholar] [CrossRef]
  42. Williams, L.D. Concepts of Digital Economy and Industry 4.0 in Intelligent and information systems. Int. J. Intell. Netw. 2021, 2, 122–129. [Google Scholar] [CrossRef]
  43. 2010 Marine Industry Activity Status Survey Report. Available online: https://www8.cao.go.jp/ocean/policies/chousa/pdf/h20san_houkoku.pdf (accessed on 2 July 2022).
  44. 2018 Marine Industry Structure and Scale System Survey Report. Available online: http://fields.canpan.info/report/detail/22489 (accessed on 2 July 2022).
  45. Japan Input-Output Table. Available online: https://www.soumu.go.jp/toukei_toukatsu/data/io/index.htm (accessed on 2 July 2022).
  46. Sims, C.A. Macroeconomics and Reality. Econometrica 1980, 48, 1–48. [Google Scholar] [CrossRef] [Green Version]
  47. Lutkepohl, H. Introduction to Multiple Time Series Analysis; Springer: Berlin/Heidelberg, Germany, 1991. [Google Scholar]
  48. Watson, M.W. Vector autoregressions and cointegration. In Handbook of Econometrics; Elsevier: Amsterdam, The Netherlands, 1994; pp. 2843–2915. [Google Scholar]
  49. Lutkepohl, H.; Saikkonen, P. Order Selection in Testing for the Cointegrating Rank of a VAR Process. In Cointegration, Causality, and Forecasting; Oxford University Press: Oxford, UK, 1999; pp. 68–199. [Google Scholar]
  50. Waggoner, D.F.; Zha, T. Conditional Forecasts in Dynamic Multivariate Models. Rev. Econ. Stat. 1998, 81, 639–651. [Google Scholar] [CrossRef]
  51. Bator, E.T.; Adjieteh, M.A.; Jin, L.C.; Asenso, T.Q. Vector Autoregressive Models for Multivariate Time Series Analysis; Macroeconomic Indicators in Ghana. Math. Theor. Model. 2018, 8, 34–48. [Google Scholar]
  52. Dickey, D.A.; Fuller, W.A. Distribution of the Estimators for Autoregressive Time Series with a Unit Root. J. Am. Stat. Assoc. 1979, 74, 427–431. [Google Scholar]
  53. Juselius, K. The Cointegrated VAR Model: Methodology and Applications; Oxford University Press: Oxford, UK, 2006. [Google Scholar]
  54. Johansen, S. Statistical analysis of cointegration vectors. J. Econ. Dyn. Control 1988, 12, 231–254. [Google Scholar] [CrossRef]
  55. Johansen, S. Estimation and Hypothesis Testing of Cointegration Vectors in Gaussian Vector Autoregressive Models. Econometrica 1991, 59, 1551–1580. [Google Scholar] [CrossRef]
  56. Kitamura, Y. Likelihood based inference in cointegrated vector autoregressive models. Economet. Theor. 1998, 14, 517–524. [Google Scholar] [CrossRef]
  57. Eichler, M. Granger causality and path diagrams for multivariate time series. J. Econom. 2007, 2, 334–353. [Google Scholar] [CrossRef]
  58. Osterholm, P.; Hjalmarsson, E. Testing for Cointegration Using the Johansen Methodology When Variables are Near-Integrated? IMF Work. Pap. 2007, 141, 19. [Google Scholar] [CrossRef]
  59. Anderson, H. Unit Roots, Cointegration, and Structural Change. Econ. Rece. 1999, 231, 439–441. [Google Scholar]
  60. Pesaran, H.; Shin, Y. Generalized impulse response analysis in linear multivariate models. Econ Lett. 1998, 1, 17–29. [Google Scholar] [CrossRef]
  61. Ivanov, V.; Kilian, L.A. Practitioner’s Guide to Lag Order Selection for VAR Impulse Response Analysis. Stud. Nonlinear Dyn. Econom. 2005, 9, 2. [Google Scholar] [CrossRef]
  62. Braun, P.A.; Mittnik, S. Misspecifications in vector autoregressions and their effects on impulse responses and variance decompositions. J. Econom. 1993, 3, 319–341. [Google Scholar] [CrossRef]
  63. Lutkepohl, H. Asymptotic Distributions of Impulse Response Functions and Forecast Error Variance Decompositions of Vector Autoregressive Models. Rev. Econ. Stat. 1990, 1, 116–125. [Google Scholar] [CrossRef]
  64. Rural Culture Association Japan. 2013. Available online: https://www.kinokuniya.co.jp/f/dsg-01-9784540092329 (accessed on 2 July 2022).
Figure 1. Industrial convergence mechanism.
Sustainability 14 09108 g001
Figure 2. Results of AR feature root unit element test.
Sustainability 14 09108 g002
Figure 3. Results of impulse response test. (A) Response function of MT to MF; (B) Response function of MF to MT. Note: The blue line is the impulse response estimates for a horizon of up t time, and the two red lines are the one-standard error confidence bands.
Sustainability 14 09108 g003
Figure 4. Results of impulse response test. Note: (A) and (C) present the variance response of MF and MT due to MF, and (B) and (D) show that due to MT.
Sustainability 14 09108 g004aSustainability 14 09108 g004b
Figure 5. Location of Himakajima. Note: (A) presents the geographical location of Himakajima in Japan, and (B) the mapping of Himakajima.
Sustainability 14 09108 g005
Figure 6. Industrial convergence mechanism of Himakajima Island; (2013). Source: Reproduced with permission from Xiaobo Lou, “Haiye Times” [64].
Sustainability 14 09108 g006
Table 1. MF and Recreation Data Sources.
VariableExtentData Sources
Marine Fishes (LR)Marine FishesMinistry of Agriculture, Forestry and Fisheries “Fishery Output Statistics”
MT (CT)Fishing, boat racing, surfing, yachting, skin diving, swimming, tutoring, cruising, canoeing, rafting, fishermen’s inns, and fishermen’s restaurants“Leisure White Paper,” “Input-Output Table” (1985–2018), and Sixth Industrialization Comprehensive Survey
Table 2. Descriptive Statistics of Variables.
Obs.MeanSDMin.Max.
LR342,819,604740,1761,845,7103,992,638
CT341,829,882459,499.81,309,7742,697,635
Table 3. Results of ADF Unit Root Tests.
ObsADF1%5%10%p-ValueResult
LnY30–1.645–3.716–2.986–2.6240.4599Nonstationary
lnX300.001–3.716–2.986–2.6240.9586Nonstationary
DlnY29–5.251–3.723–2.989–2.9890.0001Stationary
DlnX29–4.944–3.723–2.989–2.9890.0000Stationary
Table 4. Results of Johansen Test for Cointegration.
HypothesizedEigenvalueTrace Statistic0.05 Critical ValueProb.
None0.338,2691,773,2801,839,7710.0618
At most 1 *0.197,8176,171,7223,841,4660.0130
Note: * represents the hypothesis of at least one co-integration relationship.
Table 5. Results of Granger Causality Test.
HypothesizedF-StatisticDfProb.
MT is not a Granger reason for MF8.69920.0129
MF is not a Granger reason for MT2.67020.2632
Publisher’s Note: MDPI stays neutral with regard to jurisdictional claims in published maps and institutional affiliations.

