Article

A Correlation Analysis Method for Geographical Object Flows from a Geoeconomic Perspective

1
Department of Geographic Information Engineering, Information Engineering University, Zhengzhou 450052, China
2
China Special Police Academy, Beijing 102211, China
*
Author to whom correspondence should be addressed.
Sustainability 2022, 14(15), 9085; https://doi.org/10.3390/su14159085
Submission received: 12 June 2022 / Revised: 19 July 2022 / Accepted: 20 July 2022 / Published: 25 July 2022

Abstract

:
Geographic object flow is the reason behind the relationship of geographic units. There are interactions in the process of dynamic change of a geographic object flow, and its regularity, which can reflect the relationship or pattern of geographic units in a region. In this paper, an association rule mining method for the geographic object flow linkage process is studied from a geoeconomics perspective. Additionally, an association rule mining algorithm with hierarchical constraints is proposed. Data segmentation is performed according to the time series characteristics of geographic object flow data. The basic attributes for the association rule mining are determined based on the basic parameters of geographic object flows, and a database for the association rule mining is formed according to the characteristics of the hierarchical structure of the geographic object flows. Based on the obtained data, the association rule mining algorithm with hierarchical constraints obtained using a parent–child matrix is improved by adding the Apriori algorithm. With the Indo-Pacific region as an example, the trade flow association rules for 25 countries in the region from 2010 to 2021 are selected. In addition, a mathematical statistical analysis of the strongly associated mined trade flows and geoeconomic factors is conducted in terms of both a basic feature analysis of trade flow associations and a country-oriented trade flow association analysis by considering domain knowledge. The effectiveness of the method has been evaluated from various perspectives such as correlation analysis, mathematical statistics, and comparison with the findings of existing studies and proved the validity of the method.

1. Introduction

The geoeconomics sphere encompasses spatiotemporal relations, the distribution of economic development in the context of international relations, and the corresponding operation mechanisms and trajectories. Thus, it is an important strategic element of a country’s survival and development. The study of geoeconomics focuses on understanding and assessing the relationships, structures, and evolutionary patterns of and among countries in the regional or global economy from a geographical perspective. Current research on geoeconomics generally focuses on assessing national geoeconomic relationships and analyzing relationship networks in both qualitative and quantitative ways. The qualitative approach is based on subjective judgments and is commonly used in social science research, while the quantitative approach uses data analysis methods to interpret correlated quantitative values. Currently, the main methods are the gravity model [1], hierarchical analysis [2], event analysis [3], social network analysis [4], and other mathematical and statistical methods [5]. The main problems with the existing methods are as follows: in a database, the data organization scheme lacks a way to couple spatial and temporal information and attribute information, and when assessing relationships, the qualitative approach relies on subjective experience, making the results difficult to duplicate. The existing quantitative methods, on the other hand, are mostly based on statistical models of data, the accuracy of which is greatly influenced by the selected indicators. Additionally, the effects among relationships have not been sufficiently studied, making it difficult to explore the hidden correlations associated with economic phenomena. Therefore, there is a need to combine quantitative and qualitative methods based on analyses of the root causes of geoeconomic phenomena and to establish methods that can obtain knowledge and patterns from data.
Matter, energy, and information interact within a geoeconomic system, such as by trading and investment between economies or countries, which is one of the important mechanisms associated with forming economic relations between economies or countries. These interactions are characterized by spatiotemporal properties and called geographical objects.
A geographical object flow (GOF) is an abstraction of the movement process of geographical objects in the real world and is an important operation mechanism in a geographic system. Notably, GOFs are related to the interactions among geospatial units, with the characteristics of dynamism, hierarchy, and spatiotemporal coupling. Moreover, there are certain correlations among geographic object flows; that is, changes in one geographic object flow (direction or flow) often trigger changes in other geographic object flows, and the correlation rules embedded in this process can be used to understand regional geoeconomic characteristics and evolutionary trends and explore the details of natural-social-human systems. Wilson [6], Haining [7], Yu [8], and Chen [9] conducted studies that involved spatial interaction analyses and models of geographic flows. Tao [10] studied the concepts of geographic flow and flow space and proposed a corresponding analytical framework. He suggested that a geographic flow is a flow of geographic objects between different spatial locations and classified the spatial patterns of geographic flows. Shu [11] further investigated the scale of geoflow aggregation based on a theoretical framework. Ge [12], Wang [13], and Hu [14] introduced the concept of flow in geopolitical and geoeconomic research and proposed the concepts of factor and spatial flows, obtaining pioneering results for flow-based analysis in the field of geopolitics. Analyses of flows, as new concepts in geographic information science and social and humanistic environment research [10], have led to notable achievements in theoretical and applied research. However, the existing studies mainly focused on theoretical descriptions of flows and flow patterns and lacked in-depth analyses of the relationships among geographic object flows. Therefore, it is necessary to introduce applicable analysis methods considering the characteristics of geographic object flows.
Association mining is an effective method for analyzing the relationships among spatiotemporal data. The interdependent relations and correlations among attributes in a dataset can be assessed to discover hidden interrelationships. Notably, hidden patterns that have not been discovered before can be identified [15]. The current research on association rule algorithms and their application is extensive, and the common association rule mining methods are the Apriori algorithm [16], FP-Tree algorithm [17,18], DHP [19], and others. However, the existing algorithms cannot be directly applied due to the characteristics of geographic object flows, such as temporal and hierarchy relations. Therefore, data organization methods and association rule mining algorithms based on hierarchical constraints need to be studied based on constraints established from geographic object flow characteristics and the corresponding hierarchical structure.
This paper focuses on geoeconomic relations and addresses the above problems. Methods for organizing geographic object flow data are explored in terms of time series segmentation, the extraction of attribute data, and hierarchical organization according to the basic characteristics, description parameters, and association forms of geographical object flows to provide a suitable basis for mining association rules. Additionally, this approach can be used to develop algorithms that implement hierarchical structure constraints on geographic object flows and to improve classic association rule mining algorithms. We also select the trade flows in the Indo-Pacific region as an example, and through the mining of association rules among trade flows, we clarify the trade association characteristics among countries and their influence and activeness in regional trade. Moreover, the geoeconomic characteristics and relations in the region are analyzed based on the results.
The innovation of this paper in terms of the principle of geoeconomic relationship analysis and association rule mining algorithm is as follows: the paper is based on the mechanism of geographic object flow in spatial interaction to excavate and discover the correlational relationship and change laws between geospatial units, which reduces the one-sidedness and subjectivity of index selection and improves the objectivity of analysis. The association rule mining method under hierarchical constraints proposed in this paper realizes the analysis of association relationships between flows of geographic objects with hierarchical characteristics by constructing a matrix of parent‒child attribute terms. Additionally, it can lock the key factors among many related attributes at different levels so that the association rules between geographic objects at different scales can be explored.
The main body of this paper consists of four sections. The first part discusses the research method in detail, including the organization method of geographic object flow data, the association rule mining algorithm based on hierarchical constraints, and the specific process of implementing the association rule mining method for geographic object flows. The second part, titles Experiment and Analysis, describes the situation of the study area and the data sources, conducts experiments using the method proposed in the first part, and describes and analyzes the experimental results in detail to verify the feasibility and validity of the method. The third part addresses the research contributions, innovations, limitations, and future research directions of the article. The fourth part summarizes the conclusions of the article and briefly describes the contributions generated by this study in related research areas.

2. Methodology

2.1. Framework

Association rule analysis for geographic object flows requires a priori knowledge of the domain, which is extracted and refined for use in association rule mining. The association rule mining method proposed in this paper is divided into four main stages.
First, the temporal resolution of geographic object flows is determined according to the purpose of the study and the data sampling interval. The changes in geographic object flow characteristics are segmented according to the temporal resolution unit, and the geographic object flow data in time series form are divided. Second, by parsing the characteristics of the geographic object flow, the changes in the geographic object flow are characterized, and the result is used as an attribute item in a record to construct a parent–child matrix according to the structure of the geographic object flow. Then, the association rule mining algorithm with hierarchical constraints is used to mine association rules for single-level geographic object flows and cross-level geographic object flows. If too many or too few rules are generated, the support threshold and confidence threshold are adjusted, and strong rules are regenerated. Finally, the mined strong association rules are combined with domain knowledge to obtain and assess knowledge about regional geoeconomics (Figure 1).

2.2. Method of Organizing Geographic Object Flow Data

2.2.1. Time Series Segmentation of Data

Time series segmentation of geographic object flow data is performed to segment data that are continuous in time into segments arranged in a time series. Prior to the step of data processing, the temporal resolution of geographical object flows needs to be clarified. The temporal resolution of a geographic object flow is a time scale for dividing temporal data based on the variations in flows or the relevant research needs. Since the flow of geographical objects is continuous, data need to be discretized when performing association mining. Based on the determined temporal resolution, a geographic object flow is partitioned to form records, and each record can be identified by a specific time series number.
Geographic object flow data are sampled at a certain time interval, and if the sampling interval is much smaller than the study scale (usually no greater than an order of magnitude difference), they can be considered continuous data. The temporal scale is usually set as n times the minimum time interval of data sampling to preserve the distribution characteristics of the data in the time dimension. All geographic object flow data in a unit time scale are combined to form one record. The temporal resolution, denoted as t’, can be expressed as:
t   =   n τ
In Equation (1), t’ is the temporal resolution,   τ is the data sampling interval, and n is the selected multiplier.
When determining the temporal resolution of geographic object flows, the characteristics of the data, the temporal changes in geographic object flows, and the algorithm processing efficiency should be considered. In sociological studies, the usual temporal scale is daily, weekly, monthly, or yearly [20]. The nature and intensity of the changes exhibited by flows of geographical objects differ over time.
By partitioning the time domain according to the temporal scale beginning from the starting point of the study, the entire time range can be divided into N time periods, and the expression is as follows:
N = T/t
In Equation (2), N is the number of periods in the time range, i.e., the number of data divisions that should be considered for a geographic object flow. T is the entire time range of the study, i.e., the overall length of the geographic object flow time series, and t’ is the temporal resolution.

2.2.2. Determination of Attribute Data

The attribute data of geographic object flows must be extracted. Notably, standardized parameters that can express the state and quantitative changes in a geographic object flow are selected as the key attributes for association rule mining. The main principles of attribute data extraction are as follows: (i) the key features of a geographic object flow should be effectively identified; (ii) distinctions should be made among the attribute terms of the geographic object flow, with no redundancy among attributes. If the attributes are known, a flow can be physically resolved.
The basic properties of a geographic object flow can be described using three parameters, as shown in Equation (3).
O b j F l o w a b : { O d i r a b , O v e l a b , O q t y a b }
In the above expression,   O d i r a b is the flow direction of the geographic object flow,   O v e l a b is the flow rate, O q t y a b is the amount of flow, and t is the time duration of the geographic object flow.
① The flow direction O d i r a b is the direction of the object movement, and any geographic object flow can be converted to a unidirectional flow between the start and end points. The geographic object flow O b j F l o w a b   is a one-way flow from O b j a to O b j b . The geographic object flow O b j F l o w b a   is a one-way flow from O b j b to O b j a . Thus, the direction can be distinguished by the designation used for the geographical object flow.
② The flow velocity O v e l a b is the distance traveled by an object per unit time and is defined as shown in Equation (4):
O v e l a b = ( x b x a ) 2 + ( y b y a ) 2 t
In Equation (4), ( x a   , y a )   and   ( x b   , y b ) are the spatial coordinates of a geographic object at any 2 moments in the process of the geographic object flow, and t’ is the temporal resolution of the geographic object flow.
③ The amount of flow O q t y a b can be expressed in terms of the number of geographic objects flowing through a transect per unit time, as shown in Equation (5).
O q t y a b = O b j e l e
In Equation (5), O b j e l e is a geographic object in the geographic object flow.
Since the flow rate of a geographic object flow is the quotient of the flow rate and the corresponding time scale, continuous geographic object flow time series are usually divided into equal time periods τ to enable cross-sectional comparisons of spatiotemporal changes in geographic object flows. The rate of change of the flow rate is equivalent to the rate of change of the flow rate in the same period. The change characteristics of a geographic object flow with a unique identification number can be expressed by the rate of change in the flow of a unidirectional geographic object, as shown in Equation (6).
P t ab = | O d i r a b |     O q t y a b t O q t y a b t 1 O q t y a b t 1
In Equation (6), Pab is the rate of change of the flow of geographical objects from   O b j a to O b j b in the period from t − 1 to t.
Since Pab is a multivalued discrete dataset, when mining association rules, the continuous data are usually divided into intervals using mathematical and statistical methods. Then, the corresponding attributes for each interval are identified according to the statistical significance of the relations among the data. Next, the transformed attribute I is mined with the association rule algorithm. The attributes obtained through geographic object flow association rule mining can be divided into 5 categories, as shown in Table 1.

2.2.3. Hierarchical Organization of Data

Geographic object flows have a certain structure that can be abstractly described as a parent–child relationship. A parent geographic object flow is composed of multiple child geographic object flows; that is, O b j F l o w a b   is composed of n child geographic object flows, such as O b j F l o w a b 1   , O b j F l o w a b 2 O b j F l o w a b n (Figure 2). A child object inherits the basic properties of the parent object, and the directions of the parent geographic object flow and the child geographic object flow are the same.
Two types of associations exist for geographic object flows: same-level and cross-level associations. Among them, same-level associations are those between geographical object flows at the same level. That is, the geographical objects contained in the geographical object flows are at the same level, such as the association rules between the overall trade flows between two countries or the associations between the trade flows of a specific category of commodity (such as food or energy) between two countries. This homogeneous association type is common in geographic systems. Cross-level correlation is the association of geographic object flows at different levels. The mining of cross-level correlations can be performed to filter elements that play key influential roles in geographic object flows. For example, changes in an energy trade flow (child geographic object flow) in the overall trade flow (parent geographic object flow) between two countries may be the main factor affecting the trade flow (parent geographic object flow) between these countries.
According to the hierarchical structure of geographic object flows, the flow of a parent geographic object flow is the sum of the flows of all its immediate child geographic object flows, which can be expressed as:
O q t y a b = i = 1 n O q t y a b i
In Equation (7), n is the number of child object flows associated with the parent object flow, and i is the child object flow.
Thus, the rate of change of geographic object flows can be expressed as a matrix with a hierarchical nested structure, where m is the number of parent geographic object flows and n is the number of child geographic object flows associated with the parent. The attribute term matrix can be expressed as:
I = [ I 11 n I 1 m n I m 1 n I m m n ]
Since the associations among geographic object flows are universal and extensive, there are strong and weak differences in the strength of associations, and there are strong associations that are indicative of geoeconomic characteristics. Thus, the depth of the spectrum needs to be controlled according to the domain problem when mining the associations between parent and child hierarchies. For example, only the flow level of a geographic object and those of directly related parents and children are assessed. The geographic object flows that directly interact are filtered as the basis of the association rule analysis so that the mining results are interpretable.

2.3. Association Rule Mining Algorithm Based on Hierarchical Constraints

Association rule analysis is based on the statistical relations among data and is performed to reveal the association relationships between or among things or phenomena; through the mined association relationships, information about one attribute through the mined association relationships [21]. Since the classic association rule mining algorithm treats all attribute items as belonging to the same hierarchical level, it is difficult to mine the association rules of geographical object flows with a hierarchical structure involving multiple levels. Therefore, in this paper, an improved association rule analysis algorithm is proposed based on hierarchical constraints.
Hierarchical constraints are constraints on the hierarchy of geographic object flows corresponding to the attributes that constitute the frequent item set. These attributes include same-level constraints and cross-level constraints, where cross-level constraints indicate that the resulting frequent item set contains attributes from different levels.
Hierarchical constraint-based association rule mining algorithms lie in discovering more interesting, practical, and ad hoc association rules. The existing classical algorithms for association rule mining mainly include the Apriori, DHP, FP-growth, and other methods. One of the most widely used algorithms is the Apriori algorithm. The core objective of this algorithm is to generate candidate terms and the corresponding support by concatenation and then establish frequent item sets through pruning [22,23]. This algorithm is not only easy to understand but also easy to improve according to the constraints in the specific domain. The DHP [19] uses the Hashing technique to effectively improve the generation process of strong candidate sets, and its efficiency is improved [24]. However, this improvement in the efficiency of the algorithm is mainly for the case in large 2-candidate sets, while the significance is not obvious for this study. FP-growth is a mining method to discover frequent item sets without generating candidate sets [25]. The FP-growth algorithm is much faster than the Apriori algorithm when the generated FP-tree is small enough or when there are many overlapping paths. In addition, there are some parallel distributed algorithms whose main purpose is to solve the problem of the efficiency of association rule mining for a large amount of data [26]. Based on the characteristics of existing classical algorithms and combined with the purpose and needs of this study, we improve on the Apriori algorithm for the purpose of association rule mining across hierarchical constraints.
Therefore, the association rule mining algorithm with hierarchical constraints is used to obtain a set of frequent items among geographic object flows with a hierarchical structure by establishing constraints based on the characteristics of the composition and structure of geographic object flows. This approach is based on the Apriori algorithm.

2.3.1. Related Definitions Used in Association Rule Mining

In the attribute item set I , the transaction database D is composed of a series of transactions with unique flag IDs, and each transaction item corresponds to a subset of I , i.e., Item I . The general result of the association rule takes the form A B . The item set A is the former item in the association rule, and the item set B is the latter item in the association rule, i.e., the result of the association rule. Thus, item set A is the antecedent of the association rule, and item set B is the opposite.
The support of association rule A B is defined as the probability that item sets A and B occur simultaneously as follows:
S u p p o r t ( A     B ) = P ( A     B )
The confidence level of association rule A B is defined as the probability of occurrence of B conditional on the occurrence of item set A, as follows:
C o n f i d e n c e ( A     B ) = P ( B | A ) = S u p p o r t ( A     B ) S u p p o r t ( A )
The minimum support and minimum confidence are usually used as thresholds. Rules that satisfy the minimum support and minimum confidence thresholds are strongly associated rules, with the former expressing significance in a statistical sense and the latter indicating the reliability of the associated rule.

2.3.2. Hierarchical Constraints and Implementation Methods

In hierarchical constraint-based association rule mining, the constraints are mainly as follows.
  • Same-level Constraints. A frequent termset C k that satisfies { C k |   I 1   , I 2 ,   I i } or { C k |   I i 1   , I i 2 ,   I i j } when   k 2 exists. I i is a parent attribute item for a geographic object flow, and I i j is a child attribute item for a geographic object flow i.e., either or all the parent or child attribute items of geographic object flows are in the frequent item set.
  • Cross-level constraints. There is a frequent termset C k that satisfies   { C k |   I i   ,   I i j } when   k 2 . I i is a parent attribute item for a geographic object flow, and I i j is a child attribute item for a geographic object flow; i.e., there must be at least one parent attribute item and one child attribute for a geographic object flow in the frequent item set.
  • The frequent item sets used for association analysis must be greater than or equal to the 2 items.
  • A sublevel geographic object flow is a frequent item set if the corresponding parent geographic object flow is frequent.
The key step in implementing cross-level constraints is to form a parent–child matrix with elements that are 2-candidate item sets based on a 1-frequent item set. Any item in the parent–child matrix must be associated with attribute data for a parent–child pair. The parent and child attribute items in the set of frequent items for a geographic object flow are distinguished according to the attribute item IDs at different hierarchical levels, which constitute the parent–child matrix elements P_C and C_P, as follows:
P _ C = [ { I 1 , I 1 1 } { I m , I m 1 } { I 1 , I 1 n } { I m , I m n } ]  
C _ P = [ { I 1 1 , I 1 , } { I m 1 , I m } { I 1 n , I 1 } { I m n , I m } ]  
When I i and I i j are frequent item sets, then the parent–child candidate matrix can be established. If I i or I i j is not a frequent item set, the matrix is pruned.

2.3.3. Hierarchical Constraint-Based Association Rule Mining Algorithm

  • Read the data
  • Obtain the set of 1-candidate item sets for the parent and child geographic object flows
  • Calculate the support of all 1-candidate item sets, and filter the 1-frequent item sets that exceed the support threshold
  • Construct the parent–child candidate matrix
  • Generate a 2-frequent item set that satisfies the hierarchical constraints
  • Loop: When the number of (k − 1)-frequent item sets is greater than 0
  • k candidate item sets are generated from (k − 1)-frequent item sets
  • Iterate over the support of k candidate item sets and filter out k frequent item sets that are greater than the support threshold
  • Calculate the confidence level for each k-frequent item set and filter out the item sets that are greater than the confidence level threshold
  • K = k + 1
  • The loop ends, and all strongly associated rules that satisfy the support and confidence threshold conditions are obtained.

2.3.4. Validation Method Based on Correlation Analysis

Correlation analysis is one of the important methods to verify the association rule mining results. In the validation of the cross-level association rule mining results, the attribute data of a certain time period are randomly selected from the temporal data of geographic object flows of different categories at different levels. The correlation coefficients between each type of child geographic object flows and their parents are calculated separately. The specific calculation is as follows:
C o r r e l t ( I i , I i j ) = ( I i I ¯ ) ( I i j I i j ¯ ) ( I i I ¯ ) 2 ( I i j I i j ¯ ) 2  
In Equation (13), I i ¯ is the average value of the attributes of a certain parent object flow in time period t and I i j ¯ is the average value of the attributes of a certain child object flow in time period t.
The strength ranking of the association relationships is determined by comparing the differences in correlation coefficients between different classes of sub-geographic object flows and parent geographic object flows, thus circumstantiating the correctness and credibility of the conclusions drawn by the cross-level association mining algorithm.

3. Experiment and Results

Foreign trade usually refers to the act or process of commodity exchange that occurs between a country and other countries. Bilateral foreign import and export trade between countries can be regarded as the flow of geographical objects between macrogeographic spatial units, i.e., trade flows [27]. In each region, there are often mutually constraining and influential relationships among multiple trade flows. They can be used to map the economic relationships between countries and reflect their geopolitical orientations, as well as their position, influence, or dependence on the regional economy. By screening the trade flows with strong trends and the countries with high-frequency correlations, we can map the trade pattern and geoeconomic situation in a region.
The experiment in this paper involves the overall trade flows in the Indo-Pacific region between 2010 and 2021 and commodity trading in the energy, food, nuclear, aviation, and weapon sectors (which are more important for national survival, development, and security) as examples. The regional trade flow association rules are mined, and the regional geoeconomics relationships are assessed to validate the proposed method.

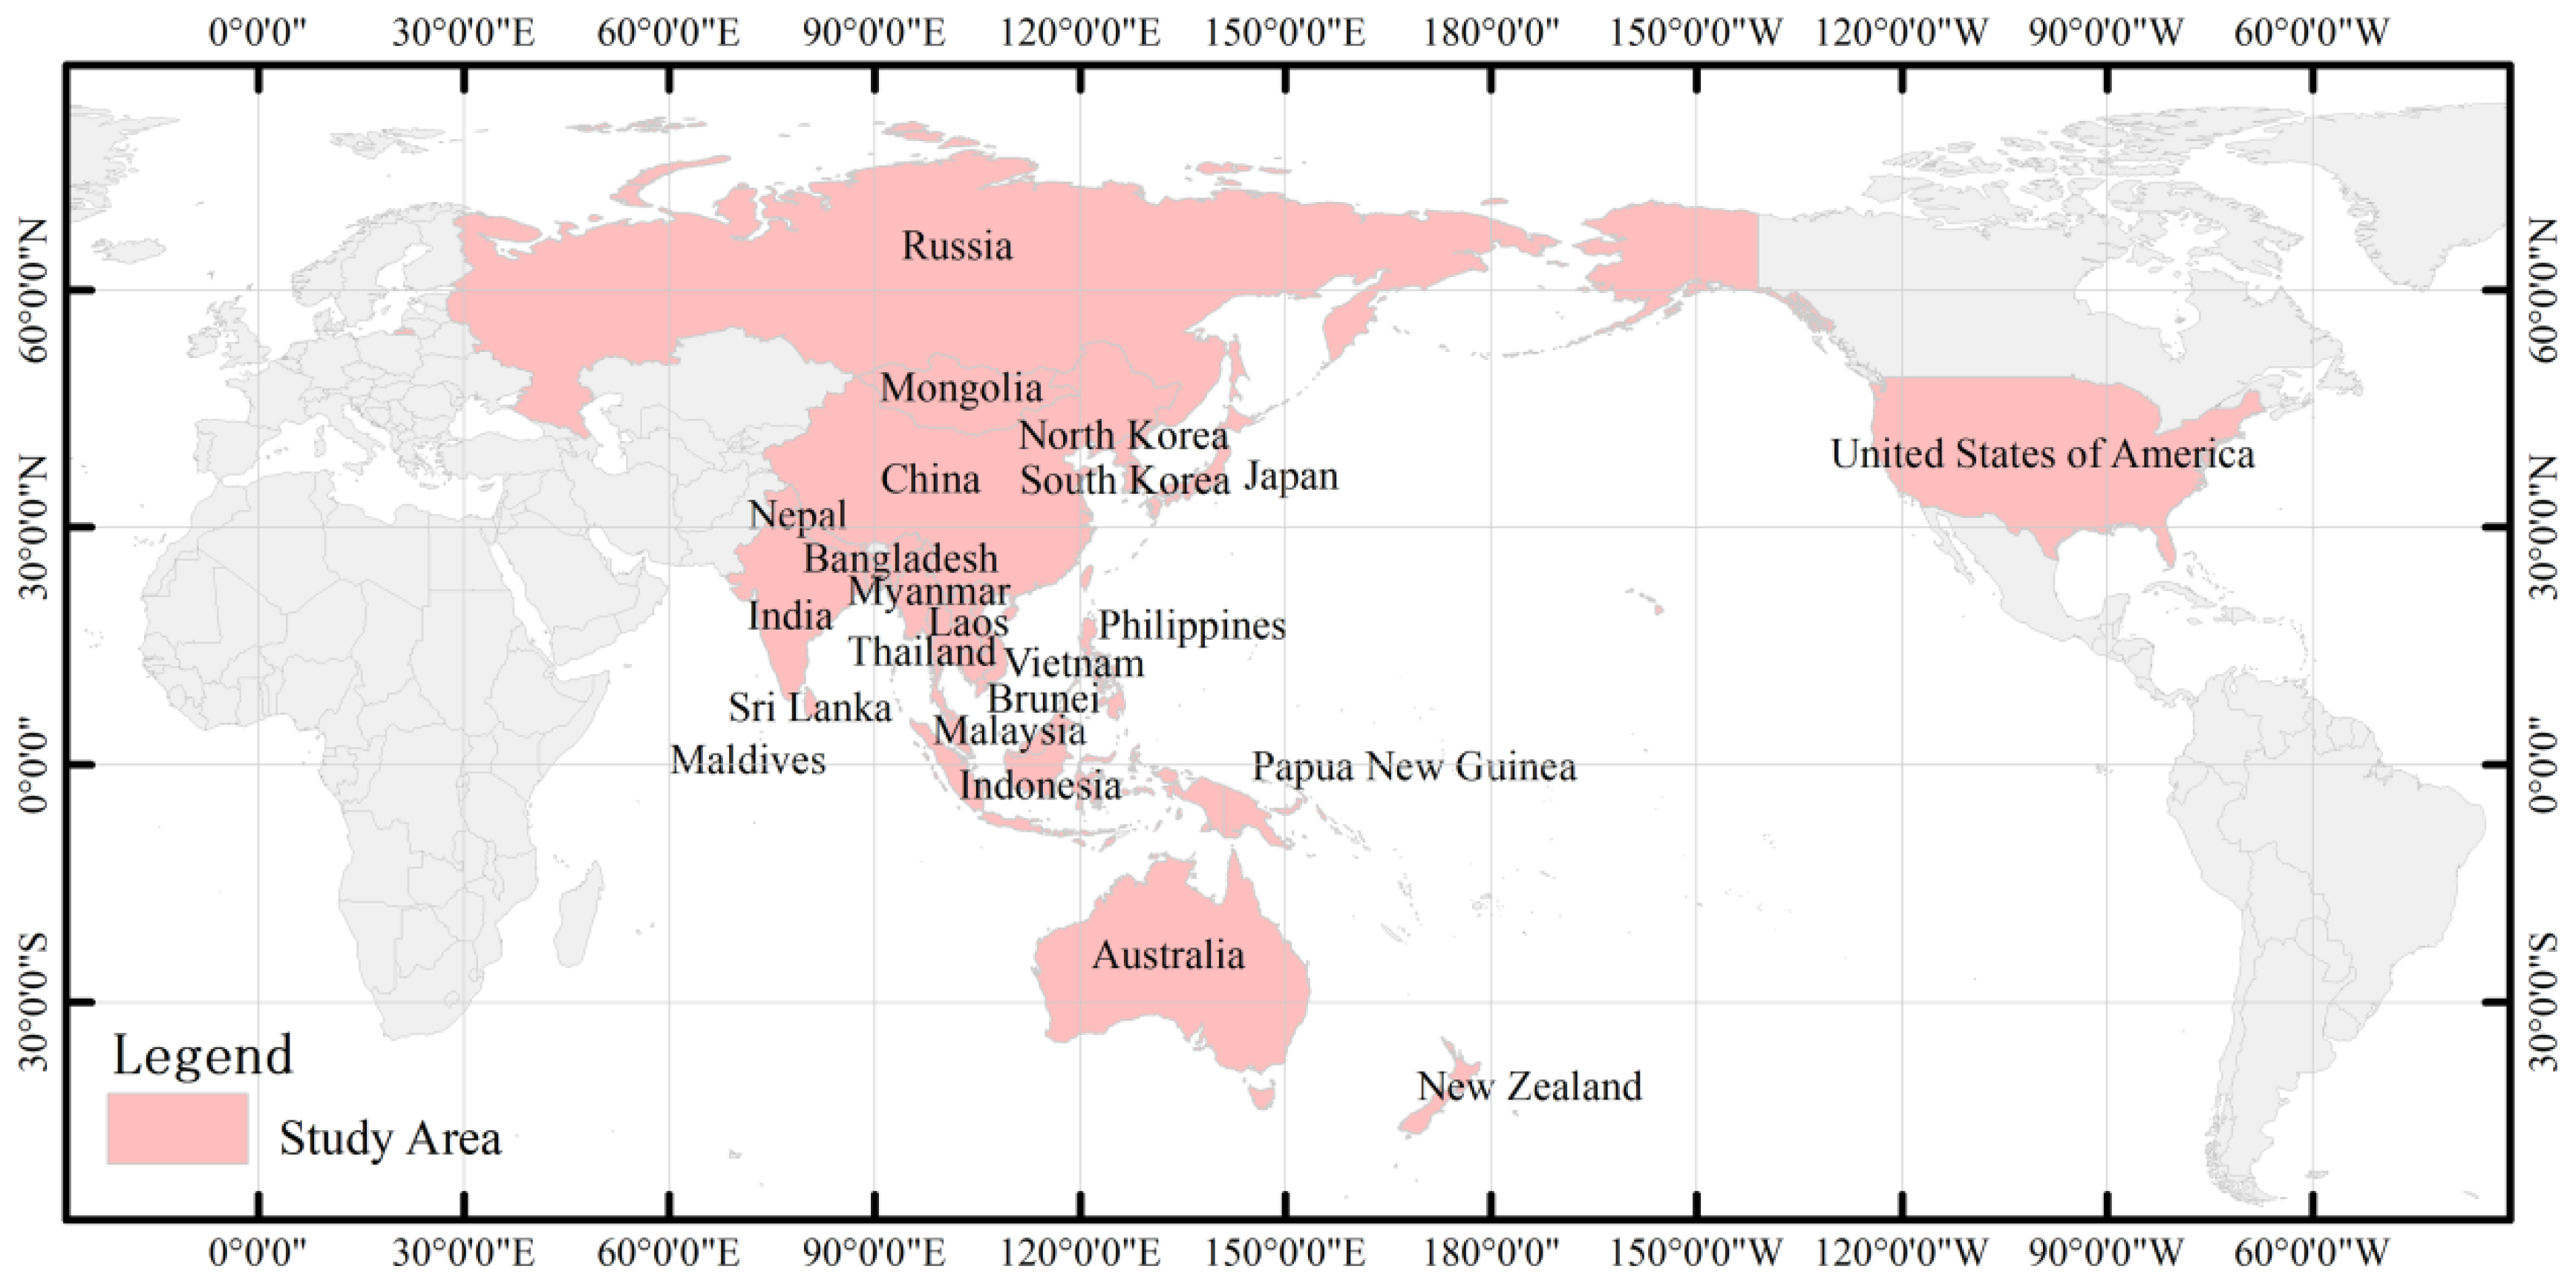
3.1. Study Area and Data Sources

As a geopolitical hotbed, the Indo-Pacific region has become a region of international concern in recent years [28]. The 2019 release of the U.S. The ‘Indo-Pacific Strategy’ [29] and the competitive and cooperative behavior of countries such as Japan, Australia, India, and New Zealand in the region illustrate the importance of the region in international geopolitical relations. From 2010 to 2020 there were 690, 160, and 100 results for “Indo-Pacific” and “Strategy,” respectively, on US, Australian, and Indian government websites [30,31,32]. The scope of the Indo-Pacific region, which usually includes countries and political entities near the Indo-Pacific seas, is broader than that of the Asia-Pacific region. Notably, it incorporates the Indian Ocean littoral and Indian subcontinent countries in addition to those in the Asia-Pacific region [33]. Combining both geographic and geopolitical perspectives and considering the availability of data, the study area of this paper included the United States, Japan, South Korea, Australia, the Philippines, Thailand, Singapore, New Zealand, India, Sri Lanka, Maldives, Bangladesh, Nepal, Vietnam, Indonesia, Papua New Guinea, Malaysia, Brunei, Laos, Cambodia, North Korea, the Russian Far East, Myanmar, Mongolia, and China in the Indo-Pacific region (Figure 3).
The research data were mainly obtained from current widely used global trade databases, including the United Nations Comtrade Database (UN Comtrade) [34], the WTO database (https://www.wto.org, accessed on 1 March 2022), the World Bank data website (https://data.worldbank.org.cn, accessed on 30 April 2022),the China Customs Statistics Platform (https://www.customs.gov.cn, accessed on 30 April 2022),and the Atlas of Economic Complexity (AEC) dataset established by Harvard University [35]. Trade flow data from the 1992 Harmonized System (HS) classification were used in the study. The subcategories of trade flows were mainly based on trade in five categories of goods from the above countries: ① cereals (HS_Code 10); ② mineral fuels, mineral oils and products of their distillation, bituminous substances, and mineral waxes (HS_Code 27); ③ nuclear reactors, boilers, machinery, and mechanical appliances (HS_Code 84); ④ aircraft, spacecraft, and parts thereof (HS_Code 88); ⑤ arms, ammunition, parts, and accessories thereof (HS_Code 93).
The temporal resolution of the trade flow t’ = 1 month was set based on the study scale and the statistically derived time interval of foreign trade. The entire study temporal horizon was divided into 144 periods according to the available time series, and the trade flow data in each period were organized. By standardizing the trade flow parameters, the rate of change in flows was divided into five classes, which were combined with the trade flow direction attributes after postprocessing to generate the attribute term data. In accordance with the scale and purpose of the study, the experiments were mainly based on frequent item sets with k < 3 for association analysis. In addition, adherence to association rules with high confidence and interpretability was ensured by establishing a high degree of support.

3.2. Results and Analysis

3.2.1. Analysis of the Basic Features of Trade Flow Associations

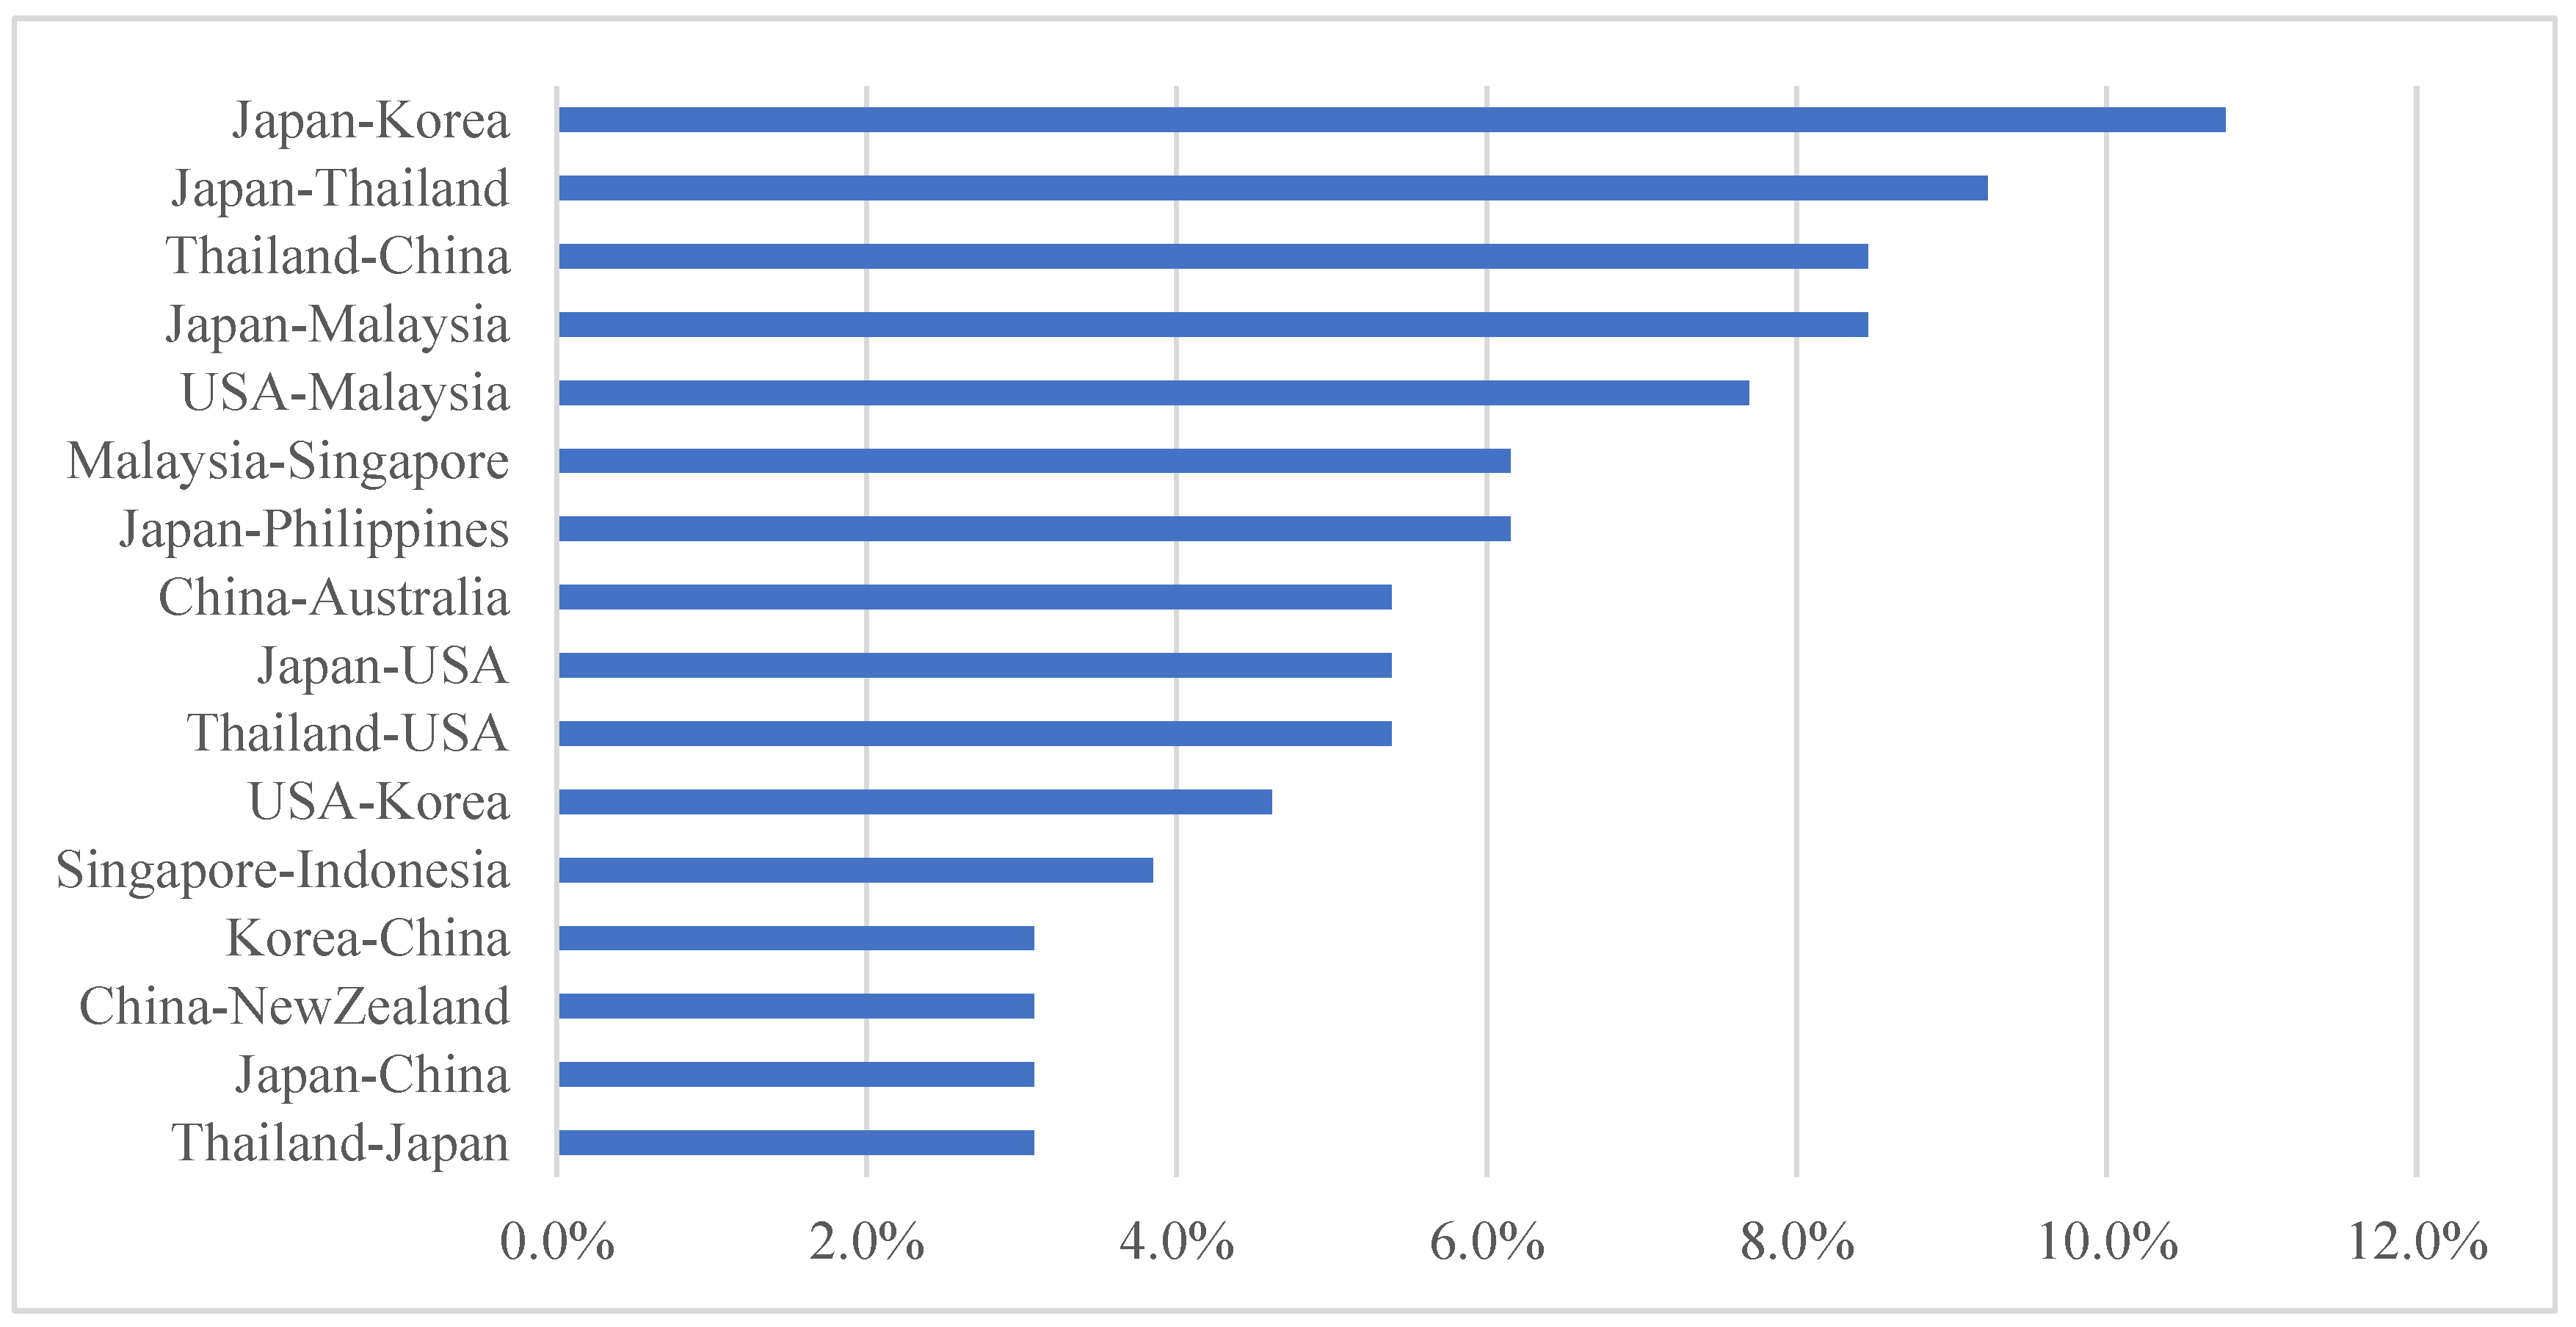
  • Basic information on trade flows with strong linkages
Among the geographic object flows with strong correlations, 91% of the correlations increase or decrease in the same direction, 9% increase or decrease in opposite directions, and the vast majority of the correlated trade flows exhibit the pattern of growth in one trade flow in relation to growth in the other flow. These results suggest that the impact of trade between most countries is generally positive. The top 20 trade flows in terms of the intensity of association include Japan-Malaysia, Japan-China, Japan-Korea, Japan-Thailand, Japan-Philippines, Japan-US, Thailand-US, Thailand-Laos, Thailand-China, China-New Zealand, China-India, and China-Australia, as shown below. The association of trade flows can be expressed through a Sankey diagram (Figure 4). Japan displays the most trade flows with high confidence levels, indicating that there is an obvious interaction phenomenon for trade between Japan and other countries. Thailand, located in Southeast Asia, exhibits dynamic trade flow correlations, suggesting that the economic and trade relation networks in the region provide a clear advantage for Thailand over other Southeast Asian countries.
2.
Frequency characteristics of strongly correlated trade flows
Among all the strongly correlated trade flows, those with a high frequency of occurrence were dominant in the region. The high frequencies of the Japan-Korea, Japan-Thailand, Thailand-China, U.S.-Malaysia, Malaysia-Singapore, China-Australia, and Thai-U.S. trade flows in the study area (Figure 5) indicate that these trade flows are relatively closely related to or influence other trade flows in the region. The highest frequency of trade observed for the Japan-Korea flow indicates the dominance of bilateral trade, and changes in trading between Japan and Korea are correlated with changes in large intercountry trade flows in other countries in the region. Notably, these changes have a broad impact on the geoeconomic status of the entire region. According to the statistical analysis of import and export trade data, the average annual trade volume between Japan and Korea accounted for approximately 25% of the total annual trade volume of the whole region over the past 10 years. This indicates that Japan-Korea trade has a high degree of influence on the regional economy.
3.
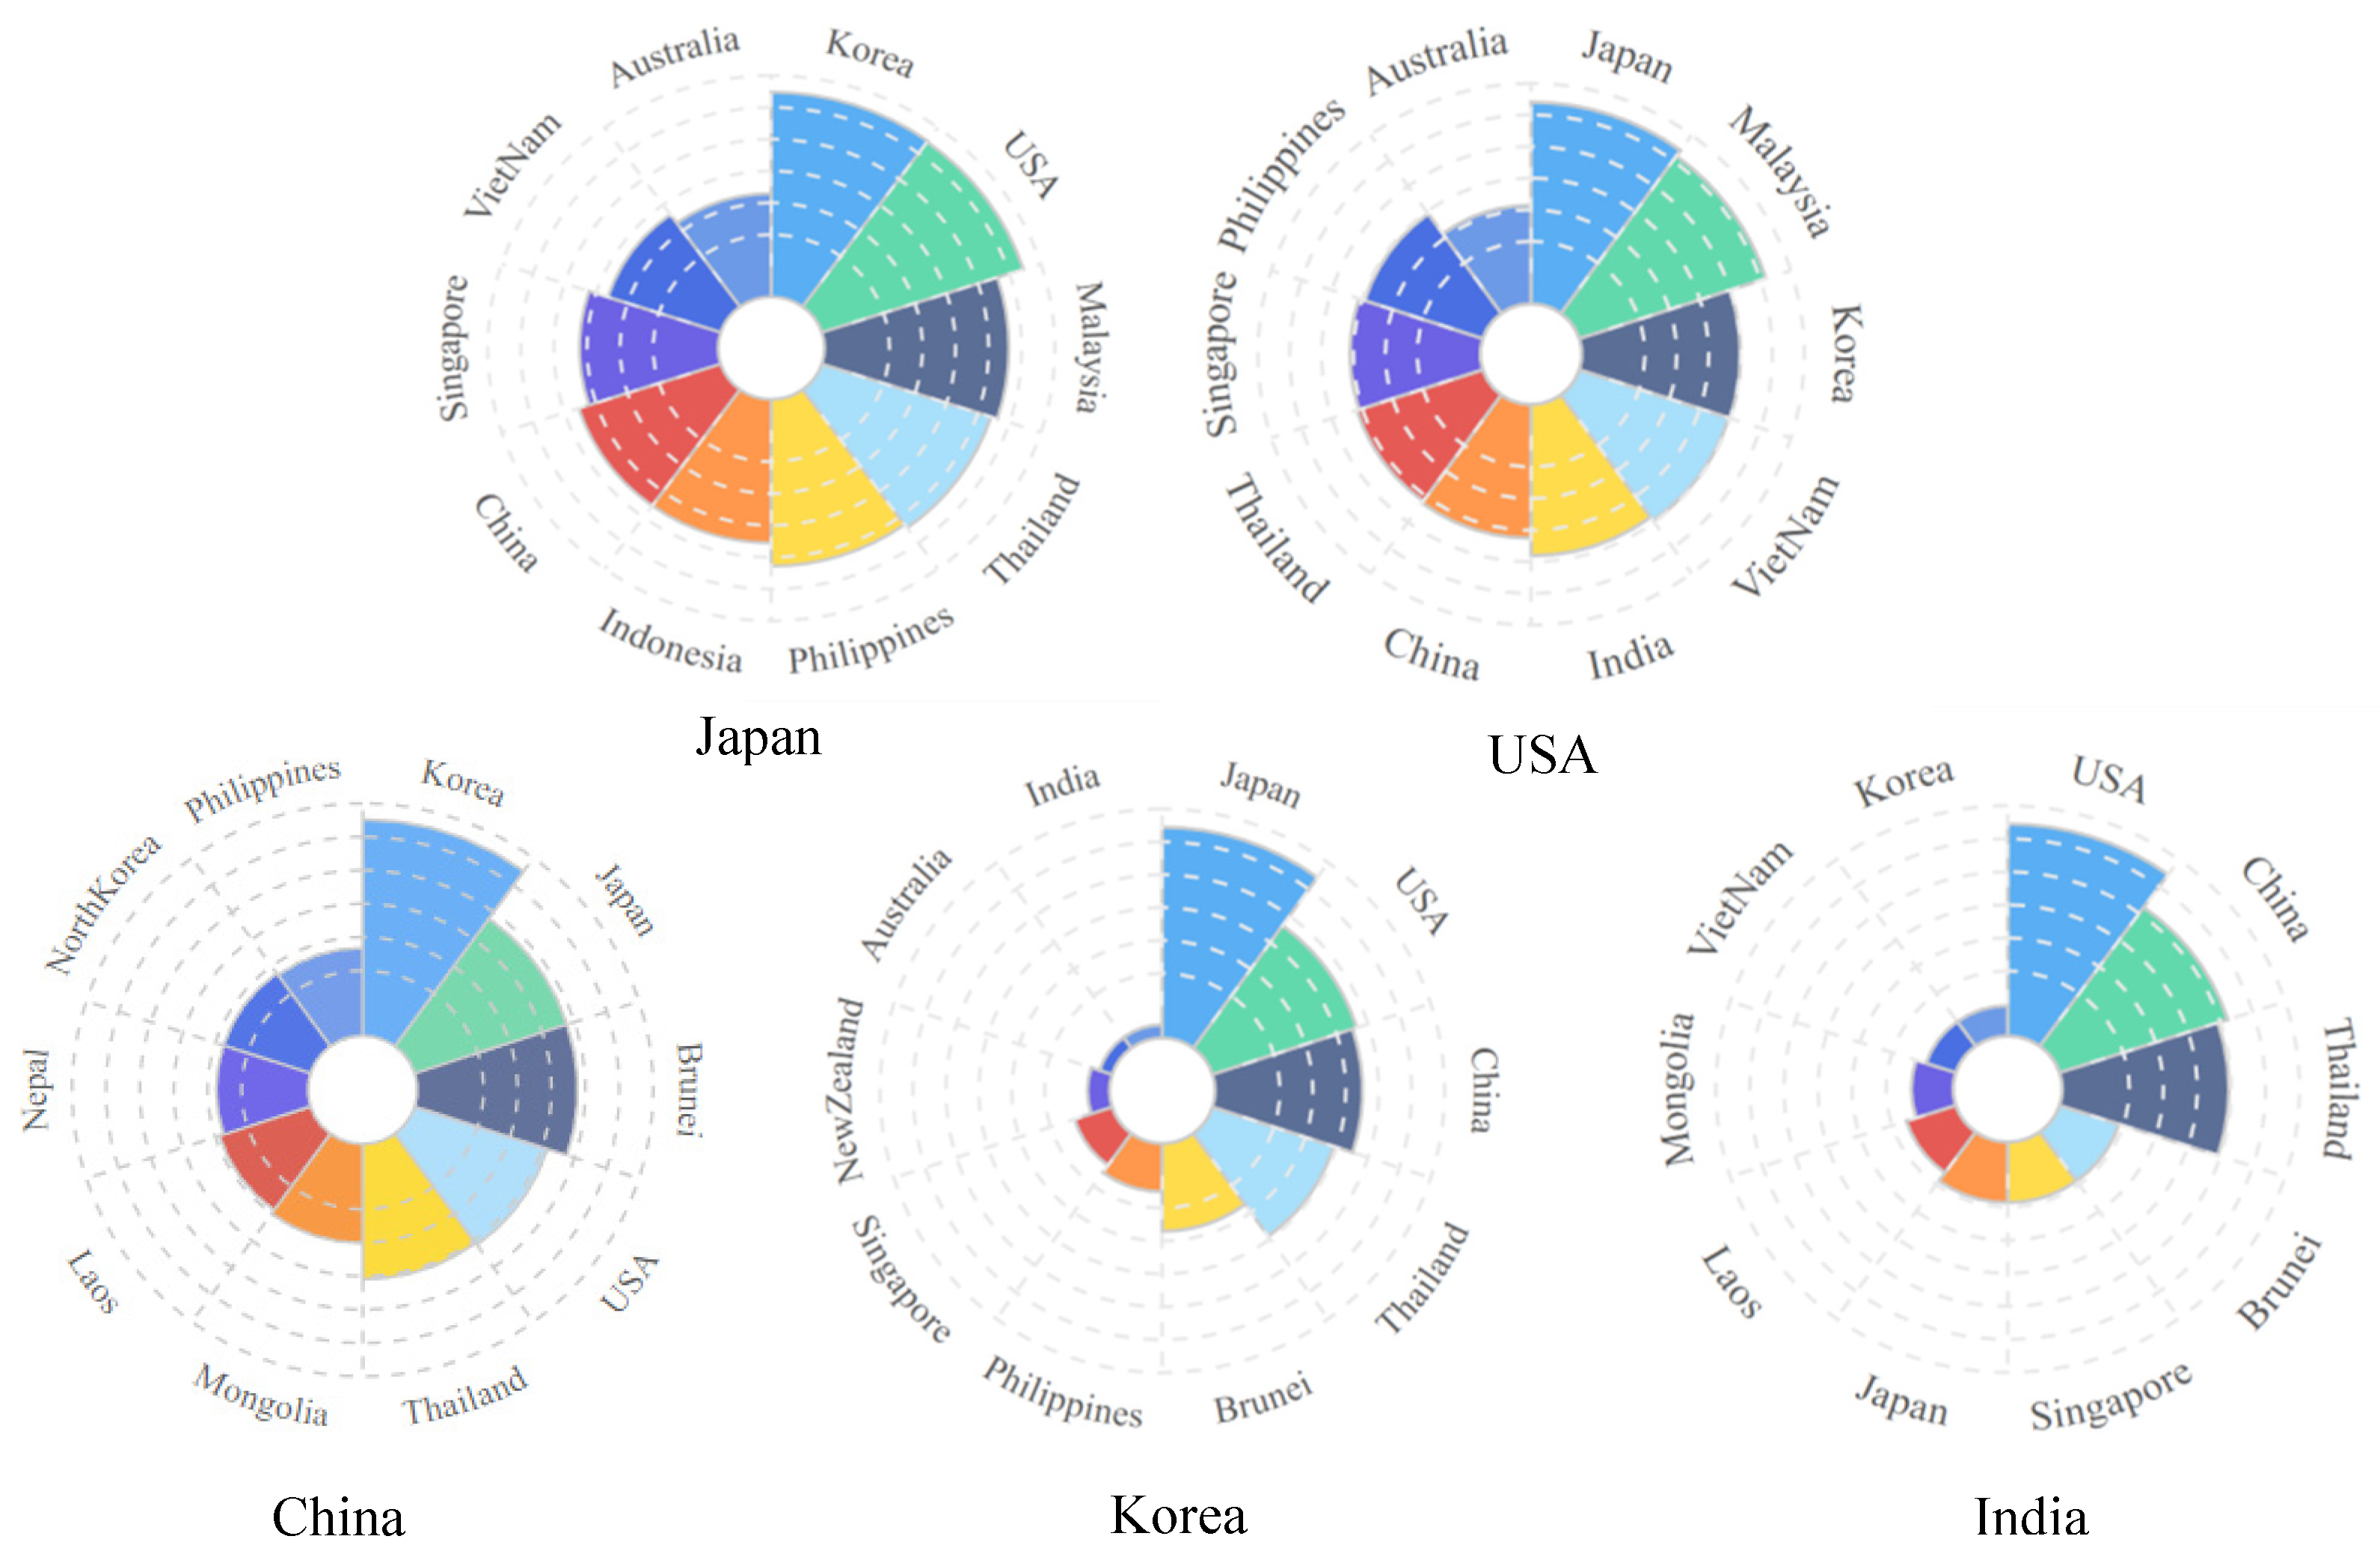
Characteristics of the subject country distribution for strongly correlated trade flows
Spatially, strongly linked trade flows and the corresponding subject countries are concentrated along the west coast of the Pacific, which mainly include Japan, Thailand, China, and Malaysia. Among them, Japan and most of the countries in the region have strongly linked trade relations and are the most frequently occurring countries among the main countries with strongly linked trade flows (as shown in Figure 6). According to Japanese trade statistics, Japan’s total import and export merchandise trade in the region has accounted for approximately 20% of trade in the region. In addition, approximately 30% of Japan’s total import and export trade in the last decade, making Japan the dominant country in regional trading. Additionally, Japan is highly dependent on regional trade, reflecting Cohen’s assertion in geopolitics [36].
4.
Cross-level trade flow correlation characteristics
The cross-level association rules for trade flows can be mined to determine the correlations between specific categories of commodity trading and the overall trade flow trends. The results indicate that 90% of the cross-level trade flow strong association rules are related to the trade of nuclear reactors, boilers, machinery, and mechanical appliances (HS_Code 84). Notably, among the experimentally selected subcategories of trade, there is a significant relationship between changes in the trade volume of nuclear reactors, boilers, machinery, and mechanical appliances (HS_Code 84) and the overall changes in trade between the two linked countries. These changes are dominant compared to changes observed in the other four subcategories. To some extent, this finding indicates that nuclear trade has a more pronounced geoeconomic impact than the impact of several other types of trade. By using the correlation analysis method for the category-specific trade flows and the overall trade flows, it can be concluded that the correlation coefficient between the trade of the commodity nuclear reactors, boilers, machinery, and mechanical appliances (HS_Code 84) and overall trade is 0.81, which validates the scientific nature of the cross-level trade flow association rule mining method and the correctness of the experimental results from another perspective (Table 2).
Japan is associated with more strongly correlated cross-level trade flows than are other countries. This suggests that nuclear trade in Japan is more closely correlated to overall trade than it is in other countries in the region and that the geoeconomic relations involving Japan are sensitive to changes in nuclear trade.

3.2.2. Country-Specific Trade Flow Correlation Analysis

When focusing on the association rules for a particular economy or country, the relevant rules can be analyzed to map the corresponding trade networks and economic linkages. With China, Japan, Korea, and India as examples, we examine the trade flows between these countries and other countries (Figure 7).
  • The strongly correlated trade flows observed for Japan mainly involve South Korea, the United States, Malaysia, Thailand, and the Philippines, indicating that trade transactions between Japan and these countries have the greatest impact on Japan’s trade relations with other countries to some extent. However, overall, the probability that each country in the region being strongly associated with Japan is relatively small. This indicates that Japan has a relatively balanced trade pattern in the study area, which is one of the important reasons why Japan is characterized by high economic influence in the region.
  • The strongly correlated trade flows observed for the U.S. are relatively uniformly distributed among different countries, with only two countries, Japan and Malaysia, being slightly more prominent. The differences among the results for other countries are not significant. Although the number of trade flows strongly associated with the U.S. in the region is smaller than that for Japan, the distribution of the probability of trading with specific countries displays a more balanced degree of interconnectedness. As part of the strategic economic framework of the U.S., economic and trade relations have been established with most countries in the Indo-Pacific region in recent years through the establishment of alliances, organizations, and rules. Thus, the influence of the U.S. in the region has been continuously expanding, and relatively balanced geoeconomic relationships have been established.
  • Strongly correlated trade flows between China and South Korea, Japan, Brunei, the United States, and Thailand appear most frequently, indicating that China’s trade with these countries is frequent and important, with a pronounced impact on China’s trading in the Indo-Pacific region. Notably, the merchandise trade between China and South Korea accounts for 6% of China’s trade in the region. Additionally, South Korea is an important trading partner for China and has influenced China’s trade with other countries. In addition, Brunei, as a strategic partner of China, became a founding member of the Asian Infrastructure Investment Bank (AIIB), initiated by China in 2014, and is one of the countries in the economic corridor. Thus, the trade between Brunei and China has displayed an increasing trend in recent years.
  • The strongly correlated trade flows in Korea mainly involve Japan, the United States, China, and Thailand. The probability of the occurrence of trading with these countries is relatively high, while other countries only account for a very low percentage of trades. Thus, Korea’s geoeconomic relations in the study region are not evenly distributed, with a strategy that focuses on a few countries in the region that are active in trade. Thus, trade changes in Korea do not have a significant impact on most other countries. Korea’s economy is externally oriented, dependent on exports, and limited in volume, so Korea’s geoeconomic ties in the Indo-Pacific region are slightly laxer than those of other countries.
  • As seen from the strongly correlated trade flow statistics for India, the countries that appear more frequently are the United States, China, and Thailand. The correlations between trade flows with other countries in the region are not significant. Thus, it appears that India is characterized by a geoeconomic imbalance in the study region and is more influenced by or dependent on specific countries. This pattern, to some extent, signals high trade risk for India.
Based on the country distribution and impact characteristics of the trade linkages and intensities, the above five countries are classified into types: Japan and the United States are classified as balanced, i.e., their trade linkages are relatively uniform in the region; China is classified as semi-balanced, i.e., its trade linkages with most countries in the region are relatively similar, with no prominent trade flows; and Korea and India are classified as unbalanced, i.e., their trade strategies focus on a few countries in the region. Specifically, unbalanced countries have close trade ties with a few countries in the region, and their bias is obvious. Usually, balanced countries have a wide range of influence in the geoeconomy, and their relationships with related countries are generally complementary, making balanced countries comparatively resilient to risks. The semi-balanced countries display an obvious tendency to cluster in the region, and the unbalanced countries only display significant mutual influence with a few countries in the region. Consequently, their trade dependence is strong, and their resilience to economic risks is relatively weak.
The above five countries are typified in terms of the corresponding country distribution and trade linkage intensity results. Japan and the U.S. are balanced, with relatively homogeneous trade linkages in the region. China is semi-balanced, with closer trade linkages with some countries in the region than with others. Korea and India are unbalanced, displaying closer trade linkages with only a few countries in the region, with an obvious bias. Usually, balanced countries have a wide range of influence on the geoeconomy, have strong complementary relationships with related countries, and are relatively resilient to risks. Semi-balanced countries have a more obvious tendency to cluster in the region, and unbalanced countries are characterized by significant mutual influence with only a few countries in the region, making them relatively trade-dependent and less resilient to economic risk.

3.2.3. Evaluation of Analysis Results

The effectiveness of the application of the method can be evaluated from various perspectives such as correlation analysis, mathematical statistics, and comparison with the existing studies, thus proving the validity of the research method. The main manifestations are:
  • In the cross-level trade flow association feature analysis, the analysis results of the cross-level trade flow association rule are verified by the correlation coefficient between category trade flow and overall trade flow.
  • In the analysis of the frequency characteristics of strongly correlated trade flows, the high degree of influence of the annual average trade flows between Japan and Korea in the regional economy is confirmed by the method of mathematical statistics.
  • The validity of the method is demonstrated by the similarity of the findings in the analysis of the subject countries of strongly correlated trade flows by comparing them with the existing generally accepted research arguments.

4. Discussion

The proposed geoeconomic-oriented rule mining method for geographic object flows involves processing and organizing data according to the temporal characteristics, descriptive parameters, and hierarchical structure of the considered geographic object flows at certain spatial and temporal scales to form a database for association rule mining. Based on the principles of association rule mining, the classic association rule mining algorithm is improved to identify the association relationships between the flows of geographical objects with a hierarchical structure. The results of this paper suggest that the correlations among and characteristics of geographical object flows can be mainly reflected by the following three characteristics.
  • Dynamic Relevance: A geographic object flow is a dynamic spatiotemporal process, and the direction, velocity, and rate of a geographic object flow can change dynamically with time. Dynamically changing geographic object flows are often correlated. Changes in one set of geographic object flows can result in changes in other related geographic object flows. The dynamic associations of geographic object flows can be used to map the development of and changes in geopolitical relations among countries in a region.
  • Cross-Level Interactivity: The structure of a geographic object flow determines and influences the interactions among components at different levels. In different application scenarios, there are differences in the form and intensity of interactions between parent and child geographic object flows in a hierarchy. Through the mining of cross-level association rules, it is possible to discover the characteristics of the associations between parent–child levels, identify the elements that have a critical impact on geoeconomic relations in a region, and analyze geoeconomic relations at different scales.
  • Restrictive Spatial and Temporal Scopes: The state and development trends of a geographical object flow occur in a certain time and space. Space is the domain of object existence and movement, and time is related to movement and feature transformation processes; thus, as an objectively existing process, the geographic object flow has distinct spatial and temporal characteristic. The correlations among geographic object flows are somewhat transitive, at least within a limited spatial context. Therefore, association rule mining for geographic object flows is limited to a certain spatial domain, which is a closed interval. In addition, changes in the relationships between the flows of geographical objects are continuous [36], and in a certain period of time, there are relatively obvious correlations between the flows of geographical objects; these obvious correlations are relevant for analyses of the geoeconomic relations between countries and their geoeconomic positions in the region. Therefore, a correlation analysis of geographic object flows has limited spatial and temporal scopes with defined sets of objects and flows rather than considering infinite migration and expansion.
Compared with previous research, the advantages and limitations of the method can be discovered. Previous research in the field of geopolitics and geoeconomics has been mostly qualitative in analysis, relying mainly on the empirical knowledge and logical thinking of the researcher. The existing methods of quantitative analysis in the literature [1] use gravitational models to measure geopolitical relations, which can measure the strength of relations between countries caused by certain key factors but do not provide a reasonable quantification of the mechanism of spatial distance in the attenuation of the strength of relations. This problem is effectively circumvented by using the flowing nature of the object flow in the research approach of this paper. Hierarchical analysis-based relationship measures, such as those in the literature [2], are significantly indicator-dependent. On the other hand, the data mining approach adopted in our research does not rely on indicators and discovers patterns directly from the phenomena. The literature [3] used the method of mining the relationship between event subjects from event data but could not discover the relationship between the changed phenomena. In contrast, the method used in our research can mine relationships from changing time-series data and is more convincing. The social network analysis approach used in the literature [4] effectively identified the network of relationships between multiple countries in the region and the influence of specific countries in the region. The method in this paper not only can achieve the above analysis, but also mine the association rules between cross-level elements with relatively simple algorithms (Table 3).
The main innovations of this paper are as follows.
  • The concept of a geographic object flow is proposed, and the mechanism of geographic object flow in spatial interactions are used to determine the correlations among and changes in geospatial units. Compared with the direct use of mathematical models for quantitative analysis, the use of the proposed data mining method for geographic object flows reduces the one-sidedness and subjectivity of index selection to a certain extent and improves the objectivity of the analysis.
  • An association rule mining method with hierarchical constraints is proposed. By constructing a matrix of parent–child attribute terms, the association relationships between flows of geographical objects with hierarchical characteristics can be identified. Key factors can be targeted among many related attributes at different levels to explore the association rules between geographical objects at different scales.
The present study still has some limitations that need to be clarified and considered in the follow-up study as follows.
  • The efficiency of the association rule mining algorithms needs to be improved, especially in cases that require large-scale data analysis.
  • The conclusions of association rule mining still lack practical meaning. It is difficult to directly evaluate the degree of matching between the association rules mined based on geographical object flows and the association relationships among countries in the real geoeconomy.
  • The method of association rule mining requires a high level of data completeness, and it is difficult to supplement data by interpolation. For example, the experimental analysis in this paper did not include all countries in the Indo-Pacific region due to the lack of completeness of the data available for some countries. Association rule mining does not consider features other than geographic object flow parameters.
In response to the limitations of the study, future research should continue to make the following improvements.
  • For the algorithm efficiency problem, new strategies and technologies need to be introduced to improve the low efficiency and high complexity of traditional methods in future research.
  • In response to questions about the accuracy of the study results, they must be verified from multiple perspectives by combining knowledge from multiple fields and mathematical models in subsequent studies.
  • In response to the data limitation problem, subsequent research is needed on data interpolation and equivalent substitution methods, as well as adding multiclass attribute terms to reflect the rules of variation among multiple economic characteristics in the region.

5. Conclusions

In this paper, we propose an association rule mining algorithm with hierarchical constraints based on geographic object flows for regional geoeconomics. A method of association rule mining for geographic object flows is studied, and the data are segmented according to the time series characteristics of geographic object flow data. The basic attribute items for association rule mining are determined based on the basic parameters of geographic object flows (flow velocity, flow rate, and flow direction). A database for association rule mining is formed according to the characteristics of the hierarchical structure of geographic object flows. Based on the database of association rule mining, a cross-level constrained association rule mining algorithm is developed by improving the Apriori algorithm using a parent–child matrix. In this paper, we select 25 countries in the Indo-Pacific region as examples to mine the association rules of trade flows between 2010 and 2021 and perform mathematical, statistical analyses on the mined trade flows with strong associations. Combined with domain knowledge, the mining results are analyzed in terms of the basic features of trade flow associations and country-oriented trade flow associations. The results of the experimental study indicated that the trade flows with high correlations are concentrated in countries along the west coast of the Pacific and that the trade flows among Japan, Korea, China, and Thailand have a significant impact on the changes in other trade flows, with Japan being the most active trader in the region. Among the five types of subtrade flows selected for the experiment, nuclear commodity trading has the highest degree of influence on regional trade flows. By comparing and cross-validating the experimental results with relevant economic statistics and the results of existing studies, the usability of the method is confirmed.
The method proposed in this paper can be used to explore the dynamic correlations among geospatial unit relations in macro spatial-temporal systems and provide an approach for assessing geoeconomic relationships. Based on the analysis of geoeconomic phenomena and data, this study combines quantitative and qualitative methods, innovates the method of discovering knowledge and laws in the dynamic changing phenomena and data of geographic object flow, and innovates the cross-level association rule mining algorithm, which provides an idea for the research of macro geoeconomic problems. The method of this paper can be used to determine the geoeconomic relations between countries in a region and the geoeconomic influence of countries and can be extended to other related fields, such as geopolitics and geo-culture, according to research needs. To a certain extent, the contribution of this study is to provide knowledge and technical support for regional and national sustainable development strategies as well as help decision-makers more accurately judge the regional geo-relational situation and the influence of the state in the region to effectively adopt sustainable development plans.

Author Contributions

Conceptualization, W.Z.; methodology, W.Z. and X.Y.; software, W.Z.; validation, W.Z. and Y.C.; formal analysis, W.Z.; survey, W.Z.; resources, W.Z.; data collation, X.Y.; writing—original manuscript preparation, W.Z.; writing—review and editing, W.Z. and X.Z.; visualization, Y.C.; supervision, N.J.; project management, N.J.; funding acquisition, N.J. All authors have read and agreed to the published version of the manuscript.

Funding

National Key Research and Development Program of China, No. 2021YFB3900900.

Institutional Review Board Statement

Not applicable.

Informed Consent Statement

Informed consent was obtained from all subjects involved in the study.

Data Availability Statement

https://www.wto.org (accessed on 1 March 2022); https://data.worldbank.org.cn (accessed on 30 April 2022); https://www.customs.gov.cn (accessed on 30 April 2022).

Conflicts of Interest

The authors declare no conflict of interest.

References

  1. Mishra, A.K.; Gadhia, J.N.; Kubendran, N.; Sahoo, M. Trade flows between India and other BRICS countries: An empirical analysis using gravity model. Glob. Bus. Rev. 2015, 16, 107–122. [Google Scholar] [CrossRef]
  2. Hu, Z.D.; Ge, Y.J.; Xu, J.W. Geopolitical energy security evaluation method and its application based on politics of scale. Geogr. Res. 2014, 33, 853–862. [Google Scholar] [CrossRef] [Green Version]
  3. Li, Q.X.; You, X.J.; Wei, S.Q. A study on the measurement and influencing factors of cross-strait relations based on event data analysis. World Geogr. Res. 2022, 31, 514–526. [Google Scholar]
  4. Pan, F.H.; Lai, Z.Y.; Ge, Y.J. Social network analysis in geo-politics studies. Econ. Geogr. 2013, 33, 15–21. [Google Scholar] [CrossRef]
  5. Wang, S.; Zhu, A.X.; Ge, Y.; Liu, Y.; Xue, X. The spatio-temporal evolution of geo-economic relationships between China and ASEAN countries: Competition or cooperation? Sustainability 2017, 9, 1064. [Google Scholar] [CrossRef] [Green Version]
  6. Wilson, A.G. A family of spatial interaction models, and associated developments. Environ. Plan. A Econ. Space 1971, 3, 1–32. [Google Scholar] [CrossRef] [Green Version]
  7. Haining, R.P. Estimating spatial-interaction models. Environ. Plan. A Econ. Space. 1978, 10, 305–320. [Google Scholar] [CrossRef]
  8. Liu, Y.; Yao, X.; Gong, Y.; Kang, C.; Shi, X.; Wang, F.; Wang, J.; Zhang, Y.; Zhao, P.; Zhu, D.; et al. Analytical methods and applications of spatial interactions in the era of big data. Acta Geogr. Sin. 2020, 75, 1523–1538. [Google Scholar] [CrossRef]
  9. Chen, Y.G. On the mathematical form, dimension, and locality of the spatial interaction model. Acta Sci. Nat. Univ. Pekin. 2009, 45, 333–338. [Google Scholar] [CrossRef]
  10. Pei, T.; Shu, H.; Guo, S.H.; Song, C.; Chen, J.; Liu, Y.; Wang, X. The concept and classification of spatial patterns of geographical flow. J. Geo-Inf. Sci. 2020, 22, 30–40. [Google Scholar] [CrossRef]
  11. Shu, H.; Pei, T.; Song, C.; Chen, X.; Guo, S.; Liu, Y.; Chen, J.; Wang, X.; Zhou, C. L-function of geographical flows. Int. J. Geogr. Inf. Sci. 2021, 35, 689–716. [Google Scholar] [CrossRef]
  12. Ge, Q.S.; Jiang, D.; Lu, F. Geo-environmental system simulation study explores the study of geo-environmental systems. Acta Geogr. Sin. 2017, 72, 371–381. [Google Scholar] [CrossRef]
  13. Wang, S.F.; Ge, Y.J.; Hu, Z.D. The construction of geo-economic self-circulating ecosystem from the perspective of space flows. World Reg. Stud. 2019, 28, 88–95. [Google Scholar] [CrossRef]
  14. Hu, W.; Ge, Y.; Dang, Q.; Huang, Y.; Hu, Y.; Ye, S.; Wang, S. Analysis of the development level of geo-economic relations between China and countries along the belt and road. Sustainability 2020, 12, 816. [Google Scholar] [CrossRef] [Green Version]
  15. He, Y.S. Research and Application of Correlation Rule Mining Technology. Ph.D. Thesis, Nanjing University of Aeronautics and Astronautics, Nanjing, China, 2010; pp. 6–18. [Google Scholar]
  16. Agrawal, R.; Srikant, R. Fast algorithms for mining association rules in large databases. In Proceedings of the 20th International Conference on Very Large Data Bases, Santiago de Chile, Chile, 12–15 September 1994; Morgan Kaufmann Publishers Inc: San Francisco, CA, USA, 1994; pp. 487–499. [Google Scholar]
  17. Leung, C.K.S.; Lakshmanan, L.V.S.; Ng, R.T. Exploiting succinct constraints using FP-trees. SIGKDD Explor. Newsl. 2002, 4, 40–49. [Google Scholar] [CrossRef]
  18. Cheung, Y.L.; Fu, A.W.C. FP-tree approach for mining N-most interesting itemsets. Chin. Univ. Hong Kong 2002, 4730, 460–471. [Google Scholar] [CrossRef]
  19. Park, J.S.; Chen, M.S.; Yu, P.S. An effective hash-based algorithm for mining association rules. In Proceedings of the ACM SIGMOD International Conference on Management of Data, San Jose, CA, USA, 22–25 May 1995; Volume 5, pp. 175–186. [Google Scholar]
  20. Chen, X.Q.; Yuan, L.H.; Shen, S.; Liang, X.; Wang, Y.; Wang, X.; Ye, S.; Cheng, C.; Song, C. Analysis of the geo-relationships between China and its neighboring countries. Acta Geogr. Sin. 2019, 74, 1534–1547. [Google Scholar] [CrossRef]
  21. Cui, Y.; Bao, Z.Q. A Review of Association Rule Mining. Appl. Res. Comput. 2016, 33, 330–334. [Google Scholar]
  22. Zhang, Y.; Yuan, S.M. A New Multi-Level Correlation Rule Efficient Mining Algorithm. J. Northeast. Norm. Univ. (Nat. Sci. Ed.) 2003, 2, 15–20. [Google Scholar]
  23. Li, Y.N. Correlation Analysis of Cross-layer Characteristics of Counter-Terrorism Intelligence Based on Multi-level Correlation Rules Mining. Inf. Sci. 2021, 39, 127–132. [Google Scholar]
  24. Bi, J.X.; Zhang, Q.S. A review of association rule mining algorithms. China Eng. Sci. 2005, 4, 88–94. [Google Scholar]
  25. Han, J.W.; Pei, J.; Yin, Y.W. Mining frequent patterns without candidate generation. In Proceedings of the ACM SIGMOD International Conference on Management of Data, Dallas, TX, USA, 15–18 May 2000; ACM Press: New York, NY, USA, 2000; pp. 1–12. [Google Scholar]
  26. Agrawal, R.; Shafer, J. Parallel mining of association rules. IEEE Trans. Knowl. Data Eng. 1996, 8, 962–969. [Google Scholar] [CrossRef] [Green Version]
  27. Mcconnell, J.E. International trade: Geographic aspects. In International Encyclopedia of the Social & Behavioral Sciences; Elsevier: Amsterdam, The Netherlands, 2001; pp. 7848–7852. [Google Scholar]
  28. Siddiqa, A.; Saleem, A.H. Strategic overlays in the Indo-Pacific: Implications for South Asia. J. Asia Soc. Sci. 2022, 6, 1–15. [Google Scholar] [CrossRef]
  29. Department of State. A Free and Open Indo-Pacific: Advacing a Shared Vision; Department of State: Washington, DC, USA, 2019; Volume 11, pp. 13–16. [Google Scholar]
  30. Available online: https://www.state.gov/ (accessed on 1 April 2021).
  31. Available online: https://www.dfat.gov.au/ (accessed on 1 April 2021).
  32. Available online: https://www.mea.gov.in/ (accessed on 1 April 2021).
  33. Brewster, D. Dividing lines: Evolving mental maps of the Bay of Bengal. Asian Secur. 2014, 10, 151–167. [Google Scholar] [CrossRef]
  34. United Nations. UN Comtrade Database. Available online: https://comtrade.un.org/ (accessed on 1 April 2022).
  35. Harvard Growth Lab. Atlas of Economic Complexity. Available online: https://atlas.cid.harvard.edu/ (accessed on 1 April 2022).
  36. Cohen, S.B. Geopolitics: The Geography of International Relations; United Kingdom Rowman & Littlefield: London, UK, 2015. [Google Scholar]
Figure 1. The flowchart of research methodology.
Sustainability 14 09085 g001
Figure 2. Hierarchical composition of geographic object flows.
Sustainability 14 09085 g002
Figure 3. Scope of the study area. Note: Made based on the standard map of GS(2021)5450 from the standard map service website of the Ministry of Natural Resources of China, with no modification to the base map.
Sustainability 14 09085 g003
Figure 4. Sankey diagram of strongly correlated trade flows.
Sustainability 14 09085 g004
Figure 5. Frequency distribution of strongly correlated trade flows.
Sustainability 14 09085 g005
Figure 6. Frequency of countries with strongly correlated trade flows. (Note: Made based on the standard map of GS(2021)5450 from the standard map service website of the Ministry of Natural Resources of China, with no modification to the base map.)
Sustainability 14 09085 g006
Figure 7. Country-oriented trade flow correlation characteristics.
Sustainability 14 09085 g007
Table 1. Definitions of the geographic object flow attributes.
Geographic Object Flow
Attribute Data Partitioning
Description of the
Geographic Object Flow Properties
The Definition of Attributes for Term I
Pab ≥ v1Significant increaseI = SIin − ObjFlowab
v2 < Pab < v1IncreaseI = In − ObjFlowab
Pab = v2No changeI = St − ObjFlowab
v3 < Pab < v2DecreaseI = De − ObjFlowab
Pab ≤ v3Significant decreaseI = SIDe − ObjFlowab
Table 2. Correlation coefficients between trade flows of categories and overall trade flows.
ID of Child_objCorrelation Coefficient
HS_Code 840.81
HS_Code 930.56
HS_Code 270.54
HS_Code 100.24
HS_Code 880.10
Table 3. Comparison of commonly used quantitative methods.
Quantitative Methods
Commonly Used in
Geoeconomic Research
AdvantagesLimitationsApplicability
Gravitational modeling methodMore mature modelsThe spatial distance decay mechanism in relational strength cannot be reasonably quantified wellApplied to determine the relationship between two spatial units in a specific domain.
Hierarchical AnalysisSimple and easy to useSignificant dependence on metricsApplied to relationship evaluation supported by sufficient data.
Event AnalysisHigh objectivitySpecial events tend to create interferenceApplied to relationship characterization in events.
Network AnalysisMultilateral relationship judgment, easy to expandThe algorithm is relatively complexApplied to the analysis of the network of relationships and network characteristics among multiple subjects.
Association rule mining methodDirect, dynamic, cross-level relational analysisHigh temporal requirements for data and algorithms affect efficiencyUsed to discover the dynamic characteristics of relationships from phenomena and data.
Publisher’s Note: MDPI stays neutral with regard to jurisdictional claims in published maps and institutional affiliations.

