Abstract
During the actual operation of the solid oxide fuel cell (SOFC), degradation is one of the most difficult technical problems to overcome. Predicting the degradation trend and estimating the remaining useful life (RUL) can effectively diagnose the potential failure and prolong the useful life of the fuel cell. To study the degradation trend of the SOFC under constant load conditions, a SOFC degradation model based on the ohmic area specific resistance (ASR) is presented first in this paper. Based on this model, a particle filter (PF) algorithm is proposed to predict the long-term degradation trend of the SOFC. The prediction performance of the PF is compared with that of the Kalman filter, which shows that the proposed algorithm is equipped with better accuracy and superiority. Furthermore, the RUL of the SOFC is estimated by using the obtained degradation prediction data. The results show that the model-based RUL estimation method has high accuracy, while the excellence of the PF algorithm for degradation trend prediction and RUL estimation is proven.
1. Introduction
Environmental pollution and energy shortages have become the two major challenges facing society today, while looking for highly efficient and environmentally friendly energy conversion methods to alleviate these problems is of great significance [1,2]. The fuel cell, as a low-polluting and efficient energy conversion device, has attracted extensive attention in recent years. Among the fuel cells, the solid oxide fuel cell (SOFC) has become one of the most promising power generation technologies for its quietness, solid fuel flexibility, high energy efficiency, etc. [3,4].
In practice, SOFCs are susceptible to severe performance degradation, such as fuel contaminants, carbon deposition, thermal stress, chromium and sulfur poisoning of the electrodes, etc., which result in fuel cell failure before the expected lifetime is reached. Short lifetime and high cost are two key factors restricting the commercialization of SOFCs. In general, SOFC stack performance degradation is a gradual process, not a one-time event [5,6]. Therefore, an appropriate prediction method can greatly increase the lifetime of the SOFC and indirectly reduce the cost by estimating the downtime and taking maintenance measures in advance [7].
Degradation trend prediction can capture the evolution of the performance degradation before the SOFC failure. The methods of prediction generally include two categories: data-driven methods and model-based methods. The data-driven approach analyzes degradation trends of the SOFC from a large amount of available historical data, rather than a complex nonlinear mechanism model. Arriagada et al. [8] used ANN and BP algorithms to predict the performance and parameters of the SOFC’s unknown operating points. Campanari et al. [9] analyzed and predicted the performance under full load and partial load by establishing a detailed calculation model of the SOFC and micro-turbine system. Marra et al. [10] presented a neural network frame to estimate the degradation trajectory of the SOFC voltage. Based on the above data-driven research methods, fruitful degradation prediction results of the SOFC have been obtained. However, due to the higher operating cost and the unfeasible direct measurement of some variables in the SOFC system, it is difficult to obtain accurate prediction results.
The model-based prediction method describes the SOFC degradation process by establishing a physical model that has the advantages of requiring less data, while having high accuracy and generality. In order to improve system performance and prolong system lifetime, it is essential to establish a SOFC system model that can effectively describe the relationship between system performance and various long-term variables. Wu et al. [5] established the voltage mechanism model considering the nickel coarsening and oxidative degradation, and also estimated the remaining useful life (RUL) of the fuel cells by the phase space trajectory similarity. Zaccaria et al. [11,12] developed a physical degradation model to describe the voltage degradation. Khan et al. [13] presented a simplified empirical model to describe the time variation in particle size and TPB length in the anode of the SOFC. These studies focused on the cell voltage degradation. However, the output voltage of the SOFC is related to cell degradation, load condition changes, and controller-induced system responses. Hence, using the voltage as the only degradation characteristic signal of the SOFC is not precise [14].
The increase in ohmic resistance is the main cause of the SOFC stack performance degradation [15,16]. The area specific resistance (ASR) is the internal resistance normalized by the active area of the cell. Therefore, the ASR can be used as an index of the SOFC performance degradation. Furthermore, the change in the ASR is the degradation trend of the SOFC.
So far, there are few studies on predicting the RUL with the ASR. Dolenc et al. [17] designed a hybrid approach to predict the RUL of the SOFC. However, the design process of the hybrid method is more complicated and the prediction accuracy needs to be further improved.
The particle filter (PF) algorithm is approximated by the Bayesian filtering algorithm based on Monte Carlo, which recursively estimates the evolutionary posterior distribution of the system using a set of weighted particles. In particular, the PF is a promising approach to deal with nonlinear models under non-Gaussian noise [18,19]. Until now, PF has been successfully applied in many fields, such as radar tracking, robot localization, etc. However, the concrete study of the RUL prediction of the SOFC with the PF algorithm has not been found in the earlier literature.
The main contributions of this paper are presented as follows:
- To improve the durability, a dynamic model of the ohmic ASR is proposed, which can accurately evaluate the performance degradation characteristics of the SOFC;
- Based on the established dynamic model, the PF algorithm is proposed to achieve the long-term prediction of the degradation trend and the accurate estimation of the RUL of the SOFC.
The rest of this paper is organized as follows: Section 2 briefly introduces the nonlinear dynamic mechanism model of the SOFC. The PF algorithm and the detailed process of the degradation trend prediction and the RUL estimation for the SOFC are presented in Section 3. In Section 4, some results and discussion are given. Finally, conclusions are summarized in Section 5.
2. Nonlinear Dynamic Model of the SOFC
There are various models in the literature that describe the dynamic behavior of the SOFC. According to the different design purposes, these models range from the simple 0-dimensional models (that only describe the main dynamics) to the detailed 3D dynamic models. As we all know, degradation directly affects the resistance of the SOFC stack. The increase in resistance causes the decrease in stack voltage and the increase in outlet temperature. Hence, it is crucial to develop a dynamic model for the degradation trend prediction and the RUL estimation.
2.1. Energy Balance Sub-Model
By performing energy balance around the entire fuel cell stack, the temperature dynamics can be described as [20]:
where is the stack lumped thermal capacity, and and , respectively, represent the energy flows at the inlet and the outlet of the SOFC stack.
Where:
where the input molar flow rates , the input gas mole fraction and the SOFC input temperatures can be measured, is the molar flow rate at the stack outlet, and means the enthalpy of the gas under the temperature .
Where:
where is the electro-oxidation reaction rate, which can be calculated as:
where is the stack current.
2.2. Electrochemical Sub-Model
The voltage of the SOFC stack can be modeled as follows:
where is the number of cells, represents the cell voltage, , and are the ohmic polarization voltage, the activating polarization voltage and the concentration polarization loss voltage of the stack, respectively. means the open circuit voltage, which can be described as:
where is the universal gas constant, , and represent the partial pressures of hydrogen, oxygen and water vapor within the stack. In general, the partial pressure of the gases in the stack is similar to the input/output gas partial pressure, which is calculated as:
where , and means total anode inlet/outlet molar flow rates. Similarly, the oxygen partial pressure is calculated in the same way on the cathode side.
In the electrochemical model, two equivalent ohmic ASR are considered to describe the relationship between the three voltages and current density in the literature [21,22,23]:
where represents the lumped ASR, means the active area, means the lumped ASR without contact resistance, and is the lumped ASR representing contact resistance. Based on experimental data, the can be fitted in the form of the following polynomial:
where , , , , , , and the unit of the is Celsius.
The can be calculated as [24]:
where means the rate constant for the growth of the scale thickness, represents the conductivity constant, and and mean the activation energy for the oxide scale growth and the conductivity, respectively.
3. Degradation Trend Prediction and RUL Estimation of the SOFC
To effectively diagnose potential failures and prolong the lifetime of the SOFC, the PF algorithm is presented, then it is used to predict the ASR and estimate the RUL of the SOFC in this section.
3.1. Particle Filter Algorithm
PF is a Monte Carlo algorithm based on Bayes’ principle, which is proposed to recursively estimate the evolving posterior distribution of a system by using a set of weighted particles [25]. The core idea of the PF is to express the required posterior density function by a set of random particles with equal weights. Based on the following system state space model, the PF algorithm can be described as:
The probability density function based on the state space model is calculated by the Chapman–Kolmogorov equation, that is:
and
Then the minimum variance estimation value is calculated according to the Bayesian estimation theory as:
According to the Monte Carlo method and the law of large numbers, when the sample size is large enough, the posterior probability density can be approximated as:
where:
There are finite random particles that are extracted from the probability density function . Each of these particles is assigned a unified weight of .
Suppose the system has outputs, represents the Dirac pulse function. Through introducing a suggested distribution and using the principle of importance sampling, the probability density function of the subsequent particles can be estimated as:
where:
and the projected weights are standardized as:
Afterwards the algorithm comes into the next iteration. The estimated state can be expressed as:
Figure 1 shows the general process of the PF for the state prediction. When one particle has unit weight while all other weights are near zero, particle degradation or samples impoverishment occurs. This can be addressed by complementary procedural resampling, which is widely used in the PF. The additional process is only triggered and utilized when the effective particle count falls below a definite threshold . The effective number of particles is approximated by the following equation:
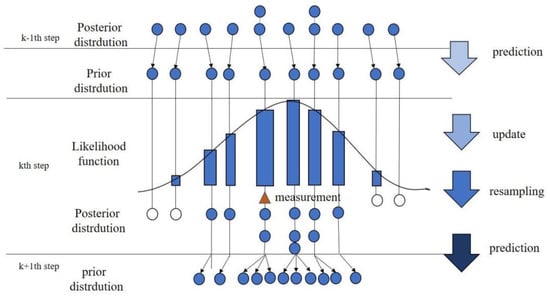
Figure 1.
General process of particle filter.
3.2. Prediction of the Degradation Trend Based on the PF Algorithm
In this study, we are supposing that the stack is not subject to the changes in external operating conditions and internal faults. In order to accurately predict the degradation trend, this paper assumes that the lumped ASR linearly changes with time, which can be expressed as:
The above model is rewritten as a discrete state-space model with two states:
where is the degradation state of the SOFCs, denotes the stack ASR, and means the process noise and the measurement noise, assuming that both noises follow the Gaussian distribution with zero mean, and . Then, the state variable is composed of the lumped ASR and the degradation rate , which is given as follows:
Here, the matrixes A and B are assigned as:
Then, the degradation state and the measure variable can be estimated by the proposed PF algorithm.
3.3. Estimation of the RUL
The RUL is defined as the time when the output power of the SOFC falls below a threshold value. The time when the stack cannot operate adequately represents its end of life (EOL).
According to the application conditions and the final requirements, the EOL standard may be different. It can be known from the existing literature that EOL can also be defined as the decline in output voltage or power conversion efficiency. Taking into account the EOL standard and the operating conditions, the lumped ASR at this time can be calculated as:
where is the open circuit voltage, and represents the minimal nominal acceptable output voltage. After defining , RUL can be characterized as the time span from the initial to the final value .
In general, RUL of the SOFC can be predicted by the estimated value as Algorithm 1:
where and , respectively, represent the degradation time step and the overall length of the degradation time. is the RUL of the SOFC at time step . When the reaches , it means the SOFC reaches the EOL and .
| Algorithm 1 RUL estimation algorithm |
End While End |
4. Results and Discussion
To verify the validity of the SOFC dynamic model in the MATLAB/Simulink simulation environment, the setting values of the parameters used in Equations (1)–(18) are given in Table 1. In this study, the input air and fuel temperatures are both 973 K, the input air flow rate is set as , and the input fuel flow rate is chosen as .

Table 1.
Model Parameter setting values for the SOFC.
During normal operation of the SOFC, a load disturbance causes the stack current to have multiple step changes that reduce from 15 A to 10 A at 5000 s, and go back to 13 A after 10,000 s. The step curve of the stack current is shown in Figure 2. In this circumstance, the temperature dynamic characteristics of the SOFC are depicted in Figure 3, where we can see the temperature decreases with the load current declining, and increases with the current rising. This is because the decrease in the load current can prevent electrochemical reaction and generate less heat in the stack.
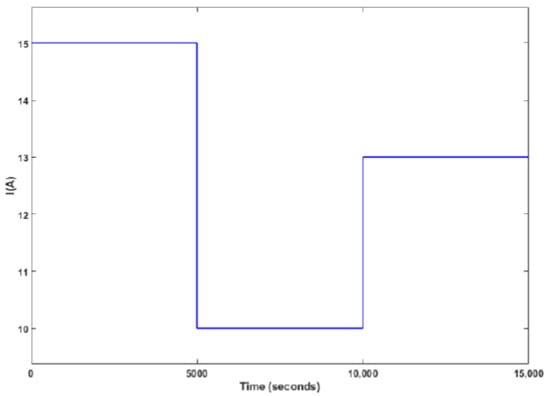
Figure 2.
Step curve of current.
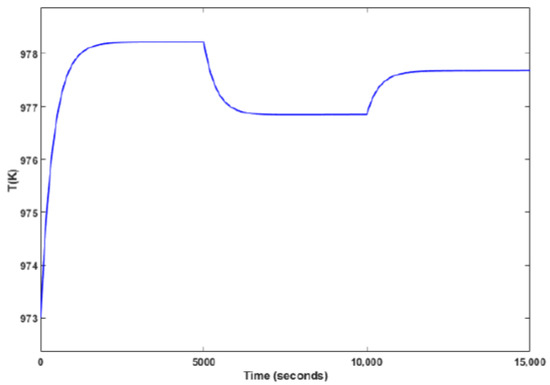
Figure 3.
Curve of the temperature dynamic characteristics.
In the case of the above current disturbances, the temperature dynamics are reasonable and the same as the objective situation. This indicates that the established nonlinear dynamic model can accurately describe the dynamic behaviors of the SOFC.
4.1. ASR Prediction Results of the Degradation Trend
The timescale for SOFC degradation is typically 103 h [26], and in this study we use the ASR change during 1600 h to characterize the long-term performance degradation trend of the SOFC. Firstly, the initial values of the PF algorithm i.e., covariance matrix P0, state matrix X0, process and measurement error covariance matrix Q and R are, respectively, set as follows:
Based on the above initial values, the ASR prediction results of the SOFC by using the PF algorithm are depicted with the red line in Figure 4. For comparison, the experimental results proposed by Hou et al. in [23] are shown as the green line in the first 100 h, and the Kalman filter (KF) proposed by Dolenc et al. in [14] is also used to predict the ASR and the results are described as the blue line. As can be seen from Figure 4, the ASR prediction results based on the PF and the KF algorithms are both almost consistent with the experiment results; however the PF approach yields faster convergence speed and higher prediction accuracy compared to the KF approach.
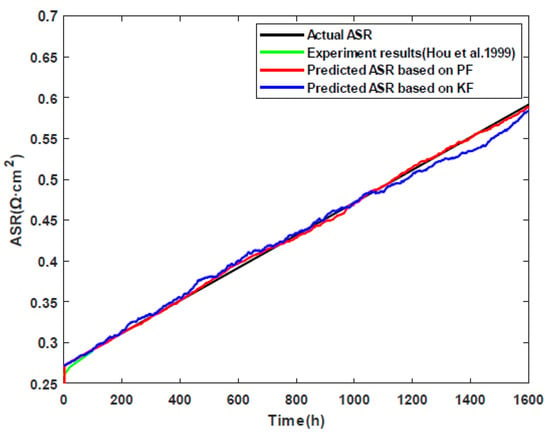
Figure 4.
The degradation trend prediction results (Experimental results (Hou et al. [23])).
To evaluate the effectiveness of the proposed method, Root Mean Square Error (RMSE), Mean Average Percentage Error (MAPE) and the Coefficient of determination (R2) are used as performance indicators. Different from RMSE and MAPE, the nearer to 1 the R2 is, the better the predictive effect is. The R2 is defined as:
The comparison results of the prediction accuracy are given in Table 2. From the analysis results, the RMSE and MAPE using the PF algorithm are 0.0008 and 0.0430, respectively. The resulting RMSE and MAPE of the KF approach are, respectively, 0.0126 and 1.4582. In addition, the R2 value for the PF and KF algorithms are separately 0.9866 and 0.8895. These further indicate that the PF algorithm has better prediction accuracy than that of the KF approach.

Table 2.
Comparison of the prediction accuracy.
4.2. RUL Prediction Results of the Degradation Trend
Degradation is one of the main disadvantages of using SOFCs, as it can negatively impact performance and environmental sustainability over a long period of time [27]. Using the estimation results of the RUL, it will be likely to know the best time and the relevant part of the SOFC required to perform a preventive maintenance to avoid some degradation. Furthermore, the operating conditions of the SOFC can be changed in real time to prolong its lifetime while maintaining power demand.
In this article, we further estimate the RUL of the SOFC by using the ASR degradation results based on the PF algorithm. The continuous increase in the ASR results in the performance degradation of the SOFC. Using the estimation method described in Section 3.3, the RUL estimation results of the SOFC are represented with the red solid line in Figure 5, where we can see the proposed RUL estimation method that can better assess the real RUL of the SOFC.
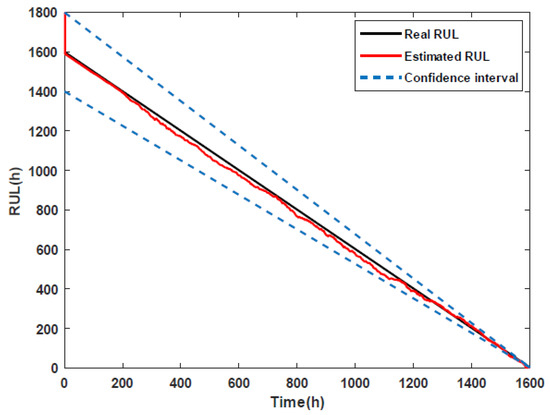
Figure 5.
The RUL estimation results.
In addition, the confidence interval of 1 ± 0.125 is also depicted by the blue dashed lines in Figure 5. As can be seen from Figure 5, all the RUL estimation results of the SOFC are within the confidence interval during the 1600 h prediction length. This confirms that it is feasible to estimate the RUL of the SOFC by using the proposed RUL estimation method based on the PF, and that the estimated RUL results presented in this paper are accurate and valid.
5. Conclusions
The main contribution of this paper is to predict the long-term degradation trend and estimate the RUL of the SOFC. In order to meet the requirements of prediction accuracy, the SOFC degradation model based on the ASR was established first. The simulation results verify the feasibility of the established nonlinear dynamic degradation model.
To protect the SOFC, the PF algorithm is proposed to realize the long-term degradation trend prediction and RUL estimation of the SOFC based on the established model. The good results of degradation trend prediction and RUL estimation have been proven in this study.
Future works should develop the degradation model considering more degradation mechanisms. In addition, and based on this model, other high-performance estimation approaches should be proposed to evaluate the RUL of the SOFC and prolong its lifetime. Furthermore, the results should be applied to the more complex and realistic SOFC system.
Author Contributions
Conceptualization, L.C.; methodology, L.C.; software, L.C.; validation, L.C. and X.K.; formal analysis, H.H.; investigation, L.C. and X.K.; resources, H.H.; data curation, G.X.; writing—original draft, L.C.; writing—review and editing, L.C. and H.H.; visualization, L.C. and Z.D.; supervision, H.H.; project administration, H.H. and J.X.; funding acquisition, H.H. and J.X. All authors have read and agreed to the published version of the manuscript.
Funding
This research was funded by the Young Eastern Scholar Program at Shanghai Institutions of Higher Learning, Special funding for the development of science and technology of Shanghai Ocean University (Grant No. A2-2006-00-200211), the Shanghai Pujiang Program (Grant No. 18PJ1404200) and the horizontal project (Grant No. D-8006-21-0116).
Institutional Review Board Statement
Not applicable.
Informed Consent Statement
Not applicable.
Data Availability Statement
Not applicable.
Conflicts of Interest
The authors declare no conflict of interest.
References
- Wu, X.; Xu, L.; Wang, J.; Yang, D.; Zhang, M.; Li, X. Discharge performance recovery of a solid oxide fuel cell based on a prognostic-based control strategy. J. Power Sources 2020, 480, 229102. [Google Scholar] [CrossRef]
- Yan, D.; Liang, L.; Yang, J.; Zhang, T.; Pu, J.; Chi, B.; Li, J. Performance degradation and analysis of 10-cell anode-supported SOFC stack with external manifold structure. Energy 2017, 125, 663–670. [Google Scholar] [CrossRef] [Green Version]
- Wu, X.; Jiang, J.; Zhao, W.; Li, X.; Li, J. Two-dimensional temperature distribution estimation for a cross-flow planar solid oxide fuel cell stack. Int. J. Hydrogen Energy 2020, 45, 2257–2278. [Google Scholar] [CrossRef]
- Huo, H.; Xu, K.; Cui, L.; Zhang, H.; Xu, J.; Kuang, X. Temperature gradient control of the solid oxide fuel cell under variable load. ACS Omega 2021, 6, 27610–27619. [Google Scholar] [CrossRef]
- Wu, X.; Xu, L.; Wang, J.; Yang, D.; Li, F.; Li, X. A prognostic-based dynamic optimization strategy for a degraded solid oxide fuel cell. Sustain. Energy Technol. Assess. 2020, 39, 100682. [Google Scholar] [CrossRef]
- Wu, X.-L.; Xu, Y.-W.; Xue, T.; Zhao, D.-Q.; Jiang, J.; Deng, Z.; Fu, X.; Li, X. Health state prediction and analysis of SOFC system based on the data-driven entire stage experiment. Appl. Energy 2019, 248, 126–140. [Google Scholar] [CrossRef]
- Liu, H.; Chen, J.; Hissel, D.; Su, H. Remaining useful life estimation for proton exchange membrane fuel cells using a hybrid method. Appl. Energy 2019, 237, 910–919. [Google Scholar] [CrossRef]
- Arriagada, J.; Olausson, P.; Selimovic, A. Artificial neural network simulator for SOFC performance prediction. J. Power Sources 2002, 112, 54–60. [Google Scholar] [CrossRef]
- Campanari, S. Full load and part-load performance prediction for integrated SOFC and microturbine systems. J. Eng. Gas Turbines Power 2000, 122, 239–246. [Google Scholar] [CrossRef]
- Marra, D.; Sorrentino, M.; Pianese, C.; Iwanschitz, B. A neural network estimator of Solid Oxide Fuel Cell performance for on-field diagnostics and prognostics applications. J. Power Sources 2013, 241, 320–329. [Google Scholar] [CrossRef]
- Zaccaria, V.; Tucker, D.; Traverso, A. A distributed real-time model of degradation in a solid oxide fuel cell, part I: Model characterization. J. Power Sources 2016, 311, 175–181. [Google Scholar] [CrossRef] [Green Version]
- Zaccaria, V.; Tucker, D.; Traverso, A. A distributed real-time model of degradation in a solid oxide fuel cell, part II: Analysis of fuel cell performance and potential failures. J. Power Sources 2016, 327, 736–742. [Google Scholar] [CrossRef] [Green Version]
- Khan, M.Z.; Mehran, M.T.; Song, R.-H.; Lee, J.-W.; Lee, S.-B.; Lim, T.-H. A simplified approach to predict performance degradation of a solid oxide fuel cell anode. J. Power Sources 2018, 391, 94–105. [Google Scholar] [CrossRef]
- Dolenc, B.; Boškoski, P.; Stepančič, M.; Pohjoranta, A.; Juričić, Đ. State of health estimation and remaining useful life prediction of solid oxide fuel cell stack. Energy Convers. Manag. 2017, 148, 993–1002. [Google Scholar] [CrossRef]
- Lim, H.T.; Hwang, S.C.; Jung, M.G.; Park, H.W.; Park, M.Y.; Lee, S.S.; Jung, Y.G. Degradation mechanism of anode-supported solid oxide fuel cell in planar-cell channel-type setup. Fuel Cells 2013, 13, 712–719. [Google Scholar] [CrossRef]
- Iwanschitz, B.; Holzer, L.; Mai, A.; Schütze, M. Nickel agglomeration in solid oxide fuel cells: The influence of temperature. Solid State Ion. 2012, 211, 69–73. [Google Scholar] [CrossRef]
- Dolenc, B.; Boskoski, P.; Pohjoranta, A.; Noponen, M.; Juricic, D. Hybrid approach to remaining useful life prediction of solid oxide fuel cell stack. ECS Trans. 2017, 78, 2251–2264. [Google Scholar] [CrossRef]
- Yu, S.; Fernando, T.; Iu, H.H.-C. A comparison study for the estimation of SOFC internal dynamic states in complex power systems using filtering algorithms. IEEE Trans. Ind. Inform. 2017, 13, 1027–1035. [Google Scholar] [CrossRef]
- Jouin, M.; Gouriveau, R.; Hissel, D.; Péra, M.-C.; Zerhouni, N. Prognostics of PEM fuel cell in a particle filtering framework. Int. J. Hydrogen Energy 2014, 39, 481–494. [Google Scholar] [CrossRef] [Green Version]
- Gallo, M.; Marra, D.; Sorrentino, M.; Pianese, C.; Au, S.F. A versatile computational tool for model-based design, control and diagnosis of a generic solid oxide fuel cell integrated stack module. Energy Convers. Manag. 2018, 171, 1514–1528. [Google Scholar] [CrossRef]
- Gazzarri, J.I.; Kesler, O. Short-stack modeling of degradation in solid oxide fuel cells—Part I. contact degradation. J. Power Sources 2008, 176, 138–154. [Google Scholar] [CrossRef]
- Yang, Z.; Weil, K.S.; Paxton, D.M.; Stevenson, J.W. Selection and evaluation of heat-resistant alloys for SOFC interconnect applications. J. Electrochem. Soc. 2003, 150, A1188–A1201. [Google Scholar] [CrossRef]
- Hou, P.Y.; Huang, K.Q.; Bakker, W.T. Promises and problems with metallic interconnects for reduced temperature solid oxide fuel cells. In Proceedings of the 6th International Symposium on Solid Oxide Fuel Cells (SOFC-VI), Honolulu, HI, USA, 17–22 October 1999; pp. 737–748. [Google Scholar]
- Larrain, D.; Van Herle, J.; Favrat, D. Simulation of SOFC stack and repeat elements including interconnect degradation and anode reoxidation risk. J. Power Sources 2006, 161, 392–403. [Google Scholar] [CrossRef] [Green Version]
- Cheng, Y.; Zerhouni, N.; Lu, C. A hybrid remaining useful life prognostic method for proton exchange membrane fuel cell. Int. J. Hydrogen Energy 2018, 43, 12314–12327. [Google Scholar] [CrossRef]
- Chi, Y.; Qiu, Y.; Lin, J.; Song, Y.; Hu, Q.; Li, W.; Mu, S. Online identification of a link function degradation model for solid oxide fuel cells under varying-load operation. Int. J. Hydrogen Energy 2022, 47, 2622–2646. [Google Scholar] [CrossRef]
- Naeini, M.; Cotton, J.S.; Adams, T.A. Dynamic life cycle assessment of solid oxide fuel cell system considering long-term degradation effects. Energy Convers. Manag. 2022, 255, 115336. [Google Scholar] [CrossRef]
Publisher’s Note: MDPI stays neutral with regard to jurisdictional claims in published maps and institutional affiliations. |
© 2022 by the authors. Licensee MDPI, Basel, Switzerland. This article is an open access article distributed under the terms and conditions of the Creative Commons Attribution (CC BY) license (https://creativecommons.org/licenses/by/4.0/).