Article

Heterogeneous Dynamic Correlation Research among Industrial Structure Distortion, Two-Way FDI and Carbon Emission Intensity in China

1
School of Management, Shandong University of Technology, Zibo 255000, China
2
School of Economics, Shandong University of Technology (SDUT), Zibo 255000, China
3
School of Business and Creative Industries, University of the West of Scotland, Paisley PA1 2BE, UK
*
Author to whom correspondence should be addressed.
Sustainability 2022, 14(15), 8988; https://doi.org/10.3390/su14158988
Submission received: 5 June 2022 / Revised: 8 July 2022 / Accepted: 11 July 2022 / Published: 22 July 2022
(This article belongs to the Section Economic and Business Aspects of Sustainability)

Abstract

:
The increase in carbon emissions year by year poses a severe challenge to the high-quality development and sustainability of China’s economy. How to reduce the intensity of carbon emissions has become a prominent issue to promote green growth. Based on the provincial panel data from 2011 to 2020, this paper uses Exploratory Spatial Data Analysis (ESDA), the spatial econometric model and intermediary effect test as analysis methods. The following results are drawn. Firstly, China’s industrial structure distortion index shows a downward trend. The industrial structure distortion index is the highest in the west of China, followed by the middle of China and is the lowest in the east of China. Secondly, the distortion of the industrial structure will not only lead to the increase in local carbon emission intensity but also produce reverse spillover to adjacent areas. Thirdly, the results of intermediary effect analysis show that industrial structure distortion can affect the transmission mechanism of carbon emission intensity by affecting two-way FDI. This paper has a profound practical significance for promoting the process of industrial upgrading by insisting on developing foreign trade to achieve carbon emission reduction. The main innovation of this paper is to put forward the concept of industrial structure distortion and bring it into a unified research framework with two-way FDI and carbon emission intensity.

1. Introduction

As the largest energy consuming country in the world, China’s long-term implementation of the inclined development policy with economic growth as the priority and rapid industrial system construction has accelerated the pace of China’s modernization to a certain extent, but it has also caused great damage to the ecological environment [1]. With the rapid development of industry, China’s energy consumption has always maintained a strong growth demand, which not only affects its industrial development and energy supply but also profoundly affects the global carbon emission pattern [2].
In view of the current grim situation necessitating carbon emission reduction, Chinese leaders made an important commitment at the Paris Summit that China will reach the peak of carbon in 2030 and be carbon neutral by 2060 [3]. As to how to achieve carbon emission reduction, academia generally believe that industrial structure adjustment, energy consumption structure transformation and technological progress are the three major ways to promote energy conservation and emission reduction, among which industrial structure adjustment is the most important supporting point to achieve carbon emission reduction. However, at present, the economic development and industrial structure of different provinces, municipalities and autonomous regions in China are highly out of balance, which leads to significant differences in carbon emission levels in different regions [4]. Therefore, it is of great significance for each province to implement feasible industrial development policies according to local conditions to achieve the goal of “double-carbon”.
Foreign trade is also considered as an important means to achieve energy conservation and emission reduction [5]. However, due to the unbalanced economic development among different regions in China, the lack of infrastructure construction, the deviation of resource allocation caused by the distortion of factor markets and the excessive drive of economic development by energy factors, the promotion effect of two-way FDI on economic development has been diluted [6]. In addition, the excessive and inefficient energy input caused by the distortion of industrial structure also increases carbon emission intensity. Therefore, does the distortion of the industrial structure lead to the increase in carbon emission intensity? In the current international environment, can actively “going out” and “bringing in” reduce carbon emission intensity? Does the distortion of the industrial structure have a conduction effect between two-way FDI and carbon emission intensity? The effective answers to the above questions are of great practical significance for realizing “carbon peak” and “carbon neutralization”, promoting the rationalization of industrial structure and accelerating the reform of the ecological civilization system.
The main contributions of this study are as follows. Firstly, most of the previous studies only paid attention to the positive effects of the industrial structure, but rarely mentioned the negative effects. This paper innovatively puts forward a new concept of industrial structure distortion and discusses the impact of two-way FDI on carbon emission intensity as a breakthrough point. Secondly, in the past, the impact of Outward Foreign Direct Investment (OFDI) and Inward Foreign Direct Investment (IFDI) on carbon emissions was considered as an isolated single impact. This paper studies the relationship between two-way FDI and carbon emissions. In this paper, IFDI and OFDI are brought into the same research framework, and their impacts on China’s carbon emission intensity are systematically analyzed, making the conclusion more scientific. Thirdly, regarding the influence of two-way FDI and carbon emission intensity, most scholars use the threshold model and intermediary effect model to explore the mechanism but inevitably ignore the spatial law of research samples. In short, this paper breaks through the traditional practice, investigates its evolution law from the spatial perspective and expands the existing research.
In view of the above analysis, this paper brings the distortion of industrial structure, two-way FDI and carbon emission intensity into the unified research framework. Firstly, based on the national panel data from 2011 to 2020, this paper calculates the carbon emission intensity of each province. Secondly, this paper combines the exploratory spatial data analysis (ESDA) and a spatial econometric model to analyze the spatial evolution characteristics of industrial structure distortion, two-way FDI and carbon emission intensity. Thirdly, to clarify the mechanism of industrial structure distortion on carbon emissions, this study also sets two-way FDI as an intermediary variable for empirical testing. Finally, this paper determines the key factors affecting carbon emission intensity and expects to provide targeted suggestions for China’s carbon emission reduction from the perspective of regional coordination with the help of the spatial measurement method.
This paper adopts the following structural arrangements: the second part combs the literature review. The third part is theoretical hypotheses. The forth part introduces the research methods. The fifth part makes an empirical test; The six part is the conclusion and enlightenment.

2. Literature Review

The research on the relationship between IFDI and carbon emission intensity has a long history, and most of them are concentrated in the host country. The earliest research on foreign investment and ecological problems can be traced back to the hypothesis of “pollution shelter” put forward by Copeland and Taylor [7]. Copeland and Taylor believed, that due to the differences in the intensity of regional environmental policies, developed countries may transfer pollution-intensive industries to developing countries across regions, thus, increasing the carbon emission intensity of the host country. Omri et al. [8] and Millimet and Roy [9] have confirmed this hypothesis; that is, IFDI leads to a reduction in pollution in the home country, while the pollution emissions of the foreign capital inflow country are relatively increased. On the contrary, Reppelin-Hill [10] put forward the “pollution halo” hypothesis and found that enterprises in developed countries are subject to higher environmental supervision standards. While crowding out inefficient enterprises, changing industrial structure and improving productivity and energy efficiency, foreign direct investment can promote the technological progress of the host country through horizontal, forward and backward links of enterprises, stimulating the spillover effect of ecological innovation and reducing the carbon emission intensity. Liang [11] believed that IFDI will promote the upgrading of the industrial structure of the host country, realize industrial upgrading and improve environmental quality. With the acceleration of market-oriented reform, Zheng and Sheng [12] pointed out that mature factor markets and product transactions are conducive to the impact of IFDI on China’s carbon dioxide emissions. However, due to the unsynchronized market development in different regions, the impact of IFDI on the carbon emission environment is different.
As OFDI’s research on carbon emission intensity is still in its infancy, most of its research focuses on the economic environment and environmental level. On the one hand, from economic perspectives, Ozawa [13], Pan et al. [14] and Yao et al. [15], respectively, demonstrated the impact of foreign direct investment on the home country’s economy from the aspects of industrial structure upgrading, reverse technology spillover and the agglomeration effect.
On the other hand, from the perspective of the general environment, the main views can be divided into four points. The first point is that OFDI can reduce the carbon emission intensity of the home country. Xin and Zhang [16] took economic development as the starting point, simulated the environmental effects of OFDI improvement on the home country with the help of scale, structure and technology transmission mechanism, and affirmed that OFDI has a positive role in reducing carbon emissions. Gong and Liu [17] found that OFDI can weaken the carbon emission intensity of the home country through the scale effect by constructing the simultaneous equation model. Pan et al. [14] verified that OFDI could not promote carbon emission reduction in the home country through the spatial spillover effect and the GMM model. The third point is that OFDI has a comprehensive influence on the carbon emission intensity of the home country. Based on the dynamic panel model, Sung et al. [18] concluded that OFDI aggravates the environmental pollution of the home country in terms of the economic scale, but in terms of industrial structure and technical level, OFDI can improve the environmental quality; the positive effect is generally greater than the negative effect, and OFDI can promote the improvement of the overall environmental quality. The fourth point is the relation between uncertainty and nonlinearity of OFDI in environmental governance. Hao et al. [19] proved that the impact of OFDI on environmental pollution in the home country has an “inverted U-shape”.
This paper is mainly based on the theory of the pollution halo hypothesis, which holds that international trade promotes the technological progress and management concept of the host country [20]. At the same time, it also enhances the understanding of international environmental protection standards, which can promote the host country to improve its production methods and reduce environmental pollution. Because China has implemented a strong environmental protection system for a long time, the theory of the pollution halo hypothesis is more suitable for this study [21].

3. Research Hypothesis

Theoretically speaking, when the free flow of elements is blocked, the economy will be distorted and imperfect, which will inevitably lead to inefficiency in resource allocation [22]. Analyzing the degree of industrial structure distortion should be discussed from two aspects: market distortion and factor allocation deviation. The product market distortion is caused by trade barriers, price controls and export subsidies. When this difference is reflected in different departments, the overall efficiency of resource allocation will have deteriorated. In the allocation of production factors, Ando and Nassar [23] found that the transfer rate of production factors among various departments is equal through the non-competitive equilibrium model. When productive resources can be effectively allocated, the industrial structure is optimal. When the output and employment of one economic sector have deviated, the balance between industries is broken, and other sectors are reversed, resulting in the distortion of the factor market. In the industrial sector, due to the relative increase in labor price caused by industrial distortion, producers often choose to use the capital for labor substitution to achieve established output and reduce costs. This often leads to excessive energy consumption, leading to an increase in carbon emissions. When industrial investment is much higher than agricultural investment, the total energy consumption intensity of different industrial sectors must inevitably deteriorate.
Theoretically speaking, when the free flow of factors is hindered, the economic state can be distorted and imperfect, resulting in the inefficient allocation of resources [24]. Contrary to the distortion of industrial structure, it is the rationality of the industrial structure, which includes two aspects. The first point is the rational allocation of factors of production among different departments [25]. The second point is that all factors of production can be fully “reflected in the market”. Therefore, the analysis of industrial structure distortion should be discussed from two aspects: the deviation of factor allocation and market distortion [26]. Market distortion refers to the unreasonable relative price of products caused by trade barriers, price control and export subsidies. When this difference is reflected in different sectors, it worsens the overall efficiency of resource allocation and leads to an increase in carbon emissions.
In factor allocation, Ando and Nassar [23] argued that the rate at which factors of production are transferred between sectors is equal and that the industrial structure is optimal when productive resources can be allocated efficiently. However, when the output and employment in one economic sector deviate, and the equilibrium between industries is broken, the other sectors will deviate in the opposite direction, resulting in the distortion of factor market and the increase in energy intensity in the process of production. In the industrial sector, because of industrial distortions and the relatively high labor price, producers often choose to use laborious capital substitution to achieve a given output and reduce costs. However, this often leads to excessive energy consumption, thus, increasing carbon emissions. Moreover, in the current reality, with the current industrial investment being much higher than the agricultural investment, the total energy consumption intensity obtained by the different industrial sectors could further deteriorate.
Based on this, this paper puts forward the first hypothesis:
Hypothesis 1 (H1).
The distortion of industrial structure can lead to market distortions and the improper allocation of factors, resulting in the increase in total energy consumption and increased carbon emission intensity.
The interaction between IFDI and OFDI has a regulating effect on the economic development of a country or region, and it also has an impact on carbon emissions. Specifically, when the government reduces the environmental constraints and attracts foreign investment through low cost, IFDI promotes the rapid development of processing and manufacturing industries and then expands production, resulting in economies of scale, which stimulate the significant growth of the regional economy, but also means a lot of energy consumption. In a word, economic development can increase carbon emission intensity. However, IFDI squeezed out some inefficient and low-quality domestic enterprises through technology spillovers and transferred advanced technology to China, which promoted the upgrading of the industrial structure, improved energy utilization efficiency and innovation ability, which is consistent with the hypothesis of the “pollution halo” [27].
From the perspective of OFDI, long-term growth in OFDI can effectively transfer excess capacity, reduced fixed costs and, thus, reduce carbon emission intensity. Market-driven OFDI seeks overseas markets and production investments to promote profit growth while transferring pollution emissions. Technology-driven OFDI can help home countries to seek advanced technologies and promote its industrial structure to develop into new industries, so as to improve energy efficiency, reduce emissions and suppress carbon intensity [22]. On the one hand, resource-driven enterprises can ease their own resource constraints and reduce their dependence on overseas resources by going global. On the other hand, they can help their own countries improve their energy utilization and optimize their energy utilization structure through international cooperation with resource-rich countries and regions, which has a positive effect on reducing carbon emission intensity.
On the whole, the impact of two-way FDI on carbon emission intensity is complicated. With the acceleration of two-way FDI interaction, China’s position in the global value chain has improved, which has promoted the two-way flow of production factors and significant technological innovation spillovers, which will effectively reduce carbon emission intensity. This leads to the second hypothesis of this paper.
Hypothesis 2 (H2).
The coordinated development of two-way FDI has significantly restrained the increase in carbon intensity, and the positive effect of technological innovation is greater than the negative effect of environmental pollution.
From the perspective of industrial structure distortions affecting IFDI and, hence, regional carbon emissions, industrial structure distortions cause lower labor costs and attract more IFDI inflows, which are mostly labor-intensive and resource-seeking enterprises. Lower production costs also makes technology leaders lose their original advantage, leading to a “race to the bottom” among enterprises, which inhibits the development and upgrading of environmental technology [28]. Such IFDI flows into the market mainly in exchange for low factor prices, hence, it is difficult to expect that such foreign-funded enterprises have to produce technology spillovers and structural transformation.
On the one hand, the distortion of the industrial structure can cause the price of production factors used by manufacturing enterprises to deviate from the equilibrium price, thus, resulting in the cost advantage reflected in export trade. Although it promotes the international competitiveness of enterprises and their export scale, making them profitable, it also leads to the lack of motivation for enterprises to face high-risk and high-cost R&D activities, their willingness to manufacture traditional industrial products and higher carbon emission intensity [29].
On the other hand, because of the need to pursue economic development and improve political achievements, local governments prefer enterprises with a short production cycle and quick economic results [30]. As a result, enterprises tend to choose to enter government-supported industries in pursuit of cheaper factors of production, which further forces industrial structure distortions, increasing the lock-in effect on the sloppy development model. That is to say, under the imperfect market exit mechanism, energy-intensive enterprises continue to survive by virtue of their cost advantage, increasing the carbon intensity of export manufacturing. In short, industrial structure distortions can have an impact on regional carbon emission intensity through two-way FDI.
Based on the above analysis, a third hypothesis was formulated.
Hypothesis 3 (H3).
Two-way FDI exerts a significant mediating effect between industrial structural distortions and carbon emission intensity.

4. Research Methods and Data

4.1. Research Method

4.1.1. Carbon Emission Intensity Measurement

The main methods for measuring carbon emissions are the life cycle assessment [31], the material balance approach, the carbon footprint estimation approach [32] and the carbon emission method coefficient. In this paper, eight types of energy consumption are selected from the China Energy Statistics Yearbook: various types of coke, coal, crude oil, diesel, paraffin, fuel oil, gasoline and natural gas, and the carbon dioxide produced by their combustion is included in the emission list. The carbon emissions of 30 provinces in China (excluding Tibet, Hong Kong, Macao and Taiwan Province) from 2011 to 2020 are calculated. According to the standard coal conversion coefficient and carbon emission coefficient (Table 1) published by IPCC, the measurement equation is as follows:
C E i = i = 1 n C E i = i = 1 n E i × N C V i × C E F i
In Equation (1), CEi is the carbon dioxide emissions from fossil energy source i. Ei is the consumption of energy source i. NCVi and CEFi are the average low-level heating value and emission factor of fuel i, respectively. The province’s carbon intensity (CI) is obtained by dividing the total amount of carbon dioxide emissions measured by Equation (1) by GDP expressed at constant prices in 2005.

4.1.2. Measurement of Industrial Structure Distortions

At this stage, research on distortions has mainly focused on firm-level distortions, and some studies have classified them as product market distortions and factor market distortions, but few studies have addressed the industrial structure level.
Drawing on Ando and Nassar [23], this paper uses Euclidean distances to measure the degree of distortion in the industrial structure, starting from the output and employment shares between sectors in disequilibrium, as follows.
D i = L i k L k V A i k V A k ,   D = i d i 2
In Equation (2), di represents the distance between the output share and employment share, and d denotes the Euclidean distance between the added value of economy and employment share. VAi and Li represent value-added and employment in each industrial sector i, respectively.
The model has the following advantages. Firstly, the measurement deviation caused by the development difference of time series among regions can be corrected. Secondly, the model takes into account the importance of different departments. Thirdly, the numerical distribution is reasonable; that is −1 ≤ di ≤ 1, 0 ≤ d N , and the total effect of distortion of the three industrial sectors is equal to 0.

4.1.3. Spatial Correlation Test

The spatial relationship between variables is the foundation of establishing a spatial regression model to test the description of the correlation of variables in different spaces. This paper uses Moran’s I to explore whether there is a spatial correlation between two-way FDI, industrial structure distortion and carbon emissions. The equation is as follows:
Moran s   I = i = 1 n j = 1 n W i j ( Y i Y ¯ ) ( Y j Y ¯ ) S 2 i = 1 n j = 1 n W i j
In Equation (3), I represents Moran’s I index, y i represents the observed value of region i, Y ¯ represents the arithmetic mean of carbon emissions from all provinces, n represents the number of provinces and Wij represents the spatial adjacency matrix. Moran’s, I index takes values within the range [−1, 1], with an I value greater than 0 indicating a positive spatial correlation. The closer the I value to is to 1, the stronger the spatial correlation. The lower the I value is than 0, the more negative the spatial correlation. The closer the I value is to −1, the stronger the spatial difference. When I is equal to 0, it means a random distribution.

4.1.4. Spatial Econometric Model

Two-way FDI and industrial structure distortion are not unique economic phenomena in a region, but their causes may be related in space. When there are economic differences in different regions, especially the differences in labor remuneration, the factors of production will not only flow between different industries within the region but also between different regions. At this time, there may be a spatial relationship between two-way FDI and industrial structure distortion. This paper further constructs a spatial econometric model to capture the spillover effect of two-way FDI and industrial structure distortion on carbon emissions from the two dimensions, space and time series, as follows:
The Spatial AutoRegression (SAR) model only considers the spatial correlation of the explained variables.
ln C I i , t = ρ W ln C I j , i + β i X i + μ i + η i + ε i , t
where lnCI is the logarithm of carbon emission intensity of region i at time t, ρ is the spatial autocorrelation coefficient, W is the spatial weight matrix, Xi is the explanatory variable, μi, ηi are the individual fixed effect and time fixed effect models, respectively, and εi,t is the random interference term.
The spatial autocorrelation model (SAC) considers the spatial correlation between the error term and explained variable.
ln C I i , t = ρ W ln C I j , t + β i X + μ i + η i + v i , t ν i , t = λ W v i , t + ε i , t
where λ represents the spatial autocorrelation coefficient, and the meaning of other variables remains unchanged.
The Spatial Dubin Model (SDM) considers the lag of dependent variables and the spatial effect of different factors on explanatory variables.
ln C I i , t = ρ W ln C I j , t + β i X i + W X i , t γ + μ i + η t + φ i , t
where γ represents the spatial autoregressive coefficient of the independent variable, ρ represents the spatial autoregressive coefficient of dependent variables, and the meaning of other variables remains the same.

4.1.5. Intermediary Effect Model

To further verify Hypothesis 3 and investigate whether the distortion of industrial structure will have an impact on carbon emission intensity through two-way FDI, an intermediary effect test procedure is constructed for the stepwise regression test.
C I i , t = γ 0 + γ 1 C I i , t 1 + γ 2 D i , t + γ 3 X i , t + v i + ε i , t
IFDI i t = α 0 + α 1 IFDI i t 1 + α 2 D i t + α 3 X i t + υ i + v i + ε i t
OFDI i t = b 0 + b 1 OFDI i t 1 + b 2 D i t + b 3 X i t + υ i + v i + ε i t
C I i t = λ 0 + λ 1 C I i t 1 + λ 2 D i t 1 + λ 3 IFDI i t + λ 4 OFDI i t + λ 5 X i t + υ i + v i + ε i t
where Equation (7) represents the overall effect of industrial structure distortion (D) on carbon emission intensity (CI), which is expressed in λ2. Equations (8) and (9) represent the impact of industrial structure distortion on intermediate variables (IFDI) and (OFDI), respectively, to investigate the impact of industrial structure distortion on China’s two-way FDI. In Equation (10), λ2 measures the direct effect of industrial structure distortion on carbon emission intensity. If Equations (8) and (9) are substituted into Equation (10), then the respectively obtained coefficient products λ3α2 and λ4b2 represent the intermediary effect of IFDI and OFDI, respectively; that is, the distortion of the industrial structure will affect the degree of carbon emission intensity by affecting IFDI and OFDI.

4.2. Index Selection and Data Source

4.2.1. Variable Selection

Explained variable. Carbon emission intensity (CI) is calculated by dividing the total amount of carbon emission calculated in Equation (1) by the GDP expressed at a constant price in 2005.
Core explanatory variables. The industrial structure distortion index (D) is expressed as the square root of the deviation square sum of the employment share and output share of each local sector. Two-way FDI is represented by inward foreign direct investment (IFDI) and outward foreign direct investment (OFDI).
Control variables. To reduce the bias of regression results caused by the omission of explanatory variables, this paper refers to existing research results [33] and selects the following as control variables.
Energy structure (ENER). Select the proportion of energy consumption converted into standard coal in the actual GDP to measure.
Environmental regulation (ER). Select the proportion of total investment in environmental pollution control in GDP to measure the impact of environmental regulations on carbon emissions. The impact of environmental regulations on carbon emissions should be two-way. On the one hand, appropriate environmental regulations can promote the upgrading of the corporate production structure, achieve high energy efficiency and high innovation ability, and effectively reduce carbon emissions. On the other hand, the environmental regulations are set too high. In order to reduce pollution emissions, enterprises will increase production costs. With the loss of profits, enterprises choose to expand production, aggravate energy consumption and increase carbon emissions.
Therefore, the expected coefficient of environmental regulation is uncertain, which can be used as a control variable. Economic development level (PGRP). Select GDP per capita as an economic measurement index for the empirical test. On the one hand, the improvement of the economic development level aggravates energy consumption, leading to an increase in carbon emissions. On the other hand, when the “turning point of the Environmental Kuznets Curve” is reached, the enthusiasm of the public to participate in environmental protection and the awareness of environmental protection in economically developed areas are enhanced, which promotes the decoupling of economic development and carbon emission.
Technology input (R&D). Select the actual R&D expenditure of each province as the proportion of GDP. Technological progress can improve the innovation ability of enterprises, promote the upgrading of industrial structure and reduce the inefficient allocation of factors caused by the distortion effect. The technological level can bring out higher energy efficiency, lower carbon emission and economic development.
Urbanization rate (urban). Considering the obvious differences in the area of administrative division and population size among provinces, in order to enhance the comparison among indicators, the proportion of the urban population in the total population is selected to measure the urbanization rate.

4.2.2. Data Sources

To reduce the regression deviation caused by data omission, based on fully considering the availability and operability of data, the author excludes Tibet, Hong Kong, Macao and Taiwan, and combs and cleans the relevant data of 30 provinces (cities and autonomous regions) from 2011 to 2020. The data comes from the website of the National Bureau of Statistics, China Statistical Yearbook, China Science and Technology Statistical Yearbook, China Energy Statistical Yearbook and China Environmental Statistical Yearbook, and the invalid data is identified and eliminated with the application of SPSS 22.0. Logarithmic processing is used to eliminate the effects of heteroscedasticity and multicollinearity on the regression results. To supplement some missing data, trend prediction and interpolation are used. The descriptive statistics of variables are shown in Table 2.

5. Empirical Test and Result Analysis

5.1. Temporal and Spatial Evolution of Carbon Emission Intensity in China

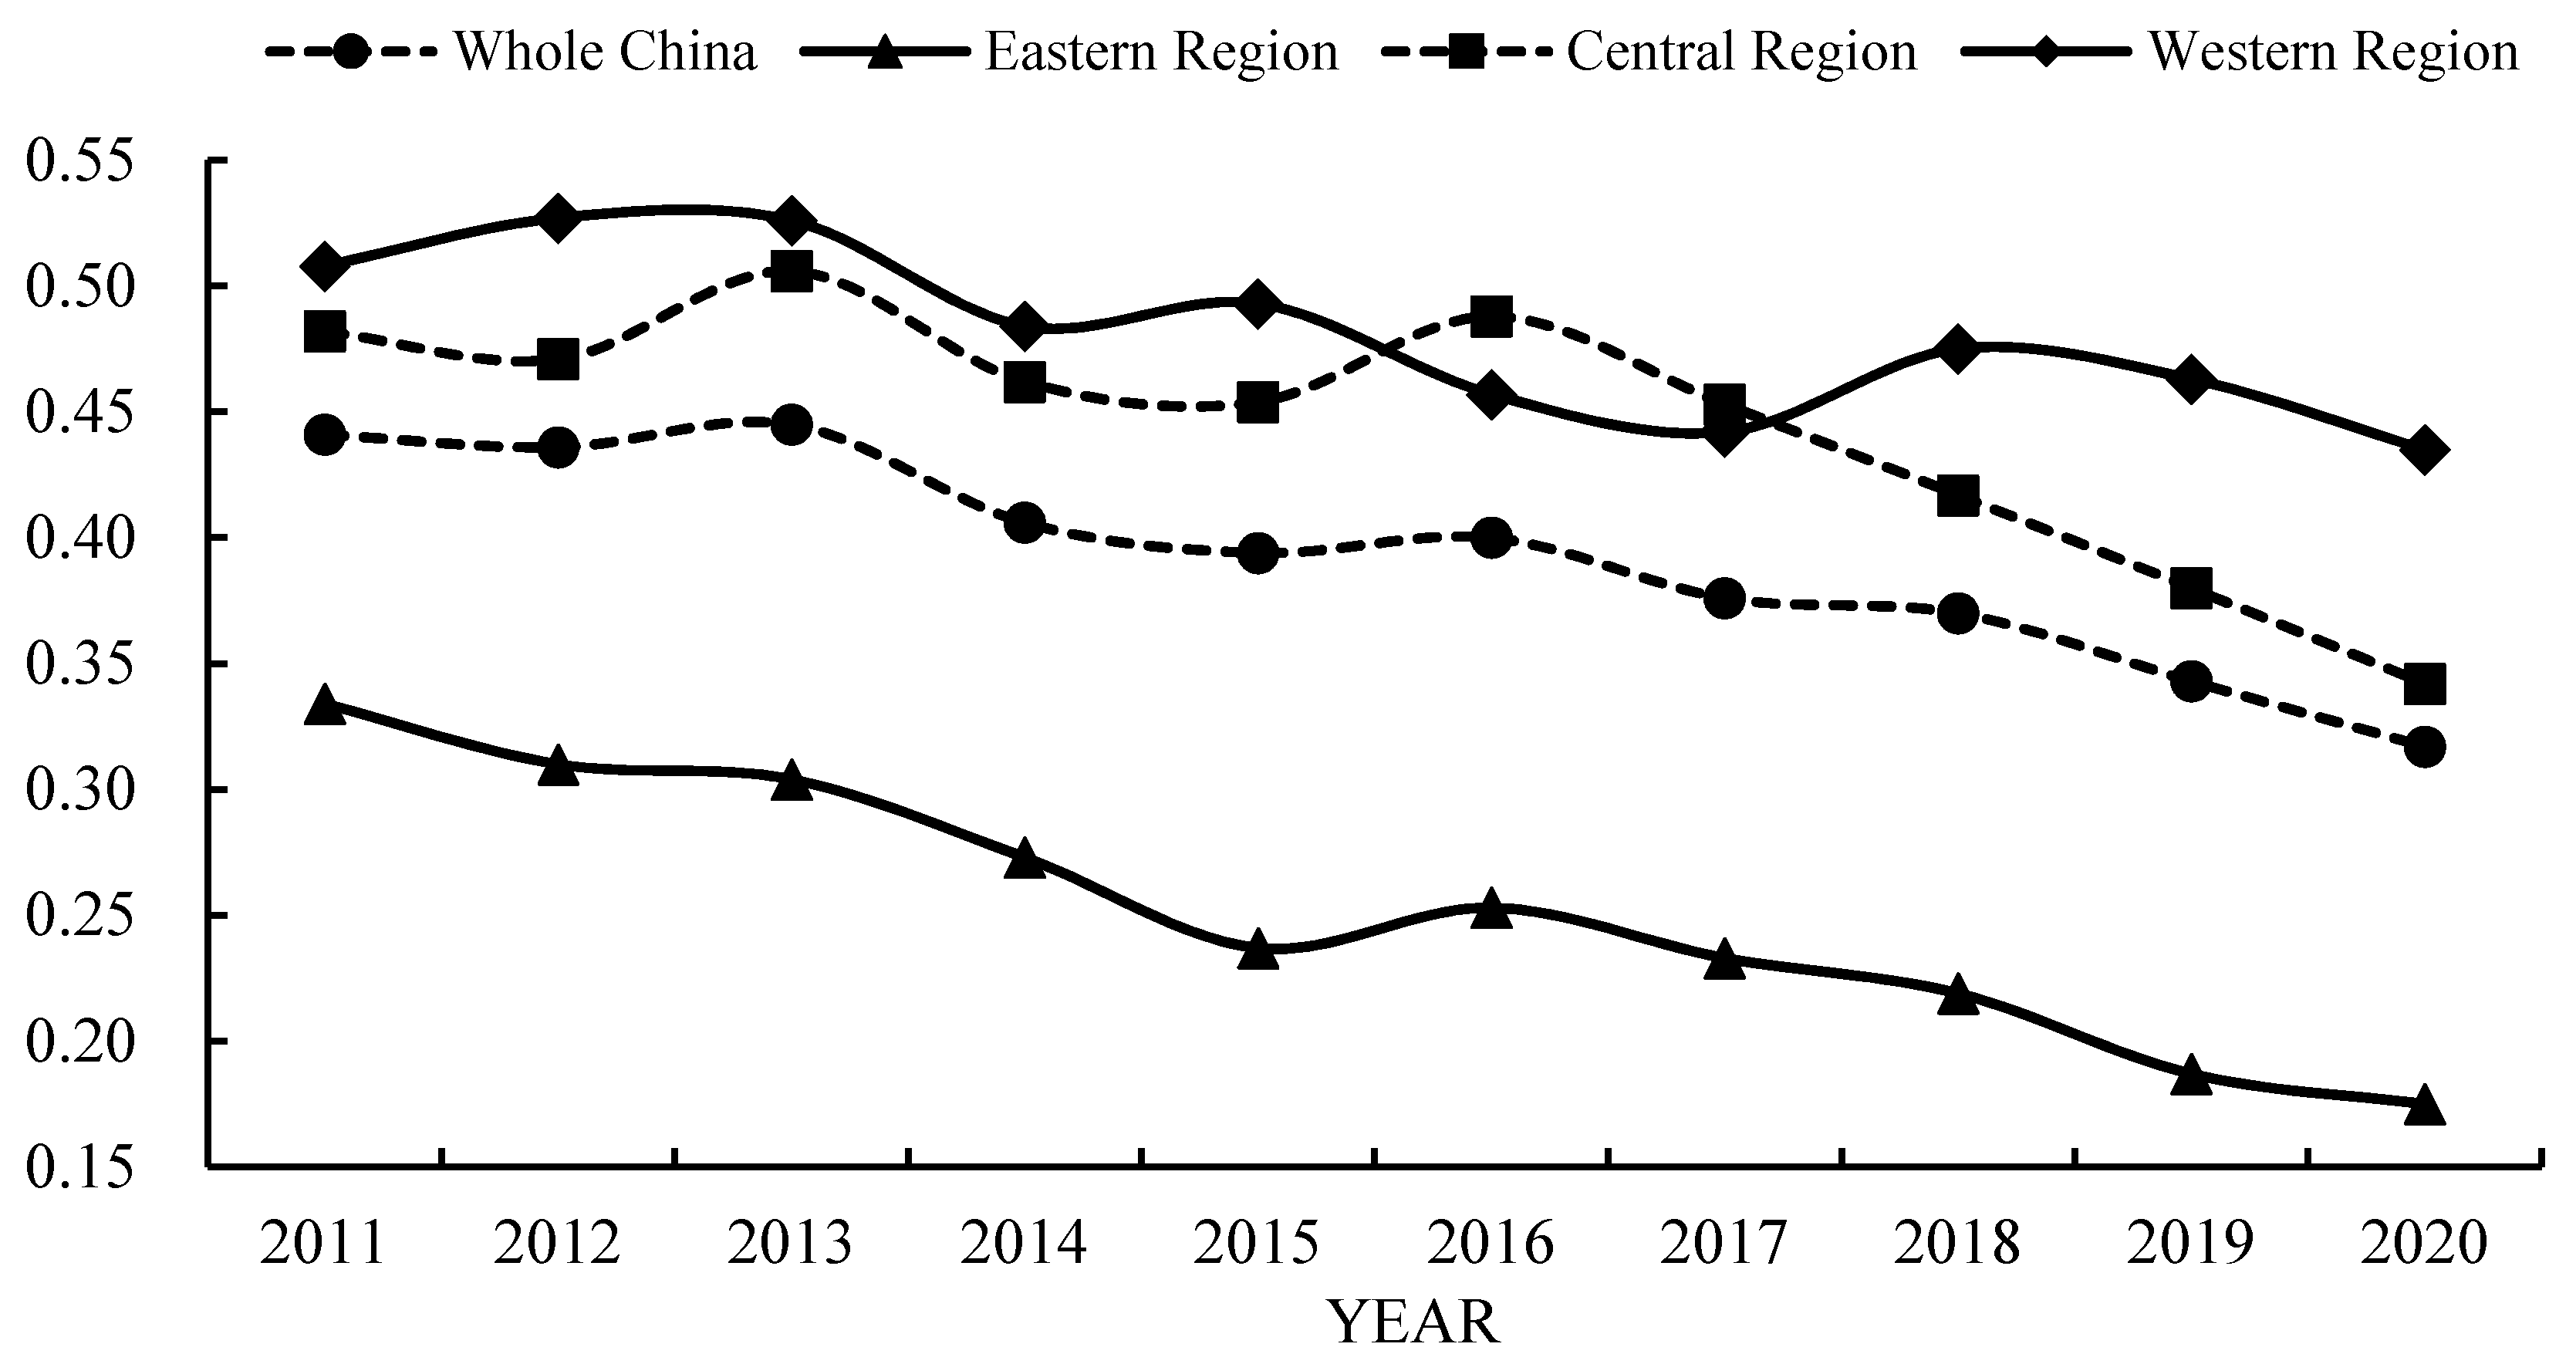
5.1.1. Temporal Characteristics of Carbon Emission Intensity in China

As can be seen from Table 3, on the whole, the national carbon emission intensity has been “decoupled” from economic growth in terms of cycles, basically maintaining an average annual decline of approximately 4.2%. There are significant differences between the groups. The overall change trend of the eastern, central, and western regions of China is consistent with that of the whole country, but their intensity changes show a pattern of “the eastern region leads, the central region catches up and the western region of China lags“. In terms of subregions, the decline rate of carbon emission intensity of provinces and cities from 2011 to 2020 can be divided into five groups (Table 4). Beijing’s carbon intensity decreased by 55.90%, leading the country, followed by Chongqing, which took multiple measures to promote the deep integration of pollution reduction and carbon reduction through innovative ways, such as “carbon sink +” and climate change investment and financing pilot. The proportion of carbon intensity reduction during the study period was 54.39%. The carbon intensity of Tianjin, Sichuan, Guizhou and Yunnan decreased by more than 50%. The carbon intensity of Hebei, Jilin, Fujian, Henan, Hubei, Hunan, Guangdong, Guangxi, Gansu and other provinces decreased by between 35 and 50%; Inner Mongolia, Liaoning, Heilongjiang, Shanghai, Jiangsu, Zhejiang, Anhui, Shandong, Shaanxi, Hainan, Qinghai, and Ningxia, the intensity of carbon emissions decline in these regions is in the range of 25% to 30%. The decline in carbon intensity in Shanxi is in the proportion range of between 5 and 20%. Xinjiang’s carbon emission intensity showed an increasing trend, with an increased ratio of 12.70%.
On the one hand, it benefits from the strong implementation of the national overall acceleration of green and low-carbon development and energy conservation and emission reduction policies, and the formulation of strict and effective total energy consumption control targets. It is also closely related to the continuous strengthening of the sense of responsibility of governments at all levels, a deep understanding of the severe situation of ecological protection, and actively promoting the upgrading of local energy-related industrial structures.

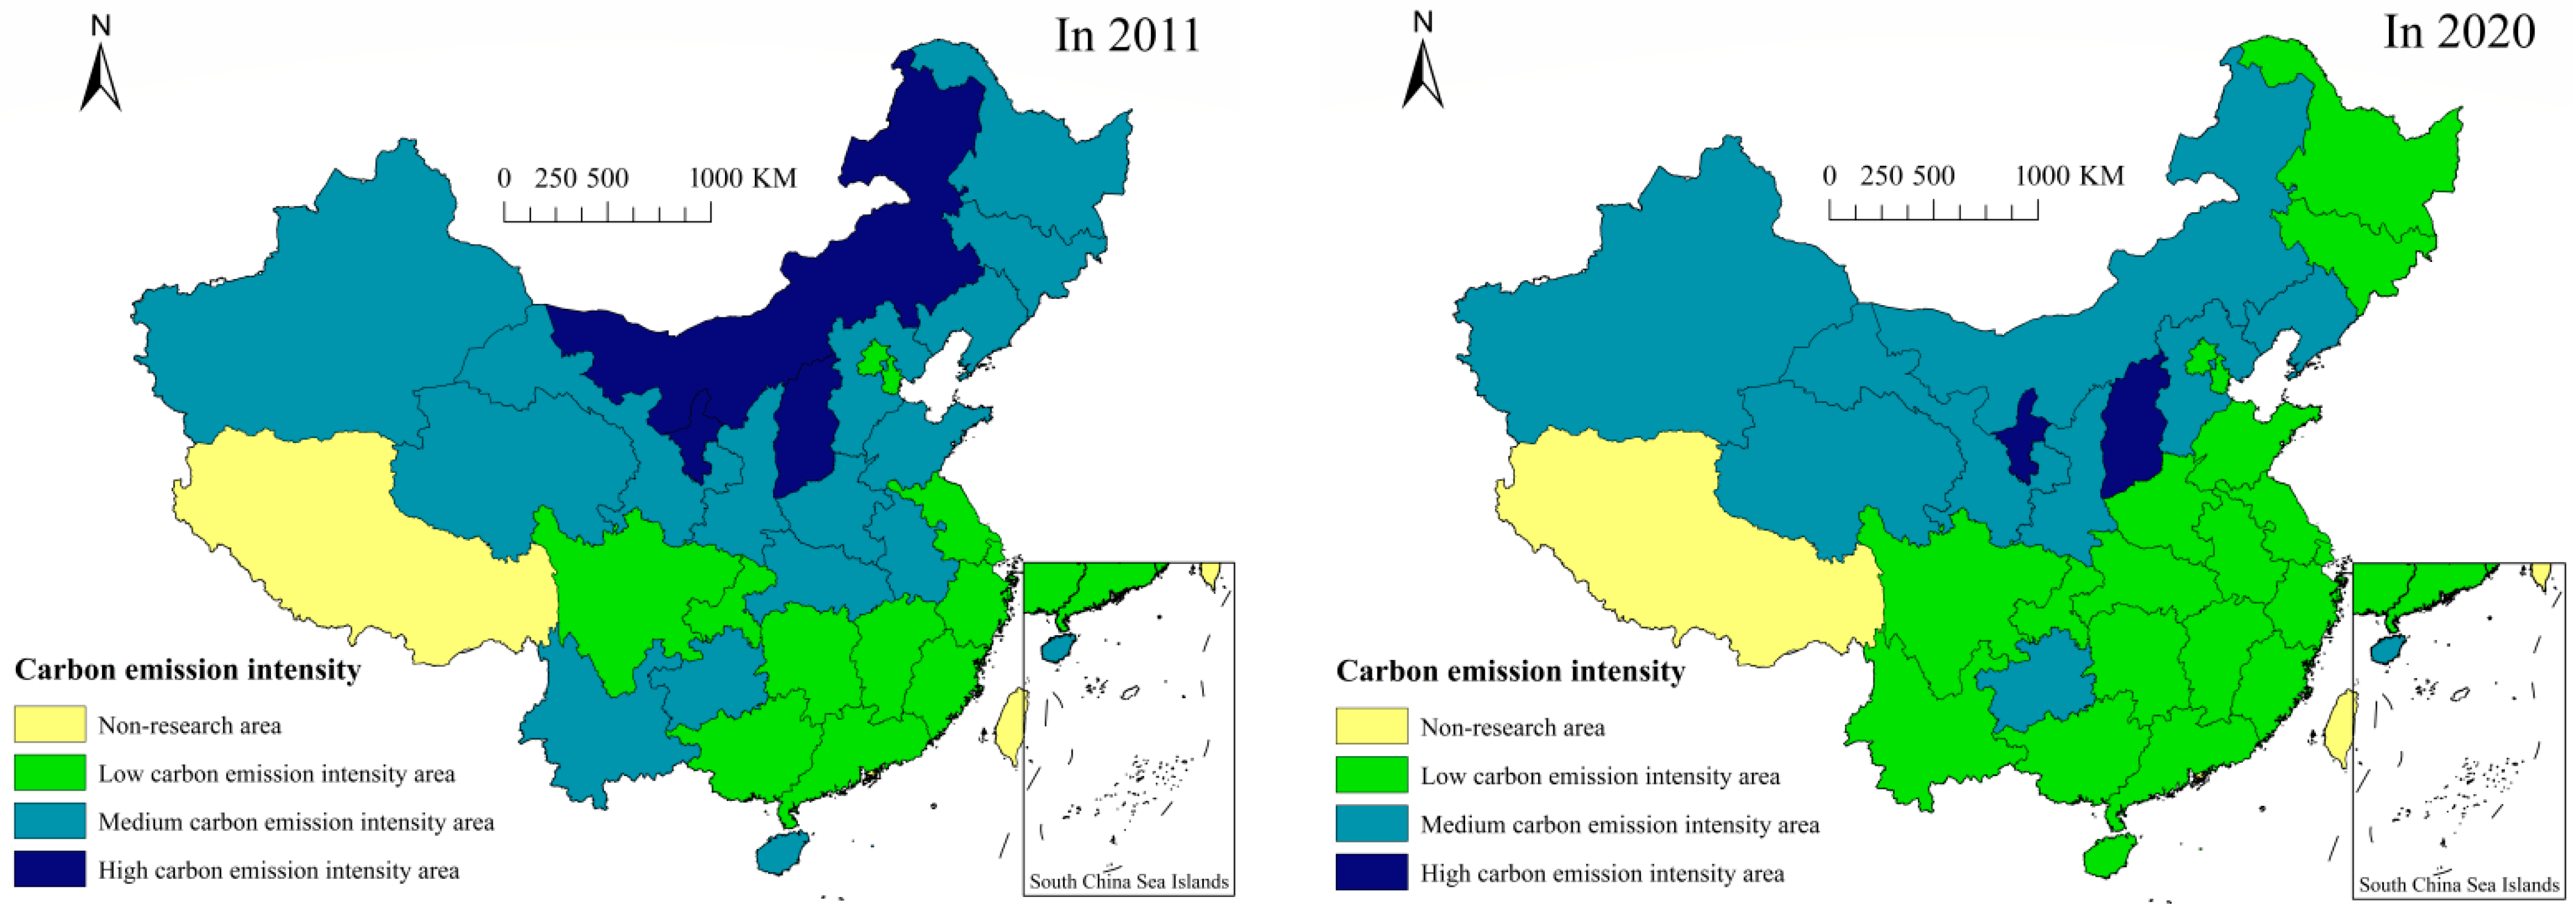
5.1.2. Spatial Characteristics of Carbon Emission Intensity in China

With the support of ArcGIS software, the spatial distribution of China’s carbon emission intensity in 2011 and 2020 was rendered by the natural discontinuity method, so as to investigate the spatial differentiation of China’s carbon emission intensity, as shown in Figure 1.
Overall, from 2011 to 2020, the carbon emission intensity of the whole country decreased significantly, and the low-carbon emission intensity area gradually shifted to the north. The carbon emission intensity of the Yangtze River Economic Belt and North China withdrew from the medium carbon emission intensity area, and the difference between the north and the south gradually increased. From the spatial distribution of “low carbon emission” around the country in 2011, there is a middle “high carbon emission intensity”. High-value areas are mainly distributed in Shanxi, Inner Mongolia and Ningxia, while the median area is concentrated in the north and Anhui, Hubei, Hainan, Guizhou and Yunnan forming a concentrated and continuous “regional block” distribution characteristic, showing that there is a spatial correlation between carbon emission intensity.
With time flows, the regional heterogeneity of China’s carbon emission intensity will become more prominent in 2020, showing a “step-by-step” spatial change of “high in the northwest and low in the southeast”, forming a spatial pattern of carbon emission intensity with Shanxi and Ningxia as high-value areas and a significant decoupling effect of carbon emission in the central region. It is worth noting that low-value areas are widely distributed in most areas in the south of the Yangtze River. The carbon emission intensity of all provinces in the Yangtze River economic belt has decreased significantly, the polarization characteristics are significant and the difference in carbon emission intensity between the north and the south has increased, indicating that the traditional spatial development pattern has been broken.

5.2. Industrial Structure Distortion Index

According to the classification standard of the National Bureau of Statistics, 30 provinces and cities are divided into three regions: east, middle and west. According to Equation (2), the average industrial structure distortion index of each region and the whole country is calculated from 2011 to 2020. See Figure 2 for details. On the whole, the national industrial structure distortion index shows an obvious downward trend, which shows that with the improvement in marketization, the continuous improvement in innovation ability, the rational allocation of production factors among different departments and the vigorous implementation of measures such as de-capacity and de-stocking, the production capacity structure has been continuously optimized and the rationalization of industrial structure has been promoted.
From the perspective of regions, the industrial structure distortion index of the western region is the highest, followed by the central region and the industrial structure distortion index of the eastern region is the lowest during the research period. The reason is that the economic development of the western region still depends on the traditional “three high enterprises”, the industrial foundation is weak and the investment in technology R&D is insufficient, which leaves the emerging industries in the embryonic stage and to fall into a “low-level cycle”, resulting in the disharmony between the existing resource allocation and the desired resource allocation. In order to promote economic growth, the central government intervened in the price formation and distribution of capital, labor and land.
Although the growth target was achieved in the short term, it caused an imbalance in the industrial structure in the long term. At the same time, the distortion of the industrial structure will also lead to the depression of labor price and the rapid growth in labor-intensive industries. The ratio of the output value structure of capital intensive and labor-intensive industries has expanded, which further hinders the optimization of the industrial structure. Due to the developed economy and sound market-oriented pricing mechanism, the eastern region can promote the rational allocation of production factors, high innovation ability, promote the improvement of productivity, accelerate the elimination of backward production capacity, change the traditional economic growth model and improve the acceptable level of industrial structure.

5.3. Spatial Correlation Test Results

The comparison of temporal and spatial distribution can only simply analyze the evolution trend of carbon emission intensity and not describe the internal evolution law. To further explore the correlation characteristics between industrial structure distortion, two-way FDI and carbon emission intensity, Moran’s I index in each province in different years is calculated according to Equation (3). The results are shown in Table 5.
The Moran’s I indices for carbon emission intensity, industrial structure distortion and two-way FDI over the period from 2011–2020 are all positive, with most passing the significance test at the 1% level and a small number passing the significance test at the 5% and 10% levels. There was a significant positive correlation and positive agglomeration in spatial distribution. The spatial effect between variables should be fully considered when constructing the influencing factor model. In addition, Moran’s I value changed in wave shape during the study period, with a large fluctuation range in individual years, which indicated that there was fluctuation agglomeration among different provinces, and the nearest neighbor effect was obvious.

5.4. Spatial Econometric Empirical Test

5.4.1. Model Selection

Considering that the factors affecting carbon emission intensity are complex, the traditional OLS model, spatial autoregressive model, spatial autocorrelation model and spatial multi-objective model are constructed for spatial econometric regression. On the basis of ignoring the spatial correlation, Houseman’s statistical results rejected the original hypothesis of the random effect model at a significant level of 1%. Considering the individual heterogeneity of provinces and cities in the sample, the AC-FE, SAR-FE and SDM-FE models are tested based on the time–space dual fixed effect regression model. In Table 6, LR is significant at the statistical level of 1%, rejecting the original assumption that the coefficients of the spatial lag explanatory variable are equal to 0; that is, the SDM model cannot be simplified to the SAR model. According to the further test of AIC, BIC and log-likelihood values, the SDM model has smaller values and is a better fit than the sac model. Therefore, this paper finally selects the estimation results of the SDM model to illustrate the impact of various factors on carbon emission intensity.

5.4.2. Regression Result Analysis

According to the regression results, Table 7 shows that the regression coefficient of industrial structure distortion is 0.284. Through the significance test of 1%, it shows that the market regulation failure caused by industrial structure distortion and the allocation deviation of production factor led to the output share being much higher than the employment share. Its essence is the substitution of capital for the labor force. This substitution leads to low energy efficiency, and the capital-driven economic growth model lags behind the rate of aggregate energy consumption, resulting in the overall increase in carbon emission intensity, which verifies hypothesis 1. The regression coefficient of China’s foreign direct investment is −0.045, and the 5% significance test supports the “pollution halo” hypothesis theory to a certain extent; that is, IFDI inhibits the increase in carbon emission intensity.
The above shows that the environmental cost is not the only factor that needs to be considered for enterprises transferred through overseas investment. Labor, infrastructure and policy subsidies have been taken into account. At the same time, foreign enterprises promote the progress of environmental protection technology in developing countries through the “demonstration effect” and “spillover effect” and reduces pollution emissions.
The regression coefficient of OFDI is −0.036, and it has passed the significance test of 1%; to a certain extent, it reflects the improvement in the potential of China’s global value chain. On the one hand, “gradient” OFDI can promote the upgrading of China’s industrial structure, digest backward production capacity, help improve resource mismatch, make production factors flow to sectors with higher marginal reporting and promote the realization of carbon emission reduction. On the other hand, “reverse gradient” OFDI can give birth to the reverse spillover effect of technology and indirectly reduce the carbon emissions of home countries, which is consistent with the research conclusions of Hao et al. [34].
The interaction terms of IFDI and OFDI are negative and pass the significance test at the level of 5%, indicating that there is an obvious complementary effect of two-way FDI among China’s provinces, and this effect will effectively promote improvement in the enterprise green technology innovation level and reduce carbon emission intensity, which is consistent with the research conclusions of Feng et al. [35] and others, and hypothesis 2 is verified.
By analyzing the control variables, the regression coefficient of energy structure to carbon emission intensity is 0.134, and through the significance test of 5%, it shows that the energy structure dominated by coal will lead to serious environmental pollution. At the same time, high energy consumption will aggravate the distortion of the industrial structure and increase the intensity of carbon emissions. The regression coefficient of environmental regulation on carbon emission intensity is 1.613, which it is not significant but it supports the “green paradox” hypothesis to a certain extent; that is, the implementation of environmental regulation intensifies carbon emissions. The reason may be that the article selects market incentive regulation tools as the proxy variable. After paying high pollution control investment, enterprises usually choose to expand production to make up for the loss of profits; in addition, the insufficient development of clean energy has restrained the decline in carbon emission intensity. The regression coefficient of the economic development level on carbon emission is −0.645, and through the 5% significance test, combined with the EKC hypothesis, with China’s rapid economic growth and crossing a certain threshold, there will be a dividend period of carbon emission reduction. The regression coefficient of technology input on carbon emission is negative and passes the significance test of 5%, and the carbon emission intensity will be reduced by 0.136% for every 1% increase in technology input, indicating that the progress of low-carbon technology and the development and use of new energy have significantly controlled the increase in carbon emissions from the source of production. The regression coefficient of the urbanization rate carbon emission is −0.136, and through the significance test of 5%, it shows that urbanization forms the agglomeration effect and scale effect by increasing population density and promotes the formation of agglomeration economy, such as infrastructure sharing, service value sharing and knowledge spillover, improves production efficiency, reduces pollution and energy consumption and promotes the reduction in carbon emission intensity.
It can be seen from Table 7 that the spatial lag parameter ρ of the spatial Durbin model is positive. It shows that the local carbon emission intensity will be affected by the neighboring areas. According to LeSage and Pace [36], in the spatial regression model, the direct effect, indirect effect and total effect of explanatory variables can, respectively, reflect the influence degree of each variable on the local area, adjacent areas and the whole country. In this paper, each index is decomposed, as shown in Table 8.
From the perspective of industrial structure distortion, its direct and indirect impact on China’s carbon emission intensity is significantly positive. The distortion of industrial structure not only reduces the local resource allocation efficiency and intensifies the intensity of energy consumption, but also has a significant adverse effect on the reduction in carbon emission intensity in neighboring areas through indirect effects. Specifically, an increase of 1% in the distortion of industrial structure in other regions will increase the local carbon emission intensity by 0.037%.
From the perspective of IFDI, its direct and indirect effects on China’s carbon emission intensity are significantly negative at the level of 10% and 5%, respectively. Under the long-term investment-driven development model, the government attracts foreign investment through policies such as tax reduction and exemption. When it enters, it will promote the spillover effect. Foreign-funded enterprises from developed countries have higher innovation abilities. Domestic enterprises can reduce the fixed and variable costs of technology research and development through the “shared product” of inter-industry technical knowledge, promoting technological progress to reduce carbon emission and consumption intensity.
From the perspective of OFDI, the direct impact of OFDI on local carbon emission intensity is negative and fails to pass the significance test. However, to a certain extent, with the acceleration of China’s economic development and to protect its ecology, Chinese enterprises carry out OFDI. Although inhibiting innovation and development to a certain extent, they also transfer some “three high” industries overseas, alleviate domestic competition and reduce pollution emissions to promote the reduction in carbon emission intensity. The spillover effect of foreign direct investment is positive and has passed the significance test of 5%, which reflects the increase in the intensity of OFDI. The difficulty of technology transfer and innovation development increase, coupled with the limited absorption capacity of domestic reverse technological innovation and the weakening of the innovation drive, show “negative externalities of the environment” are beginning to appear, and the uncoordinated joint prevention and control policies among the governments of adjacent regions, lead to the transfer of carbon emissions nearby, resulting in the increase in carbon emission intensity in surrounding areas.
From the perspective of the interaction between IFDI and OFDI, the direct and indirect impact of the interactive development of China’s two-way FDI on carbon emission intensity is negative, which can significantly reduce carbon emission intensity. On the one hand, the rapid development of IFDI drives economic growth, contributes to the increase in OFDI, promotes the development of reverse technological innovation to a certain extent, and directly promotes the reduction in local carbon emissions. On the other hand, OFDI strongly supports IFDI. In the process of China’s foreign investment, it can not only transfer excess capacity but also promote economic development. With the rise of the enterprise economy, the requirements for the IFDI access threshold will increase. In the long run, this will help to play a positive role in the decline in carbon emission intensity in surrounding areas through the cross-regional flow of technicians and technology spillover.

5.5. Intermediary Effect Test

Based on the perspective of two-way FDI, this paper theoretically analyzes the transmission mechanism of industrial structure distortion on China’s carbon intensity. To test the theoretical hypothesis proposed in this paper and to check whether two-way FDI plays a mediating role, the article chose a mediating effect model for testing, and the results are shown in Table 9.
The results in column (1) show that the estimated coefficient of industrial structural distortion is 0.086, which significantly contributes to the increase in China’s carbon emission intensity, the waste of resources and ecological damage caused by structural distortion and puts serious pressure on pollution control in China. Column (2) shows that the estimated coefficient of industrial structure distortion (D) is 0.142, indicating that industrial structure distortion has contributed to the improvement in China’s IFDI level. Under the double pressure of maintaining growth and promoting employment, local governments are competing to formulate preferential policies on the supply and price of production factors, which aggravates the distortion of industrial structure, and this distortion will significantly reduce the environmental management costs of enterprises. The results in column (3) show that the estimated coefficient of industrial structure distortion is −0.131, which indicates that industrial structure distortion will inhibit the development of OFDI in China. The reason is that industrial structure distortion will help enterprises transform their factor cost advantages into export advantages, promote the growth of export scale and export competitiveness and attract more enterprises to invest abroad. At the same time, the industrial structure distortion will make some enterprises with excess survive, and in order to transfer these backward production capacities, the government will encourage overseas investment, resulting in a significant increase in the level of OFDI.
According to the test procedure of intermediary effect, it is further tested whether two-way FDI has played the role of an intermediary variable. Two-way FDI has joined the regression equation of industrial structure distortion affecting carbon emission intensity in both directions. The results show that the regression coefficients of individual effect and total effect have passed the significance test. Based on verifying the previous test process, it is further proven that two-way FDI is the two channels for industrial structure distortion to affect carbon emission intensity; that is, the transmission mechanism of industrial structure distortion affects carbon emission intensity by affecting the two-way FDI. Model (4) added the intermediary variable of two-way FDI, and the significant relationship between industrial structure distortion and carbon emission intensity has not changed. However, the coefficient in model (4) is smaller than that in model (1), which indicates that the influence of industrial structure distortion on carbon emission intensity has weakened, and two-way FDI plays a partial intermediary role between them, to some extent, “covering up” the negative influence of industrial structure distortion on carbon emission intensity, which verifies hypothesis 3.

5.6. Check Data Stationarity

In order to avoid spurious regression, before analyzing the time series data, the unit root test should be carried out on the data related to China’s industrial structure distortion, two-way FDI and carbon emission intensity. On this basis, it is also necessary to introduce the difference method to stabilize the non-stationary data after the unit root test. Therefore, we chose the Augmented Dickey–Fuller (ADF) method to test China’s industrial structure distortion, two-way FDI and carbon emission intensity, as follows. Before the ADF unit root test, the variables in this paper were logarithmicized.
The results of the ADF unit root test are shown in Table 10. The ADF values of all variables are greater than the critical value at the 10% significance level, so the original hypothesis of the unit root cannot be rejected. Next, the variables were processed by first-order difference, and the results showed that the ADF values of all variables passed the significance test at the 5% level. Therefore, the original hypothesis with unit root was rejected, and all variables met the preconditions for further empirical analysis.

5.7. Robustness Test

5.7.1. Replacement Weight Matrix

Due to the unbalanced industrial development among provinces in China, the carbon emission intensity also shows differences. In order to test the rationality of the spatial spillover effect of various influencing factors on carbon emission intensity under different weight matrices, this paper replaces the 0–1 matrix (W1) in the SDM model with the economic distance matrix (W2) and the geographical distance weight matrix (W3). The regression results are shown in Table 11. The regression coefficient of the spatial lag term is significantly positive in different spatial matrices, except that the regression coefficient of some control variables has small fluctuations, and its mechanism is basically similar to that in the previous part of this paper, which proves that the above conclusions are more robust.

5.7.2. Instrumental Variable Method and GMM Estimation

Considering the possible endogenous problems between industrial structure distortion and carbon emission intensity, and avoiding missing variables and possible reverse causal problems, this paper constructs appropriate instrumental variables for the core explanatory variables. This paper selects the coefficients of capital mismatch as an instrumental variable to identify the net effect of industrial structure distortion on carbon emission intensity.
The instrumental variable of capital mismatch coefficient is selected for the following two reasons. On the one hand, from the perspective of China’s economic development, capital mismatch is one of the reasons for the low efficiency of energy utilization. Capital mismatch increases carbon emission intensity and industrial distortion causes high carbon emission areas, which may also be areas with high capital mismatch. At the same time, the rational allocation of capital is also the main driving force to reduce carbon emissions. Therefore, this paper chooses capital mismatch as instrumental variable, which meets the requirement of instrumental variable correlation. On the other hand, compared with the distortion of industrial structure, it mainly indicates the imbalance of input and output in the industrial sector, while capital mismatch reflects the low efficiency of capital and labor flow in the market. Therefore, after controlling other variables, introducing capital mismatch as an instrumental variable in this paper meets the exclusive requirements.
Table 12 reports the empirical results based on the instrumental variable method. Column (1) shows that capital mismatch is positively correlated with carbon emission intensity, and the F-statistic is 19.65. At the same time, the number of instrumental variables selected is equal to the number of explanatory variables in this paper, which avoids the problems of weak instrumental variables and over-recognition.

6. Conclusions and Discussion

With the deepening of China’s economic system reform and the acceleration of the “going global” process, the impact of industrial structure distortion and two-way FDI on carbon emission intensity has become increasingly prominent. Based on relevant theories, this paper puts two-way FDI, industrial structure distortion and carbon emission intensity into the same research framework. Based on the panel data of China’s 30 provinces from 2011 to 2020, this paper makes a theoretical and empirical test, and deeply discusses the impact of two-way FDI and industrial structure distortion on carbon emission intensity.
The main conclusions are as follows. Firstly, due to the improvement in marketization, rational allocation of production factors and continuous optimization of industrial structure, the industrial structure distortion index of China showed a downward trend from 2011 to 2020. In terms of region, because the central and western regions lag behind the eastern regions in terms of economic development level, innovation ability and rational allocation of labor resources, the industrial structure distortion index in the western region is the highest, followed by the central region and the eastern region is the lowest. Secondly, China’s carbon emission intensity is “decoupled” from economic development, and it is decreasing year by year. However, the intensity decline shows a heterogeneous distribution pattern of “leading in the east, catching up in the middle and lagging behind in the west”. On the provincial scale, except in Xinjiang, the carbon emission intensity of other provinces has declined to various degrees. In terms of spatial distribution, the carbon emission intensity has changed from a distribution pattern of “high in the middle and low around” to a “cascade” pattern of “high in the northwest and low in the southeast”, with obvious polarization characteristics, thus, breaking the traditional spatial distribution pattern. Thirdly, there is a positive spatial correlation between China’s industrial structure distortion, two-way FDI and carbon emission intensity, and there are fluctuations and agglomeration among the provinces. The distortion of the industrial structure leads to the deviation of factor allocation and the failure of market regulation, which not only leads to the increase in local carbon emission intensity, but also leads to the reverse spillover effect, which increases the carbon emission intensity in surrounding areas. IFDI and OFDI provide a powerful driving force for the reduction in carbon emission intensity. IFDI has promoted the reduction in carbon emission intensity in the surrounding areas, while OFDI has increased the carbon emission intensity in surrounding areas. The interaction between IFDI and OFDI can significantly reduce the carbon emission intensity in local and surrounding areas. Fourthly, the overall test of intermediary effect shows that two-way FDI is two channels through which the industrial structure distortion affects the carbon emission intensity. Industrial structure distortion affects the transmission mechanism of carbon emission intensity by affecting two-way FDI.
According to the above research conclusions, this paper puts forward the following policy suggestions. Firstly, it is suggested to continue to promote the optimization of industrial structure and reduce the carbon emission intensity. The government should pay attention to the optimization and adjustment of the industrial structure, issue relevant policy documents to promote economic growth, improve the quality and speed of economic growth rate, eliminate backward production capacity, promote the development of innovative, green and low-carbon industrial clusters and continue to promote the decoupling of economic growth from carbon emissions. To optimize the spatial development model of industrial structures for the central and western regions of China with slightly backward economic development, we should issue relevant policy documents, increase support for emerging industries, increase capital investment, narrow regional development differences, reduce industrial structure distortion and realize ”resonance with the optimization and upgrading of national industrial structure”. Secondly, it is suggested to guide IFDI to develop in the field of high-tech, low-carbon emission reduction, etc. To establish a reasonable performance evaluation system, highlight the unified and coordinated evaluation of economic development and environmental protection, and encourage local governments to pay more attention to quality in the process of attracting investment. To improve environmental protection-related policies, gradually abolish the “super-national treatment” of foreign-funded enterprises, improve the entry threshold of high-carbon industries and reduce the tolerance of foreign-funded enterprises for environmental pollution. Introduce high-quality foreign capital, promote the coordinated development of resources, environment and economy, pay attention to the “benchmarking” of foreign-funded enterprises, give full play to the “pollution halo” effect of IFDI, drive domestic green and low-carbon technology innovation and realize carbon emission reduction. Thirdly, it is suggested to speed up the transformation of the foreign economic development mode and give full play to the effect of reverse innovation. In the process of “going global”, we should pay attention to reverse gradient investment in developed economies, increase investment in technology and research industries and reduce OFDI’s activities to seek markets and resources. Effort should be made to make full use of the advantages of overseas enterprises’ proximity to the source of technical resources, track advanced technology, learn green technology, knowledge and management experience, promote domestic enterprises to carry out environmental innovation, produce green products and reduce domestic carbon emission intensity. Fourthly, it is suggested to pay attention to the rational layout and guidance of two-way FDI and promote the interactive and coordinated development of two-way FDI. The empirical results show that IFDI will significantly affect the carbon emission intensity. At present, IFDI in China is still looking for resources. Therefore, it is necessary to formulate corresponding investment policies, take energy conservation and emission reduction as a reference factor to adjust the investment structure, increase investment in green environmental protection industries and promote China’s green transformation and development. Meanwhile, China’s OFDI should pay attention to investing in other countries’ research and technology industries, make full use of OFDI’s reverse technology spillover effect, reduce the technical effect of domestic carbon emissions and promote the in-depth development of the low-carbon economy.
For a long time, industrial structure change is considered as an important reason to promote economic growth (Zhang et al., 2014) [37]. Rogerson (2008) [38] concluded that under the current global warming environment, the change in industrial structure is also of great significance for controlling the total energy consumption and reducing carbon emissions. Meanwhile, the impact of foreign trade on the domestic environment mainly includes the hypothesis of “pollution heaven hypothesis” and “pollution halo hypothesis” (Kisswani and Zaitouni, 2021) [39]. However, at present, there are relatively few studies on the overall analysis of carbon emission intensity by integrating industrial structure distortion with foreign trade (Yang et al., 2019) [40]. This paper focuses on the spatial correlation among the above three variables and explores the effect of industrial structure distortion and two-way FDI on carbon emissions with the application of the spatial econometric model. In fact, this study found that China’s carbon emissions have significant spatial spillover effects among provinces, which is consistent with the current research on carbon emissions from a spatial perspective (Han and Xie, 2017) [41]. Through the data results, we can find that the distortion of the industrial structure is not conducive to reducing carbon emissions. At the same time, both IFDI and OFDI can be explained by the theory of the “pollution halo hypothesis”, which also confirms the conclusion that the expansion of foreign trade will promote domestic technological progress and achieve carbon emission reduction. Similar to previous studies, upgrading the industrial structure can significantly inhibit carbon emissions (Dong et al., 2020) [42]. However, after adding the variable of industrial structure distortion in this paper, the research data show that industrial structure distortion can also reduce carbon emissions through the intermediary mechanism of two-way FDI, which indicates that the most critical driving factor in the process of carbon emission reduction lies in the technical effect, and its effect exceeds the structure and scale effect (Wang et al., 2019) [43].

Author Contributions

This paper is a collaborative work of all the authors. In formal analysis, J.Y. together with L.Z. and G.D. executed the experimental work. Additional characterization was performed by J.Y. This paper was drafted by L.Z. and further edited by L.Z. and J.Y. All authors contributed to the article revision and have read and approved the submitted version. All authors have read and agreed to the published version of the manuscript.

Funding

This research was funded by The National Social Science Fund of China, grant number 19BJY085.

Institutional Review Board Statement

The authors declare that they have no known competing financial interests or personal relationships that seem to affect the work reported in this article. We declare that we have no human participants, human data or human tissues.

Informed Consent Statement

Not applicable.

Data Availability Statement

The datasets used and/or analyzed during the current study are available from the corresponding author upon reasonable request.

Conflicts of Interest

The authors declare no conflict of interest.

References

  1. He, Y.; Xu, Y.; Pang, Y.; Tian, H.; Wu, R. A regulatory policy to promote renewable energy consumption in China: Review and future evolutionary path. Renew. Energy 2016, 89, 695–705. [Google Scholar] [CrossRef]
  2. Zhou, W.; Zhu, B.; Chen, D.; Griffy-Brown, C.; Ma, Y.; Fei, W. Energy consumption patterns in the process of China’s urbanization. Popul. Environ. 2012, 33, 202–220. [Google Scholar] [CrossRef]
  3. Shi, X.; Zheng, Y.; Lei, Y.; Xue, W.; Yan, G.; Liu, X.; Cai, B.; Tong, D.; Wang, J. Air quality benefits of achieving carbon neutrality in China. Sci. Total Environ. 2021, 795, 148784. [Google Scholar] [CrossRef] [PubMed]
  4. Du, L.; Wei, C.; Cai, S. Economic development and carbon dioxide emissions in China: Provincial panel data analysis. China Econ. Rev. 2012, 23, 371–384. [Google Scholar] [CrossRef]
  5. Hou, F.; Su, H.; Li, Y.; Qian, W.; Xiao, J.; Guo, S. The Impact of Foreign Direct Investment on China’s Carbon Emissions. Sustainability 2021, 13, 11911. [Google Scholar] [CrossRef]
  6. Hao, Y.; Zhu, L.; Ye, M. The dynamic relationship between energy consumption, investment and economic growth in China’s rural area: New evidence based on provincial panel data. Energy 2018, 154, 374–382. [Google Scholar] [CrossRef]
  7. Copeland, B.R.; Taylor, M.S. North-South trade and the environment. Q. J. Econ. 1994, 109, 755–787. [Google Scholar] [CrossRef]
  8. Omri, A.; Nguyen, D.K.; Rault, C. Causal interactions between CO2 emissions, FDI, and economic growth: Evidence from dynamic simultaneous-equation models. Econ. Model. 2014, 42, 382–389. [Google Scholar] [CrossRef] [Green Version]
  9. Millimet, D.L.; Roy, J. Empirical tests of the pollution haven hypothesis when environmental regulation is endogenous. J. Appl. Econ. 2016, 31, 652–677. [Google Scholar] [CrossRef]
  10. Reppelin-Hill, V. Trade and environment: An empirical analysis of the technology effect in the steel industry. J. Environ. Econ. Manag. 1999, 38, 283–301. [Google Scholar] [CrossRef]
  11. Liang, F.H. Does Foreign Direct Investment Harm the Host Country’s Environment? Evidence from China (28 November 2008). Available online: https://papers.ssrn.com/sol3/papers.cfm?abstract_id=1479864 (accessed on 4 June 2022).
  12. Zheng, J.; Sheng, P. The impact of foreign direct investment (FDI) on the environment: Market perspectives and evidence from China. Economies 2017, 5, 8. [Google Scholar] [CrossRef] [Green Version]
  13. Ozawa, T. Foreign direct investment and economic development. Transnatl. Corp. 1992, 1, 27–54. [Google Scholar]
  14. Pan, X.; Li, M.; Wang, M.; Chu, J.; Bo, H. The effects of outward foreign direct investment and reverse technology spillover on China’s carbon productivity. Energy Policy 2020, 145, 111730. [Google Scholar] [CrossRef]
  15. Yao, S.; Wang, P.; Zhang, J.; Ou, J. Dynamic relationship between China’s inward and outward foreign direct investments. China Econ. Rev. 2016, 40, 54–70. [Google Scholar] [CrossRef]
  16. Xin, D.; Zhang, Y. Threshold effect of OFDI on China’s provincial environmental pollution. J. Clean. Prod. 2020, 258, 120608. [Google Scholar] [CrossRef]
  17. Gong, M.Q.; Liu, H.Y. Study on the environmental effects of two-way FDI on China’s industrial sectors. China Popul. Resour. Environ. 2018, 28, 128–138. [Google Scholar]
  18. Sung, B.; Song, W.Y.; Park, S.D. How foreign direct investment affects CO2 emission levels in the Chinese manufacturing industry: Evidence from panel data. Econ. Syst. 2018, 42, 320–331. [Google Scholar] [CrossRef]
  19. Hao, Y.; Guo, Y.; Guo, Y.; Wu, H.; Ren, S. Does outward foreign direct investment (OFDI) affect the home country’s environmental quality? The case of China. Struct. Change Econ. Dyn. 2020, 52, 109–119. [Google Scholar] [CrossRef]
  20. Mert, M.; Caglar, A.E. Testing pollution haven and pollution halo hypotheses for Turkey: A new perspective. Environ. Sci. Pollut. Res. 2020, 27, 32933–32943. [Google Scholar] [CrossRef]
  21. Repkine, A.; Min, D. Foreign-funded enterprises and pollution halo hypothesis: A spatial econometric analysis of thirty Chinese regions. Sustainability 2020, 12, 5048. [Google Scholar] [CrossRef]
  22. Cantwell, J.; Tolentino, P.E.E. Technological Accumulation and Third World Multinationals; University of Reading, Department of Economics: Reading, UK, 1990. [Google Scholar]
  23. Ando, S.; Nassar, K.B. Indexing Structural Distortion: Sectoral Productivity, Structural Change and Growth; International Monetary Fund: Washington, DC, USA, 2017. [Google Scholar]
  24. Lin, B.; Chen, Z. Does factor market distortion inhibit the green total factor productivity in China? J. Clean. Prod. 2018, 197, 25–33. [Google Scholar] [CrossRef]
  25. Bogetoft, P.; Hougaard, J.L. Rational inefficiencies. J. Product. Anal. 2003, 20, 243–271. [Google Scholar] [CrossRef]
  26. Brandt, L.; Tombe, T.; Zhu, X. Factor market distortions across time, space and sectors in China. Rev. Econ. Dyn. 2013, 16, 39–58. [Google Scholar] [CrossRef] [Green Version]
  27. Mahadevan, R.; Sun, Y. Effects of foreign direct investment on carbon emissions: Evidence from China and its Belt and Road countries. J. Environ. Manag. 2020, 276, 111321. [Google Scholar] [CrossRef]
  28. Xiaoyang, J.; Sheng, L. A factor market distortion research based on enterprise innovation efficiency of economic kinetic energy conversion. Sustain. Energy Technol. Assess. 2021, 44, 101021. [Google Scholar] [CrossRef]
  29. Bai, X.; Li, S. Factor price distortion, technological innovation pattern and the biased technological progress of industry in China: An empirical analysis based on mediating effect model. In Energy, Environment and Transitional Green Growth in China; Springer: Singapore, 2018; pp. 247–275. [Google Scholar]
  30. Lin, B.; Du, K. The impact of factor market distortions on energy efficiency. Econ. Res. 2013, 9, 125–136. [Google Scholar]
  31. Hao, J.L.; Cheng, B.; Lu, W.; Xu, J.; Wang, J.; Bu, W.; Guo, Z. Carbon emission reduction in prefabrication construction during materialization stage: A BIM-based life-cycle assessment approach. Sci. Total Environ. 2020, 723, 137870. [Google Scholar] [CrossRef]
  32. Pandey, D.; Agrawal, M.; Pandey, J.S. Carbon footprint: Current methods of estimation. Environ. Monit. Assess. 2011, 178, 135–160. [Google Scholar] [CrossRef]
  33. Yin, J.; Zheng, M.; Chen, J. The effects of environmental regulation and technical progress on CO2 Kuznets curve: An evidence from China. Energy Policy 2015, 77, 97–108. [Google Scholar] [CrossRef]
  34. Hao, Y.; Ba, N.; Ren, S.; Wu, H. How does international technology spillover affect China’s carbon emissions? A new perspective through intellectual property protection. Sustain. Prod. Consum. 2021, 25, 577–590. [Google Scholar] [CrossRef]
  35. Feng, Z.; Zeng, B.; Ming, Q. Environmental regulation, two-way foreign direct investment, and green innovation efficiency in China’s manufacturing industry. Int. J. Environ. Res. Public Health 2018, 15, 2292. [Google Scholar] [CrossRef] [PubMed] [Green Version]
  36. LeSage, J.; Pace, R.K. Introduction to Spatial Econometrics; Chapman and Hall: London, UK; CRC: Boca Raton, FL, USA, 2009. [Google Scholar]
  37. Zhang, Y.J.; Liu, Z.; Zhang, H.; Tan, T.D. The impact of economic growth, industrial structure and urbanization on carbon emission intensity in China. Nat. Hazards 2014, 73, 579–595. [Google Scholar] [CrossRef]
  38. Rogerson, R. Structural Transformation and the Deterioration of European Labor Market Outcomes. J. Polit. Econ. 2008, 116, 235–259. [Google Scholar] [CrossRef] [Green Version]
  39. Kisswani, K.M.; Zaitouni, M. Does FDI affect environmental degradation? Examining pollution haven and pollution halo hypotheses using ARDL modelling. J. Asia Pac. Econ. 2021, 1–27. [Google Scholar] [CrossRef]
  40. Yang, Y.; Zhou, Y.; Poon, J.; He, Z. China’s carbon dioxide emission and driving factors: A spatial analysis. J. Clean. Prod. 2019, 211, 640–651. [Google Scholar] [CrossRef]
  41. Han, F.; Xie, R. Does the agglomeration of producer services reduce carbon emissions. J. Quant. Tech. Econ. 2017, 3, 40. [Google Scholar]
  42. Dong, B.; Ma, X.; Zhang, Z.; Zhang, H.; Chen, R.; Song, Y.; Shen, M.; Xiang, R. Carbon emissions, the industrial structure and economic growth: Evidence from heterogeneous industries in China. Environ. Pollut. 2020, 262, 114322. [Google Scholar] [CrossRef]
  43. Wang, Y.; Liao, M.; Wang, Y.; Malik, A.; Xu, L. Carbon emission effects of the coordinated development of two-way foreign direct investment in China. Sustainability 2019, 11, 2428. [Google Scholar] [CrossRef] [Green Version]
Figure 1. Spatial distribution of China’s carbon emission intensity in 2011 and 2020.
Sustainability 14 08988 g001
Figure 2. China’s industrial structure distortion index from 2011 to 2020.
Sustainability 14 08988 g002
Table 1. The average low calorific value of energy and carbon dioxide emission coefficient.
CokeCoalCrude OilDiesel OilKeroseneFuel OilGasolineGas
NCV283,43520,90841,81643,07043,07041,81643,07038,931
CEF107,00095,33373,30074,10071,50077,40070,00056,100
Table 2. Descriptive statistics of variables.
VariableObservationsMean ValueStandard DeviationMinimum ValueMaximum
CI3000.9710.7070.1513.922
D3000.3360.1390.0330.670
IFDI30021,453.435142.867.61922,438.3
OFDI3007164.4318,631.250.06815,431.44
ENER30069.42728.5234.917155.761
ER30034.6347.43624.57652.765
PGRP3001.3760.8340.4124.697
R&D30015.1349.4271.56478.477
URBAN3000.0560.0690.0020.412
Table 3. Carbon emission intensity values of China’s provinces from 2011 to 2020.
Region2011201220132014201520162017201820192020
Beijing0.3220.2810.2530.2080.1930.1680.1640.1620.1580.142
Tianjin0.6080.5340.4790.4230.3820.3290.3110.3140.3090.302
Hebei1.3521.2581.1491.0370.9530.8940.8240.8230.8180.816
Shanxi2.5542.5132.3582.3142.2240.2192.2482.2432.2472.246
Inner Mongolia2.1532.0431.7951.7161.5831.4961.5061.4881.4761.473
Liaoning1.1831.1220.9840.9370.8940.9130.8960.8920.8870.882
Jilin0.9870.8860.7690.7250.6510.6260.5840.5570.5610.553
Heilongjiang0.9630.9110.8230.7840.7670.7550.7380.6910.6880.652
Shanghai0.4370.4260.4140.3860.3720.3540.3390.3270.3170.309
Jiangsu0.5240.5190.5030.4950.4610.4540.3870.3640.3510.346
Zhejiang0.5170.4620.4220.3940.3820.3670.3780.3560.3520.341
Anhui0.8440.7860.7630.7310.7220.6680.6090.5830.5870.552
Fujian0.5340.4710.4090.4260.3680.3370.3170.3130.3090.313
Jiangxi0.6460.5920.5620.5240.5140.4760.4330.4180.4260.408
Shandong0.8710.8340.7490.7120.6980.7050.6610.6420.6390.635
Henan0.8710.7520.6860.6370.5740.5340.4710.4820.4590.462
Hubei0.8220.8310.7860.5840.5090.4580.4340.4460.4270.421
Hunan0.6620.5940.5830.5540.5010.4610.4280.3860.3770.359
Guangdong0.4210.3760.3540.3350.3170.2960.2810.2760.2810.264
Guangxi0.7260.6870.6310.5850.5270.4860.4720.4660.4710.453
Hainan0.9490.9270.7590.7650.7430.7220.6670.6430.6380.622
Chongqing0.6490.5510.4330.4080.3780.3410.3220.3040.2960.286
Sichuan0.6350.5570.5430.5070.4590.3810.3460.3210.3090.297
Guizhou1.8661.7421.7231.3841.2471.2241.0681.1040.9830.922
Yunnan1.0970.9760.8110.7180.6240.5830.5570.5430.5460.529
Shaanxi1.2231.2431.1831.1331.0431.0030.9430.9510.9370.926
Gansu1.5371.4021.3161.2181.1130.9840.9670.9440.9500.935
Qinghai1.2131.2931.2831.0930.9231.0030.8930.9010.8870.874
Ningxia3.9473.7973.6773.4673.3273.0473.4973.3122.9762.972
Xinjiang1.8981.9582.0182.0381.8871.8952.0122.1132.0272.139
Table 4. The reduction ratio of carbon emission intensity of China’s provinces from 2011 to 2020.
Order NumberProportionProvince
1>50Beijing (55.90%), Tianjin (50.33%), Chongqing (54.39%), Sichuan (53.22%), Guizhou (50.59%), Yunnan (51.78%)
2(35%, 50%]Hebei (39.64%), Jilin (43.97%), Fujian (41.38%), Henan (46.96%), Hubei (48.78%), Hunan (45.77%), Guangdong (37.29%), Guangxi (37.60%), Gansu (39.17%)
3(20%, 35%]Inner Mongolia (31.58%), Liaoning (25.44%), Heilongjiang (32.29%), Shanghai (29.23%), Jiangsu (33.97%), Zhejiang (34.04%), Anhui (34.60%), Shandong (27.09%), Shaanxi (24.28%), Hainan (34.46%), Qinghai (27.94%), Ningxia (24.70%)
4(5%, 20%]Shanxi (12.06%)
5≤5%Xinjiang (−12.70%)
Table 5. Global Moran’s I calculation results from 2011 to 2020.
YearCIDIFDIOFDI
Moran’s Ip-ValueMoran’s Ip-ValueMoran’s Ip-ValueMoran’s Ip-Value
20110.338 ***0.0000.454 **0.0140.337 **0.0280.217 ***0.000
20120.308 ***0.0000.477 **0.0120.308 **0.0440.155 ***0.003
20130.319 ***0.0000.529 ***0.0000.341 **0.0010.049 **0.016
20140.308 ***0.0000.531 ***0.0000.352 ***0.0000.106 *0.059
20150.297 ***0.0000.510 ***0.0010.375 ***0.0000.066 *0.089
20160.273 ***0.0010.516 ***0.0000.324 **0.0380.183 ***0.001
20170.281 ***0.0000.456 **0.0140.331 **0.0310.202 ***0.000
20180.263 ***0.0020.416 **0.0210.409 ***0.0000.177 ***0.002
20190.266 ***0.0020.490 ***0.0060.305 **0.0460.241 ***0.000
20200.235 ***0.0040.458 ***0.0090.367 ***0.0000.148 ***0.004
Notes: *, ** and *** denote statistical significance at the 10%, 5% and 1% levels, respectively.
Table 6. Model selection test.
Model SelectionNull HypothesisLR Testp Value
SDM-FE vs. SAR-FEThe coefficients of all spatial lag explanatory variables are 0X2 = 9.20.009 ***
SAC-FE vs. SDM-FEobservationsValue of log-likelihoodDegree of freedomAICBIC
SAC-FE300488.9512−953.88−904.57
SDM-FE300484.9410−947.89−907.72
Note: *** denotes statistical significance at 1% levels.
Table 7. Spatial econometric regression results.
Influence FactorOLSSARSACSDM
Model(1)(2)(3)(4)
lnD0.810 ***0.189 ***0.205 ***0.284 ***
lnIFDI−1.691 ***−0.027 **−0.028 **−0.045 **
lnOFDI1.212 **0.027 ***0.026 ***−0.036 ***
lnENER−5.191 *0.148 **0.144 **0.134 **
lnER−0.129 *0.314 *1.217 *1.613
lnPGRP−0.097 ***−0.501 **−0.586 **−0.645 **
lnR&D−1.506 **−0.134 **0.125 **−0.136 **
lnURBAN0.023 ***−0.354 ***−0.485 ***−0.442 ***
lnIFDI × lnOFDI−0.561 **−0.364 **−0.257 *−0.154 **
lnD·W---0.045
lnIFDI·W---−0.036 **
lnOFDI·W---0.047
Spatialρ-0.159 ***0.155 *0.165 ***
Log-likelihood-483.7741484.3731488.3451
R2 0.4310.3540.591
Individual effectcontrolcontrolcontrolcontrol
time effectcontrolcontrolcontrolcontrol
observations300300300300
Note: *, ** and *** represent significance at the levels of 0.1, 0.05 and 0.01, respectively.
Table 8. Decomposition of spatial Doberman effect.
Influence FactorDirect EffectIndirect EffectTotal Effect
lnD0.053 *0.037 **0.090 **
lnIFDI−0.030 *−0.015 **−0.045
lnOFDI−0.0270.016 **−0.009 *
lnENER0.114 ***0.041 ***0.155 **
lnER−0.026 *0.035 *0.009 *
lnPGRP−0.553−0.350 *−0.903
lnR&D−0.121 *−0.091 **−0.212 *
lnURBAN0.394 ***−0.273 **0.121 **
lnIFDI × lnOFDI−0.134 **−0.125−0.259 *
Note: *, ** and *** represent significance at the levels of 0.1, 0.05 and 0.01, respectively.
Table 9. Test results of mediating effect.
CIIFDIOFDICI
(1)(2)(3)(4)
D0.086 ***0.142 **−0.131 ***0.214 ***0.236 **0.219 ***
IFDI −0.087 *** 0.206 ***
OFDI 0.194 ***0.198 ***
Constant term−0.614 ***−0.514 ***0.376 **0.434 ***−0.529 ***0.716 ***
control variableYesYesYesYesYesYes
time effectYesYesYesYesYesYes
Individual effectYesYesYesYesYesYes
R20.26800.27550.13720.20310.18350.2239
N300300300300300300
Note: ** and *** represent significance at the levels of 0.05 and 0.01, respectively.
Table 10. Augmented Dickey–Fuller (ADF) unit root test results.
VariablesLevel Test ResultsFirst Order Difference Test Results
ADF Valuep ValueADF Valuep Value
lnCI−0.63480.319−4.42820.000
lnD−0.37610.218−3.65540.002
lnIFDI−2.42180.943−3.48470.005
lnOFDI−1.53780.437−5.54970.013
lnENER−0.81370.349−4.34820.000
lnER−0.54840.417−7.92590.006
lnPGRP−1.77860.664−6.13870.024
lnR&D−0.93720.573−4.37610.011
lnURBAN−2.63470.617−5.74610.007
Table 11. Regression results of spatial Dubin model under different spatial weight matrices.
Influence FactorW1W2W3
lnD0.284 ***0.293 ***0.274 ***
lnIFDI−0.045 **−0.037 **−0.048 **
lnOFDI−0.036 ***−0.042 ***−0.027 ***
lnENER0.134 **0.168 *0.211 **
lnER1.6130.834 *1.436
lnPGRP−0.645 **−0.613 **0.265 *
lnR&D−0.136 **0.301 *−0.242 **
lnURBAN−0.442 ***−0.409 ***0.139
lnIFDI × lnOFDI−0.154 **0.064−0.238 *
lnD·W0.0450.0370.051
lnIFDI·W−0.036 **−0.031 *−0.049 *
lnOFDI·W0.0470.0560.028
Spatialρ0.165 ***0.159 ***0.155 *
Log-likelihood488.3451491.5738486.3147
R20.5910.6170.606
Individual effectcontrolcontrolcontrol
time effectcontrolcontrolcontrol
observations300300300
Notes: *, ** and *** denote statistical significance at the 10%, 5% and 1% levels, respectively.
Table 12. Instrumental variable method and GMM estimation results.
VariablesDCICICICI
2SLS First Stage2SLS Second StageLIMI EstimationOptimal GMM Iterative GMM
D 0.634 **0.827 **0.610 *0.767 **
Iv0.416 **
F19.65021.28037.97043.17040.380
Control variableYes
Fixed effectYes
Notes: * and ** denote statistical significance at the 10% and 5%, respectively.
Publisher’s Note: MDPI stays neutral with regard to jurisdictional claims in published maps and institutional affiliations.

