Article

Changes in and Patterns of the Tradeoffs and Synergies of Production-Living-Ecological Space: A Case Study of Longli County, Guizhou Province, China

1
College of Public Administration, Guizhou University, Guiyang 550025, China
2
Department of Urban Planning, School of Urban Design, Wuhan University, Wuhan 430072, China
3
Engineering Research Center of Human Settlements and Environment of Hubei Province, Wuhan 430072, China
*
Authors to whom correspondence should be addressed.
Sustainability 2022, 14(14), 8910; https://doi.org/10.3390/su14148910
Submission received: 25 May 2022 / Revised: 1 July 2022 / Accepted: 19 July 2022 / Published: 20 July 2022
(This article belongs to the Special Issue The Emerging Data–Driven Smart City of Sustainability)

Abstract

:
Production-living-ecological space (PLES) constitutes territorial space, and how to scientifically optimize PLES has become the core issue of territorial spatial planning in China. This paper constructs a spatial classification system for PLES based on merge classification. Taking Longli County, Guizhou Province, China, as an example, this paper studies the spatial patterns in 2015 and 2019, the driving factors of the changes in the spatial patterns, and the interrelationships of production space (PS), living space (LS) and ecological space (ES) and proposes a new scheme for dominant functional zoning. The results show that: (1) The high-scoring areas of PS and LS in Longli County are mainly located near the center of each town, with obvious consistency in the spatial distribution. The high-scoring areas of ES are located in the suburbs far from the towns, conflicting with PS and LS; (2) In the five-year period, PS and LS in Longli County continuously expanded. Specifically, LS expanded the most from the perspective of the rate of change, and ES shrunk continuously; (3) Socioeconomic factors are the dominant factor affecting the changes in PLES, among which the distance to town has the greatest influence; (4) Based on the correlation coefficient, PS and LS have a significant positive correlation, but they have a significant negative correlation with ES. In terms of spatial relationships, PS and LS mainly have synergistic relationships, but their relationships with ES mainly involve tradeoffs; (5) In the spatial functional areas of PLES in Longli County, the single dominant functional area is the main area, among which the ecological-dominant functional area is the largest. The results of this study provide a reference for territorial spatial planning and sustainable regional development.

1. Introduction

Territorial space is a multifunctional complex composed of production space (PS), living space (LS) and ecological space (ES), and it is the carrier of the existence and development of human society [1,2]. Over the past few decades, rapid urbanization and industrialization have profoundly changed the global land-use model and structure [3], leading to a series of economic, social, resource, and environmental problems [4,5] and severe challenges to sustainable development [6,7]. To address the increasingly serious problem of spatial contradictions, China’s territorial spatial development has shifted from focusing only on a single production function to the multifunctional coordinated development of production function, living function and ecological function [8,9]. A report to the 18th National Congress of the Communist Party of China proposed that the concept that “space for production is used intensively, living space is livable and proper in size, and ecological space is unspoiled as well as beautiful” should serve as the guiding ideology of China’s territorial spatial planning [10,11]. In this regard, how to scientifically optimize PLES and promote sustainable regional socioeconomic development has become the core issue of territorial spatial planning in China [12,13].
The research of territorial space stems from the production space (PS), and it focuses on the ability of the land to produce grain [14] and ecological characteristics in the early days [15]. With the further development of research, research on spatial multifunctionality has gradually expanded to social, economic, and ecological environment fields [16], and most scholars believe that the purpose of research for territorial space is to optimize spatial land to coordinate social, economic, and ecological systems [17]. Therefore, sustainable land use has become an important issue. In terms of territorial spatial planning, production-living-ecological space (PLES) constitutes the territorial space in China. Research on PLES mainly focuses on the classification system, the spatial pattern, driving factors, and spatial optimization. In terms of classification, existing research can be divided into two categories: quantitative measurement methods and merge classification methods. The former mainly identifies PLES quantitatively by constructing a functional measurement system [18,19]. The latter mainly involve ways of performing qualitative classification based on land-use data or remote sensing image data [20,21], and they have gradually become the mainstream classification methods due to their simple operation [22]. Research on spatial patterns and driving factors is undoubtedly based on the classification of PLES, and both appear simultaneously in many studies [23,24]. Spatial pattern optimization [25,26], which is often the ultimate goal of PLES research, is an effective management tool for coordinating the multiple sustainable development goals of the social system and the land-use system [27,28]. It has become the focus of most scholars’ research and provides many references [29,30].
Although existing research on PLES provides a solid foundation for subsequent scholars, traditional research ignores the multifunctionality of land use. In fact, the same piece of land may contain production, living and ecological functions [31], and spatial scarcity and functional spillover effects cause complex interrelationships among them [32,33]. These interrelationships are usually manifested in the form of tradeoffs and synergies [34]. A tradeoff means that an increase in one land-use function will lead to a decrease in another, while synergy is a trend of two functions increasing or decreasing simultaneously [35]. At present, the tradeoff–synergy model is used to study the interrelationships between multiple ecosystem services [36], and great progress has been made in this domain [37,38]. In the domain of land science, an increasing number of scholars are realizing that revealing the interaction between land uses holds great significance for the optimization and management of regional space [39,40]. In this regard, the tradeoff–synergy model has been introduced into PLES research. Notably, in the past, the units of research and zoning were mostly at the macro scale, such as provinces, regions, and cities, and research on countries or at even smaller scales was lacking [41,42], which means that the differences within space were ignored. Thus, from the perspective of tradeoffs and synergies, this paper presents a series of studies from the perspective of the grid scale.
As a representative province of Southwest China, Guizhou Province is the only province in China without plains. Relying on the “Development of Western China” strategy, its economy and society have developed rapidly in the past ten years. Longli County is a typical county in central Guizhou, and its development exemplifies Guizhou. Urbanization and industrialization have led to rapid changes in its PLES. Therefore, there is an urgent need to understand the spatial pattern of, changes in, and interrelationships of PLES in Longli County to provide guidance for territorial spatial planning in the region and a reference for research in other regions. The specific objectives of the study are as follows: (1) to determine the spatiotemporal pattern of PLES in Longli County from 2015 to 2019 based on the functional classification system; (2) to detect the driving factors of changes in PLES in Longli County over the five-year period; (3) to identify the spatial tradeoffs and synergistic relationships of PLES in Longli County; and (4) to divide the dominant functional areas based on the tradeoff and synergistic results and propose strategies to promote sustainable regional socioeconomic development (Figure 1).
To realize these objectives, the following work was performed. First, the study area, data sources and methods were determined in Section 2. The study area was Longli County, Guizhou Province, Southwest China. The data included land use data, a digital elevation model (DEM), road data and population density data. A PLES classification system and quantitative method, the geographical detector model and the bivariate local Moran’s I were used in this study. Then, in Section 3, the spatial pattern of PLES in Longli County in 2015 and 2019 were simulated and the driving factors of changes in PLES were explored. In addition, the relationships of tradeoffs and synergies among PS, LS and ES also were measured and the spatial functional areas in Longli County were obtained. In Section 4, the results of Section 3 were analyzed, and the relationship between socioeconomic development and changes in PLES and the zoning management significance and optimization measures were discussed. Finally, a summary of this paper was presented.

2. Materials and Methods

2.1. Study Area

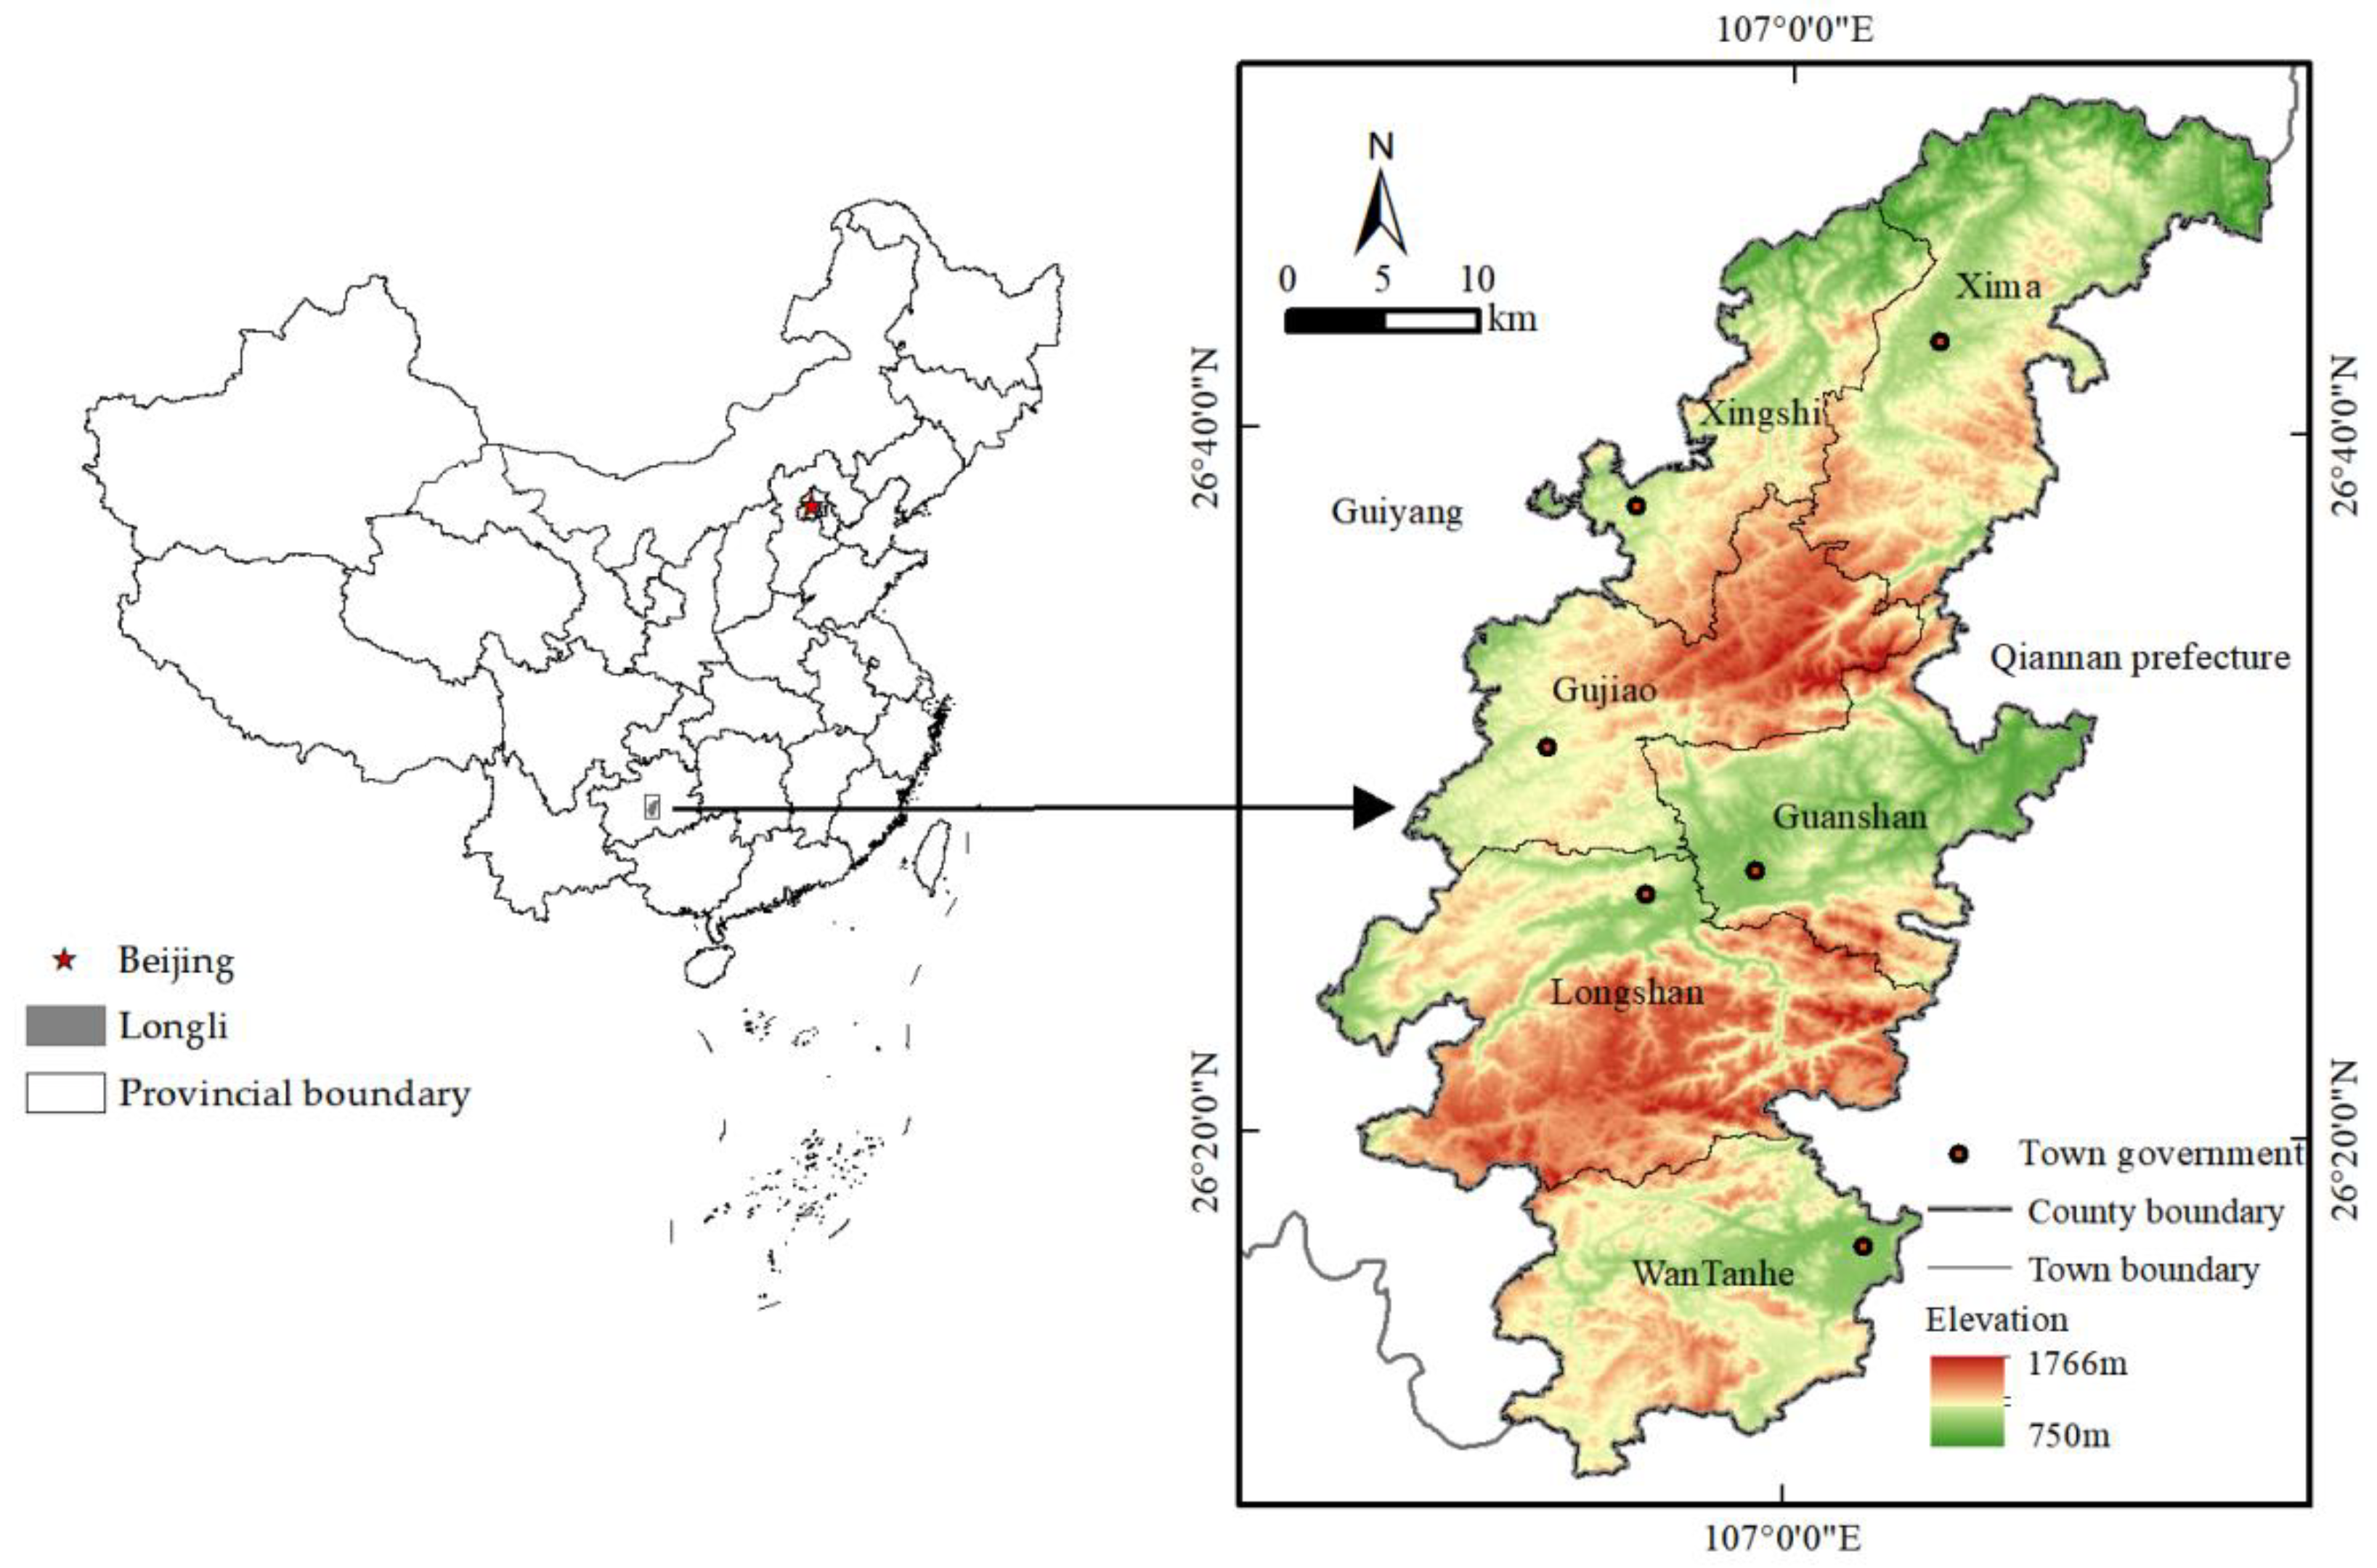
Longli County is part of the Qiannan Buyi and Miao Autonomous Prefecture in Guizhou Province, China. It is located in the middle of Guizhou Province (106°45′18″–107°15′1″ E and 26°10′19″–26°49′33″ N). Longli County is a typical karst landform with complex and diverse landforms, including mountains, hills, basins and river valleys. In general, the terrain is high in the southwest and low in the northeast, with an altitude difference of more than 1000 m (Figure 2). The climate of Longli County is characterized by a subtropical monsoon humid climate, with an average annual precipitation of 1100 mm and an average temperature of 14.8 °C; there is no severe cold in the winter or severe heat in the summer. At present, Longli County has jurisdiction over 5 towns and one street office, and it has a total area of 1521 km2. The total registered population of the territory is 236,900 of which ethnic minorities in multiethnic settlement areas account for approximately 42%.
Longli County is adjacent to Guiyang city, the capital of Guizhou Province, meaning that Longli County has a superior geographical location. Thus, its economy and society have rapidly developed, and the urbanization level has continuously improved in recent years. Therefore, it has accelerated the transformation of regional land use, intensifying the competition between PS, LS, and ES. Consequently, it is very important to study the evolutionary trend and interrelationships of PS, LS, and ES in Longli County. Doing so will contribute to scientifically formulating the regional territorial spatial planning and guiding the coordinated development of regional resources, the environment, the economy, and society.

2.2. Data Sources

2.2.1. Land-Use Data

This paper used two time points to study functional changes in PLES in Longli County. Notably, we chose not to use conventional remote sensing data and instead selected more accurate data, i.e., land-use data, to conduct this research. In addition, such data can be used in future studies on the patterns of the functional tradeoffs and synergies of PLES. Specifically, these data are 2015 land-use data and data from the third National Land Survey in 2019, which were provided by the Natural Resources Bureau of Longli County. Due to the inconsistent coordinate system of the two datasets, this study was processed based on ArcGIS 10.2 software to unify the projection coordinate system into CGCS2000_3_Degree_GK_Zone_36, unify the geographic coordinate system into GCS_China_Geodetic_Coordinate_System_2000, and make a spatial correction.

2.2.2. Other Data

In addition to the land-use data, several other data were used in this study. First, we used the digital elevation model (DEM) of Longli County; it has a spatial resolution of 30 m, and was obtained from the Geospatial Data Cloud Site, Computer Network Information Center, Chinese Academy of Sciences (http://www.gscloud.cn/, accessed on 5 March 2022) [43]. Second, we used slope data for Longli County generated from the DEM. Third, main road data were obtained from the National Center for Basic Geographic Information (http://www.ngcc.cn/, accessed on 5 March 2022). Lastly, population density data with a spatial resolution of 100 m were obtained from the Geographical Remote Sensing Ecological Network (http://www.gisrs.cn/, accessed on 6 March 2022).

2.3. Methods

2.3.1. PLES Classification and Functional Value Measurement System

The PLES classification system and functional value measurement method are prerequisites for studying the distribution and evolution of PLES, and they are also the basis for constructing the scientific patterns of PLES [20]. To that end, two kinds of methods are often used. The first is the quantitative calculation method, which constructs an index system for production, living, and ecological function values to identify PLES. The second is the merge classification and scoring method, which classifies or scores PS, LS, and ES based on official land-use survey data. The latter operation is simpler than the former, and the classification is more detailed. Thus, this study used the second method to conduct research. Meanwhile, due to the characteristics of compound functions, dynamic variation and the heterogeneity of land use, this study scored different land types based on previous research [10,44], and obtained the functional measurement system of PLES (Table 1). Where 5, 3, 1, and 0 indicate strong, middle, weak, and no function, respectively. Finally, this paper created a grid unit (500 m × 500 m) and used a grid partition statistical tool (average value) to calculate the functional values of PS, LS, and ES for 2015 and 2019 and, ultimately, to obtain the spatial pattern of PLES. The patterns of changes in PLES were determined based on the consistency of the scores of the two epochs (2015 and 2019) for the same grid unit. Grid units with the same score were unchanged areas and classified as “stable”; grid units with different scores were considered to “increase” or “decrease” based on the change in the score.

2.3.2. Geographical Detector Model

The geographical detector model is a statistical method that detects the spatial stratified heterogeneity of features and reveals the underlying driving force [45]. It includes four detectors: the factor detector, risk detector, ecological detector, and interaction detector [43]. Among them, the factor detector mainly measures the influencing power of the explanatory variable X on Y; the risk detector mainly determines whether the means of attributes differ significantly between the two subregions; the ecological detector mainly compares whether the effects of the two factors on the spatial distribution of Y differ significantly; the interaction detector mainly identifies the interactions between different influence factors [46]. In this study, the factor detection was used to determine the degree of correlation of driving factors with the pattern of PLES. The specific formula and meaning of factor detector are as follows:
q = 1 k = 1 n N k σ k 2 N σ 2 = 1 - S S W S S T S S W = k = 1 n N k σ k 2 , S S T = N σ 2
where k = 1, 2, 3, …, n refers to the strata of variables; N and Nk represent the total number of sample units and the number of sample units, respectively; and σ 2 and σ k 2 represent the variance and the variance in stratum k. SSW and SST represent the within-sum of squares and the total sum of squares, respectively. The value of q is within [0, 1], and a larger value of q indicates a greater explanatory power of X for Y.
Simultaneously, four socioeconomic factors (distance to town, distance to the provincial capital, distance to the main road, and population density) and four natural factors (elevation, slope, distance to the ecological red line, and distance to water) were selected to analyze in this paper (Table 2). During the analysis, the values of changes in units of PLES in the five years from 2015 to 2019 was taken as Y and the selected factors were taken as X to detect the driving factors of the changes in PS, LS, and ES.

2.3.3. Spearman Correlation Coefficient

To explore whether there are tradeoffs and synergies among PS, LS, and ES, the Spearman correlation coefficient was used [47]. The specific formula is as follows:
r ( X i , Y i ) = 1 6 i = 1 n ( U i V i ) 2 n ( n 2 1 )
where, r represents the correlation coefficient, and the range is from −1 to 1. When r < 0, it indicates that the two spaces are negative correlation, which is considered a tradeoff relationship. When r > 0, it indicates that the two spaces are positive correlation, which is considered a synergistic relationship.
In this paper, the functional values of PS, LS, and ES were assigned to each unit (average value) and they were calculated pairwise to obtain the spearman correlation coefficients.

2.3.4. Bivariate Local Moran’s I

Spatial autocorrelation analysis includes the global spatial autocorrelation index and local spatial autocorrelation index, where the local spatial autocorrelation index is composed of the univariate local Moran’s I and the bivariate local Moran’s I [48]. The bivariate local Moran’s I overcomes the limitation of previous spatial autocorrelation analyses with only one variable [49]. It can be used to observe the value of one variable of a spatial unit and the value of another variable of an adjacent spatial unit to reveal the interrelationships between the two functional systems, and it has been widely used in ecological and geographical studies. Thus, in this paper, the interrelationships of PS, LS and ES were measured by the bivariate local Moran’s I in GeoDa V.0.9.5-i software (http://geodacenter.github.io/download.html/, accessed on 6 March 2022). The specific formula is as follows:
  I = x i k x ¯ k σ k j = 1 n [ W i j x j I x ¯ I σ I ]
where I represents the bivariate local Moran’s I spatial autocorrelation coefficient; x i k   represents the k-th functional value of the i-th unit; x j I   represents the I-th functional value of the k-th unit; x ¯ k   and   x ¯ I represent the average value of the k-th function and I-th function, respectively; σ k   and   σ I represent variance in the k-th function and I-th function; n represents the number of units in the study area; and wij represents the spatial adjacent weight matrix between units i and j in the study area.
At the same time, the queen neighbor mode was used to construct spatial weights and jointly analyze the production function, living function, and ecological function based on the 95% confidence level to obtain the final relationship of tradeoffs and synergies of PLES. Specifically, when two functions show high–high significant spatial clustering, it indicates that both functions have high functional values in the region, which is considered a high–high synergistic relationship in this paper, e.g., PL high–high synergies, PE high–high synergies, or LE high–high synergies. Similarly, when two functions are presented with low–low significant spatial clustering, indicating that both functions have low functional values in the region, they are considered to have a low–low synergistic relationship, e.g., PL low–low synergies, PE low–low synergies, and LE low–low synergies. When two functions show high–low or low–high significant spatial clustering and, between the two functions, one is high and the other is low, they are considered to have a tradeoff relationship, with the function having the high value being the dominant function. For example, when the synergy of the production function dominates the relationship, it indicates, e.g., PS–LS tradeoffs or PS–ES tradeoffs.

2.3.5. PLES Zoning Management Scheme

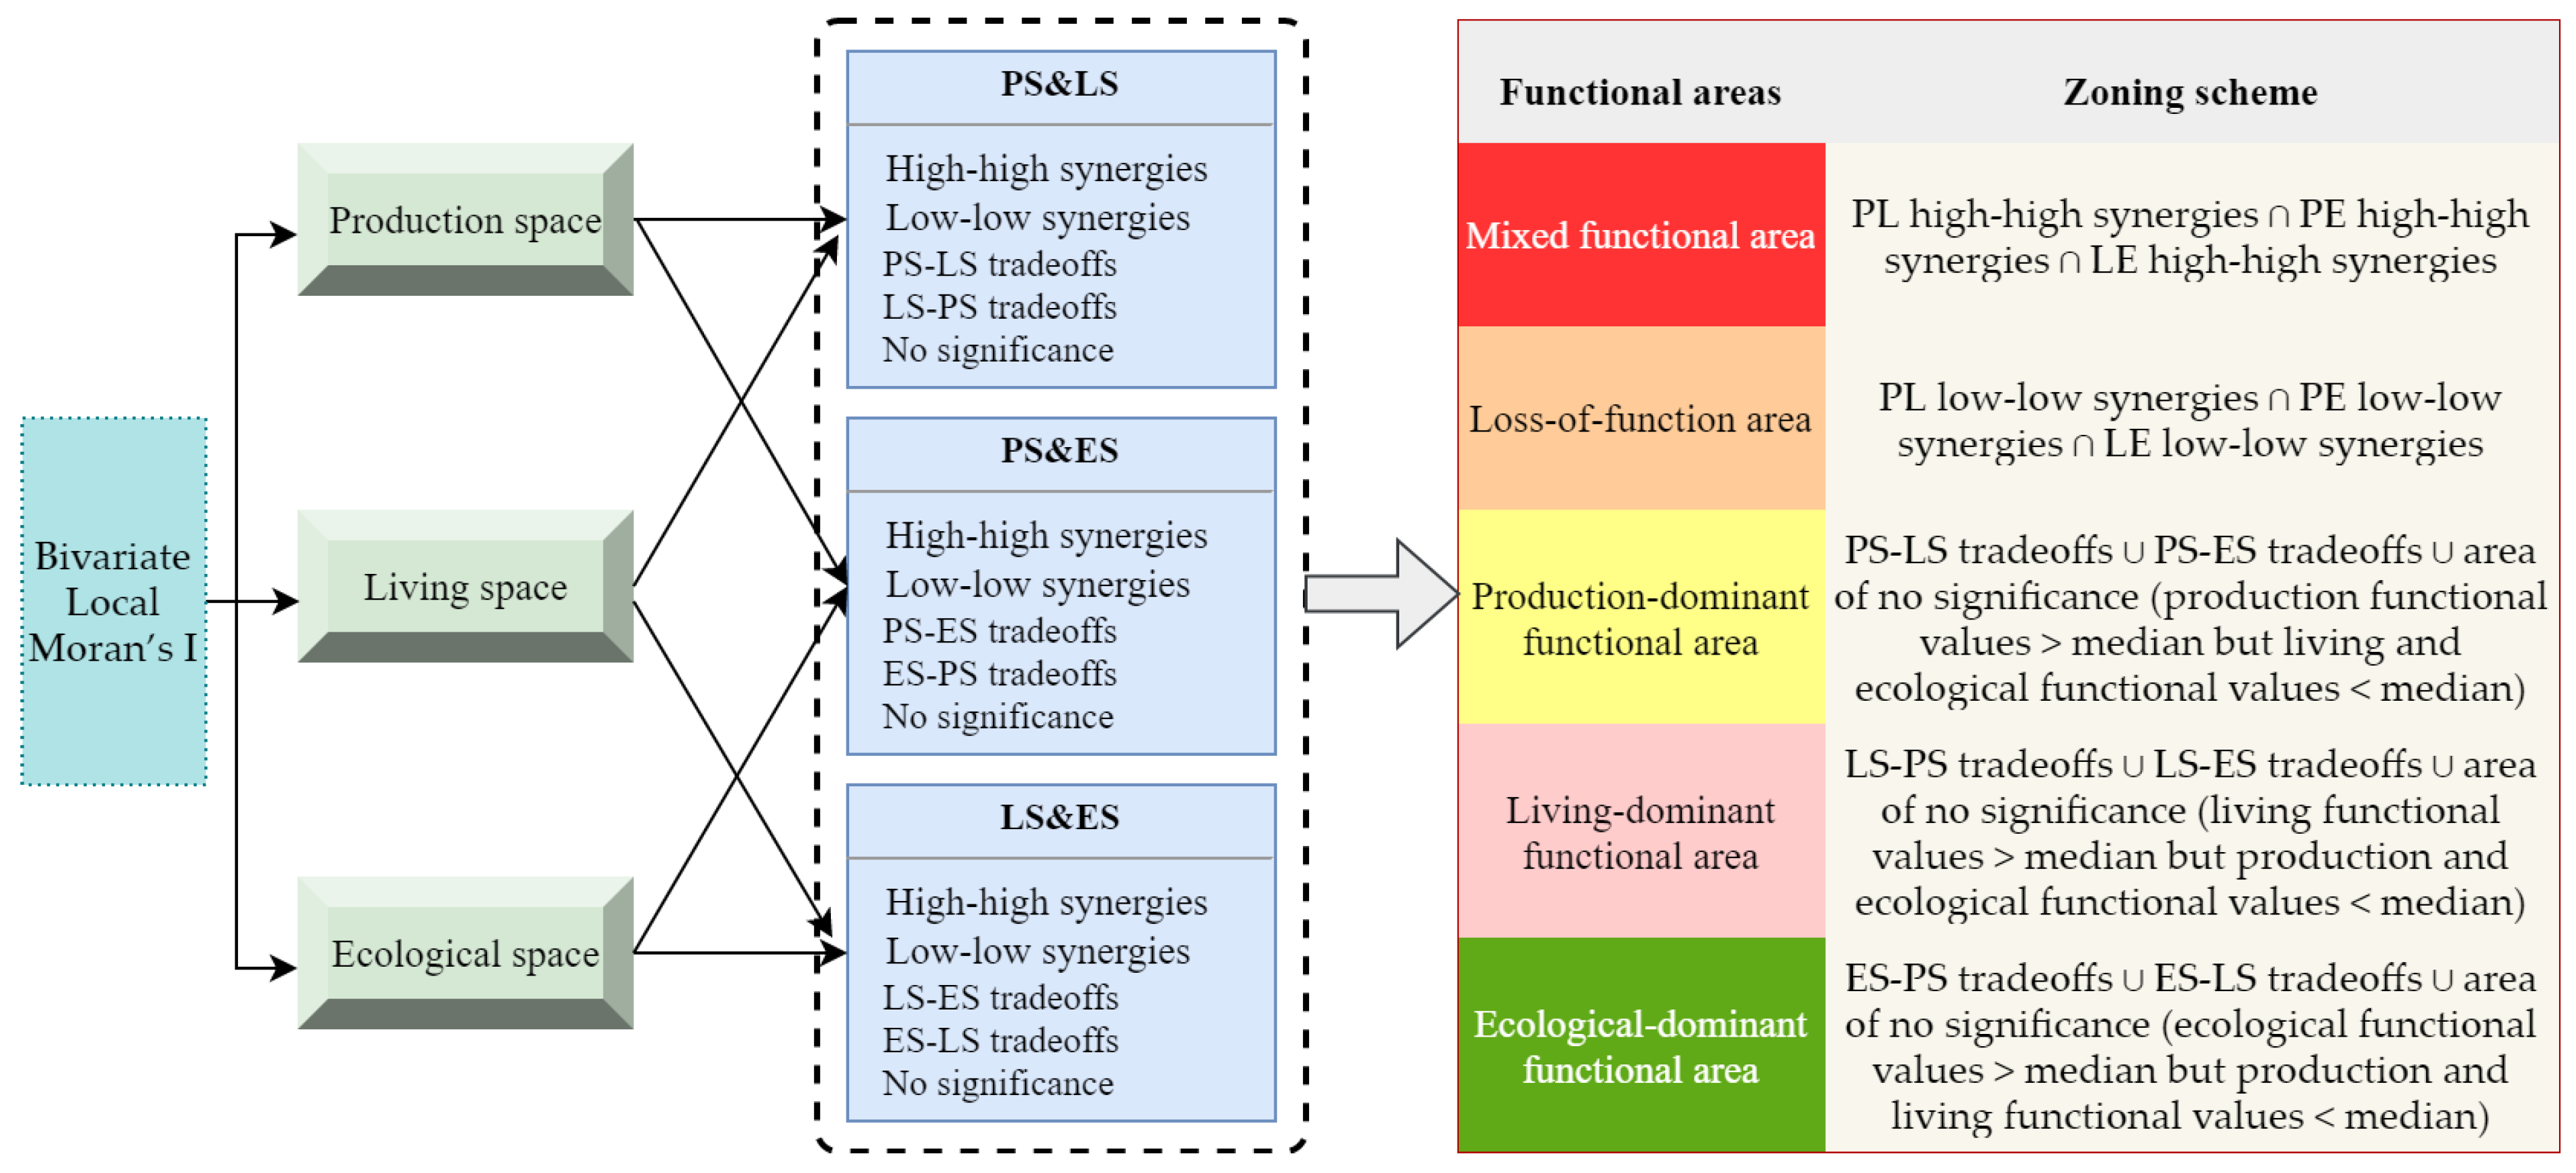
PLES research is a focus of territorial spatial planning in China. How to divide the dominant functional area scientifically and effectively has always been key in PLES research. The identification of PLES is conducive to determining the spatial differences and dominance [50]. The measure of tradeoffs and synergies in spaces can be used to analyze potential land-use conflicts [51]. Both have become an important basis for functional zoning in many studies. However, in research on spatial tradeoffs and synergies, a method for dominant functional zoning based on their results is still lacking. Thus, based on the result of the tradeoffs and synergies of PLES, this paper innovatively proposes a way to divide the functional dominant area. As shown in Figure 3, five functional areas were determined in this paper, including mixed functional area, loss-of-function area, production-dominant functional area, living-dominant functional area and ecological-dominant functional area. The specific spatial functional areas and zoning scheme are as follows:

3. Results

3.1. Spatiotemporal Patterns of and Changes in PLES

In this study, the spatiotemporal patterns of and changes in PLES in Longli County from 2015 to 2019 were simulated. The results show that the PS, LS, and ES have changed greatly in this five-year period.
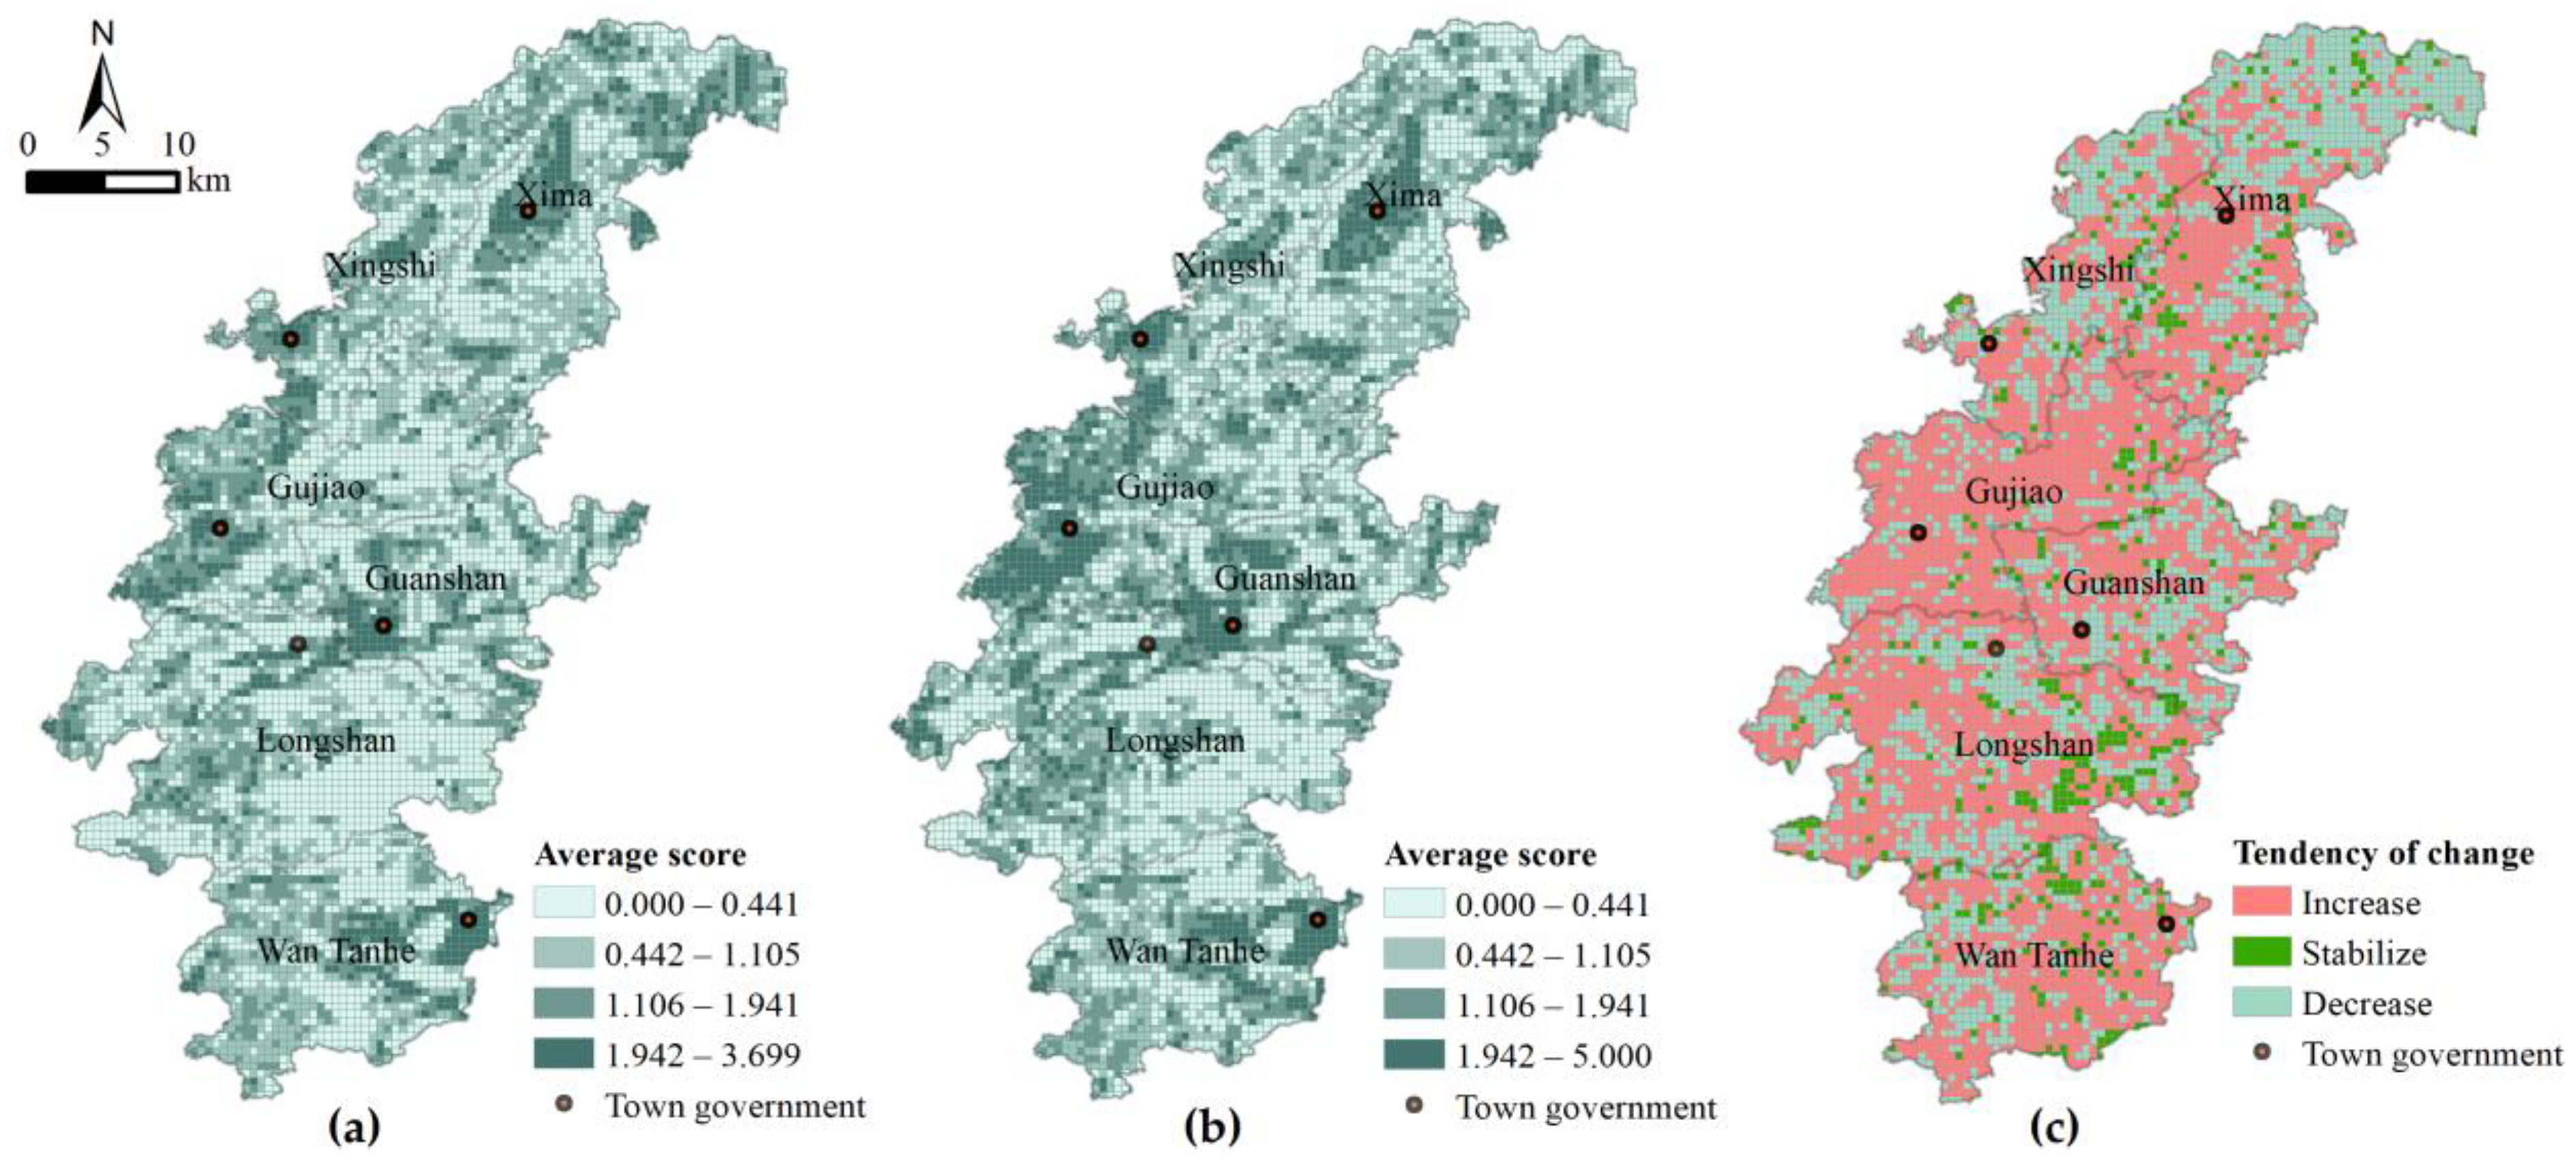
As shown in Figure 4, from the spatial pattern of the simulation results, PS in Longli County is widely distributed in both 2015 and 2019. However, the high-scoring areas are located in the center of each town, because the industrial land is mainly concentrated in these areas. In addition, the wide distribution of agricultural land has greatly affected the spatial pattern of PS in Longli County, which makes many suburban or rural areas present relatively high scores, such as the northern area of Xingshi town and Xima town as well as the eastern area of Longshan town and Wan Tanhe town. In terms of the temporal pattern, it is obvious that changes in PS in Longli County occurred over the five-year period. In most areas, the scores for PS show an upward trend, which is more obvious in the middle of Longli County, and the highest score increased from 3.699 in 2015 to 5 in 2020. The area with stable PS scores is not obvious and is mainly located in the southern area of Longli County. The functional value of PS mostly decreased in the northern part of Longli County, including Xingshi town and northern Xima town.
Based on the spatial pattern, compared to PS and ES, LS has the smallest distributional range and has a concentrated distribution in the center of town areas (Figure 5). The rest of the area has a scattered distribution because of the distribution of rural settlements. Based on the temporal pattern, the expanding trend of LS in Longli County is also more obvious in the five-year period, which is also mainly reflected in the middle of Longli County, including the Guanshan Street Office and Gujiao town, with the trend in Gujiao town being particularly obvious. However, the rest of the towns did not change significantly. The area with stable LS scores is larger than that with stable PS and ES scores, but the decreasing area is smaller. Overall, LS changed the least.
Based on the spatial pattern, compared to PS and LS, ES has the largest distributional range, but its distributional pattern is the opposite of that of PS and LS (Figure 6). The high-scoring areas are mainly distributed in the remote areas far from urban centers. There is a large area in eastern Longshan town, eastern Xingshi town, and northern Xima town, which is mainly affected by the landform of this area, having a large area of forest. Based on the temporal pattern, in Longli County, the ES area with an increasing score and the ES area with a decreasing score changed greatly. The area with a stabilizing score is small and mainly concentrated in the eastern part of Longshan town, which is because the area is a nature reserve, and the strict protection policies keep ES of the area stable. However, overall, the ecological spatial function is on a downward trend. Specifically, the ecological spatial range decrease in the Gujiao town area is the most obvious, followed by the rest of the towns’ centers. Notably, however, the ecological spatial area in the northern part of Longli County increased greatly and is mainly located in northern Xima town.
Based on the total PS, LS, and ES scores for this five-year period (Table 3), the total PS score increased from 5289.649 to 6064.295, with a net increase of 774.646 and a rate of change of 14.64%. The total LS score increased from 617.914 to 1010.318, with a net increase of 392.403 and a rate of change of 63.50%. Finally, the total ES score decreased from 28,227.585 to 27,383.823, with a net decrease of 843.762 and a rate of change of 2.99%. Over the course of this five-year period, PS, LS, and ES changed greatly, which is reflected in the expansion of PS and LS and the compression of ES. Among them, the expansion of LS is the largest based on the rate of change. It is observed, on the one hand, in the occupation of ES and, on the other hand, in the transformation of weak functional living land into strong functional living land, such as the transformation of village land into urban land.
In general, in Longli County, the ecological spatial range is the largest, followed by the production spatial range; the living spatial range is the smallest. The distribution of PS and LS shows obvious spatial consistency, and they clearly complement ES [52]. However, the distribution of the PS, LS, and ES is seen to be clustered.

3.2. Result of the Driving Forces of the Changes in PLES

Based on the factor detector, the influence degree of different factors to the changes in PLSE were obtained. As shown in Figure 7, the three most important factors driving the functional change in PS in the five-year period are the distance to town, the distance to the main road, and the distance to the provincial capital, with q-values of 0.512, 0.381, and 0.215, respectively. The three factors with the least impact on changes in PS are the distance to the ecological red line, elevation, and the distance to water, with q-values of 0.042, 0.128, and 0.168, respectively. Furthermore, the distance to town, population density and the distance to the main road are the three main factors affecting changes in LS, with q-values of 0.611, 0.294, and 0.267, respectively. The distance to the ecological red line, the distance to water, and elevation are the three weakest driving factors, with q-values of 0.062, 0.069, and 0.113, respectively. Lastly, the leading driving factors of changes in ES are the distance to town, the distance to the main road, and slope, and their q-values are 0.589, 0.269, and 0.191, respectively. The weakest determinants are the distance to the ecological red line, the distance to water, and elevation, with q-values of 0.068, 0.063, and 0.154, respectively.
Overall, the socioeconomic factors detected have a more significant impact on changes in PLES than natural factors. Moreover, among the four socioeconomic factors, the distance to town has the greatest influence. Even if the influence of natural factors on changes in PLES is small, the influence of these factors should not be ignored [53], which may limit the changes in the patterns of PLES in the later period to some extent.

3.3. Correlation Coefficient and the Patterns of the Tradeoffs and Synergies of PLES

3.3.1. Spearman Correlation Coefficient of the Tradeoffs and Synergies of PLES

Owing to limited space and the needs of this study, this paper identifies only the interrelationships of PS, LS, and ES in Longli County in 2019. Based on SPSS 26.0 software, the correlation coefficient between PS, LS, and ES in 2019 was calculated to judge the type of tradeoff and synergy of spaces in Longli County. As shown in Table 4, at the 99% confidence level, the correlation coefficient between PS and LS was 0.736, with a significant positive correlation, but the correlation coefficient with ES was −0.956, showing a significant negative correlation. The correlation coefficient between LS and ES was −0.758, which also had a significant negative correlation. The above results show that there is a strong synergistic relationship between PS and LS in Longli County, but there is a strong tradeoff relationship between ES, on the one hand, and PS and LS, on the other hand.

3.3.2. Patterns of the Tradeoffs and Synergies of PLES

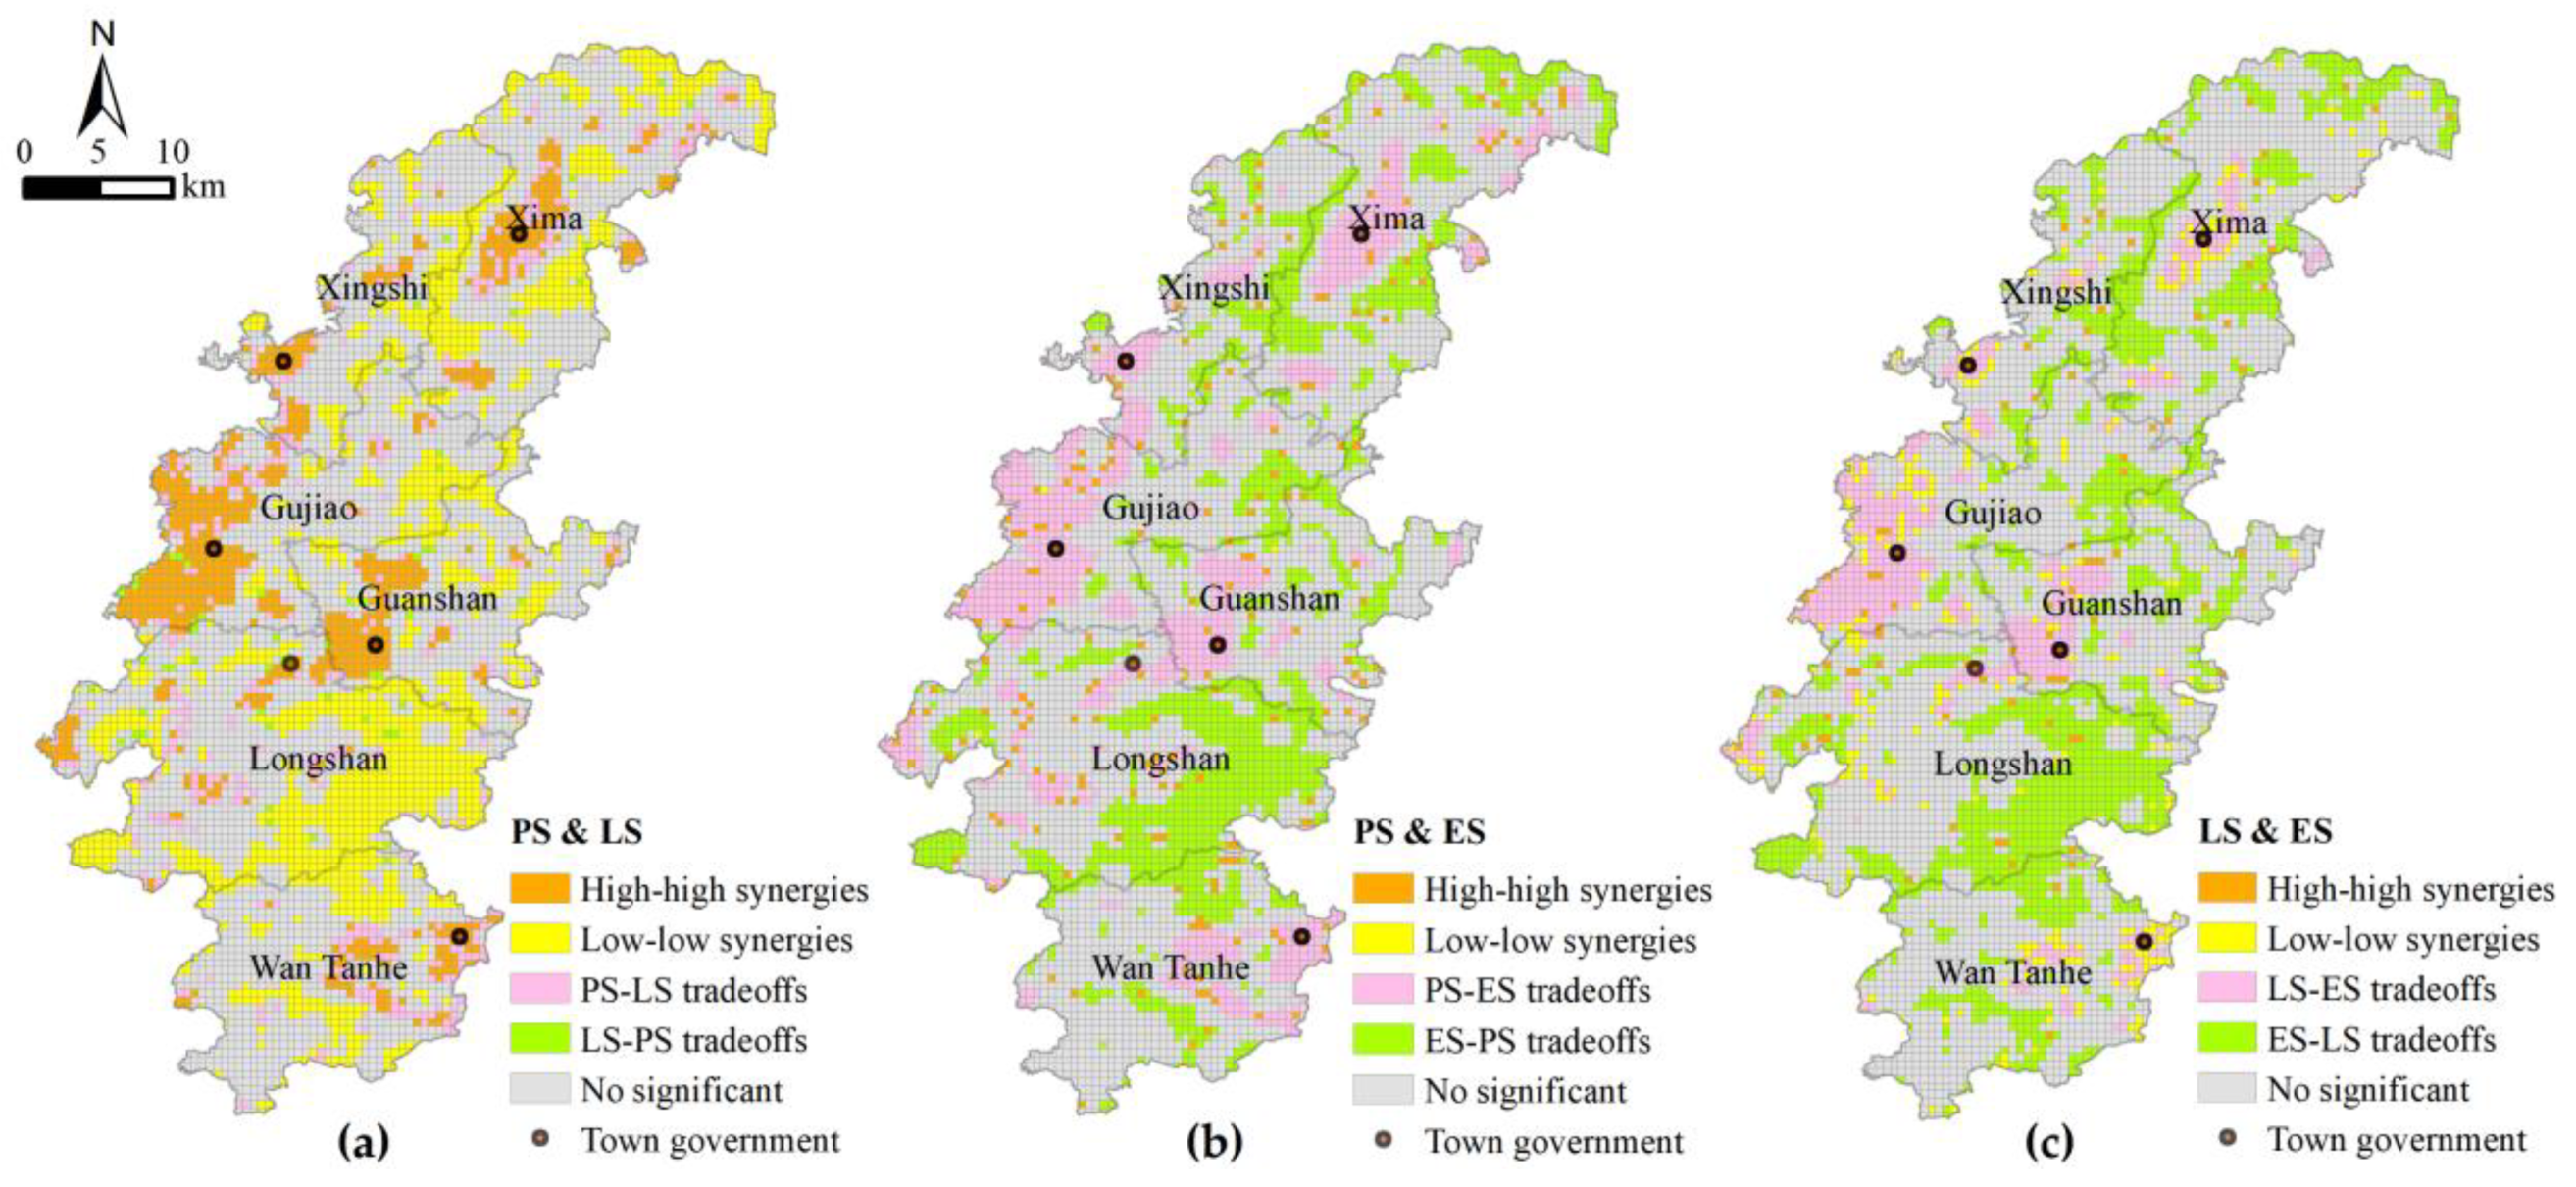
As shown in Figure 8, the relationship between PS and LS is mainly synergistic. Specifically, the area of low–low synergies accounted for the largest proportion, reaching 36.72%. It was mainly distributed in the eastern area of Longshan town and the border area of the rest of the towns. The area of high–high synergies accounted for 16.54%, mainly distributed in the center of each town, which indicates that the production functions and living functions on urban land are highly complex. The area of tradeoffs accounted for a relatively small proportion, only 9.48% of the total area, of which PS–LS tradeoffs accounted for 7.94%, mainly distributed at the edges of town centers. The area of LS–PS tradeoffs accounted for 1.54%, and its distribution was relatively scattered.
In terms of PS and ES, unlike the relationship between PS and LS, their tradeoff relationship occupied the dominant area, accounting for 72.07% of the total area. Specifically, the area of ES–PS tradeoffs accounted for the largest proportion, 43.80%, and its distributional pattern was similar to the low–low PS–LS synergies. The proportion of PS–ES synergies was 28.27%, and its distributional pattern was similar to the high–high PS–LS synergies. However, the area of synergistic relationships is relatively small and scattered, and the main reason for the distributional pattern of high–high synergies is the distribution of arable land and garden land. Additionally, the area of low–low synergies is land with weak production and ecological functions, such as other land and water areas, as shown in Table 1.
For LS and ES, the tradeoff relationship was dominant, with the ES–LS tradeoff area accounting for 52.71% of the total area and the LS–ES tradeoff area accounting for 15.04%. Notably, the spatial pattern of tradeoffs between LS and ES is similar to that between PS and ES. The synergistic area is also relatively small, with only 6.49% of the total area. The area of high–high synergies is mainly distributed in the suburbs because the area has not only a high living function but also more ecological land. The area of low–low synergies is mainly distributed along the edges of towns and traffic trunk lines, mainly for production land.
In summary, in the spatial relationships of PLES, the relationship between PS and LS is mainly synergistic, but their relationships with ES mainly involve tradeoffs, indicating that in regional development, PS and LS are highly coordinated, especially in urban areas, but they conflict with ES.

3.4. PLES Zoning Result

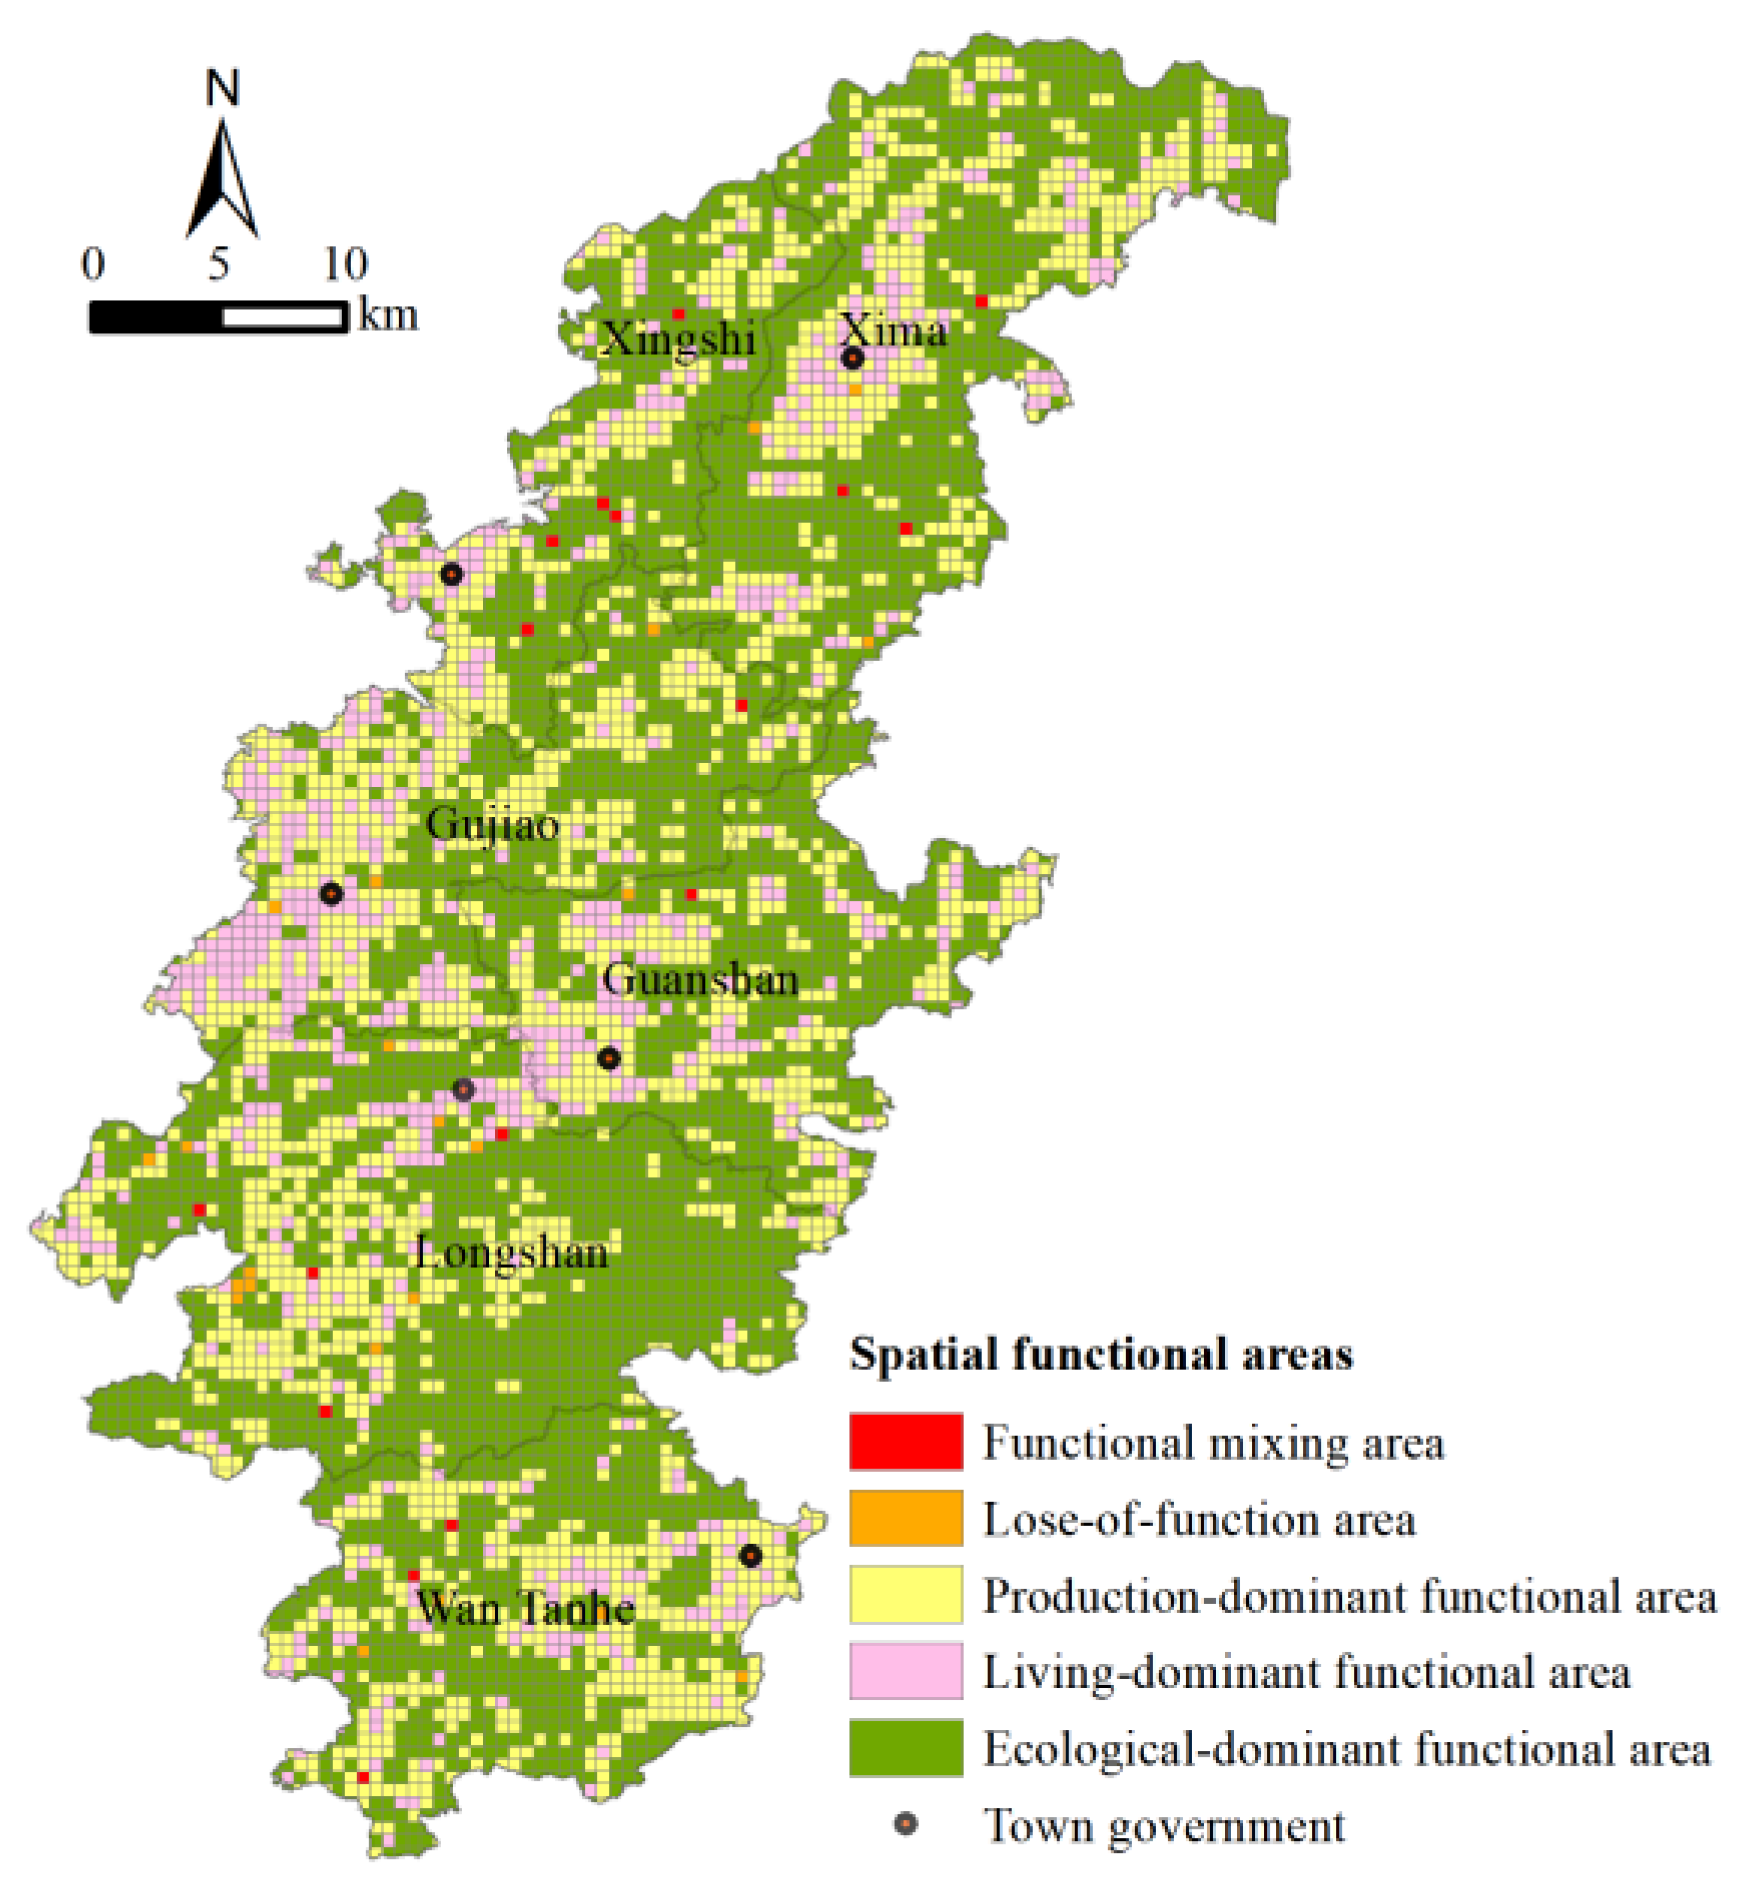
Based on the PLES zoning scheme, the spatial functional areas in Longli County were obtained (Figure 9).
A mixed functional area means that the functional values of PS, LS, and ES are relatively high. From the spatial distribution, the mixed functional area is small and scattered, because rarely a piece of land can have production, living, and ecological functions.
A loss-of-function area means that the functional values of PS, LS, and ES are relatively low. It is also characterized as small and scattered, and the land types in the functional function areas are mainly unused land and other land with low production, living, and ecological functions.
A production-dominant functional area means that the functional values of PS are relatively high but those of LS and ES are low, and it accounted for 31.5% of the total functional area. From the spatial distribution, it is mainly distributed around the town centers, which are characterized by convenient transportation and low land prices.
A living-dominant functional area means that the functional values of LS are relatively high but those of PS and ES are low, and it accounted for 10.1% of the total functional area. From the spatial distribution, living-dominant functional areas are mainly distributed in each town center of Longli County, and the central urban area is the main distribution area, and these areas are mainly urban residential land. In addition, due to the distribution of rural settlements, other areas are also scattered in such functional areas.
An ecological-dominant functional area means that the functional values of ES are relatively high but those of PS and LS are low. From the area proportion, ecological-dominant functional areas accounted for the largest proportion, reaching 57.5%. From the spatial distribution, ecological-dominant functional areas are mainly distributed in the boundary seat of each town, and there is a large area of distribution in the eastern part of Longshan town, which is mainly affected by the landform.
In general, in the spatial functional areas of PLES in Longli County, the single dominant functional area is the main area, among which ecological-dominant functional area is the largest. The production-dominant functional area is the second largest, and the living-dominant functional area is the smallest. In order to make each functional area play a better role, optimization measures need to be put forward for each functional area based on their characteristics.

4. Discussion

4.1. Analysis of the Driving Forces of the Changes in PLES

Rapid socioeconomic development is undoubtedly a reflection of rapid urbanization and industrialization, which will inevitably lead to changes in and the transformation of land use in a region [54]. From the most urban development processes, the final result is that ES is reduced by PS and LS [55].
From the result of factor detector, the influence of socioeconomic factors on changes in PLES have a more significant influence than natural factors, indicating that human disturbance becomes the dominant factor of regional spatial change. For example, the closer the distance to the town is, the more significant the spatial change. In the process of urban development, it is inevitably accompanied by the increase of construction land [56], which greatly changes the spatial pattern of PLES inside and outside the city [57]. The distance to the provincial capital has also become an important factor of changes in PLES in Longli County. Because Gujiao town is close to the provincial capital center, land for real estate and infrastructure has increased rapidly in recent years, resulting in the speedy expansion of PS and LS and the great compression of ES. Convenient transportation has become an important condition to attract industrial or population agglomeration. Therefore, distance to the main road has also become an important factor affecting the change in PLES patterns, which increases the land of production and living in the surrounding areas. On the other hand, roads, as a channel of human access nature, greatly increase the scope of human activities and profoundly change the pattern of ES [58].
But the relationship between socioeconomic development and the spatial pattern of PLES may also be mutual. Based on the driving factors of changes in PLES in Longli County, the impact of natural geographical conditions on the changes is not significant, but natural factors still play an important role on the changes in PLES, which is reflected in the socioeconomic development limited in some areas by natural conditions.. For example, the eastern part of Longshan town has a large alpine area, which has stabilized the pattern of PLES for a long time.
In addition, from the patterns of PLES, the ecological spatial function in some areas improved significantly in the five-year period, thus the influence of policy on the spatial patterns of PLES was explored in this research. We found some evidence that supports this phenomenon, such as the government launching the “Action to Improve the Quality and Efficiency of Forestry” in 2018, including increasing the forest area by 4000 ha, turning arable land with a slope above 25° and located in important water sources into woodland, and strengthening efforts to control soil erosion in rocky desertification areas. The “Three-year Action Plan for Roxburgh Rose Industry Promotion (2018–2020)”, aiming to reach a planting area of 14,333 ha in 2018 and 14,467 ha in 2019, was promoted. Xima town planted 4240 ha, far higher than the rest of the towns, which greatly increased the ES but decreased the PS of the area. Ultimately, we conclude that political factors are an indirect driving force that holds great significance in improving the ecological environment and ecological area [59]. In the future, the role of policy should not be ignored in urban planning [60].

4.2. PLES Zoning Management Significance and Optimization Measures

Optimizing the pattern of territorial space is the primary measure of ecological civilization construction, and it also an important measure for promoting the balance of population, resources, and the environment as well as the unification of economic, social, and ecological benefits [27]. Adopting diverse control measures for different functional areas is an important way to improve overall land-use efficiency [35]. Therefore, the functional dominant area must be divided scientifically, and measures should be put forward according to their characteristics to optimize each functional area. Based on the results of the tradeoffs and synergies of PLES, five functional areas were determined, including a mixed functional area, a loss-of-function area, a production-dominant functional area, a living-dominant functional area, and an ecological-dominant functional area, and the optimization measures are as follows:
A mixed functional area is the overlapping area of high synergies among PS, LS, and ES, which means that the production, living, and ecological functional values are relatively high in this area and that there are no tradeoff relationships. At present, this functional area is mostly located in the suburbs with production, living, and ecological functions. In the future, the mixed functional area must be larger in some areas of cities after increasing green space.
A loss-of-function area is the overlapping area of low synergies among PS, LS, and ES, which means that the production, living, and ecological functional values are relatively low in this area. This area is mainly unused land, abandoned mineral land, and rocky desertification areas, and the overall land-use efficiency is low. Thus, a comprehensive land remediation project should be adopted to restore abandoned land and to control rocky desertification to change the type of land use and improve its efficiency.
A production-dominant functional area plays an important role in the stage of urban industrialization, providing various products and services for human beings [52]. It mainly includes commercial land within cities and industrial land outside cities, which jointly support the development of the regional economy. Land for production space must adhere to intensive and efficient use, manage the area for production land scientifically, and improve the input–output efficiency of industrial land. The central business district will be built inside a city, and external urban land will be concentrated in industrial parks in an orderly manner to avoid disorderly expansion and squeezing ES.
A living-dominant functional area mainly provides space for residents’ life, consumption and public services [61], and the ultimate purpose of territorial spatial planning is to create a livable and moderate LS [7]. Since the settlements in rural areas include both production and ecological functions, living-dominant functional areas are mainly located in urban areas. It is necessary to delimit the control boundary of LS and limit the erosion of production land. Notably, LS areas should be allowed to increase appropriately. Simultaneously, the infrastructure and public service facilities within a region should be reasonably allocated to create a convenient living circle with a coordinated layout and complete functions.
An ecological-dominant functional area mainly provides service functions such as environmental optimization, climate regulation, and leisure habitat for a region [1]. Maintaining the beauty of ES is the main goal of territorial spatial planning [62]. In this regard, we must limit the excessive occupation of ES by PS and LS. In particular, the development of ecological red-line protected areas should be strictly prohibited [63]. In the context of ecological civilization construction, the integration of ES into PS and ES is also increasingly necessary. Therefore, we encourage the addition of more parks and green belts in cities to expand their green space [56] and structure an urban ecosystem [64].

4.3. Limitations of this Study and Directions for Future Research

Some limitations of this paper should be stressed. First, the system of land-use classification in 2015 and 2019 was inconsistent, which affected the spatial pattern of PLES and the subsequent work. Second, the method of dividing the dominant functional areas by the results of tradeoffs and synergies is not mature, and more scientific and effective ways need to be sought in the future. Finally, we did not divide PLES into multiple and detailed dimensions because of the system of land-use classification, which led to an unsatisfactory functional zoning scheme. For example, there are extreme differences in spatial land use between urban and rural areas. In rural areas, PS and ES are highly overlapping. For urban production land, commercial land, and residential land may be highly synergistic, but industrial land and residential land are highly likely to show a tradeoff relationship. These limitations should be considered in depth in future research.

5. Conclusions

Exploring the spatial patterns and mutual relationships of PLES holds great significance for territorial spatial planning and zoning management. Taking Longli County as an example, this paper simulated the spatial pattern of PLES in 2015 and 2019 and analyzed the driving factors of the changes in PLES. In addition, the tradeoffs and synergistic relationships of PLES were measured using a variety of methods. The conclusions were as follows:
(1) The high-scoring areas of PS and LS in Longli County are mainly located near the center of each town, with obvious consistency in spatial distribution, and the high-scoring areas of ES are located in the suburbs far from the towns, conflicting with PS and LS. (2) In the five-year period, PS and LS in Longli County continuously expanded. LS expanded the most from the perspective of the rate of change, and ES shrank continuously. (3) Socioeconomic factors are the dominant factor affecting the changes in PLES, among which the distance to town has the greatest influence. (4) Based on the correlation coefficient, PS and LS have a significant positive correlation, but they have a significant negative correlation with ES. In terms of spatial relationships, PS and LS mainly have synergistic relationships, but their relationships with ES mainly involve tradeoffs. (5) In the spatial functional areas of PLES in Longli County, the single dominant functional area is the main area, among which the ecological-dominant functional area is the largest.
In this paper, a new scheme for dominant functional zoning is proposed based on the results of tradeoffs and synergies. Even if the scheme is not mature, it is available for future studies. Finally, this paper draws the conclusion that in regional spatial planning and management, it is necessary to identify the spatial patterns and to determine tradeoffs and synergistic relationships of PLES. Doing so makes it possible to reasonably divide the dominant functional areas and limit the disorderly expansion of PS and LS, ultimately promoting sustainable regional development.

Author Contributions

S.G. and L.Y. conceived and designed the experiments; S.G. performed the experiments; S.G. wrote the paper; and L.Y. and H.J. helped with editing. All authors have read and agreed to the published version of the manuscript.

Funding

This research was funded by the “Rural spatial restructuring in poverty-stricken mountainous areas of Guizhou based on spatial equity: A case study of the Dianqiangui Rocky Desertification Area” project of the National Natural Science Foundation of China, grant number 41861038, and the “Research and Development of Emergency Response and Collaborative Command System with Holographic Perception of Traffic Network Disaster” project of the National Key Research and Development Program, grant number 2020YFC1512002.

Institutional Review Board Statement

Not applicable.

Informed Consent Statement

Not applicable.

Data Availability Statement

Not applicable.

Conflicts of Interest

The authors declare no conflict of interest.

References

  1. Huang, J.C.; Lin, H.X.; Qi, X.X. A literature review on optimization of spatial development pattern based on ecological-production-living space. Prog. Geogr. 2017, 36, 378–391. [Google Scholar]
  2. Wang, C.; Tang, N. Spatio-temporal characteristics and evolution of rural production-living-ecological space function coupling coordination in Chongqing Municipality. Geogr. Res. 2018, 37, 1100–1114. [Google Scholar] [CrossRef]
  3. Świąder, M.; Szewrański, S.; Kazak, J.K. Environmental carrying capacity assessment—the policy instrument and tool for sustainable spatial management. Front. Environ. Sci. 2020, 8, 579838. [Google Scholar] [CrossRef]
  4. Cai, E.; Jing, Y.; Liu, Y.; Yin, C.; Gao, Y.; Wei, J. Spatial–temporal patterns and driving forces of ecological-living-production land in Hubei Province, Central China. Sustainability 2017, 10, 66. [Google Scholar] [CrossRef] [Green Version]
  5. Liu, C.; Xu, Y.; Lu, X.; Han, J. Trade-offs and driving forces of land use functions in ecologically fragile areas of northern Hebei Province: Spatiotemporal analysis. Land Use Policy 2021, 104, 105387. [Google Scholar] [CrossRef]
  6. Liu, Y.; Fang, F.; Li, Y. Key issues of land use in China and implications for policy making. Land Use Policy 2014, 40, 6–12. [Google Scholar] [CrossRef]
  7. Zhou, D.; Xu, J.; Lin, Z. Conflict or coordination? Assessing land use multi-functionalization using production-living-ecology analysis. Sci. Total Environ. 2017, 577, 136–147. [Google Scholar] [CrossRef]
  8. Song, Y.; Merlin, L.; Rodriguez, D. Comparing measures of urban land use mix. Comput. Environ. Urban Syst. 2013, 42, 1–13. [Google Scholar] [CrossRef]
  9. Zou, L.; Wang, J.; Hu, X. An classification systems of production-living-ecological land on the county level: Theory building and empirical research. China Land Sci. 2018, 32, 59–66. [Google Scholar]
  10. Jiaxing, C.; Jiang, G.; Jianwei, S.; Jing, L. The spatial pattern and evolution characteristics of the production, living and ecological space in Hubei Provence. China Land Sci. 2018, 32, 67–73. [Google Scholar]
  11. Zhang, X.; Wang, F.; Zhang, J. Spatial Correlation Of The Productive⁃ecological⁃living function of urban agglomeration in the middle reaches of the Yangtze River. China Popul. Resour. Environ. 2021, 31, 110–122. [Google Scholar]
  12. Wang, D.; Jiang, D.; Fu, J.; Lin, G.; Zhang, J. Comprehensive assessment of production–living–ecological space based on the coupling coordination degree model. Sustainability 2020, 12, 2009. [Google Scholar] [CrossRef] [Green Version]
  13. Wang, Q.; Wang, H. Dynamic Simulation and Conflict Identification Analysis of Production-Living-Ecological Space in Wuhan, Central China. Integr. Environ. Assess. Manag. 2022. [Google Scholar] [CrossRef] [PubMed]
  14. Long, H.; Liu, Y.; Li, X.; Chen, Y. Building new countryside in China: A geographical perspective. Land Use Policy 2010, 27, 457–470. [Google Scholar] [CrossRef]
  15. Costanza, R.; d’Arge, R.; De Groot, R.; Farber, S.; Grasso, M.; Hannon, B.; Limburg, K.; Naeem, S.; O’neill, R.V.; Paruelo, J. The value of the world’s ecosystem services and natural capital. Nature 1997, 387, 253–260. [Google Scholar] [CrossRef]
  16. Rodenburg, C. Multifunctional Land Use: An Accessibility Interpretation. Econ. Multifunct. Land Use 2003, 135–139. Available online: http://hdl.handle.net/10419/116003 (accessed on 5 April 2022).
  17. Wiggering, H.; Dalchow, C.; Glemnitz, M.; Helming, K.; Müller, K.; Schultz, A.; Stachow, U.; Zander, P. Indicators for multifunctional land use—Linking socio-economic requirements with landscape potentials. Ecol. Indic. 2006, 6, 238–249. [Google Scholar] [CrossRef]
  18. Li, G.; Fang, C. Quantitative function identification and analysis of urban ecological-production-living spaces. Acta Geogr. Sin. 2016, 71, 49–65. [Google Scholar]
  19. Zhang, Y.; Long, H.; Tu, S.; Ge, D.; Ma, L.; Wang, L. Spatial identification of land use functions and their tradeoffs/synergies in China: Implications for sustainable land management. Ecol. Indic. 2019, 107, 105550. [Google Scholar] [CrossRef]
  20. Liu, J.L.; Liu, Y.S.; Li, Y.R. Classification evaluation and spatial-temporal analysis of “production-living-ecological” spaces in China. Acta Geogr. Sin. 2017, 72, 1290–1304. [Google Scholar]
  21. Tao, Y.; Wang, Q. Quantitative recognition and characteristic analysis of production-living-ecological space evolution for five resource-based cities: Zululand, Xuzhou, Lota, Surf Coast and Ruhr. Remote Sens. 2021, 13, 1563. [Google Scholar] [CrossRef]
  22. Liao, G.; He, P.; Gao, X.; Deng, L.; Zhang, H.; Feng, N.; Zhou, W.; Deng, O. The production–living–ecological land classification system and its characteristics in the hilly area of Sichuan province, southwest China based on identification of the main functions. Sustainability 2019, 11, 1600. [Google Scholar] [CrossRef] [Green Version]
  23. Wang, Z.; Wang, P.; Zhi, L. Evolution and driving forces of ecologically-productive-living space pattern in Dianchi Lake area during 2000-2020. Bull. Soil Water Conserv. 2021, 41, 265–273+281. [Google Scholar]
  24. Jiao, G.; Yang, X.; Huang, Z.; Zhang, X.; Lu, L. Evolution characteristics and possible impact factors for the changing pattern and function of “Production-Living-Ecological” space in Wuyuan county. J. Nat. Resour. 2021, 36, 1252–1267. [Google Scholar] [CrossRef]
  25. Barton, H. Land use planning and health and well-being. Land Use Policy 2009, 26, S115–S123. [Google Scholar] [CrossRef]
  26. Kim, J.H. Linking land use planning and regulation to economic development: A literature review. J. Plan. Lit. 2011, 26, 35–47. [Google Scholar] [CrossRef]
  27. Fei, D.; Cheng, Q.; Mao, X.; Liu, F.; Zhou, Q. Land use zoning using a coupled gridding-self-organizing feature maps method: A case study in China. J. Clean. Prod. 2017, 161, 1162–1170. [Google Scholar] [CrossRef]
  28. Wei, W.; Yang, Q. Study on the Xinjiang Herder County Planning from the Perspective of Production-living-ecological Space. In Proceedings of the IOP Conference Series: Earth and Environmental Science; IOP Publishing Ltd.: Bristol, UK, 2020; p. 032022. [Google Scholar]
  29. Lin, G.; Jiang, D.; Fu, J.; Zhao, Y. A Review on the Overall Optimization of Production–Living–Ecological Space: Theoretical Basis and Conceptual Framework. Land 2022, 11, 345. [Google Scholar] [CrossRef]
  30. Li, Z.; Fan, L.Y.; Zhang, X.L. Types division of rural multifunction and their evaluation on village scale: A case of Jintan city, Jiangsu province. Resour. Environ. Yangtze Basin 2017, 26, 359–367. [Google Scholar]
  31. Xie, X.; Li, X.; He, W. A land space development zoning method based on resource–environmental carrying capacity: A case study of Henan, China. Int. J. Environ. Res. Public Health 2020, 17, 900. [Google Scholar] [CrossRef] [Green Version]
  32. Zhou, G.; Peng, J. The evolution characteristics and influence effect of spatial conflict: A case study of Changsha-Zhuzhou-Xiangtan urban agglomeration. Prog. Geogr. 2012, 31, 717–723. [Google Scholar]
  33. Nelson, E.; Mendoza, G.; Regetz, J.; Polasky, S.; Tallis, H.; Cameron, D.; Chan, K.M.; Daily, G.C.; Goldstein, J.; Kareiva, P.M. Modeling multiple ecosystem services, biodiversity conservation, commodity production, and tradeoffs at landscape scales. Front. Ecol. Environ. 2009, 7, 4–11. [Google Scholar] [CrossRef]
  34. Zhu, C.; Dong, B.; Li, S.; Lin, Y.; Shahtahmassebi, A.; You, S.; Zhang, J.; Gan, M.; Yang, L.; Wang, K. Identifying the trade-offs and synergies among land use functions and their influencing factors from a geospatial perspective: A case study in Hangzhou, China. J. Clean. Prod. 2021, 314, 128026. [Google Scholar] [CrossRef]
  35. Lyu, Y.; Wang, M.; Zou, Y.; Wu, C. Mapping trade-offs among urban fringe land use functions to accurately support spatial planning. Sci. Total Environ. 2022, 802, 149915. [Google Scholar] [CrossRef] [PubMed]
  36. Gao, J.; Zuo, L. Revealing ecosystem services relationships and their driving factors for five basins of Beijing. J. Geogr. Sci. 2021, 31, 111–129. [Google Scholar] [CrossRef]
  37. Jia, X.; Fu, B.; Feng, X.; Hou, G.; Liu, Y.; Wang, X. The tradeoff and synergy between ecosystem services in the Grain-for-Green areas in Northern Shaanxi, China. Ecol. Indic. 2014, 43, 103–113. [Google Scholar] [CrossRef]
  38. Rana, E.; Thwaites, R.; Luck, G. Trade-offs and synergies between carbon, forest diversity and forest products in Nepal community forests. Environ. Conserv. 2017, 44, 5–13. [Google Scholar] [CrossRef] [Green Version]
  39. Jiang, S.; Meng, J.; Zhu, L. Spatial and temporal analyses of potential land use conflict under the constraints of water resources in the middle reaches of the Heihe River. Land Use Policy 2020, 97, 104773. [Google Scholar] [CrossRef]
  40. Li, Q.; Zhou, Y.; Xu, T.; Wang, L.; Zuo, Q.; Liu, J.; Su, X.; He, N.; Wu, Z. Trade-offs/synergies in land-use function changes in central China from 2000 to 2015. Chin. Geogr. Sci. 2021, 31, 711–726. [Google Scholar] [CrossRef]
  41. Shifa, M.; Mei, M.; Yumei, C. Nomenclature of units for territorial spatial planning. Areal Res. Dev. 2015, 3, 112–117. [Google Scholar]
  42. Zhang, H.; Xu, E.; Zhu, H. An ecological-living-industrial land classification system and its spatial distribution in China. Resour. Sci. 2015, 37, 1332–1338. [Google Scholar]
  43. Liu, Q.; Tian, Y.; Yin, K.; Zhang, F.; Yuan, C.; Yang, G. Spatio-Temporal Pattern of Surface Albedo in Beijing and Its Driving Factors Based on Geographical Detectors. J. Resour. Ecol. 2021, 12, 609–616. [Google Scholar] [CrossRef]
  44. Ji, Z.; Xu, Y.; Huang, A.; Lu, L.; Duan, Y. Spatial Pattern and Evolution Characteristics of the Production-Living-Ecological Space in the Mountainous Area of Northern Hebei Province: A Case Study of Zhangjiakou City. Beijing Da Xue Xue Bao 2022, 58, 123–134. [Google Scholar]
  45. Wang, J.; Xu, C. Geodetector: Principle and prospective. Acta Geogr. Sin. 2017, 72, 116–134. [Google Scholar]
  46. Wang, J.-F.; Hu, Y. Environmental health risk detection with GeogDetector. Environ. Model. Softw. 2012, 33, 114–115. [Google Scholar] [CrossRef]
  47. Wang, Q.; Sun, P.; Liu, X.; Liu, Y. Analysis on spatial -temporal pattern of trade-offs and synergies of "production-living-ecological" function in loss hilly and gully region—A case study of Wushan County. Chin. J. Agric. Resour. Reg. Plan. 2020, 41, 122–130. [Google Scholar]
  48. Anselin, L. A local indicator of multivariate spatial association: Extending Geary’s c. Geogr. Anal. 2019, 51, 133–150. [Google Scholar] [CrossRef]
  49. Anselin, L.; Syabri, I.; Kho, Y. GeoDa: An introduction to spatial data analysis. In Handbook of Applied Spatial Analysis; Springer: Berlin/Heidelberg, Germany, 2010; pp. 73–89. [Google Scholar]
  50. Zhang, J.; Li, S.; Lin, N.; Lin, Y.; Yuan, S.; Zhang, L.; Zhu, J.; Wang, K.; Gan, M.; Zhu, C. Spatial identification and trade-off analysis of land use functions improve spatial zoning management in rapid urbanized areas, China. Land Use Policy 2022, 116, 106058. [Google Scholar] [CrossRef]
  51. Fan, Y.; Gan, L.; Hong, C.; Jessup, L.H.; Jin, X.; Pijanowski, B.C.; Sun, Y.; Lv, L. Spatial identification and determinants of trade-offs among multiple land use functions in Jiangsu Province, China. Sci. Total Environ. 2021, 772, 145022. [Google Scholar] [CrossRef]
  52. Zou, L.; Liu, Y.; Yang, J.; Yang, S.; Wang, Y.; Hu, X. Quantitative identification and spatial analysis of land use ecological-production-living functions in rural areas on China’s southeast coast. Habitat Int. 2020, 100, 102182. [Google Scholar] [CrossRef]
  53. Meybeck, M.; Green, P.; Vörösmarty, C. A new typology for mountains and other relief classes. Mt. Res. Dev. 2001, 21, 34–45. [Google Scholar] [CrossRef] [Green Version]
  54. Gou, M.; Liu, C.; Li, L.; Xiao, W.; Wang, N.; Hu, J. Ecosystem service value effects of the Three Gorges Reservoir Area land use transformation under the perspective of “production-living-ecological” space. J. Appl. Ecol. 2021, 32, 3933–3941. [Google Scholar]
  55. Zhao, Y.; Cheng, J.; Zhu, Y.; Zhao, Y. Spatiotemporal Evolution and Regional Differences in the Production-Living-Ecological Space of the Urban Agglomeration in the Middle Reaches of the Yangtze River. Int. J. Environ. Res. Public Health 2021, 18, 12497. [Google Scholar] [CrossRef]
  56. Peng, J.; Pan, Y.; Liu, Y.; Zhao, H.; Wang, Y. Linking ecological degradation risk to identify ecological security patterns in a rapidly urbanizing landscape. Habitat Int. 2018, 71, 110–124. [Google Scholar] [CrossRef]
  57. Liu, Z.; Gan, X.; Dai, W.; Huang, Y. Construction of an Ecological Security Pattern and the Evaluation of Corridor Priority Based on ESV and the “Importance–Connectivity” Index: A Case Study of Sichuan Province, China. Sustainability 2022, 14, 3985. [Google Scholar] [CrossRef]
  58. Forman, R.T.; Alexander, L.E. Roads and their major ecological effects. Annu. Rev. Ecol. Syst. 1998, 29, 207–231+C2. [Google Scholar] [CrossRef] [Green Version]
  59. Li, M.; Zhang, X.; Wu, J.; Ding, Q.; Niu, B.; He, Y. Declining human activity intensity on alpine grasslands of the Tibetan Plateau. J. Environ. Manag. 2021, 296, 113198. [Google Scholar] [CrossRef]
  60. Chen, C.; Park, T.; Wang, X.; Piao, S.; Xu, B.; Chaturvedi, R.K.; Fuchs, R.; Brovkin, V.; Ciais, P.; Fensholt, R.; et al. China and India lead in greening of the world through land-use management. Nat. Sustain. 2019, 2, 122–129. [Google Scholar] [CrossRef]
  61. Gao, L.; Li, H.; Zhang, X. Historical development and prospect of rural living space research in China. Prog. Geogr. 2020, 39, 660–669. [Google Scholar] [CrossRef]
  62. Zhang, Y.; Jiang, Z.; Li, Y.; Yang, Z.; Wang, X.; Li, X. Construction and Optimization of an Urban Ecological Security Pattern Based on Habitat Quality Assessment and the Minimum Cumulative Resistance Model in Shenzhen City, China. Forests 2021, 12, 847. [Google Scholar] [CrossRef]
  63. Wang, Z.; Shi, P.; Zhang, X.; Tong, H.; Zhang, W.; Liu, Y. Research on Landscape Pattern Construction and Ecological Restoration of Jiuquan City Based on Ecological Security Evaluation. Sustainability 2021, 13, 5732. [Google Scholar] [CrossRef]
  64. Gómez-Baggethun, E.; Barton, D.N. Classifying and valuing ecosystem services for urban planning. Ecol. Econ. 2013, 86, 235–245. [Google Scholar] [CrossRef]
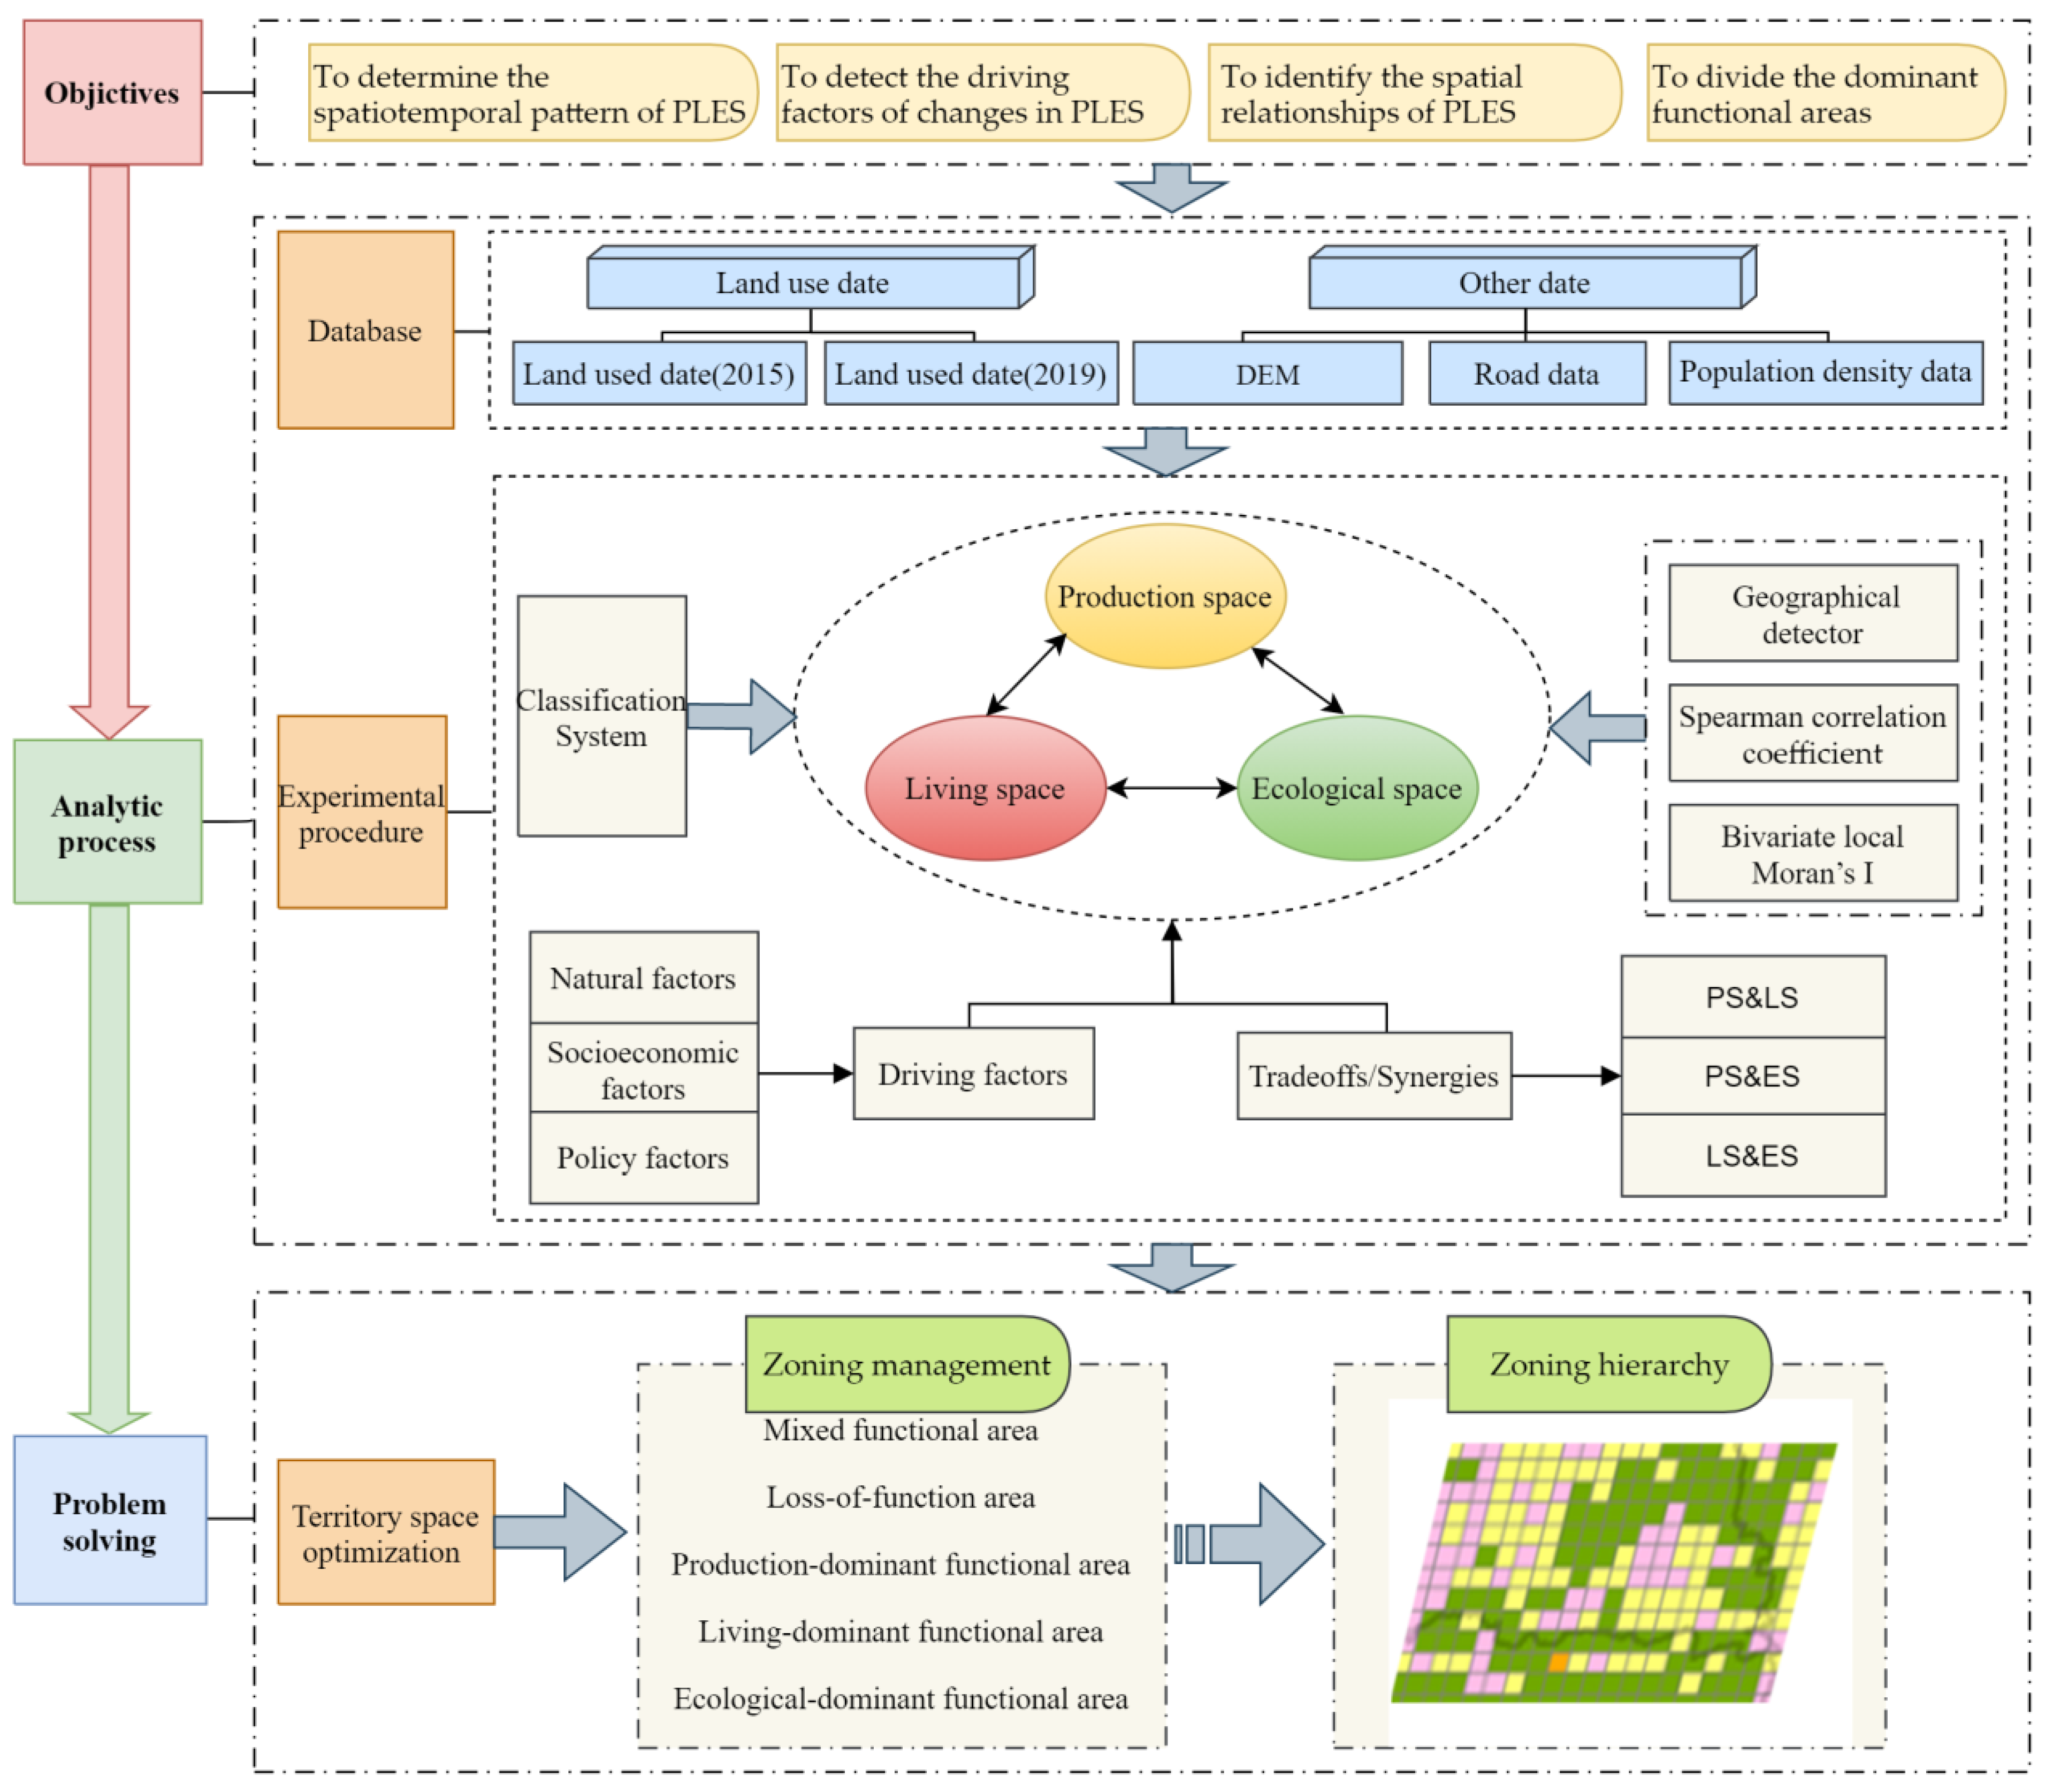
Figure 1. Workflow of this study.
Sustainability 14 08910 g001
Figure 2. Location, administrative divisions, and elevation of Longli County.
Sustainability 14 08910 g002
Figure 3. The spatial functional areas and zoning scheme. PL: production space and living space; PE: production space and ecological space; LE: living space and ecological space; PS: production space; LS: living space; ES: ecological space.
Sustainability 14 08910 g003
Figure 4. The spatiotemporal pattern of and changes in production space. (a) 2015; (b) 2019; (c) 2015–2019.
Sustainability 14 08910 g004
Figure 5. The spatiotemporal pattern of and changes in living space. (a) 2015; (b) 2019; (c) 2015–2019.
Sustainability 14 08910 g005
Figure 6. The spatiotemporal pattern of and changes in ecological space. (a) 2015; (b) 2019; (c) 2015–2019.
Sustainability 14 08910 g006
Figure 7. The degree of correlation between the driving factors of the changes in PS, LS, and ES. X1: distance to town; X2: distance to the provincial capital; X3: distance to the main road; X4: population density; X5: elevation; X6: slope; X7: distance to the ecological red line; X8: distance to water.
Sustainability 14 08910 g007
Figure 8. The spatial relationships of PS, LS, and ES. (a) The relationship between PS and LS; (b) the relationship between PS and ES; (c) the relationship between LS and ES.
Sustainability 14 08910 g008
Figure 9. The spatial functional areas of PLES in Longli County.
Sustainability 14 08910 g009
Table 1. Land use classification system and functional scores of PS, LS, and ES.
Land Type ILand Type IIProductionLivingEcological
Arable landPaddy field303
Irrigable land303
Dry land303
GardenOrchard303
Tea garden303
Other garden303
WoodlandForestland005
Shrub land005
Other forestland005
GrasslandNatural grass105
Artificial grass105
Other grass005
Land for transportationLand for railway500
Street land500
Rural road510
Pipe land500
Land of water areas and for water conservancy facilitiesRiver005
Reservoir001
Pond101
Inland tidal flat005
Ditch101
Water construction land500
Other landFacilities for agricultural land300
Sand001
Bare land001
Urban village and industrial and mining landCity or town550
Village350
Mining lease510
Land of scenic spots and special land330
Table 2. Driving factors of the changes in PLES and their meaning.
Factor TypeCodeFactorFactor Meaning
Socioeconomic factorsX1Distance to townStraight-line distance from each unit to the town center
X2Distance to the provincial capitalStraight-line distance from each unit to the provincial city center
X3Distance to the main roadStraight-line distance from each unit to the main road
X4Population densityAverage population density in each unit
Natural factorsX5ElevationAverage elevation in each unit
X6SlopeAverage slope in each unit
X7Distance to the ecological red lineStraight-line distance from each unit to the ecological conservation sites
X8Distance to waterStraight-line distance from each unit to the water area
Table 3. The changes in the PS, LS, and ES scores.
201520192015–2019Rate of Change
Total PS score5289.6496064.295↑ 774.64614.64%
Total LS score617.9141010.318↑ 392.40363.50%
Total ES score28,227.58527,383.823↓ 843.762−2.99%
Note: ↑ denotes increase; ↓ denotes decrease.
Table 4. The Spearman correlation coefficients of PLES in 2019. PS: production space; LS: living space; ES: ecological space.
PSLSES
PS1
LS0.736 **1
ES−0.956 **−0.758 **1
Note: ** Significant at the 99% confidence level.
Publisher’s Note: MDPI stays neutral with regard to jurisdictional claims in published maps and institutional affiliations.