
Scenario Analysis of Energy-Related CO2 Emissions from Current Policies: A Case Study of Guangdong Province

Abstract
:1. Introduction

| Study | Possible Peak Time | Research Model | Study Method | Scenario Analysis | Ref. |
|---|---|---|---|---|---|
| Provincial Level | |||||
| Taiwan | - | Bottom-up | LEAP | √ | [16] |
| Shanxi | 2029–2030 | Top-down | IO-SDA | √ | [22] |
| Jilin | 2025–2045 | Bottom-up | LEAP | √ | [17] |
| Henan | 2035–2040 | Top-down | STIRPAT | √ | [20] |
| Beijing-Tianjin-Hebei | 2029–2045 | Top-down | STIRPAT | √ | [19] |
| Yunnan | 2024–2028 | Top-down | STIRPAT | - | [14] |
| Bottom-up | LEAP | √ | |||
| Xinjiang | After 2030 | Top-down | STIRPAT | √ | [21] |
| City Level | |||||
| Beijing | – | System dynamics model | Beijing-STELLA | - | [15] |
| Beijing | – | Bottom-up | LEAP | √ | [25] |
| Beijing | 2019 | Top-down | Kaya | - | [26] |
| Kunming | 2021–2028 | Top-down | STIRPAT | √ | [27] |
| Guangzhou | 2020 | Bottom-up | Scenario analysis | √ | [28] |
| Chongqing | 2032–2035 | Hybrid | LMDI and STRPAT | √ | [23] |
| Qingdao | 2020–2025 | Top-down | STIRPAT | √ | [29] |
| Xiamen | 2034–2039 a | Bottom-up | LEAP | √ | [7] |
| Baoding | 2024 | Hybrid | LMDI and BP neural network model | √ | [24] |
| Shanghai | 2025 | Hybrid | LMDI and System dynamic model | √ | [18] |
2. Historical Energy-Related Carbon Emissions and Related Policies
2.1. Historical Energy-Related Carbon Emissions
2.2. Development Planning and Low-Carbon Policies
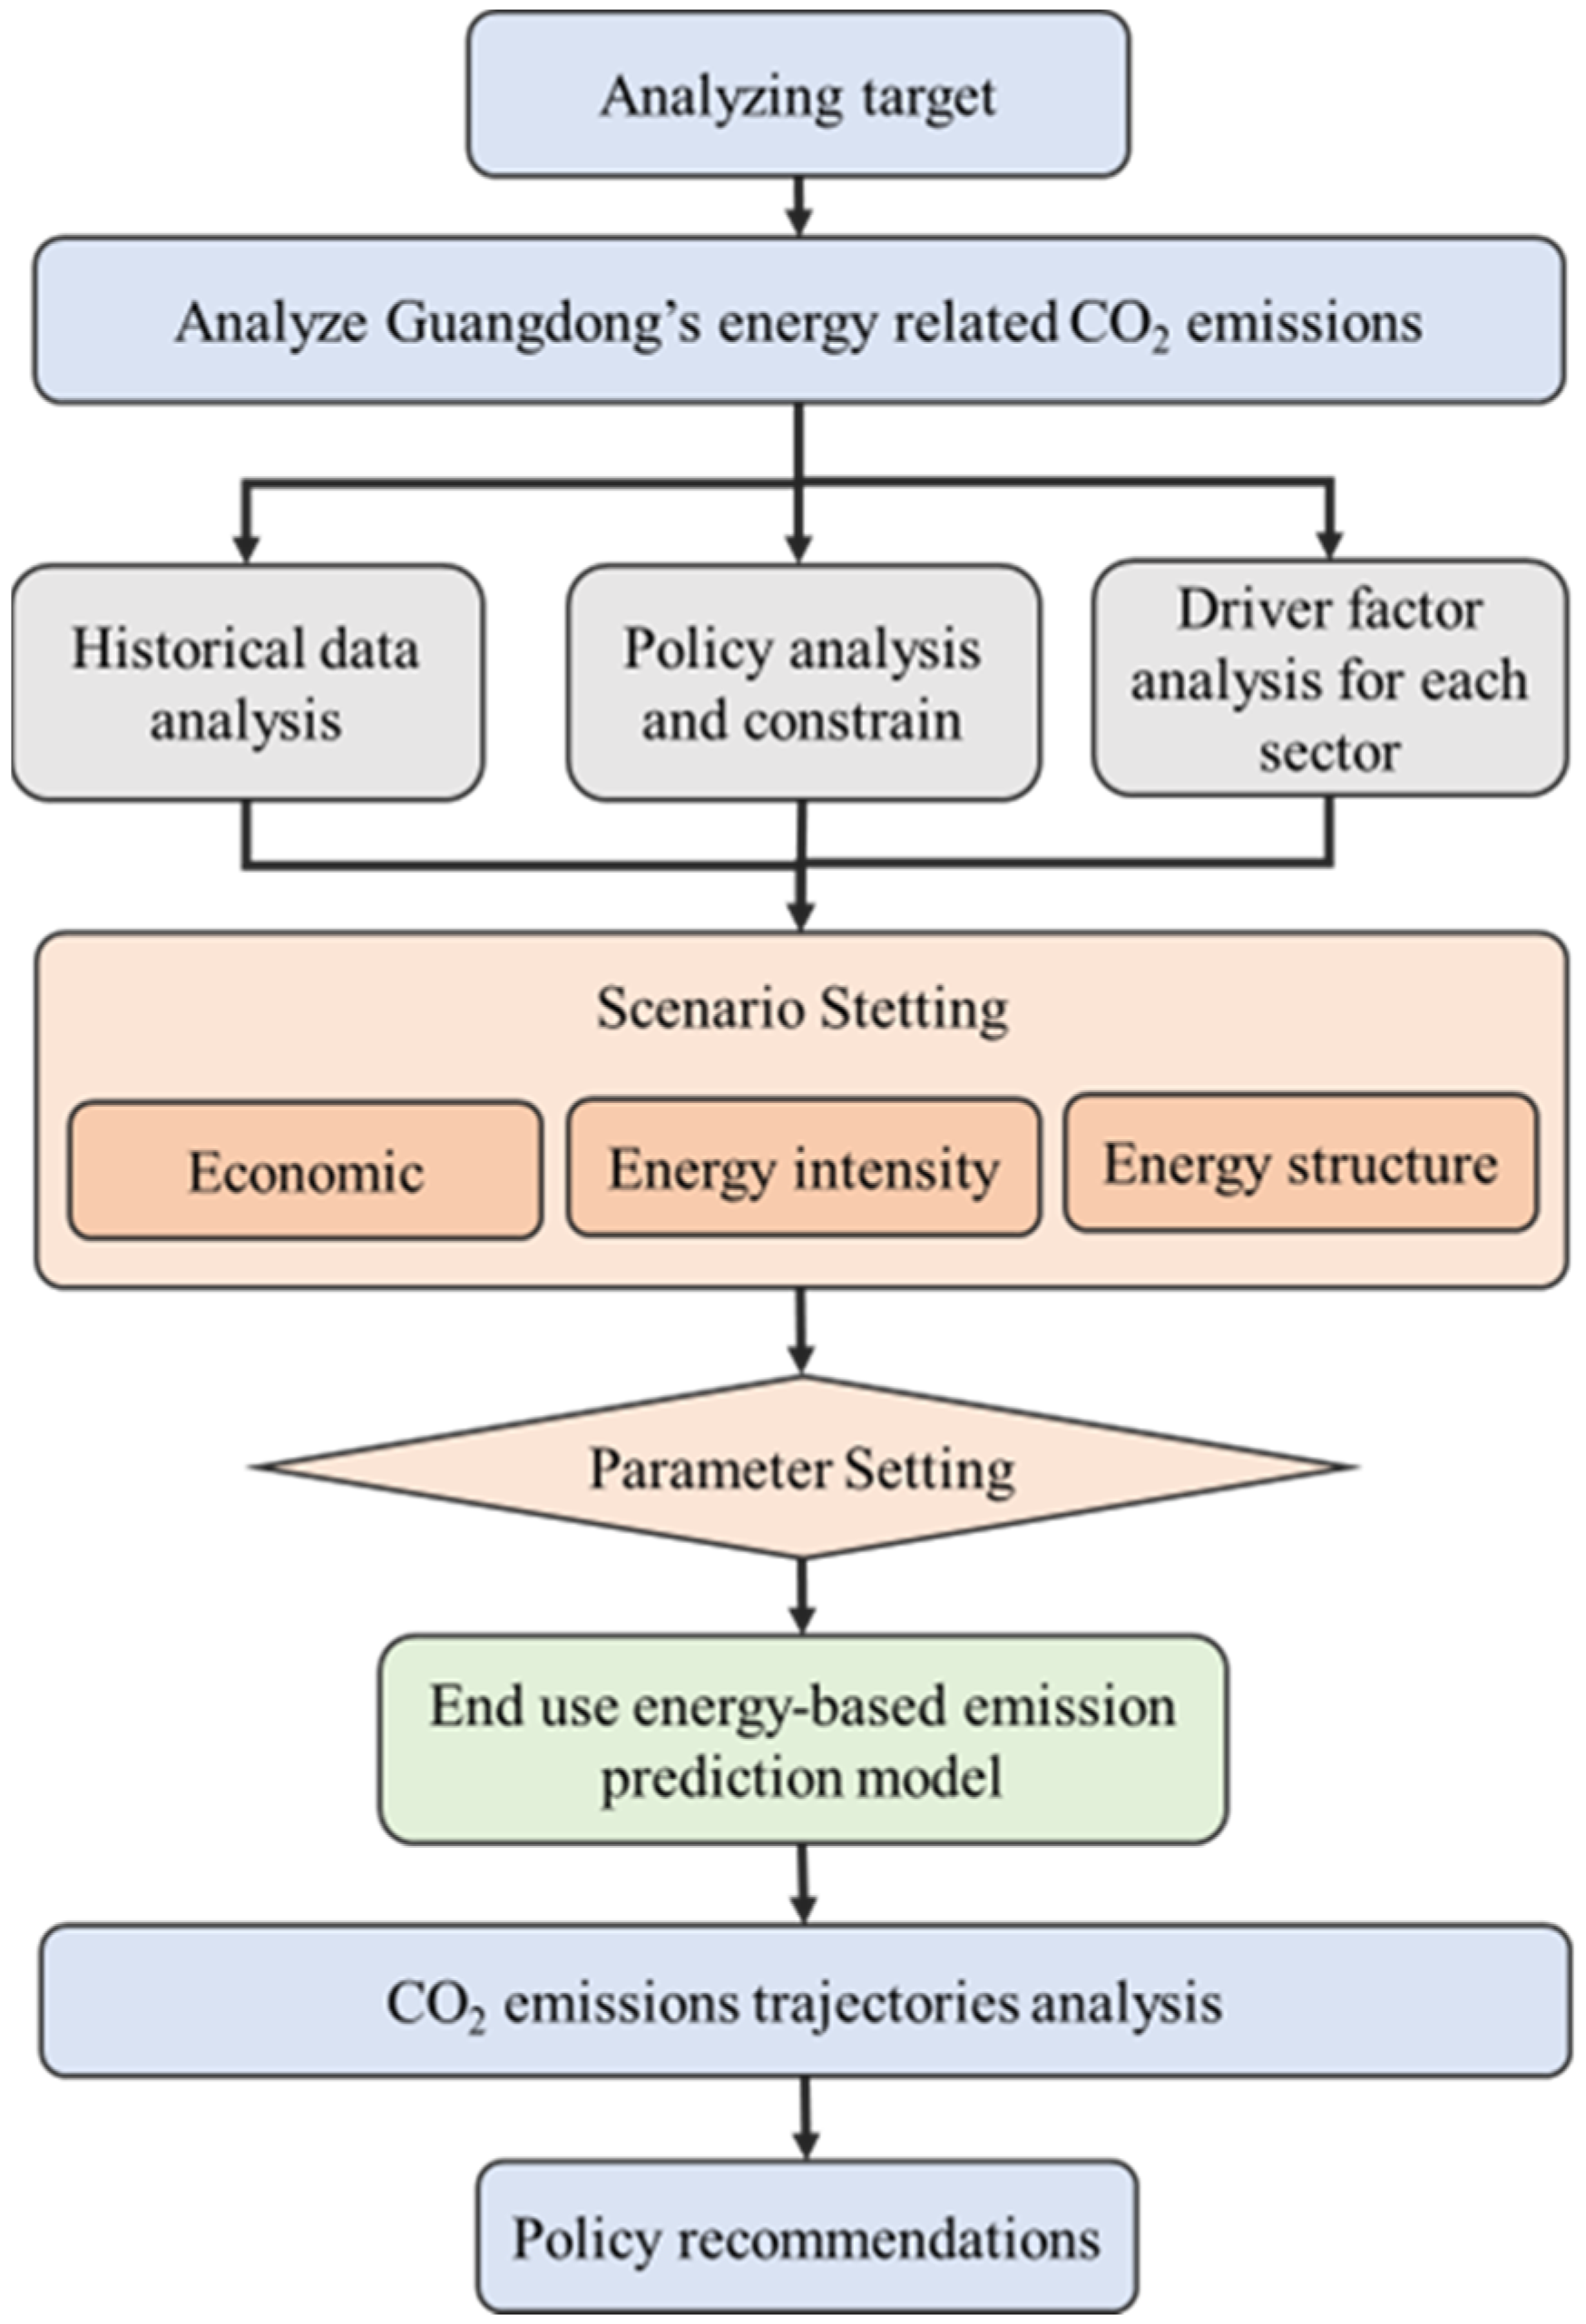
3. Methodology
3.1. Scenario Examined
3.2. Analysis of Sectoral Drivers
3.2.1. Residential Sector
3.2.2. Agricultural Sector
3.2.3. Industrial Sector
3.2.4. Construction Sector
3.2.5. Transport Sector
3.2.6. Services Sector and Others
3.3. Calculation of CO2 Emissions
4. Results
4.1. Trajectories of Energy-Related Carbon Emissions and Peak Time
4.2. Carbon Emissions by Sectors
4.3. Carbon Emissions by Energy Type
5. Discussions
5.1. Impact of Accelerating Wind Power Projects
5.2. Impact of CO2 Emission Factor of Imported Electricity
5.3. Results Comparison
5.4. Policy Recommendation for Carbon Peak before 2030
6. Conclusions
Author Contributions
Funding
Institutional Review Board Statement
Informed Consent Statement
Data Availability Statement
Conflicts of Interest
Abbreviations
| AW | Accelerating the wind | GDP | Gross domestic production |
| H | High | HM | High-energy-consuming manufacturing |
| IO-SAD | Input-output Structural Decomposition Analysis | L | Low |
| LEAP | Low Emissions Analysis Platform | LLM | Labor-intensive low-energy-consuming manufacturing |
| LM | Low-energy-consuming manufacturing | LMDI | Long-mean divisia index |
| M | Medium | MM | Medium-energy-consuming manufacturing |
| S | Strength | ||
| STIRPAT | Stochastic impacts by regression on population, affluence, and technology | W | Weak |
| Nomenclature | |||
| A | Energy consumption | Cd | Direct CO2 emissions |
| Ci | Indirect CO2 emissions | Cp | Emissions from the residential sector |
| Cr | Emissions from production sectors | EF | The emission factor of electricity |
| F | The emission factor of fossil energy | Gross product | |
| Energy consumption per unit of added value | I | The capacity of input electricity | |
| P | population | Energy consumption per capita | |
| r | Increase rate | ||
Appendix A
| Category | Sub-Industries |
|---|---|
| high-energy-consuming manufacturing (HM) | Non-metallic mineral products industry; ferrous metal smelting and rolling processing industry; non-ferrous metal smelting and rolling processing industry; petroleum processing, coking, and nuclear fuel processing industry; chemical raw materials and chemical products manufacturing industry. |
| medium-energy-consuming manufacturing (MM) | Paper and paper products industry; chemical fiber manufacturing industry; textile industry; rubber and plastic products industry; wood processing and wood, bamboo, rattan, palm, and grass products industry; agricultural and sideline food processing industry. |
| Labor-intensive low-energy-consuming manufacturing (LLM) | Furniture manufacturing; textiles and garments; apparel, culture, education, art, sports and entertainment products manufacturing; leather, fur, feathers, and their products, and footwear. |
| low-energy-consuming manufacturing (LM). | Food manufacturing industry; wine, beverage, and refined tea manufacturing industry; tobacco product industry; printing and recording media reproduction industry; pharmaceutical manufacturing industry; equipment manufacturing industry; automobile manufacturing industry; railway, ship, aerospace, and other transportation equipment manufacturing; electrical machinery and equipment manufacturing; computer, communications, and other electronic equipment manufacturing; instrumentation manufacturing; comprehensive utilization of waste resources; metal products, machinery and equipment repairing, etc. |
References
- IPCC. Global Warming of 1.5 °C. 2019. Available online: https://www.ipcc.ch/sr15/ (accessed on 2 April 2021).
- Energy and Climate Intelligence Unit, Net Zero Scorecard. 2020. Available online: https://eciu.net/netzerotracker (accessed on 2 June 2022).
- Qiang, L.; Gu, A.; Teng, F.; Song, R.; Chen, Y. Peaking China’s CO2 Emissions: Trends to 2030 and Mitigation Potential. Energies 2017, 10, 209. [Google Scholar]
- U.S.–China Joint Announcement on Climate Change. The U.S. White House Office of the Press Secretary. 2014. Available online: http://www.whitehouse.gov/the-press-office/2014/11/11/us-china-joint-announcement-climate-change (accessed on 2 April 2021).
- Enhanced Actions on Climate Change: China’s Intended Nationally Determined Contribution. 2015. Available online: http://www.china.org.cn/environment/2015-06/30/content_35950951.htm (accessed on 2 April 2021).
- China’s Policies and Actions for Addressing Climate Change. Ministry of Ecology and Environment of the People’s Republic of China. 2019. Available online: https://www.mee.gov.cn/ywdt/hjnews/201911/W020191127531889208842.pdf (accessed on 2 April 2021).
- Jian, Y.; Kang, J.; Khanna, N.; Shi, L.; Zhao, X.; Liao, J. Scenario analysis of urban GHG peak and mitigation co-benefits: A case study of Xiamen City, China. J. Clean. Prod. 2018, 171, 972–983. [Google Scholar]
- Michael, G.; Sha, F.; Thomas, S.; Nick, H.; Zhang, Z.; Paolo, A. A review of Chinese CO2 emission projections to 2030: The role of economic structure and policy. Clim. Policy 2015, 15, S7–S39. [Google Scholar]
- Zhou, N.; Price, L.; Yande, D.; Creyts, J.; Khanna, N.; Fridley, D.; Lu, H.; Feng, W.; Liu, X.; Hasanbeigi, A.; et al. A roadmap for China to peak carbon dioxide emissions and achieve a 20% share of non-fossil fuels in primary energy by 2030. Appl. Energy 2019, 239, 793–819. [Google Scholar] [CrossRef]
- Mischke, P.; Karlsson, K.B. Modelling tools to evaluate China’s future energy system—A review of the Chinese perspective. Energy 2014, 69, 132–143. [Google Scholar] [CrossRef] [Green Version]
- Jiang, J.; Ye, B.; Liu, J. Peak of CO2 emissions in various sectors and provinces of China: Recent progress and avenues for further research. Renew. Sustain. Energy Rev. 2019, 112, 813–833. [Google Scholar] [CrossRef]
- Shan, Y.; Liu, J.; Xu, X.; Shao, S.; Wang, P.; Guan, D. New provincial CO2 emission inventories in China based on apparent energy consumption data and updated emission factors. Appl. Energy 2016, 184, 742–750. [Google Scholar] [CrossRef] [Green Version]
- Liu, Z.; Guan, D.; Moore, S.; Lee, H.; Su, J.; Zhang, Q. Climate policy: Steps to China’s carbon peak. Nature 2015, 522, 279–281. [Google Scholar] [CrossRef] [Green Version]
- Zhang, X.; Chen, Y.; Jiang, P.; Liu, L.; Xu, X.; Xu, Y. Sectoral peak CO2 emission measurements and a long-term alternative CO2 mitigation roadmap: A case study of Yunnan, China. J. Clean. Prod. 2019, 247, 119171. [Google Scholar] [CrossRef]
- Feng, Y.; Chen, S.; Zhang, L. System dynamics modeling for urban energy consumption and CO2 emissions: A case study of Beijing, China. Ecol. Model. 2013, 252, 44–52. [Google Scholar] [CrossRef]
- Huang, Y.; Bor, Y.J.; Peng, C.Y. The long-term forecast of Taiwan’s energy supply and demand: LEAP model application. Energy Policy 2011, 39, 6790–6803. [Google Scholar] [CrossRef]
- Tian, L.; Ding, Z.; Wang, Y.; Duan, H.; Wang, S. Analysis of the driving factors and contributions to carbon emissions of energy consumption from the perspective of the peak volume and time based on LEAP. Sustainability 2016, 8, 513. [Google Scholar] [CrossRef] [Green Version]
- Gu, S.; Fu, B.; Thriveni, T.; Fujita, T.; Ji, W. Coupled LMDI and system dynamics model for estimating urban CO2 emission mitigation potential in Shanghai, China. J. Clean. Prod. 2019, 240, 118034. [Google Scholar] [CrossRef]
- Wen, L.; Yiu, Y. The peak value of carbon emissions in the Beijing-Tianjin-Hebei region based on the STIRPAT model and scenario design. J. Environ. Stud. 2016, 25, 823–834. [Google Scholar]
- Zhao, R.; Liu, W.; Liu, Y.; Ding, M.; Zhang, Z.; Wang, J. Prediction of carbon emission peak value of Henan Province based on carbon budget estimation. Bull. Soil Water Conserv. 2016, 36, 78–89. [Google Scholar]
- Qin, J.; Tao, H.; Zhan, M.; Munir, Q.; Brindha, K.; Mu, G. Scenario analysis of carbon emissions in the energy base, Xinjiang Autonomous Region, China. Sustainability 2019, 11, 4220. [Google Scholar] [CrossRef] [Green Version]
- Feng, Z.; Wang, A. Research on decomposition of carbon emission factors and prediction of carbon peak in Shaanxi Province. J. Southwest Minzu Univ. 2016, 8, 112–119. [Google Scholar]
- Liu, Q.; Li, Q.; Zheng, X. The prediction of carbon dioxide emissions in Chongqing based on fossil fuel combustion. Huanjing Kexue Xuebao/Acta Sci. Circumst. 2017, 37, 1582–1593. [Google Scholar]
- Zhang, Y.; Liu, C.; Chen, L.; Wang, X.; Song, X.; Li, K. Energy-related CO2 emission peaking target and pathways for China’s city: A case study of Baoding City. J. Clean. Prod. 2019, 226, 471–481. [Google Scholar] [CrossRef]
- Yu, H.; Pan, S.; Tang, B.; Mi, Z.; Zhang, Y.; Wei, Y. Urban energy consumption and CO2 emissions in Beijing: Current and future. CEEP-BIT Work. Pap. 2015, 8, 527–543. [Google Scholar] [CrossRef] [Green Version]
- Yang, X.; Lin, F.; Ding, D. Issues on regional CO2 emission peak measurement: Taking Beijing as an example. China Popul. Resour. Environ. 2015, 25, 39–44. [Google Scholar]
- Xu, X. CO2 emission peak prediction of Kunming. Environ. Sci. Surv. 2015, 34, 47–52. [Google Scholar]
- Sun, W.; Yu, Z.; Liao, C. Analysis of Carbon Emission Peak in Guangzhou. Adv. New Renew. Energy 2016, 4, 246–252. [Google Scholar]
- Wu, C.; Huang, G.; Xin, B.; Chen, J. Scenario analysis of carbon emissions’ anti-driving effect on Qingdao’s energy structure adjustment with an optimization model, Part I: Carbon emissions peak value prediction. J. Clean. Prod. 2018, 172, 466–474. [Google Scholar] [CrossRef]
- Ping, W.; Wu, W.; Zhu, B.; Wei, Y. Examining the impact factors of energy-related CO2 emissions using the STIRPAT model in Guangdong Province, China. Appl. Energy 2013, 106, 65–71. [Google Scholar]
- Zhou, Y.; Shan, Y.; Liu, G.; Guan, D. Emissions and low-carbon development in Guangdong-Hong Kong-Macao Greater Bay Area cities and their surroundings. Appl. Energy 2018, 228, 1683–1692. [Google Scholar] [CrossRef] [Green Version]
- Lin, J.; Kahrl, F.; Yuan, J.; Chen, Q.; Liu, X. Economic and carbon emission impacts of electricity market transition in China: A case study of Guangdong Province. Appl. Energy 2019, 238, 1093–1107. [Google Scholar] [CrossRef]
- Li, X.; Li, Y. A multi-scenario ensemble simulation and environmental input-output model for identifying optimal pollutant- and CO2 -emission mitigation scheme of Guangdong province. J. Clean. Prod. 2020, 262, 121413. [Google Scholar] [CrossRef]
- Feng, F.; Bai, C. Research on the forecasting of energy demand and paths of carbon emissions reaching peak of Guangdong Province: Based on the hybrid-units energy input-output model. Urban Environ. Stud. 2019, 2, 8–27. [Google Scholar]
- Guangdong Provincial Bureau of Statistics. Guangdong Statistical Yearbook. 2019. Available online: http://stats.gd.gov.cn/gdtjnj/content/post_2639622.html (accessed on 20 July 2021).
- The Fourteenth Five-Year Plan for the National Economic and Social Development of Guangdong Province and the Outline of the Long-Term Goals for 2035. 2021. Available online: http://www.gd.gov.cn/zwgk/wjk/qbwj/yf/content/post_3268751.html (accessed on 20 July 2021).
- Comprehensive Development Plan for the Coastal Economic Zone of Guangdong Province (2017–2030). 2017. Available online: http://www.gd.gov.cn/gkmlpt/content/0/146/post_146463.html#7 (accessed on 20 July 2021).
- Population Development Plan of Guangdong Province (2017–2030). 2018. Available online: http://www.gd.gov.cn/gkmlpt/content/0/146/post_146685.html#7 (accessed on 20 July 2021).
- The Offshore Wind Power Development Plan of Guangdong Province (2017–2030). 2018. Available online: http://drc.gd.gov.cn/gkmlpt/content/1/1060/post_1060661.html#876 (accessed on 20 July 2021).
- Provincial Energy Key Construction Project Schedule. 2021. Available online: http://drc.gd.gov.cn/ywtz/content/post_3253184.html (accessed on 20 July 2021).
- The 5G Base Station and Data Center Overall Layout Plan of Guangdong Province (2021–2025). 2020. Available online: http://gdii.gd.gov.cn/gkmlpt/content/3/3245/post_3245303.html#906 (accessed on 20 July 2021).
- Action Plan for Cultivating Strategic Emerging Industry Clusters of Semiconductors and Integrated Circuits of Guangdong Province (2021–2025). 2020. Available online: http://gdii.gd.gov.cn/zcjd3267/content/post_3095717.html (accessed on 20 July 2021).
- Action Plan for Cultivating New Energy Industry Clusters of Guangdong Province (2021–2025). 2020. Available online: http://www.gd.gov.cn/zwgk/zcjd/snzcsd/content/post_3097979.html (accessed on 20 July 2021).
- ‘1 + 20’ Strategic Industrial Cluster Policy Document. 2020. Available online: http://www.gd.gov.cn/zwgk/wjk/qbwj/yfh/content/post_2997541.html (accessed on 20 July 2021).
- The 14th Five-Year Development Plan for the Construction Industry of Guangdong Province (Draft for Public Comments). 2021. Available online: http://zfcxjst.gd.gov.cn/xxgk/wjtz/content/post_3754438.html (accessed on 20 July 2021).
- Guidelines for the Preparation of Provincial CO2 Emission Peaking Action Plans. 2020. Available online: https://wenku.baidu.com/view/166e1405e1bd960590c69ec3d5bbfd0a7956d5fb.html (accessed on 20 July 2021).
- Statista, Growth Rate of Real Gross Domestic Product (GDP) in China from 2010 to 2020 with Forecasts until 2026. Available online: https://www.statista.com/statistics/263616/gross-domestic-product-gdp-growth-rate-in-china/ (accessed on 20 July 2021).
- The Medium and Long-Term Goals, Strategies, and Paths of China’s Economic and Social Development. National Information Center. 2020. Available online: https://www.efchina.org/Reports-zh/report-lceg-20210207-4-zh (accessed on 20 July 2021).
- International Engyer Agency (IEA). World Energy Statistics. 2013. Available online: https://www.iea.org/reports/world-energy-outlook-2013 (accessed on 20 July 2021).
- Zhou, N.; Fridley, D.; McNeil, M.; Zeng, N.; Ke, J.; Levine, M.; Khanna, N. China’s Energy and Carbon Emissions Outlook to 2050; Lawrence Berkeley National Laboratory: Berkeley, CA, USA, 2012.
- Guangdong 2035: Development Trends and Strategies; Social Sciences Academic Press: Beijing, China, 2018.
- China Electricity Council. China Electricity Statistical Yearbook; China Statistics Press: Beijing, China, 2020. [Google Scholar]


| Items | Planning/Policies | Key Target | Ref. |
|---|---|---|---|
| Economic and Social | Outline of the 14th Five-year Plan for National Economic and Social Development in Guangdong Province and the 2035 Long-range Goals | The province’s GDP will grow at an average annual rate of about 5.0%, and the GDP will be about 14 trillion CNY by 2025. | [36] |
| Comprehensive Development Plan for the Coastal Economic Zone of Guangdong Province (2017–2030) | The region’s GDP will grow at 7% and 6.5% in 2025 and 2030, and the GDP will be about 17.7 trillion CNY by 2030. | [37] | |
| Population Development Plan of Guangdong Province (2017–2030) | The total permanent population of Guangdong Province will be around 120 million in 2025 and around 125 million in 2030. | [38] | |
| Energy | Outline of the 14th Five-year Plan for National Economic and Social Development in Guangdong Province and the 2035 Long-range Goals | The proportion of coal consumption will decrease to 31% in primary energy consumption, with natural gas, renewable and nuclear energy accounting for 14%, 22%, and 7%, respectively by 2025. | [36] |
| The Offshore Wind Power Development Plan of Guangdong Province (2017–2030) | The installed capacity of offshore wind power will be about 30 million kW by the end of 2030. | [39] | |
| 2021 Provincial Energy Key Construction Project Schedule | Involving the new and continued construction of offshore wind power, nuclear power, thermal power, and photovoltaic power projects. | [40] | |
| Industry | The 5G base station and data center overall layout plan of Guangdong Province (2021–2025) | The number of 5G-base stations will be up to 660,000 by the end of 2025; Complete 6 data center clusters and around 1 million standard racks with an average design PUE value of less than 1.3 and annual energy consumption of less than 20 million MWh. | [41] |
| Action Plan for Cultivating Strategic Emerging Industry Clusters of Semiconductors and Integrated Circuits of Guangdong Province (2021–2025) | The annual main business revenue will exceed 400 billion CNY, with an average annual growth rate of more than 20%. | [42] | |
| Action Plan for Cultivating New Energy Industry Clusters of Guangdong Province (2021–2025) | The proportion of non-fossil energy consumption will be around 30% by 2025; the installed capacity of new energy power generation will reach 60.5 million kW by 2025; build about 3600 charging stations and 300 hydrogen refueling stations by 2025. | [43] | |
| ‘1 + 20’ Strategic Industrial Cluster Policy Document | Proposed 20 strategic industrial cluster action plans from 2021 to 2025 | [44] | |
| Construction | The ‘14th Five-Year’ Development Plan for the Construction Industry of Guangdong Province (Draft for public comments) | Implement the carbon peak plan for the construction sector. | [40] |
| Study | Study Period | Method | Scenario Analysis | Research Object |
|---|---|---|---|---|
| Wang et al. [30] | 1980–2010 | Top-down | N. | Examining the impact factors of energy-related CO2 emissions in Guangdong Province. |
| Zhou et al. [31] | 2000–2016 | Bottom-up | N. | Accounting energy-related CO2 for Guangdong-Hongkong-Macao Greater Bay area based on IPCC territorial accounting method. |
| Li et al. [33] | 2020–2030 | Top-down | √ | Identify optimized pollutant and CO2 emission-reduction schemes from different perspectives for Guangdong Province. |
| Feng et al. [34] | 2016–2040 | Top-down | √ | Predicting the energy consumption and CO2 emissions of Guangdong Province. |
| This study | 2020–2035 | Bottom-up | √ | Examining the energy-related CO2 emissions of Guangdong Province by taking into consideration of the current policy of Guangdong Province. |
| Factors | Parameters | Development Levels | Increase Rate | ||
|---|---|---|---|---|---|
| 2021–2025 | 2026–2030 | 2031–2035 | |||
| Economic development [36,47,48] | GDP | Low (L) | 5.10% | 4.03% | 3.10% |
| Medium (M) | 5.30% | 4.26% | 3.28% | ||
| High (H) | 5.50% | 4.40% | 3.39% | ||
| Energy intensity [35] | Energy consumption per unit of added value | Weak (W) | Remain the same level as in the year 2020 | ||
| Medium (M) | −2.43% | −2.29% | −1.95% | ||
| Strength (S) | −2.65% | −2.54% | −2.18% | ||
| Energy consumption per capita | Weak (W) | 3.4% | 3.2% | 3.0% | |
| Medium (M) | 3.1% | 3.0% | 2.8% | ||
| Strength (S) | 2.6% | 2.5% | 2.3% | ||
| Energy structure [49] | The proportion of each fuel type | Weak (W) | Remain the same proportion as in 2019 | ||
| Medium (M) | Keep the same optimization rate as from 2013 to 2019 | ||||
| Strength (S) | Refer to the terminal energy structure of Germany in 2012 | ||||
Publisher’s Note: MDPI stays neutral with regard to jurisdictional claims in published maps and institutional affiliations. |
© 2022 by the authors. Licensee MDPI, Basel, Switzerland. This article is an open access article distributed under the terms and conditions of the Creative Commons Attribution (CC BY) license (https://creativecommons.org/licenses/by/4.0/).
Share and Cite
Wang, J.; Liu, A. Scenario Analysis of Energy-Related CO2 Emissions from Current Policies: A Case Study of Guangdong Province. Sustainability 2022, 14, 8903. https://doi.org/10.3390/su14148903
Wang J, Liu A. Scenario Analysis of Energy-Related CO2 Emissions from Current Policies: A Case Study of Guangdong Province. Sustainability. 2022; 14(14):8903. https://doi.org/10.3390/su14148903
Chicago/Turabian StyleWang, Junyao, and Anqi Liu. 2022. "Scenario Analysis of Energy-Related CO2 Emissions from Current Policies: A Case Study of Guangdong Province" Sustainability 14, no. 14: 8903. https://doi.org/10.3390/su14148903
APA StyleWang, J., & Liu, A. (2022). Scenario Analysis of Energy-Related CO2 Emissions from Current Policies: A Case Study of Guangdong Province. Sustainability, 14(14), 8903. https://doi.org/10.3390/su14148903