
Determining the Level of Use of the Industry 4.0 Solutions in the COVID-19 Pandemic Era: Results of Empirical Research


Abstract
:1. Introduction
Study Target
2. Literature Review
3. Materials and Methods
3.1. Sample and Data Collection
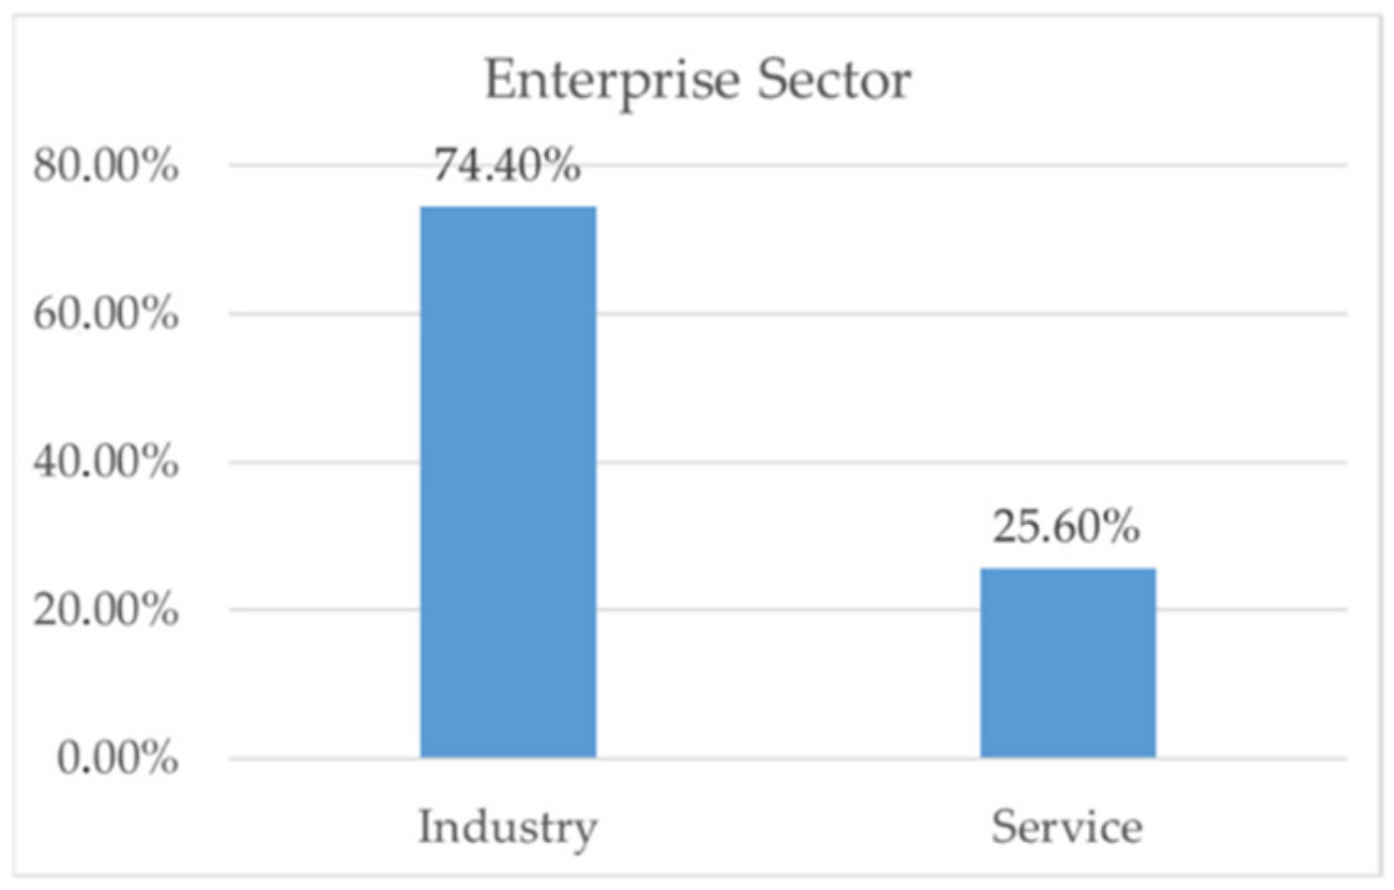
3.2. Structure of the Research Group
3.3. Measures
4. Results
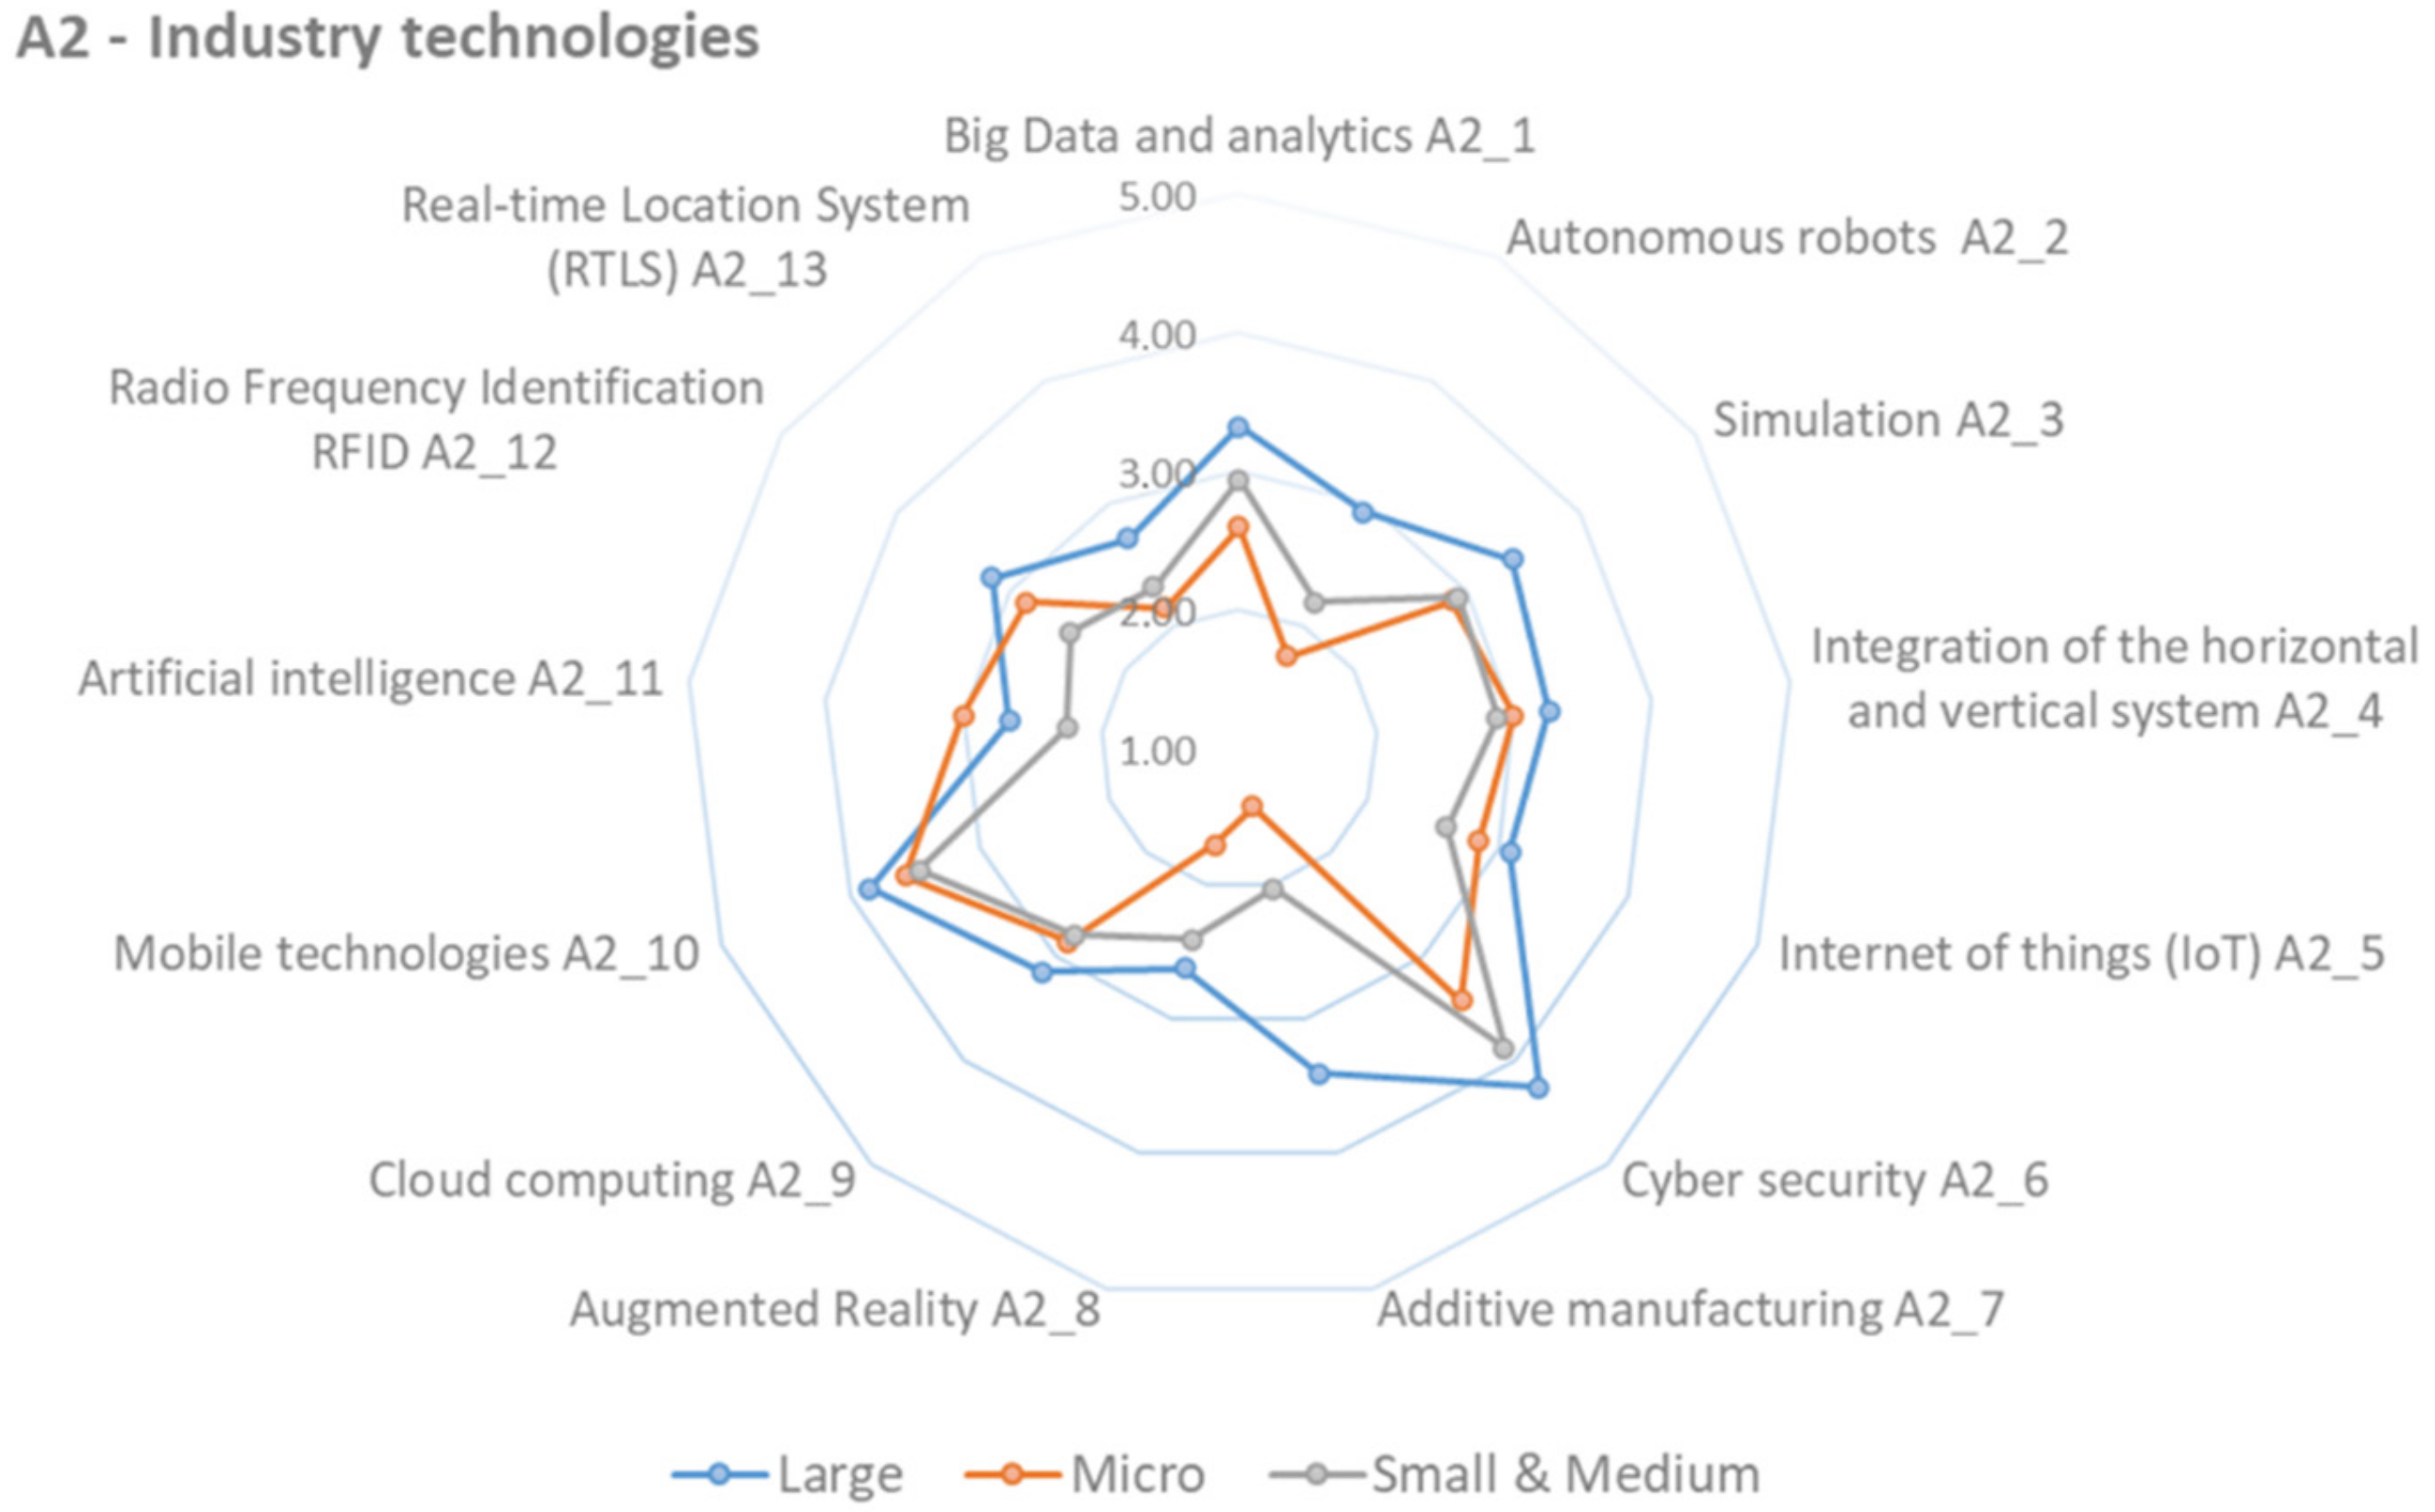
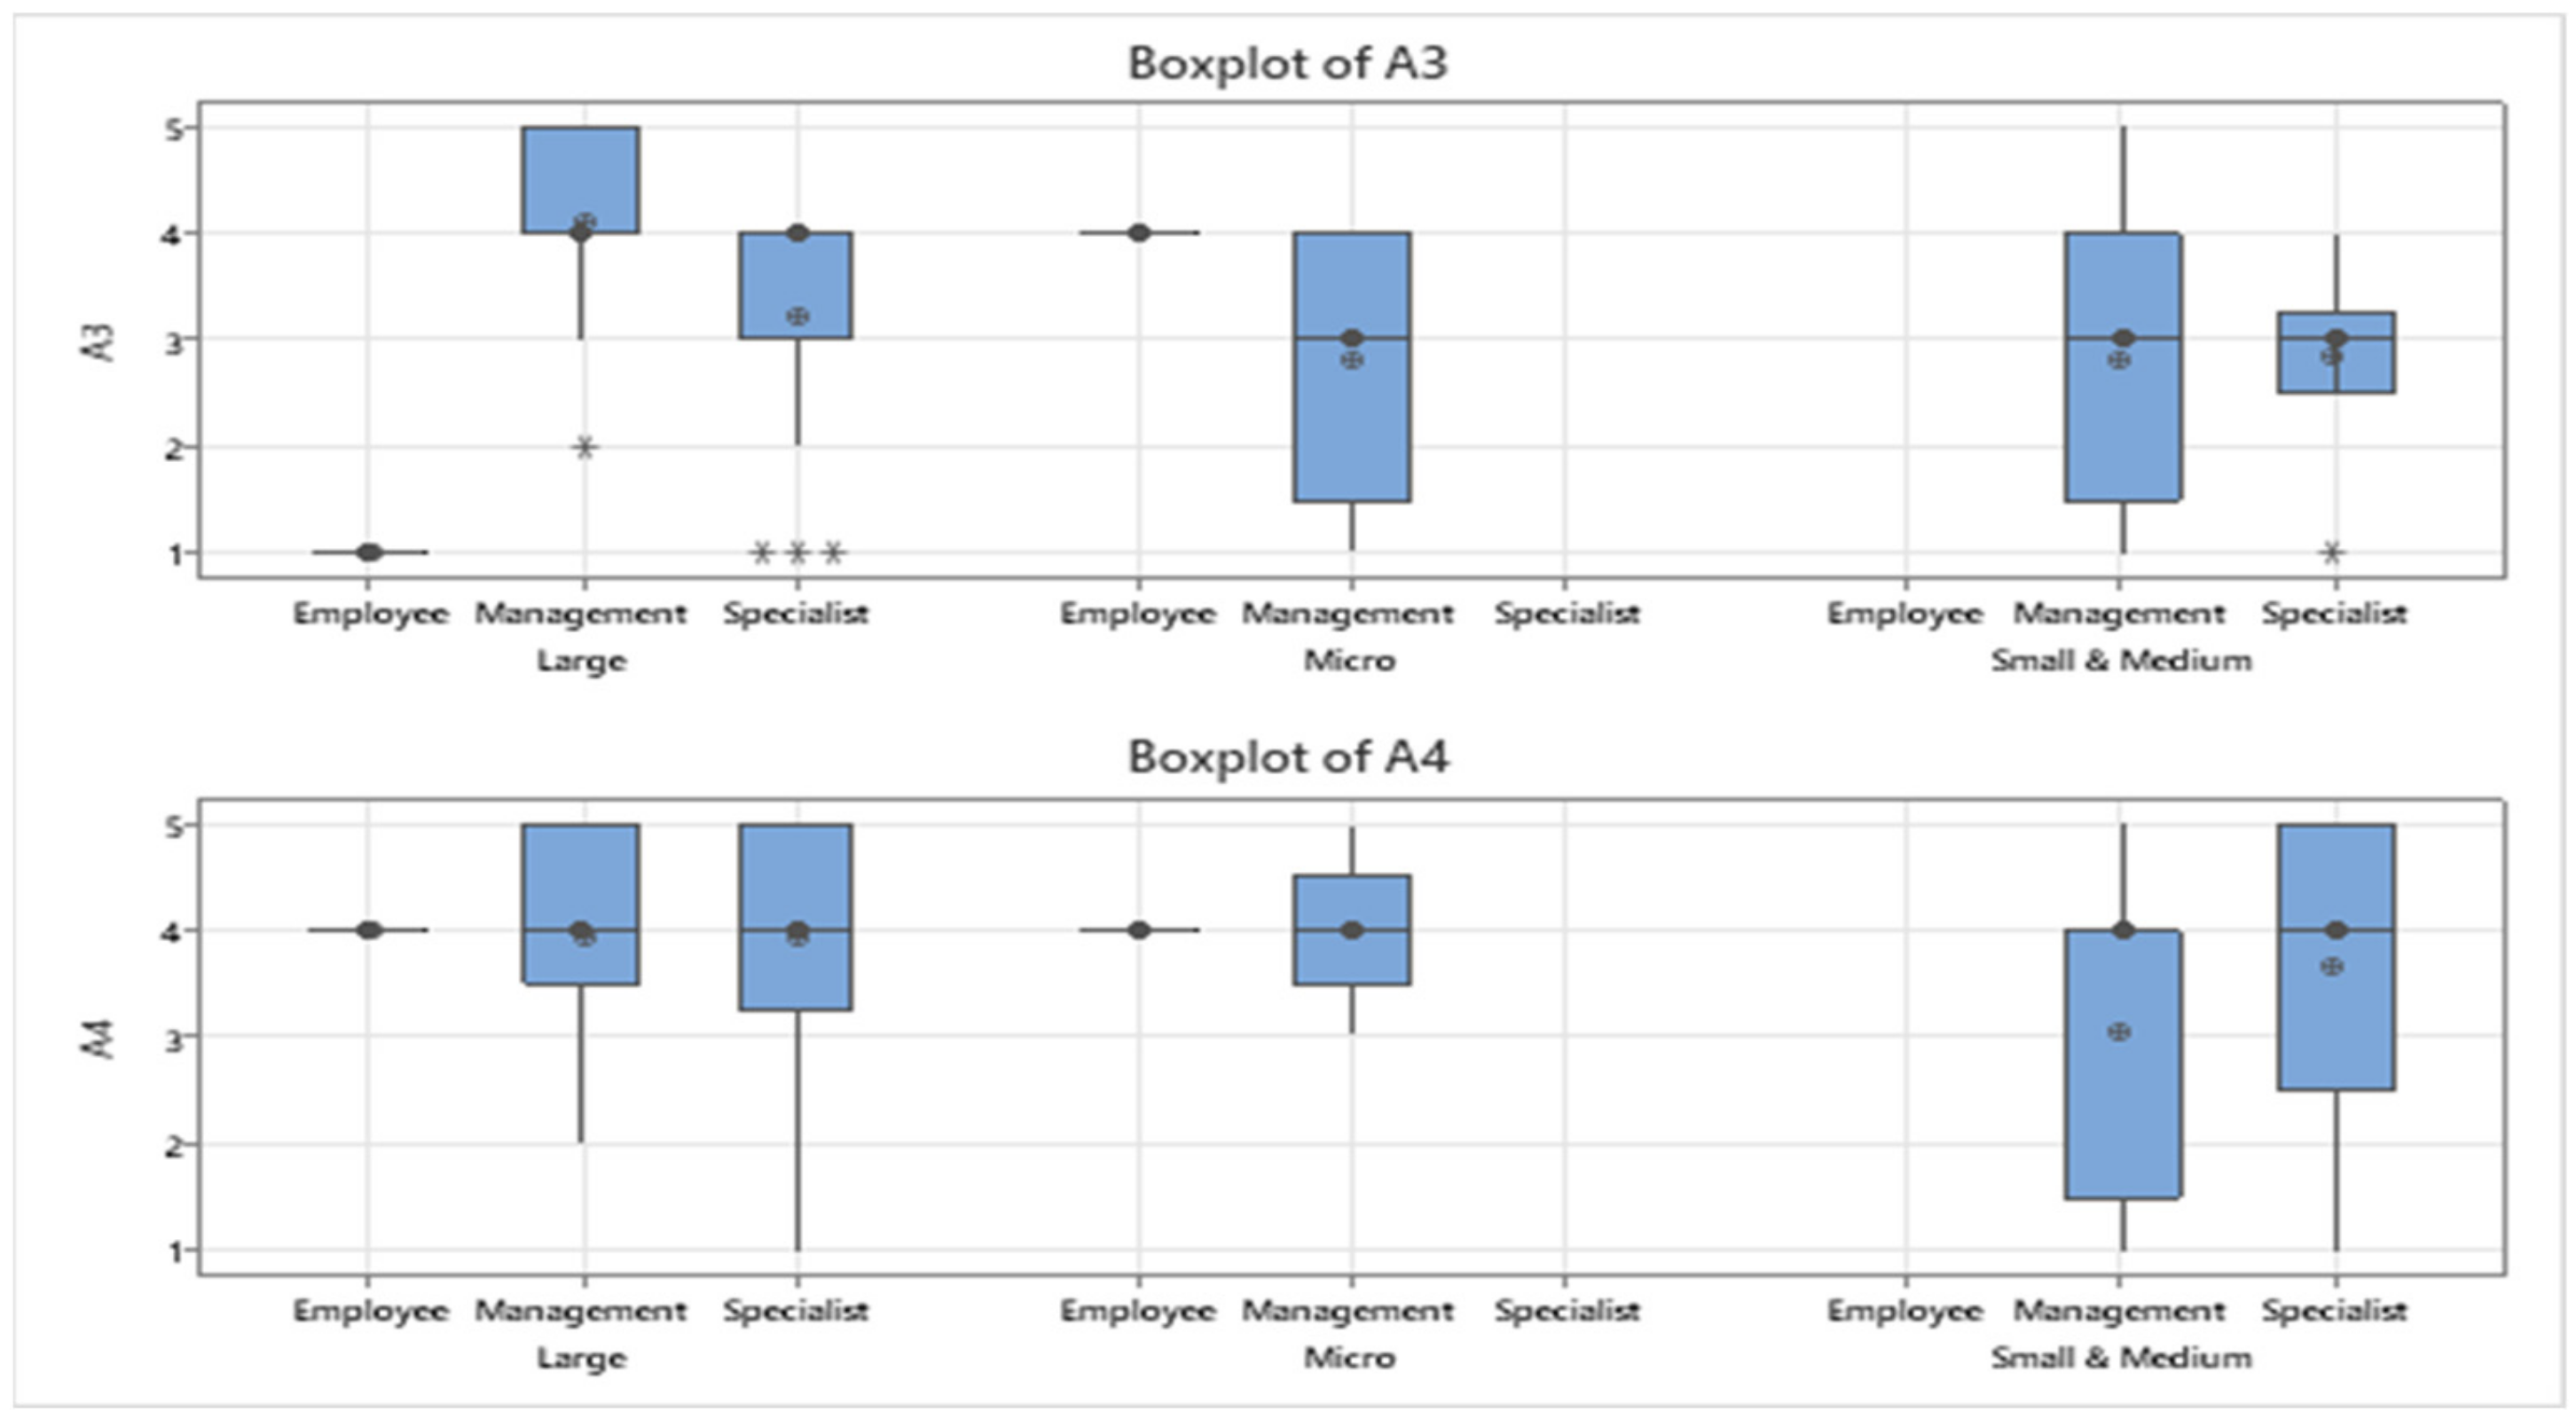
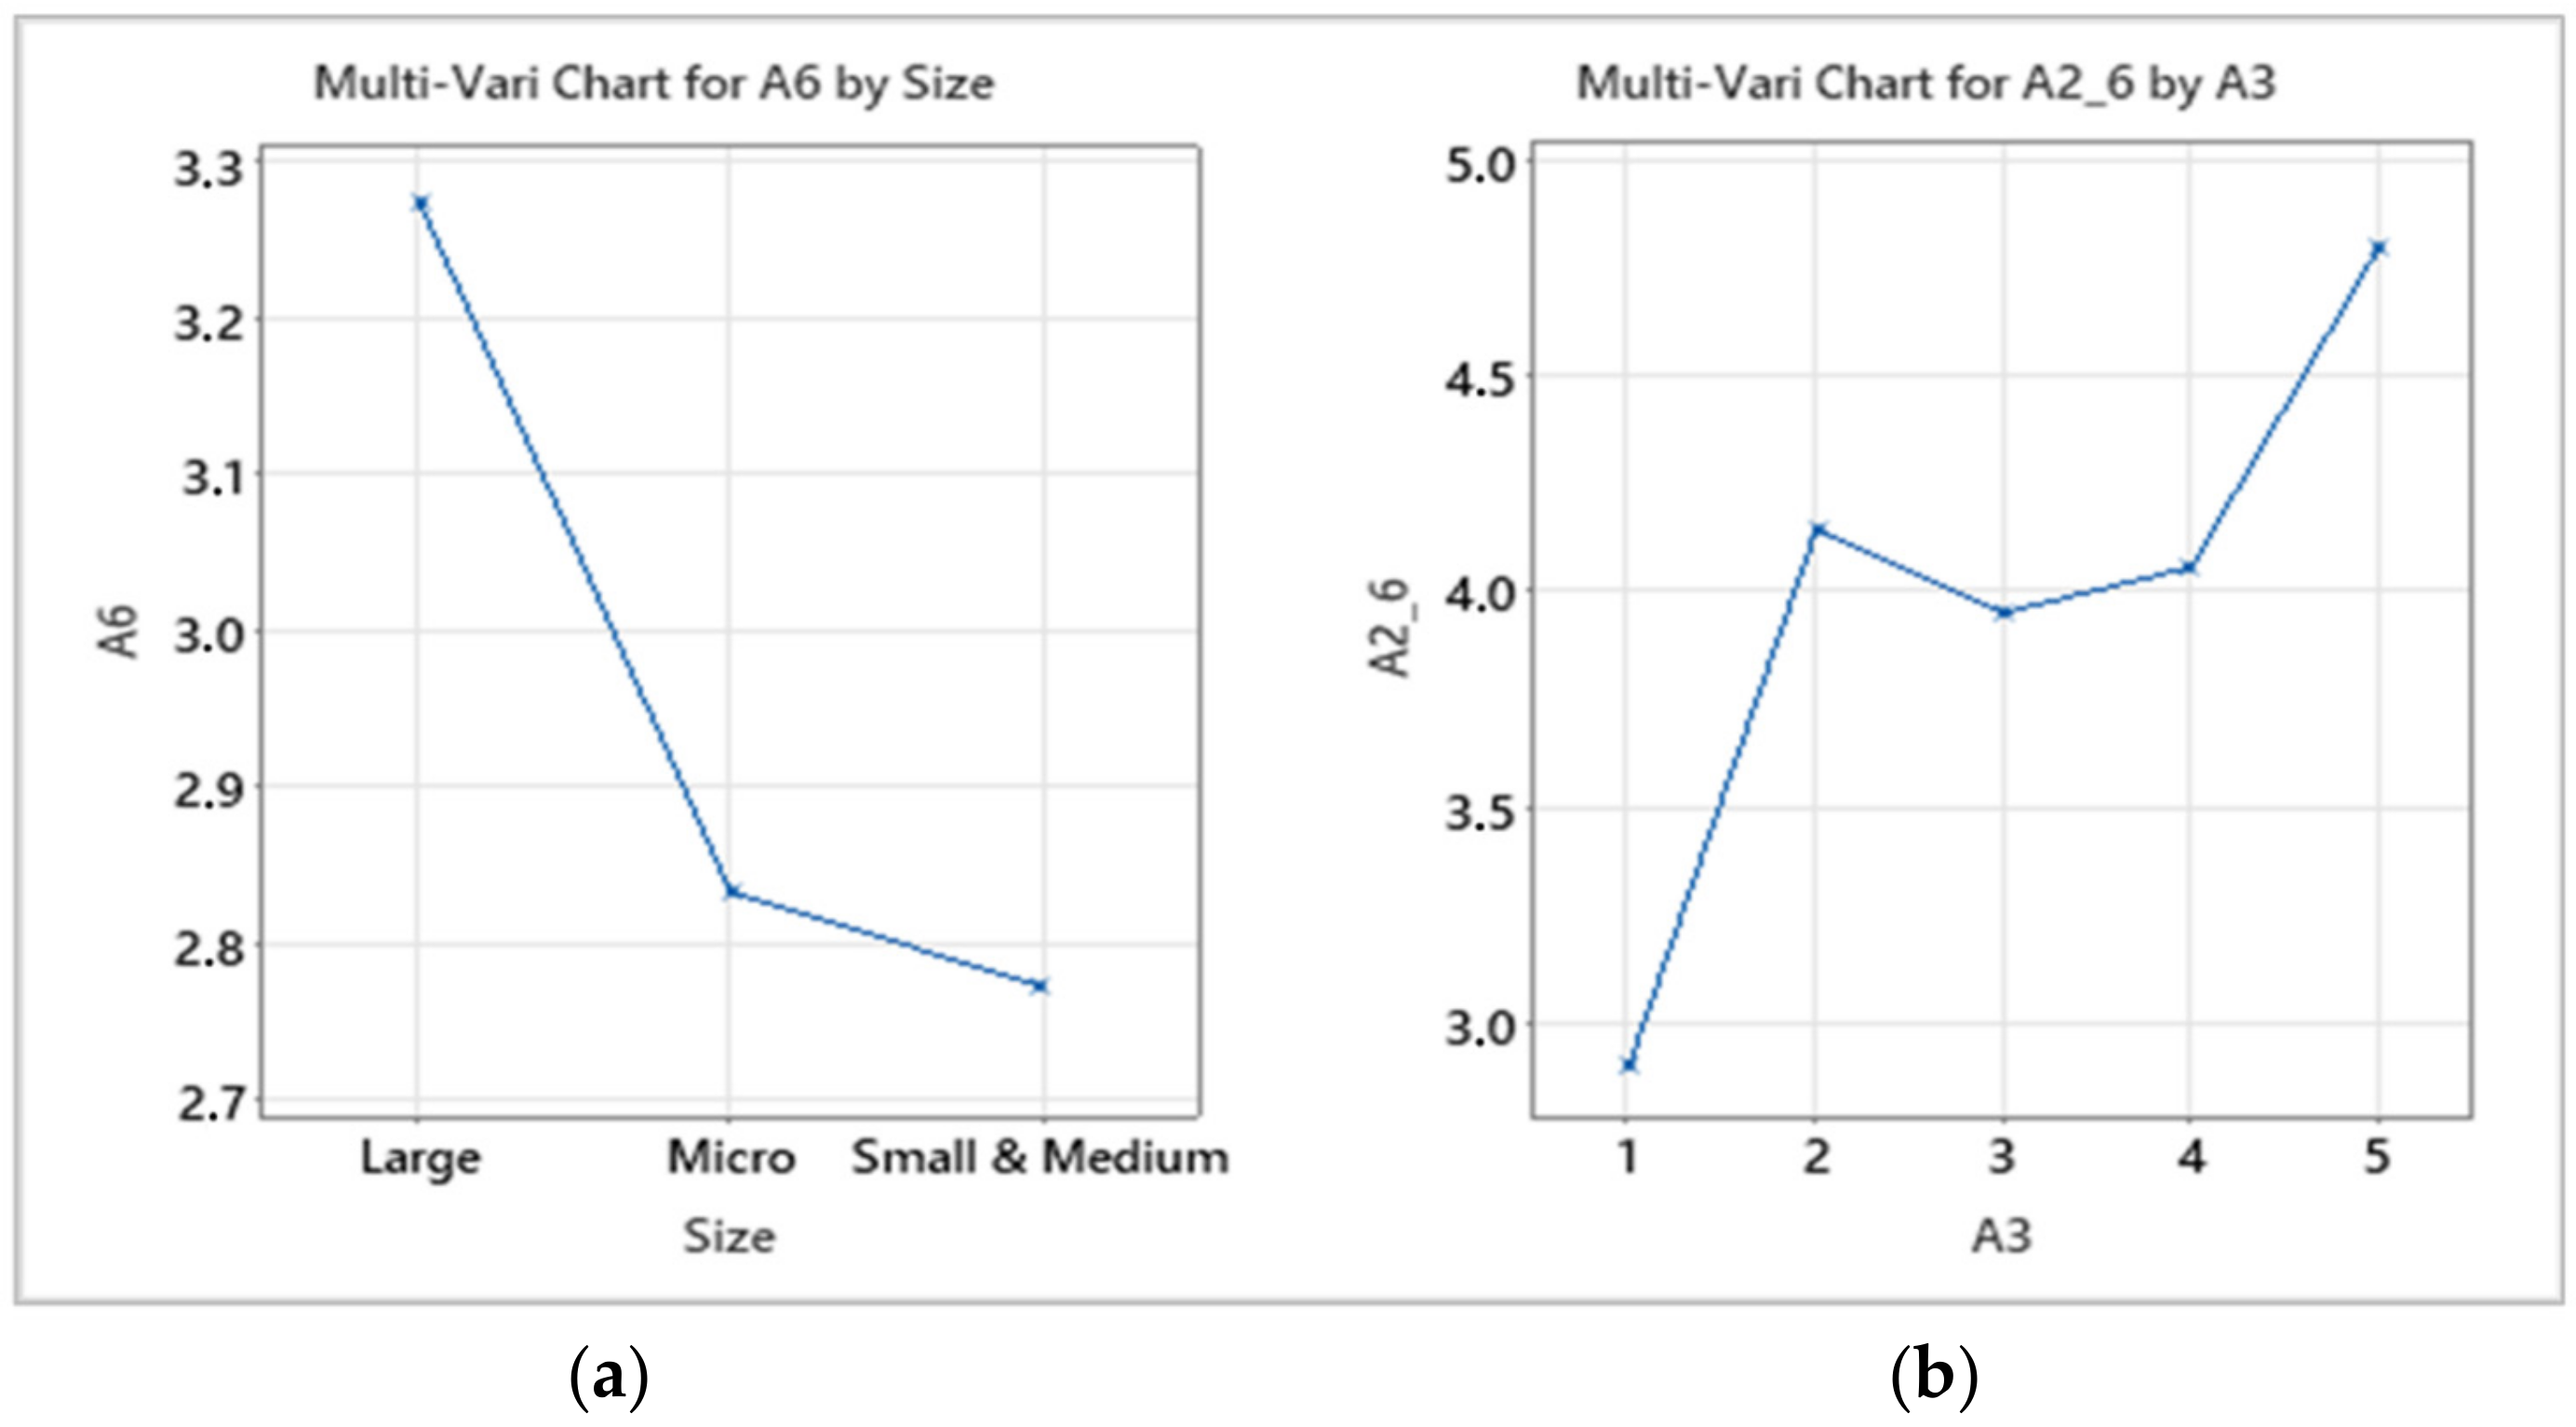
4.1. Actual Usage of Industry 4.0 Technology
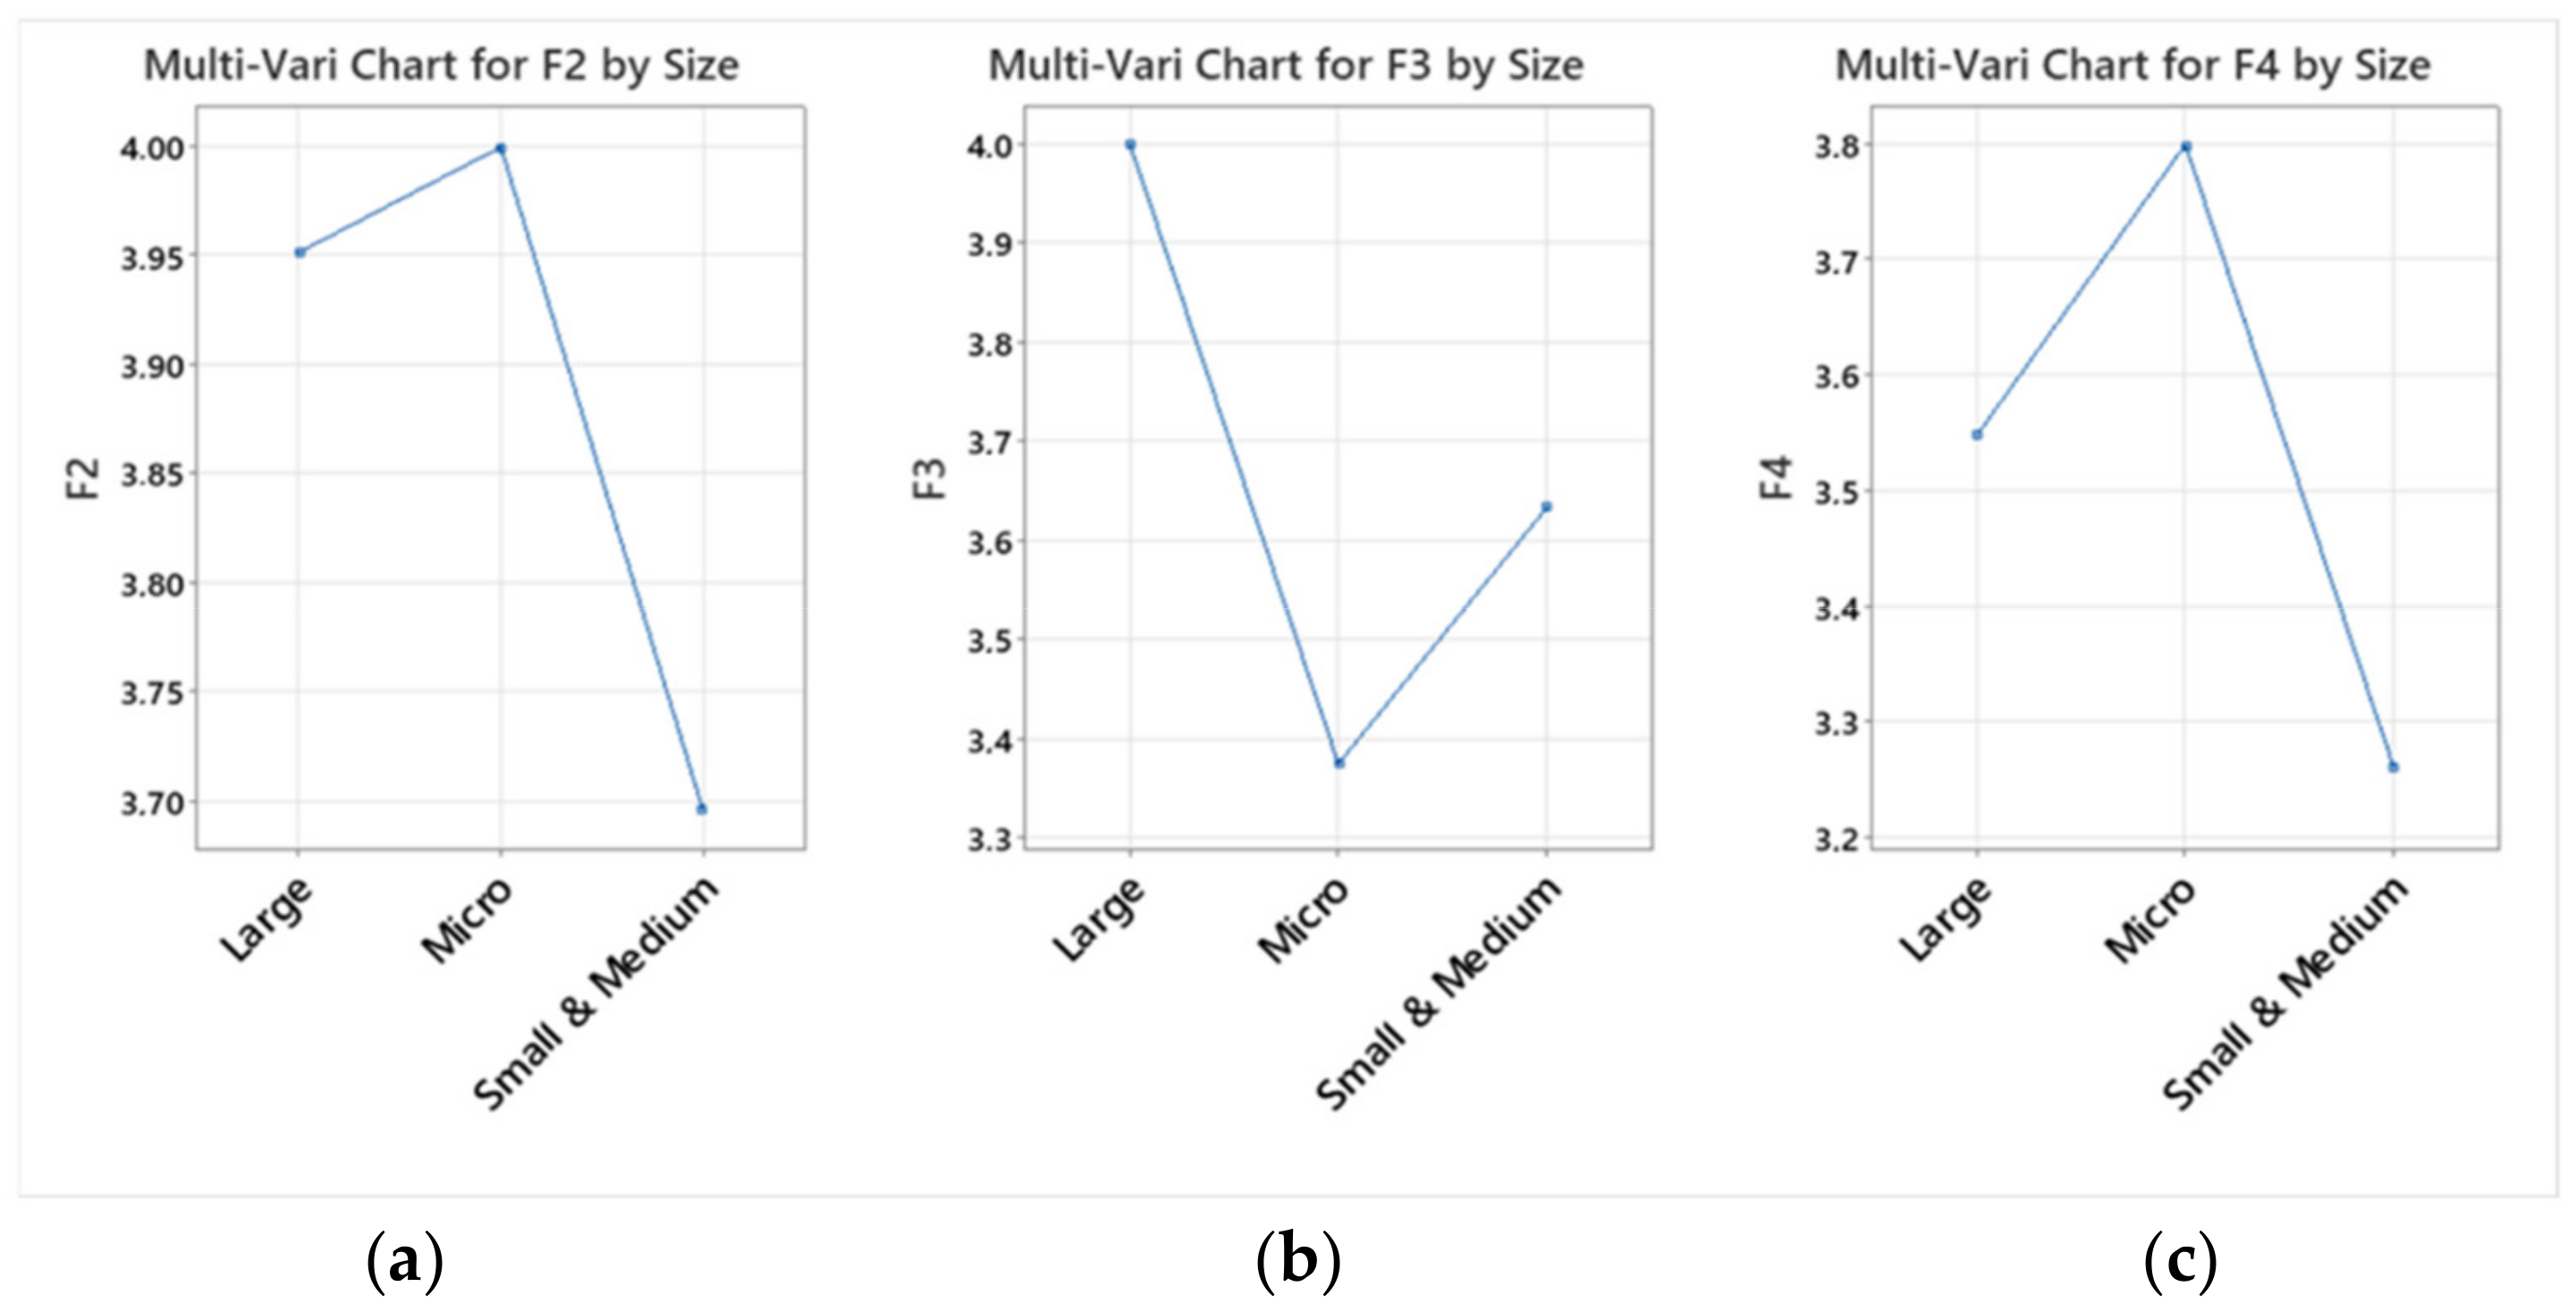
4.2. Future Plans for Technology Usage
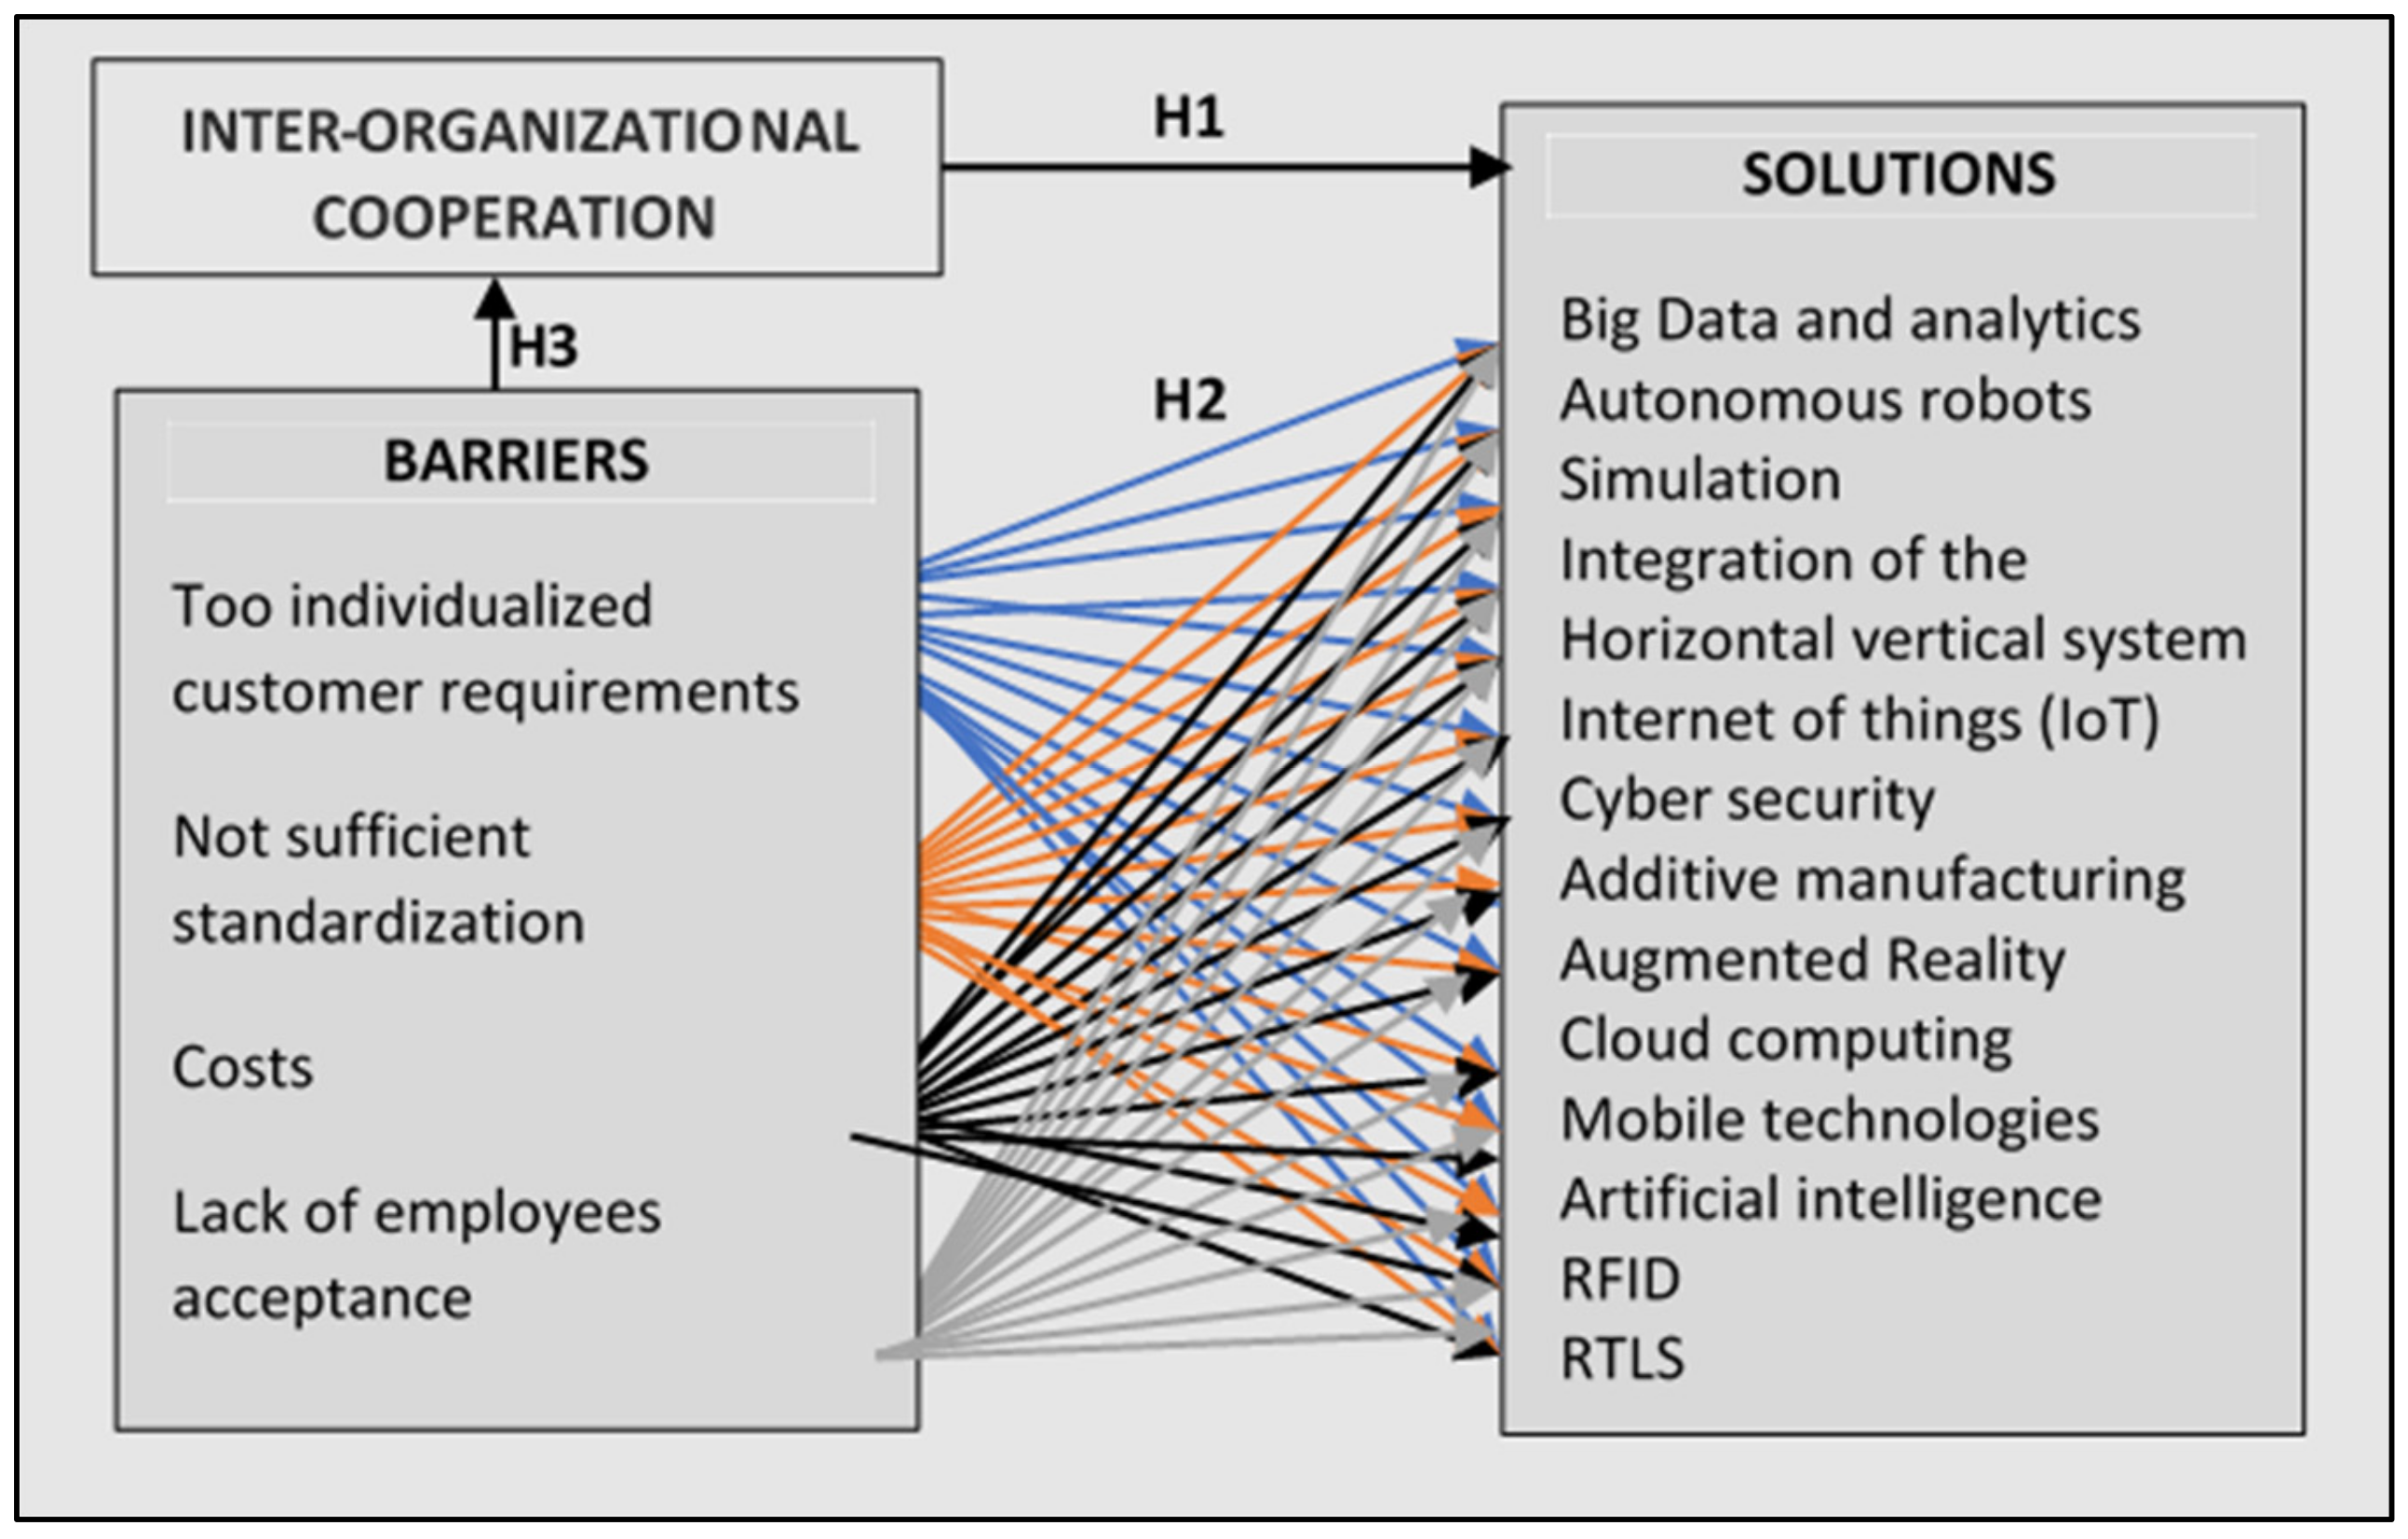
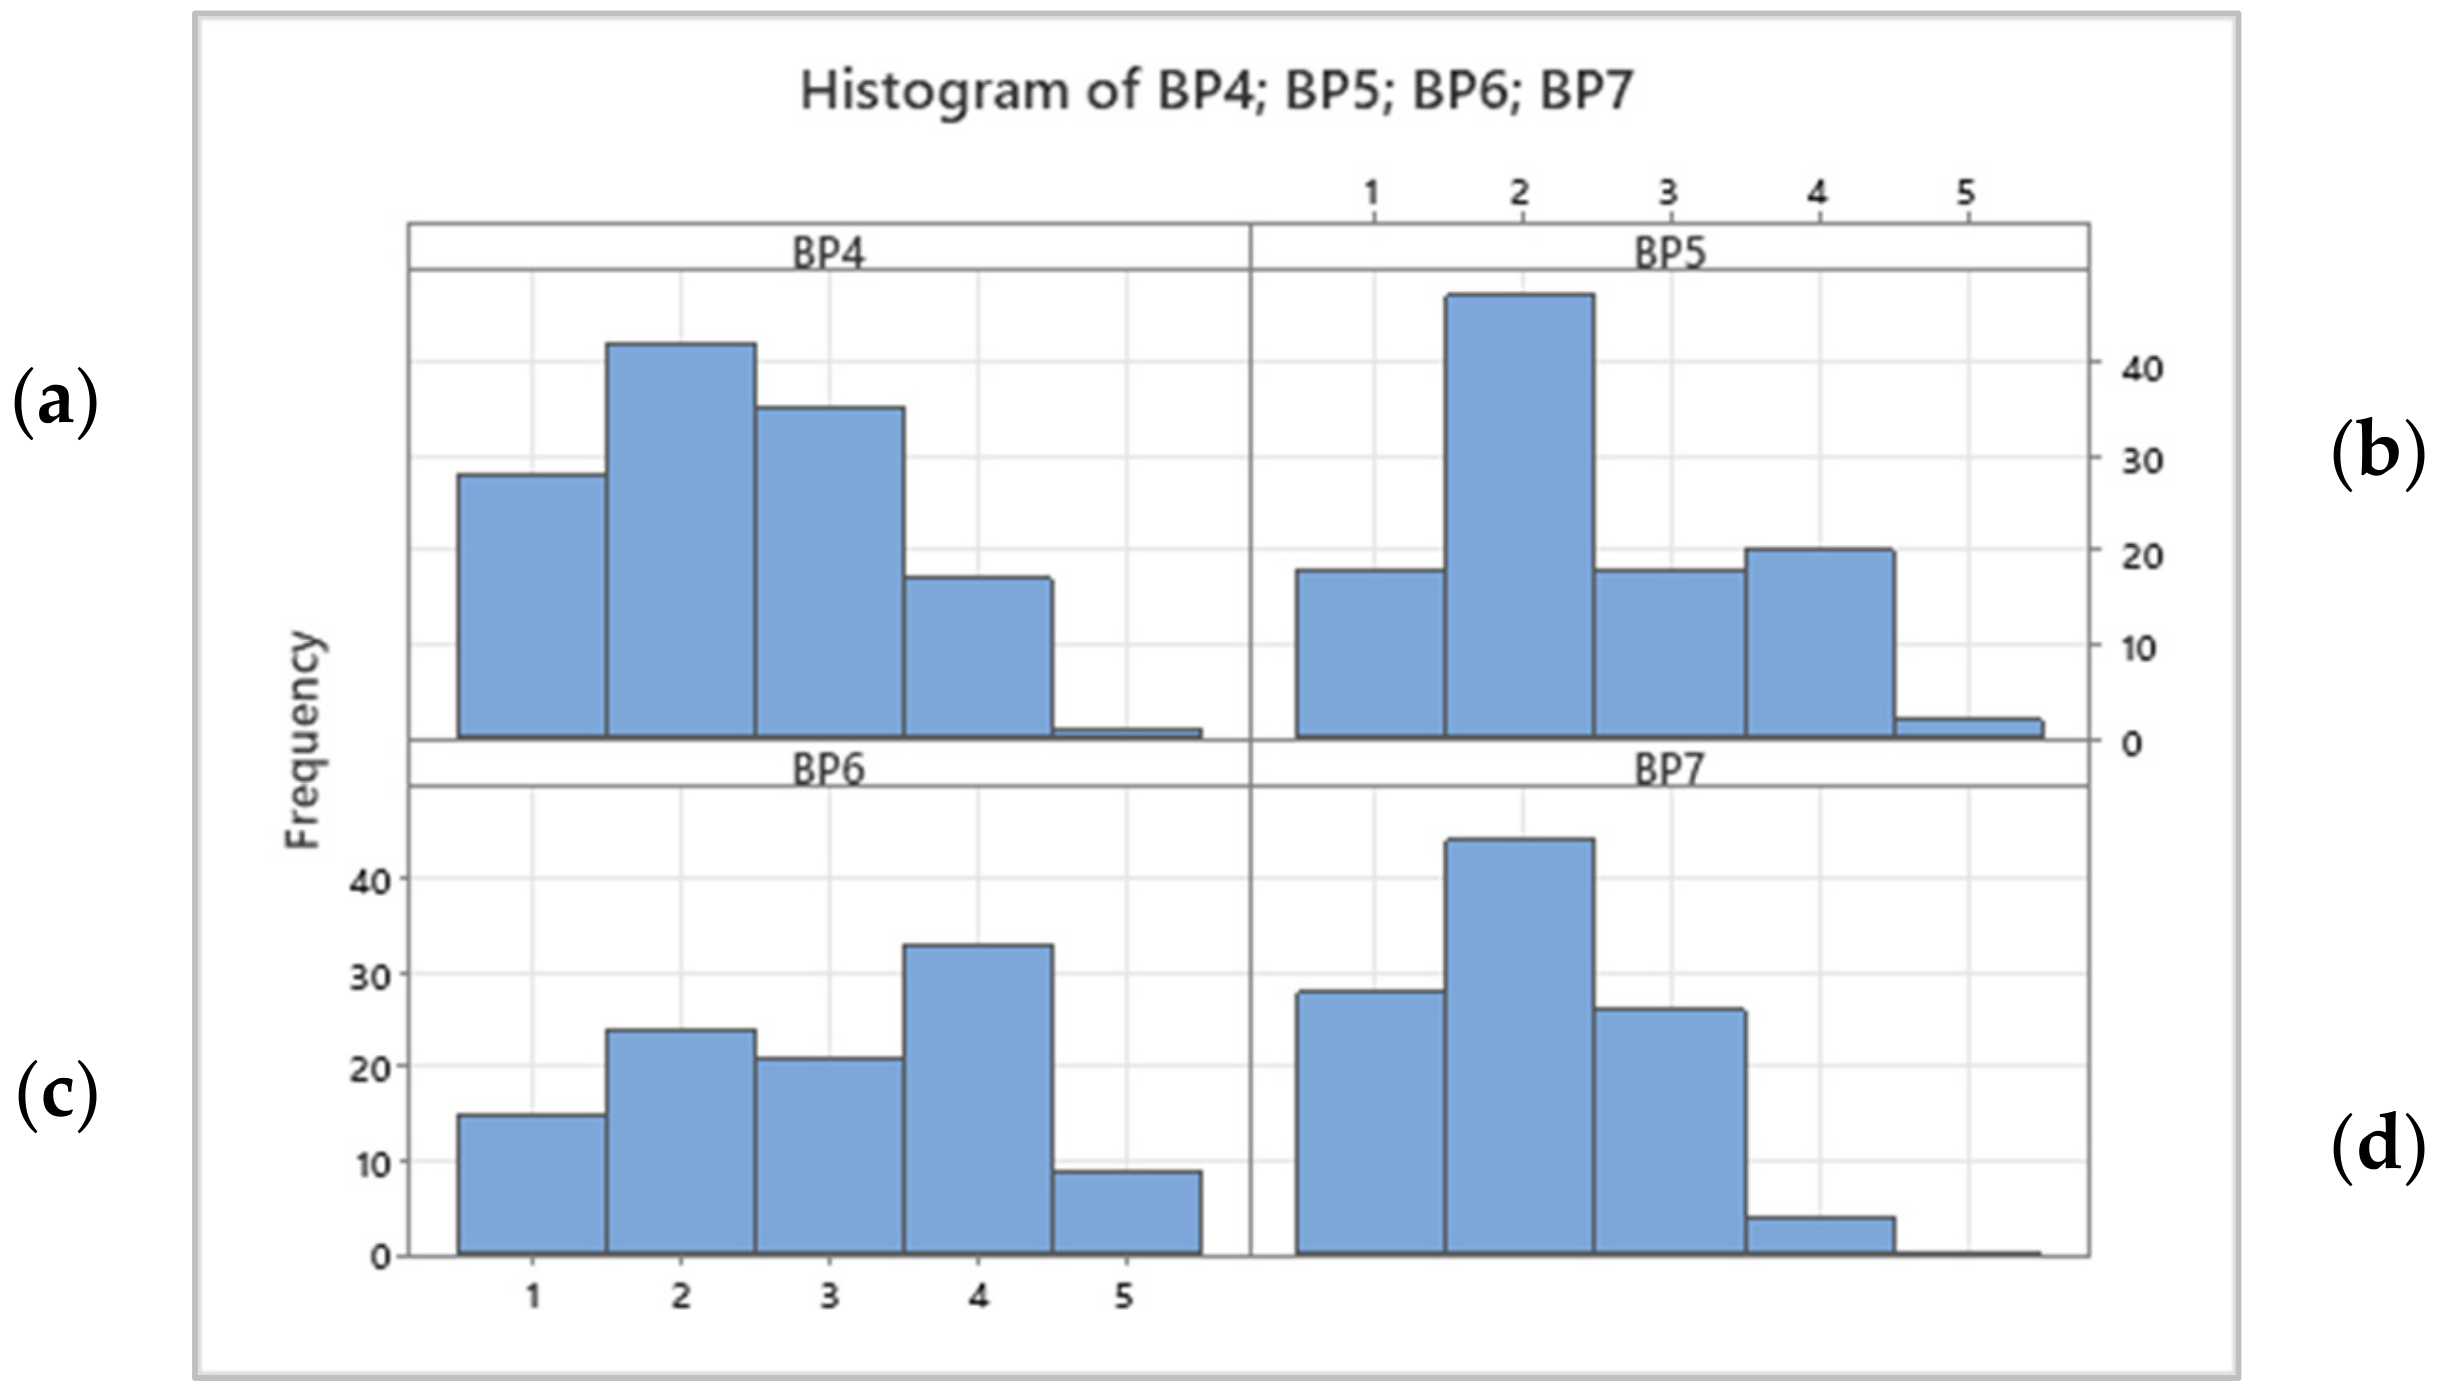
4.3. Strength of Barriers Influence
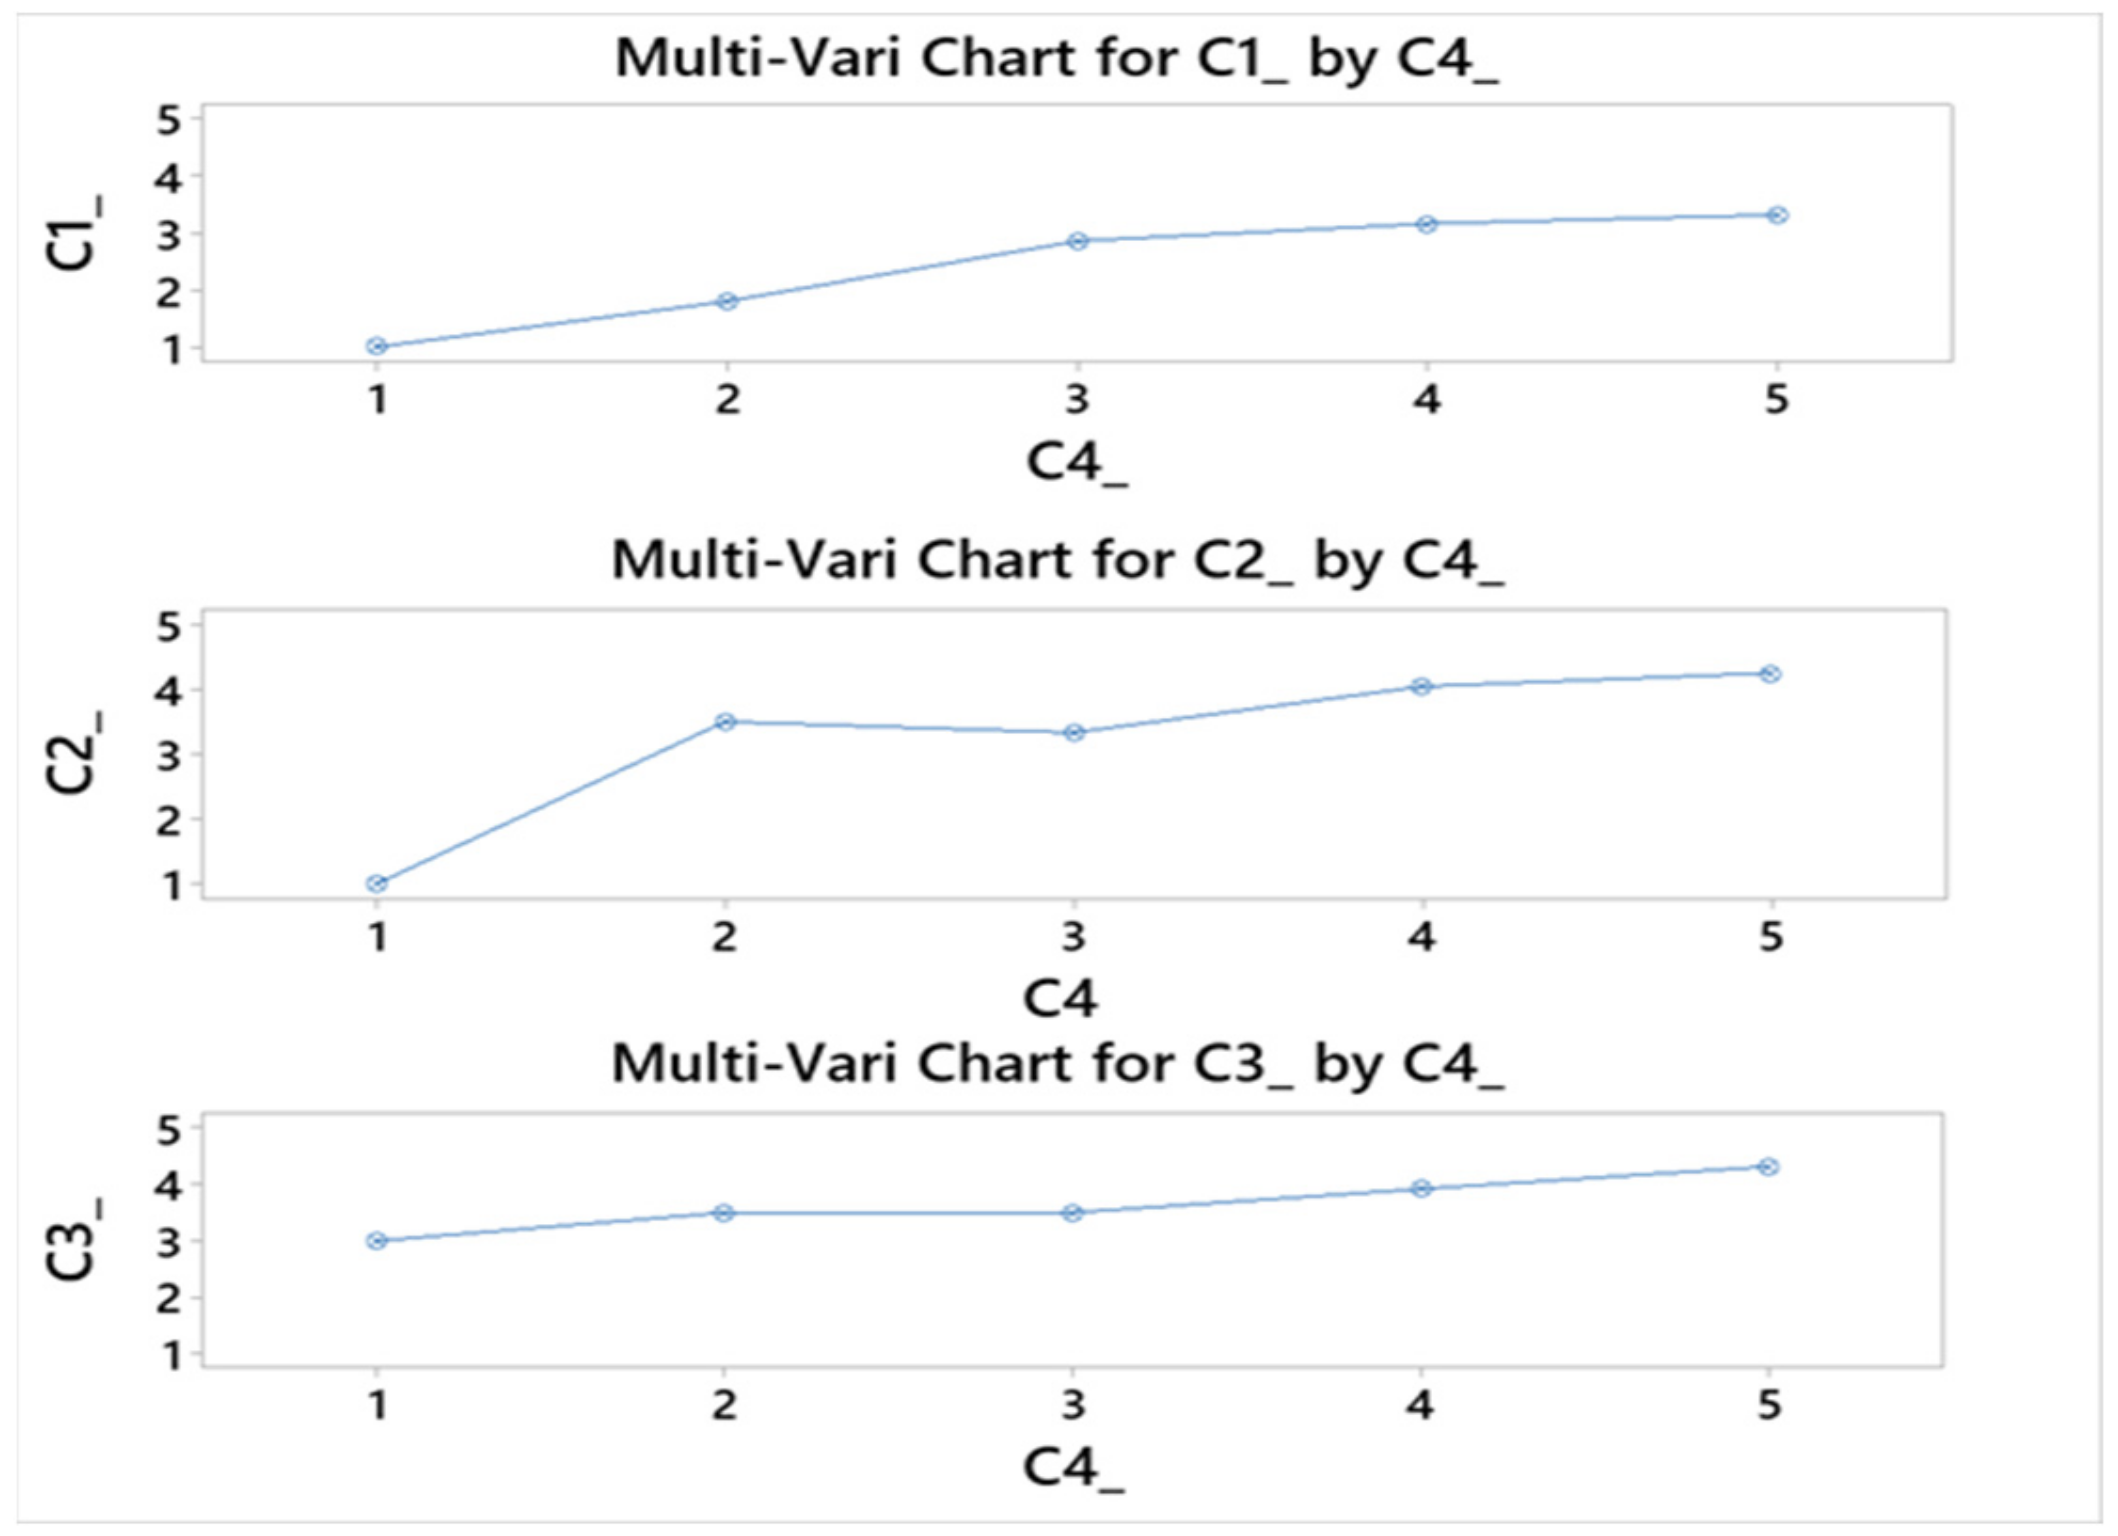
4.4. Cooperation Influence
5. Discussion and Conclusions
5.1. Summary of Main Research Results
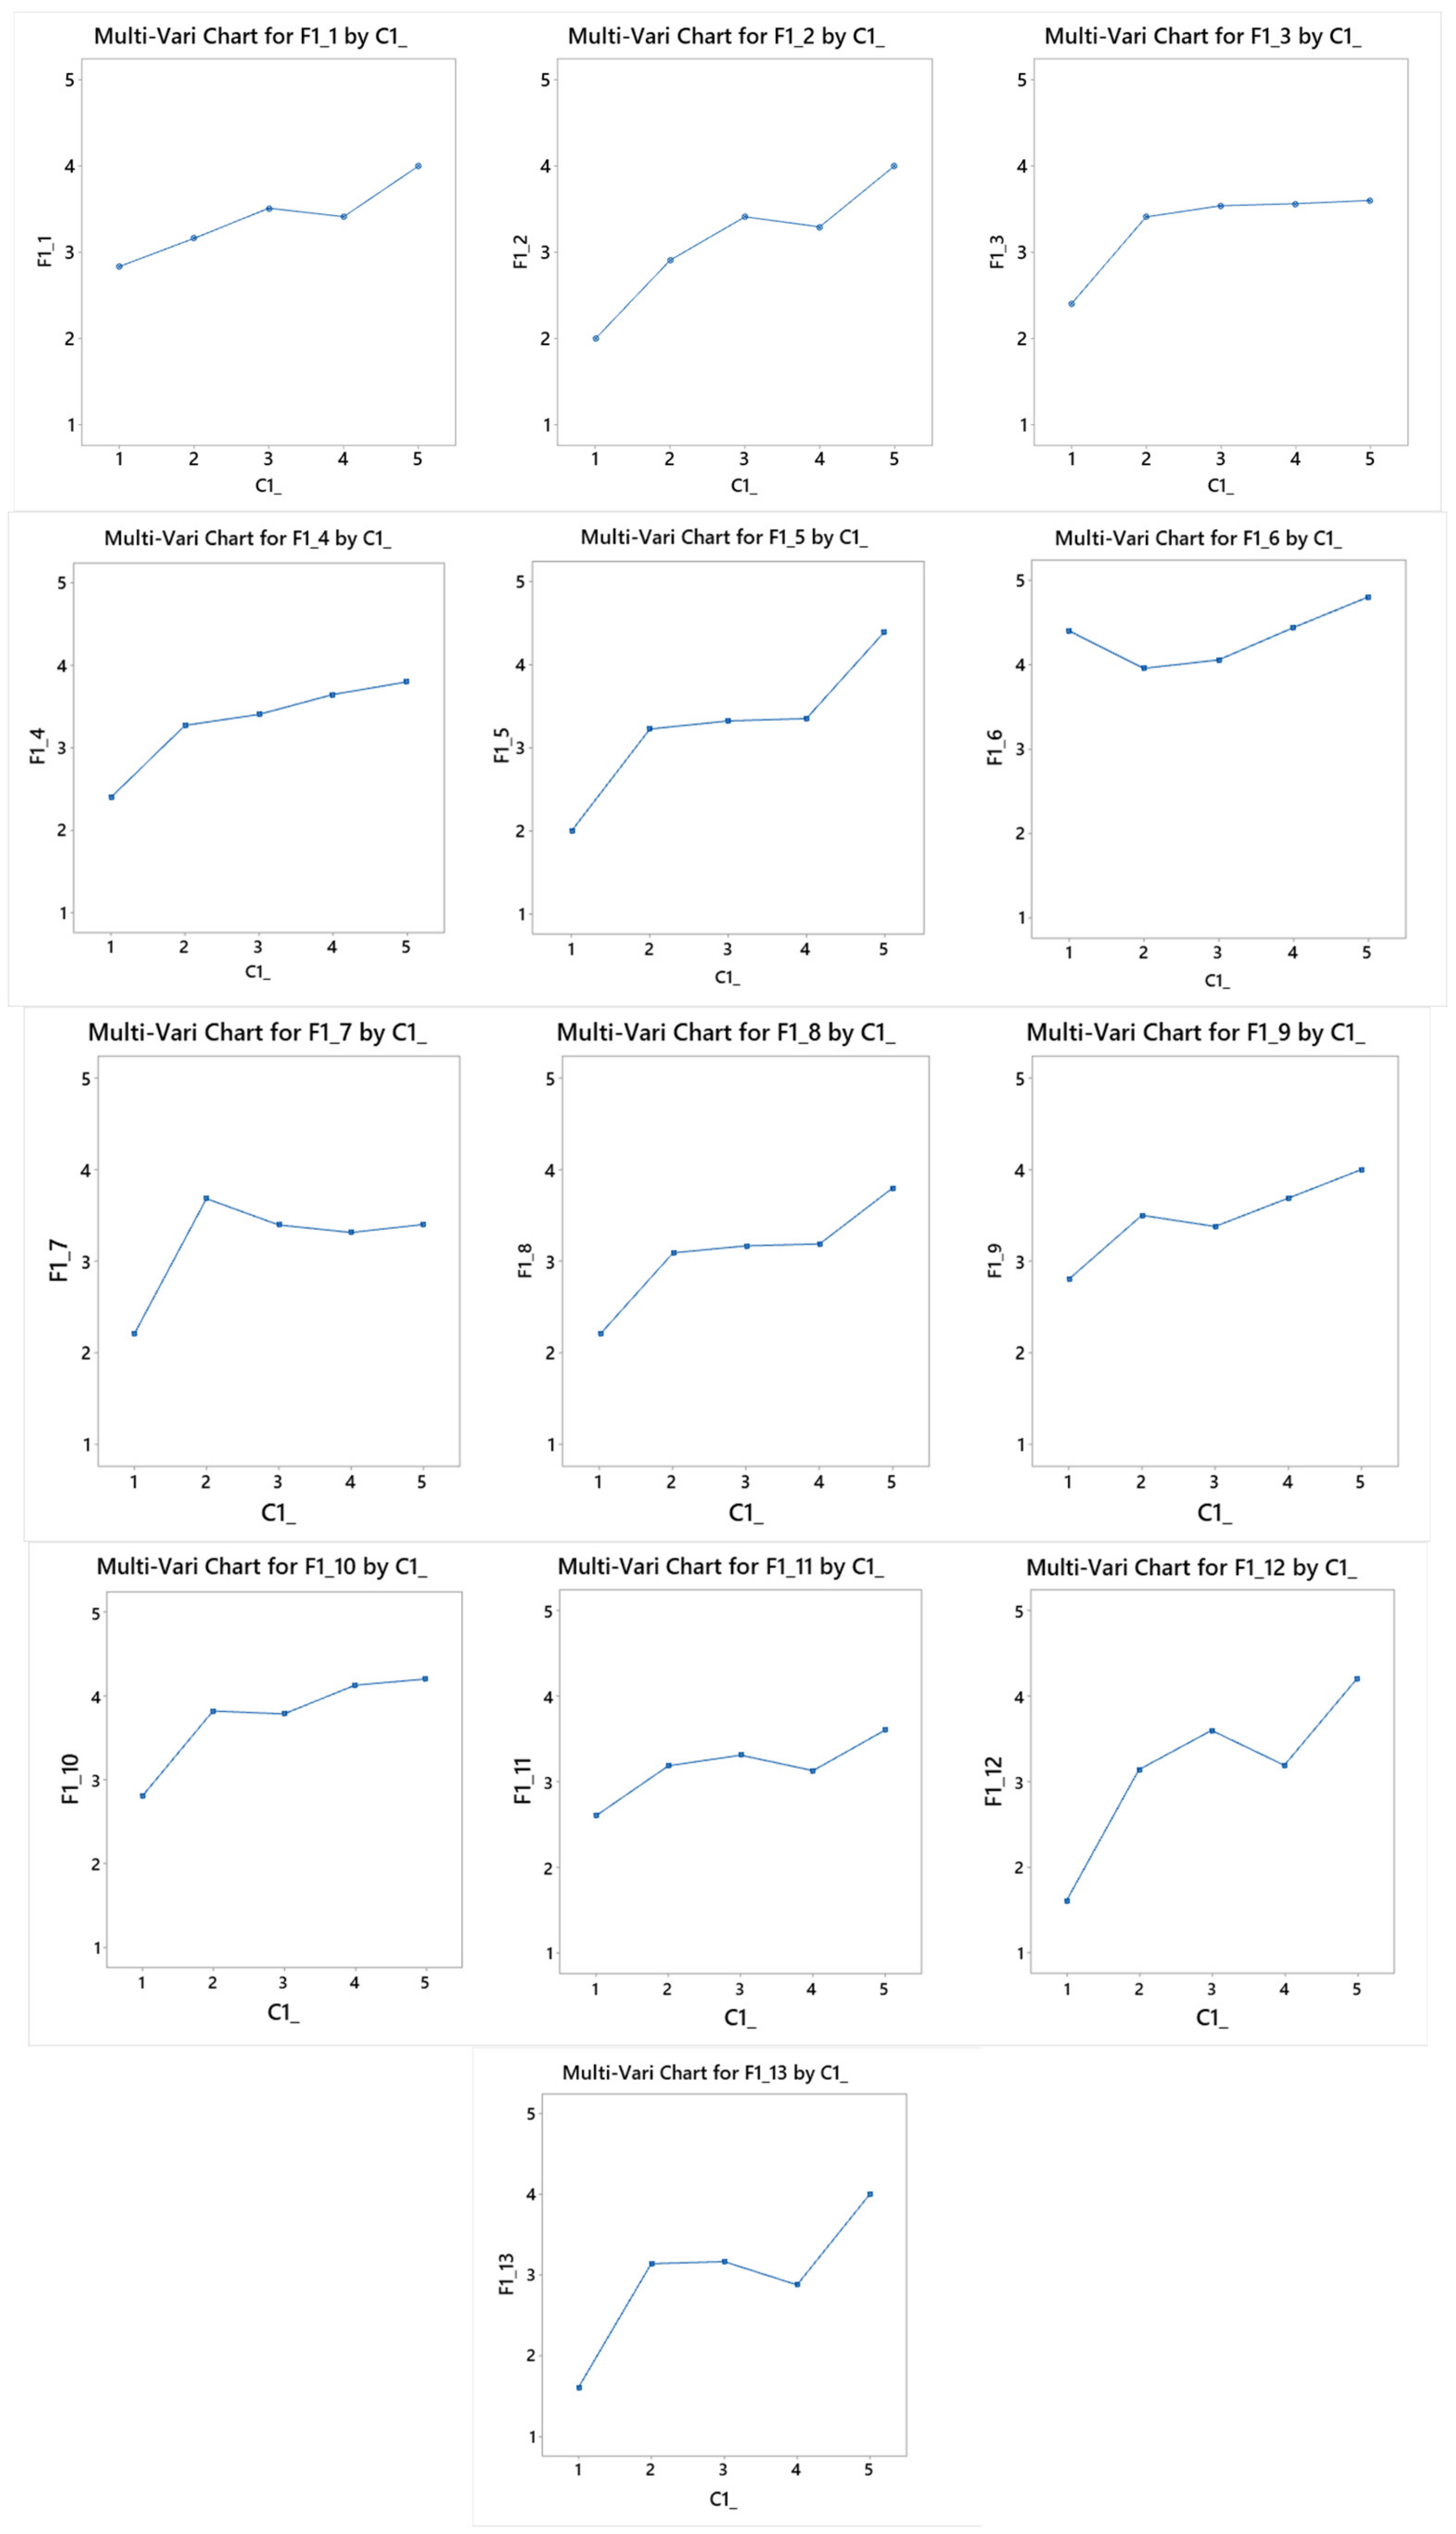
- There is a moderate positive correlation between cooperation in the field of Industry 4.0 and future implementation of Industry 4.0 individual technological solutions. Specifically, the technologies, such as big data and analytics, cloud computing, IoT, and mobile technologies are directly related to Industry 4.0 future plans. It is also a fact that specific Industry 4.0 technologies are implemented by organisations regardless of cooperation with the external parties or other partnerships, i.e., cybersecurity or additive manufacturing.
- Barriers, such as too-individualised customer requirements, insufficient standardisation, costs, and lack of employee’s acceptance, affect the implementation of individual Industry 4.0 solutions with varying intensity. An obvious negative correlation between barriers and technology implementation was confirmed; nevertheless, its strength varies from low to moderate. The lack of strong relationship between measured variables could lead to the conclusion that none of them could stop or limit the implementation of these solutions in the surveyed organisations.
- Barriers, such as too-individualised customer requirements, insufficient standardisation, costs, and lack of employee’s acceptance, affect the cooperation in the field of Industry 4.0. A negative correlation between them was confirmed. All mentioned barriers do not support activities related to cooperation with external partners.
5.2. Theoretical Contribution
5.3. Practical Contribution
5.4. Limitations and Further Studies
Author Contributions
Funding
Institutional Review Board Statement
Informed Consent Statement
Data Availability Statement
Conflicts of Interest
References
- European Industrial Strategy. Available online: https://ec.europa.eu/info/strategy/priorities-2019-2024/europe-fit-digital-age/european-industrial-strategy_en (accessed on 25 April 2022).
- In-Depth Reviews of Strategic Areas for Europe’s Interests. Available online: https://ec.europa.eu/info/strategy/priorities-2019-2024/europe-fit-digital-age/european-industrial-strategy/depth-reviews-strategic-areas-europes-interests_en (accessed on 25 April 2022).
- Kiel, D.; Müller, J.M.; Arnold, C.; Voigt, K.I. Sustainable industrial value creation: Benefits and challenges of Industry 4.0. Int. J. Innov. Manag. 2017, 21, 1740015. [Google Scholar] [CrossRef]
- Durana, P.; Kral, P.; Stehel, V.; Lazaroiu, G.; Sroka, W. Quality Culture of Manufacturing Enterprises: A Possible Way to Adaptation to Industry 4.0. Soc. Sci. 2019, 8, 124. [Google Scholar] [CrossRef] [Green Version]
- Müller, J.M.; Voigt, K.-I. Sustainable Industrial Value Creation in SMEs: A Comparison between Industry 4.0 and Made in China 2025. Int. J. Precis. Eng. Manuf. Green Tech. 2018, 5, 659–670. [Google Scholar] [CrossRef] [Green Version]
- Müller, J.M.; Kiel, D.; Voigt, K.-I. What Drives the Implementation of Industry 4.0? The Role of Opportunities and Challenges in the Context of Sustainability. Sustainability 2018, 10, 247. [Google Scholar] [CrossRef] [Green Version]
- Jahani, N.; Sepehri, A.; Vandchali, H.R.; Tirkolaee, E.B. Application of Industry 4.0 in the Procurement Processes of Supply Chains: A Systematic Literature Review. Sustainability 2021, 13, 7520. [Google Scholar] [CrossRef]
- Arnold, C.; Veile, J.W.; Voigt, K.-I. What Drives Industry 4.0 Adoption? An Examination of Technological, Organizational and Environmental Determinants. In Proceedings of the IAMOT 2018 Conference Proceedings, Birmingham, UK, 22–26 April 2018; pp. 1–19. [Google Scholar]
- Wagire, A.A.; Joshi, R.; Rathore, A.P.S.; Jain, R. Development of Maturity Model for Assessing the Implementation of Industry 4.0: Learning from Theory and Practice. Prod. Plan. Control. 2021, 32, 603–622. [Google Scholar] [CrossRef]
- Basl, J. Pilot Study of Readiness of Czech Companies to Implement the Principles of Industry 4.0. Manag. Prod. Eng. Rev. 2017, 8, 3–8. [Google Scholar] [CrossRef] [Green Version]
- Fitsilis, P.; Tsoutsa, P.; Gerogiannis, V. Industry 4.0: Required Personnel Competences. Industry 2018, 3, 130–133. [Google Scholar]
- Hernandez-de-Menendez, M.; Morales-Menendez, R.; Escobar, C.A.; McGovern, M. Competencies for Industry 4.0. Int. J. Interact. Des. Manuf. 2020, 14, 1511–1524. [Google Scholar] [CrossRef]
- Issa, A.; Hatiboglu, B.; Bildstein, A.; Bauernhansl, T. Industrie 4.0 Roadmap: Framework for Digital Transformation Based on the Concepts of Capability Maturity and Alignment. Procedia CIRP 2018, 72, 973–978. [Google Scholar] [CrossRef]
- Kamble, S.S.; Gunasekaran, A.; Gawankar, S.A. Sustainable Industry 4.0 Framework: A Systematic Literature Review Identifying the Current Trends and Future Perspectives. Process Saf. Environ. Prot. 2018, 117, 408–425. [Google Scholar] [CrossRef]
- What Is Industrie 4.0? Available online: https://www.plattform-i40.de/IP/Navigation/EN/Industrie40/WhatIsIndustrie40/what-is-industrie40.html (accessed on 25 April 2022).
- 2030 Vision. Available online: https://www.plattform-i40.de/IP/Navigation/EN/Industrie40/Vision/vision.html (accessed on 25 April 2022).
- Przemysł 4.0—Czym Jest Czwarta Rewolucja Przemysłowa? Available online: https://przemyslprzyszlosci.gov.pl/tag/przemysl-4-0/ (accessed on 25 April 2022).
- Michna, A.; Kmieciak, R. Open-Mindedness Culture, Knowledge-Sharing, Financial Performance, and Industry 4.0 in SMEs. Sustainability 2020, 12, 9041. [Google Scholar] [CrossRef]
- Li, D.; Fast-Berglund, Å.; Paulin, D. Current and Future Industry 4.0 Capabilities for Information and Knowledge Sharing. Int. J. Adv. Manuf. Technol. 2019, 105, 3951–3963. [Google Scholar] [CrossRef] [Green Version]
- Zamani, R.; Moghaddam, M.P.; Haghifam, M.-R. Dynamic Characteristics Preserving Data Compressing Algorithm For Transactive Energy Management Frameworks. IEEE Trans. Ind. Inform. 2022. [Google Scholar] [CrossRef]
- Erboz, G. How to Define Industry 4.0: The Main Pillars Of Industry 4.0. In Proceedings of the 7th International Scientific Conference on Managerial Trends in the Development of Enterprises in Globalization Era (ICoM), Nitra, Slovakia, 1–2 June 2017; pp. 761–767. [Google Scholar]
- Mahmud, M.S.; Huang, J.Z.; Salloum, S.; Emara, T.Z.; Sadatdiynov, K. A Survey of Data Partitioning and Sampling Methods to Support Big Data Analysis. Big Data Min. Anal. 2020, 3, 85–101. [Google Scholar] [CrossRef]
- Cui, Y.; Kara, S.; Chan, K.C. Monitoring and Control of Unstructured Manufacturing Big Data. In Proceedings of the 2020 IEEE International Conference on Industrial Engineering and Engineering Management (IEEM), Singapore, 14–17 December 2020; pp. 928–932. [Google Scholar]
- Barbie, A.; Hasselbring, W.; Pech, N.; Sommer, S.; Flogel, S.; Wenzhofer, F. Prototyping Autonomous Robotic Networks on Different Layers of RAMI 4.0 with Digital Twins. In Proceedings of the 2020 IEEE International Conference on Multisensor Fusion and Integration for Intelligent Systems (MFI), Karlsruhe, Germany, 14–16 September 2020; pp. 1–6. [Google Scholar]
- Hoffa-Dabrowska, P.; Grzybowska, K. Simulation Modeling of the Sustainable Supply Chain. Sustainability 2020, 12, 6007. [Google Scholar] [CrossRef]
- Kádárová, J.; Trebuňa, P.; Lachvajderová, L. Model for Optimizing the Ratios of the Company Suppliers in Slovak Automotive Industry. Sustainability 2021, 13, 11597. [Google Scholar] [CrossRef]
- Kliment, M.; Pekarcikova, M.; Trebuna, P.; Trebuna, M. Application of TestBed 4.0 Technology within the Implementation of Industry 4.0 in Teaching Methods of Industrial Engineering as Well as Industrial Practice. Sustainability 2021, 13, 8963. [Google Scholar] [CrossRef]
- Miśkiewicz, R.; Wolniak, R. Practical Application of the Industry 4.0 Concept in a Steel Company. Sustainability 2020, 12, 5776. [Google Scholar] [CrossRef]
- Ondov, M.; Rosova, A.; Sofranko, M.; Feher, J.; Cambal, J.; Feckova Skrabulakova, E. Redesigning the Production Process Using Simulation for Sustainable Development of the Enterprise. Sustainability 2022, 14, 1514. [Google Scholar] [CrossRef]
- Pekarcikova, M.; Trebuna, P.; Kliment, M.; Dic, M. Solution of Bottlenecks in the Logistics Flow by Applying the Kanban Module in the Tecnomatix Plant Simulation Software. Sustainability 2021, 13, 7989. [Google Scholar] [CrossRef]
- Lukoki, V.; Varela, L.; Machado, J. Simulation of Vertical and Horizontal Integration of Cyber-Physical Systems. In Proceedings of the 2020 7th International Conference on Control, Decision and Information Technologies (CoDIT), Prague, Czech Republic, 29 June–2 July 2020; pp. 282–287. [Google Scholar]
- Konstantinidis, F.K.; Mouroutsos, S.G.; Gasteratos, A. The Role of Machine Vision in Industry 4.0: An Automotive Manufacturing Perspective. In Proceedings of the 2021 IEEE International Conference on Imaging Systems and Techniques (IST), Kaohsiung, Taiwan, 24–26 August 2021; pp. 1–6. [Google Scholar]
- Mullet, V.; Sondi, P.; Ramat, E. A Review of Cybersecurity Guidelines for Manufacturing Factories in Industry 4.0. IEEE Access 2021, 9, 23235–23263. [Google Scholar] [CrossRef]
- Kalhara, D.; De Alwis, U.; Jinadasa, A.; Randunu, D.; Nuwanthika, W.S.; Abeygunawardhana, P.K.W. Comprehensive Security Solution for an Industry 4.0 Garment Manufacturing System. In Proceedings of the 2021 3rd International Conference on Advancements in Computing (ICAC), Colombo, Sri Lanka, 9–11 December 2021; pp. 67–72. [Google Scholar]
- Tirkolaee, E.B.; Sadeghi, S.; Mooseloo, F.M.; Vandchali, H.R.; Aeini, S. Application of Machine Learning in Supply Chain Management: A Comprehensive Overview of the Main Areas. Math. Probl. Eng. 2021, 2021, 1476043. [Google Scholar] [CrossRef]
- Stentoft, J.; Jensen, K.W.; Philipsen, K.; Haug, A. Drivers and Barriers for Industry 4.0 Readiness and Practice: A SME Perspective with Empirical Evidence. In Proceedings of the 52nd Hawaii International Conference on System Sciences, Maui, HI, USA, 8–11 January 2019; Volume 6, pp. 5155–5164. [Google Scholar]
- Essakly, A.; Wichmann, M.; Spengler, T.S. A Reference Framework for the Holistic Evaluation of Industry 4.0 Solutions for Small-and Medium-Sized Enterprises. IFAC-PapersOnLine 2019, 52, 427–432. [Google Scholar] [CrossRef]
- Vuksanović Herceg, I.; Kuč, V.; Mijušković, V.M.; Herceg, T. Challenges and Driving Forces for Industry 4.0 Implementation. Sustainability 2020, 12, 4208. [Google Scholar] [CrossRef]
- Mogos, M.F.; Eleftheriadis, R.J.; Myklebust, O. Enablers and Inhibitors of Industry 4.0: Results from a Survey of Industrial Companies in Norway. Procedia CIRP 2019, 81, 624–629. [Google Scholar] [CrossRef]
- Veile, J.W.; Kiel, D.; Müller, J.M.; Voigt, K.-I. Lessons Learned from Industry 4.0 Implementation in the German Manufacturing Industry. JMTM 2019, 31, 977–997. [Google Scholar] [CrossRef] [Green Version]
- Khazieva, N.; Kovalev, A.; Caganova, D. Does Industry 4.0 Require Business Model Innovation? In Proceedings of the International Conference Theory and Applications in the Knowledge Economy, Poznan, Poland, 11–13 July 2018; pp. 49–58. [Google Scholar]
- Grabowska, S. Model Biznesu 4.0. Architektura, Tworzenie Wartości, Ocena Konkurencyjności i Efektywności; TNOiK: Torun, Poland, 2021. [Google Scholar]
- Karamitsos, I.; Apostolopoulos, C.; Bugami, M.A. Benefits Management Process Complements Other Project Management Methodologies. JSEA 2010, 3, 839–844. [Google Scholar] [CrossRef] [Green Version]
- Müller, J.M. Assessing the Barriers to Industry 4.0 Implementation from a Workers’ Perspective. IFAC-PapersOnLine 2019, 52, 2189–2194. [Google Scholar] [CrossRef]
- Horváth, D.; Szabó, R.Z. Driving Forces and Barriers of Industry 4.0: Do Multinational and Small and Medium-Sized Companies Have Equal Opportunities? Technol. Forecast. Soc. Change 2019, 146, 119–132. [Google Scholar] [CrossRef]
- Michna, A.; Kmieciak, R.; Czerwińska-Lubszczyk, A. Dimensions of Intercompany Cooperation in the Construction Industry and Their Relations to Performance of SMEs. Eng. Econ. 2020, 31, 221–232. [Google Scholar] [CrossRef]
- Türkeș, M.; Oncioiu, I.; Aslam, H.; Marin-Pantelescu, A.; Topor, D.; Căpușneanu, S. Drivers and Barriers in Using Industry 4.0: A Perspective of SMEs in Romania. Processes 2019, 7, 153. [Google Scholar] [CrossRef] [Green Version]
- Michna, A.; Kruszewska, J. Industry 4.0 Solution Implementation Factors: Driving Forces, Barriers and Chances. Planned Research of SME. In Sustainable Economic Development and Advancing Education Excellence in the Era of Global Pandemic, Proceedings of the 36th International Business Information Management Association (IBMIA), Cordoba, Spain, 4–5 November 2020; IBIMA: King of Prussia, PA, USA, 2020; pp. 13924–13927. [Google Scholar]
- Bajic, B.; Rikalovic, A.; Suzic, N.; Piuri, V. Industry 4.0 Implementation Challenges and Opportunities: A Managerial Perspective. IEEE Syst. J. 2021, 15, 546–559. [Google Scholar] [CrossRef]
- Michna, A.; Kmieciak, R.; Kruszewska, J. Industry 4.0 Implementation in Automotive Sector: Driving Forces, Barriers and Competencies. Pilot Empirical Study. In Proceedings of the 38th International Business Information Management Association (IBMIA), Seville, Spain, 23–24 November 2021; pp. 9444–9450, ISBN 978-0-9998551-7-1. [Google Scholar]
- Michna, A.; Kruszewska, J. Driving Forces, Barriers and Competencies in Industry 4.0 Implementation. In Proceedings of the 37th International Business Information Management Association (IBMIA), Cordoba, Spain, 30–31 May 2021; pp. 11112–11117. [Google Scholar]
- Ślusarczyk, B. Industry 4.0—Are We Ready? PJMS 2018, 17, 232–248. [Google Scholar] [CrossRef]
- Michna, A.; Brzostek, K.; Kmieciak, R. Zarządzanie Wiedzą Małego i Średniego Przedsiębiorstwa w Warunkach Orientacji Rynkowej—Zależności, Modele i Uwarunkowania Organizacyjne; Wydawnictwo Politechniki Śląskiej: Gliwice, Poland, 2020. [Google Scholar]


| Source | Industry 4.0 Definition | Key Factors Tools | Aim |
|---|---|---|---|
| Durana et al., 2019 [4] | I4.0 means a new paradigm of modern manufacturing. | Continuous innovation processes; technological development. | To be prepared for new challenges. |
| Müller, J. and Voigt, K., 2018 [5,6,8] | New paradigm of digitised and connected manufacturing. | Integrated Internet of Things and Services Industrial value creation. | To transform factories into smart and autonomous production facilities. |
| Kamble et al., 2018 [14] | I4.0 comprises a variety of technologies to enable the development of the value chain. | Digital and automated manufacturing. | To reduce manufacturing lead times; Improve product quality; Improve organisational performance. |
| German Federal Ministry for Economic Affairs and Climate Action and Platform I4.0 [15,16] | Intelligent networking of machines and processes for industry with the help of information and communication technology. | Availability; transparency; access to data; ICT—information and communication technology. | To work in a connected economy and largely determine competitiveness. |
| Polish Ministry of Development and Technology and Industry Platform of the Future [17] | Concept which describes complex process of technological and organisational transformation of enterprises. | Integration of the value chain; introduction of new business models; digitisation of products and services; | To cover individualised customer needs and the growing trend of personalising products and services. |
| Micha and Kmieciak 2020 [18] Li et al., 2019 [19] | Technology-driven paradigm shift of manufacturing industry that will digitally integrate production networks both horizontally and vertically. | Based on cyber-physical systems (CPS) and Internet of Things (IoT). | To integrate machines, devices, production, and logistics systems. |
| Item | Questions—Actual Usage (A) |
| A1 | Have you heard about the Industry 4.0 concept? |
| A2 | Please specify which technologies ARE used in your company: |
| A2_1 | Big Data and analytics |
| A2_2 | Autonomous robots |
| A2_3 | Simulation |
| A2_4 | Integration of the horizontal and vertical system |
| A2_5 | Internet of Things (IoT) |
| A2_6 | Cyber security |
| A2_7 | Additive manufacturing (e.g., 3D printing) |
| A2_8 | Augmented reality |
| A2_9 | Cloud computing |
| A2_10 | Mobile technologies |
| A2_11 | Artificial intelligence |
| A2_12 | Radio Frequency Identification (RFID) |
| A2_13 | Real-time Location System (RTLS) |
| A3 | Our Company integrates digitalisation as part of the corporate strategy. |
| A4 | Our mission and vision are in line with digital technologies. |
| A5 | Activities in our warehouses are fully automated. |
| A6 | Transport activities are planned with the help of digital technologies. |
| A7 | Our organisation uses digital technologies for the recruitment and selection of personnel. |
| Item | Questions—Future Plans (F) |
| F1 | Please specify which technologies WILL BE used in your company. |
| F1_1 | Big Data and analytics |
| F1_2 | Autonomous robots |
| F1_3 | Simulation |
| F1_4 | Integration of the horizontal and vertical system |
| F1_5 | Internet of Things (IoT) |
| F1_6 | Cyber security |
| F1_7 | Additive manufacturing (e.g., 3D printing) |
| F1_8 | Augmented reality |
| F1_9 | Cloud computing |
| F1_10 | Mobile technologies |
| F1_11 | Artificial intelligence |
| F1_12 | Radio Frequency Identification (RFID) |
| F1_13 | Real-time Location System (RTLS) |
| F2 | Over the next 3–5 years, our Company plans to increase the degree of automation |
| F3 | Over the next 3–5 years, our Company plans to significantly increase digitisation and computerisation. |
| F4 | Our Company plans to increase capital expenditure related to Industry 4.0 over the next five years. |
| Item | Questions—Fears and Barriers (B) |
| B1 | Customer requirements are too individualised to implement Industry 4.0. |
| B2 | We have too little standardisation to implement Industry 4.0. |
| B3 | For us, the costs outweigh the benefits of Industry 4.0. |
| BP4 | Our employees are afraid of being dependent on Industry 4.0 technologies. |
| BP5 | We expect that Industry 4.0 is not accepted by employees. |
| BP6 | We expect our employees to be unfamiliar with Industry 4.0. |
| BP7 | Industry 4.0 makes us lose our flexibility, requiring expensive solutions. |
| Cooperation (C) | |
| C1 | We are looking for a partner who will help us implement I4.0 solutions. |
| C2 | We need to find a partner who will help us implement I4.0 solutions. |
| C3 | We plan to find a partner to help us implement I4.0 solutions. |
| C4 | We plan to implement Industry 4.0 solutions. |
| Questions Group | Item | Mean | Std Dev | Cronbach’s Alpha Value |
|---|---|---|---|---|
| Actual usage (A) | A1 | 3.98 | 1.27 | 0.922 |
| A2_1 | 3.16 | 1.38 | ||
| A2_2 | 2.55 | 1.46 | ||
| A2_3 | 3.27 | 1.41 | ||
| A2_4 | 3.17 | 1.15 | ||
| A2_5 | 2.94 | 1.34 | ||
| A2_6 | 4.05 | 1.09 | ||
| A2_7 | 2.84 | 1.42 | ||
| A2_8 | 2.46 | 1.20 | ||
| A2_9 | 2.99 | 1.38 | ||
| A2_10 | 3.69 | 1.25 | ||
| A2_11 | 2.54 | 1.37 | ||
| A2_12 | 2.87 | 1.48 | ||
| A2_13 | 2.49 | 1.31 | ||
| A3 | 3.41 | 1.22 | ||
| A4 | 3.74 | 1.16 | ||
| A5 | 2.46 | 1.22 | ||
| A6 | 3.10 | 1.28 | ||
| A7 | 2.98 | 1.28 | ||
| Future plans (F) | F1_1 | 3.24 | 1.18 | 0.949 |
| F1_2 | 3.06 | 1.35 | ||
| F1_3 | 3.32 | 1.31 | ||
| F1_4 | 3.38 | 1.15 | ||
| F1_5 | 3.19 | 1.22 | ||
| F1_6 | 4.02 | 1.14 | ||
| F1_7 | 3.19 | 1.37 | ||
| F1_8 | 3.00 | 1.21 | ||
| F1_9 | 3.35 | 1.34 | ||
| F1_10 | 3.67 | 1.25 | ||
| F1_11 | 3.05 | 1.29 | ||
| F1_12 | 3.21 | 1.34 | ||
| F1_13 | 2.95 | 1.30 | ||
| F2 | 3.83 | 1.10 | ||
| F3 | 3.92 | 1.04 | ||
| F4 | 3.46 | 1.14 | ||
| Fears and Barriers (B) | B1 | 2.25 | 1.12 | 0.802 |
| B2 | 2.35 | 1.11 | ||
| B3 | 2.39 | 1.02 | ||
| BP4 | 2.36 | 1.01 | ||
| BP5 | 2.50 | 1.07 | ||
| BP6 | 3.05 | 1.21 | ||
| BP7 | 2.08 | 0.84 | ||
| Inter-organisational Cooperation (C) | C1 | 3.98 | 1.04 | 0.754 |
| C2 | 3.90 | 1.09 | ||
| C3 | 3.02 | 1.00 | ||
| C4 | 4.00 | 1.00 |
| A1 | Count | % | Cumulative % |
|---|---|---|---|
| 1 | 11 | 8.80 | 8.80 |
| 2 | 14 | 11.20 | 20.00 |
| 3 | 7 | 5.60 | 25.60 |
| 4 | 40 | 32.00 | 57.60 |
| 5 | 53 | 42.40 | 100.00 |
| Enterprise | Measures | 1 | 2 | 3 | 4 | 5 | All |
|---|---|---|---|---|---|---|---|
| Other | Count | 2 | 4 | 1 | 11 | 15 | 33 |
| % of Row | 6.06 | 12.12 | 3.01 | 33.33 | 45.45 | 100 | |
| Poland | Count | 9 | 10 | 6 | 29 | 38 | 92 |
| % of Row | 9.78 | 10.87 | 6.52 | 31.52 | 41.3 | 100 | |
| Large | Count | 6 | 11 | 2 | 29 | 35 | 83 |
| % of Row | 7.23 | 13.25 | 2.41 | 34.94 | 42.17 | 100 | |
| SME | Count | 5 | 1 | 2 | 10 | 14 | 32 |
| % of Row | 15.63 | 3.13 | 6.25 | 31.25 | 43.75 | 100 | |
| Count | 0 | 2 | 3 | 1 | 4 | 10 | |
| Micro | % of Row | 0 | 20.00 | 30.00 | 10.00 | 40.00 | 100 |
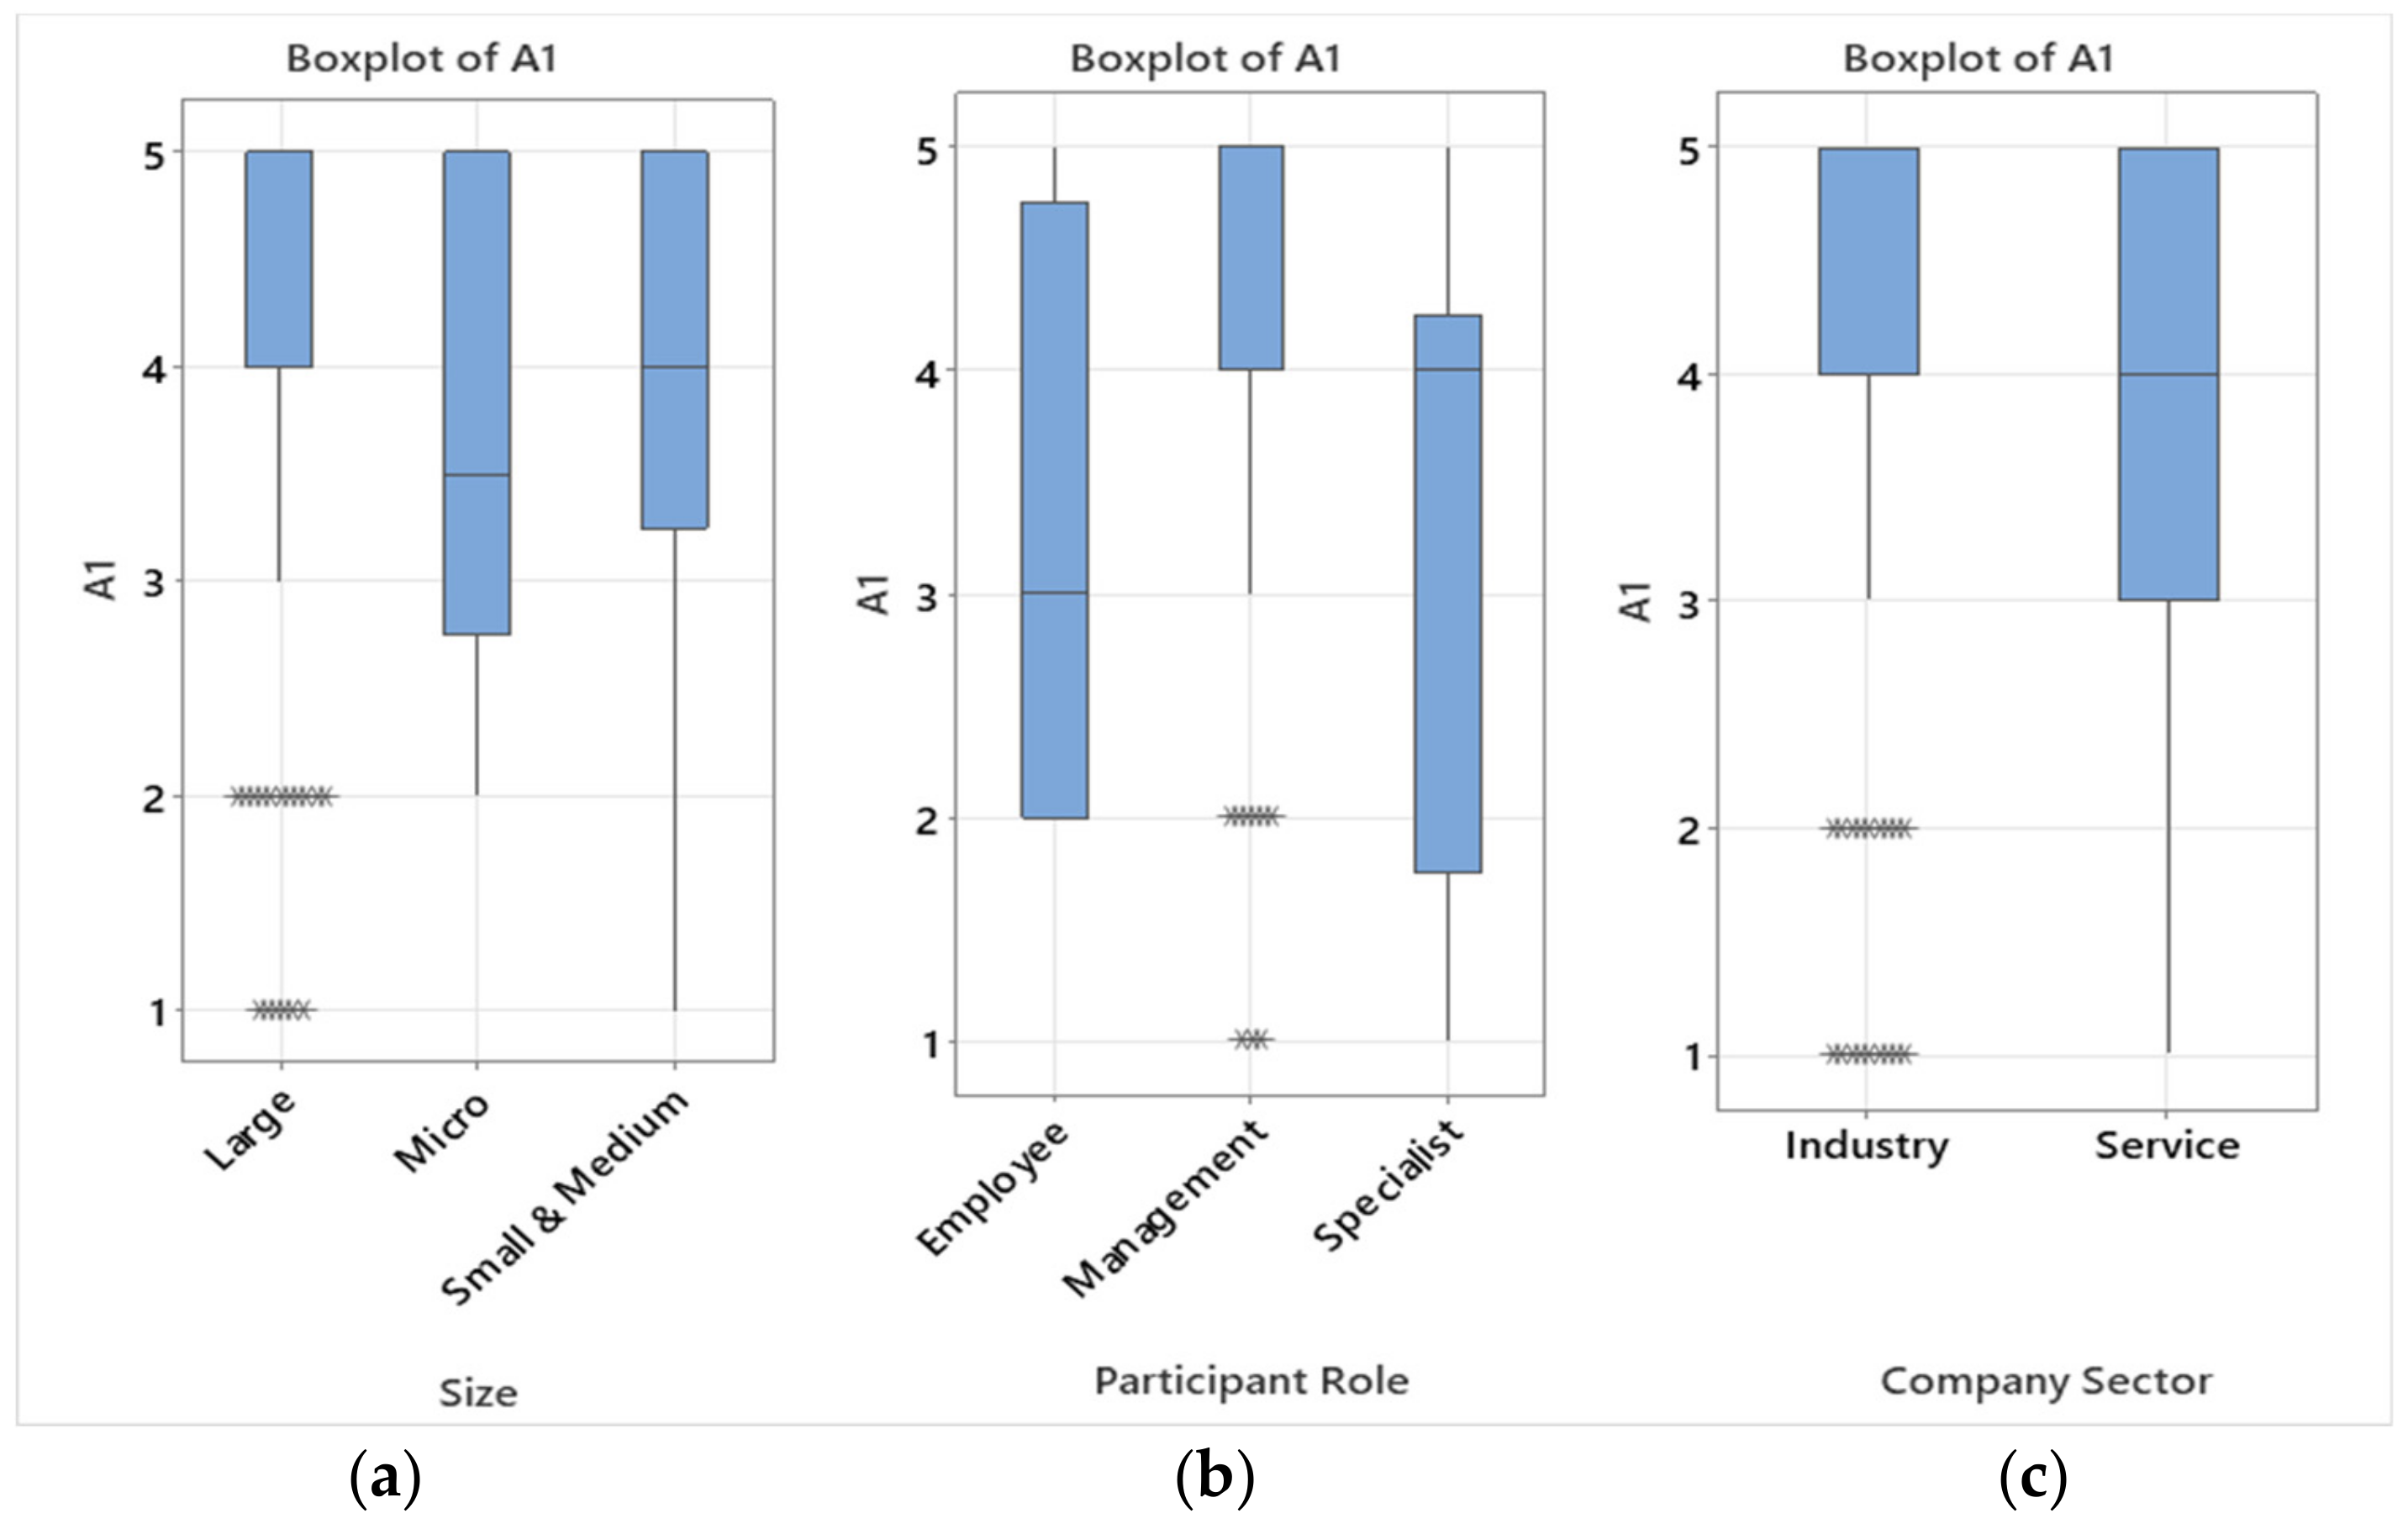
| Variable | N | Mean | StDev | Q1 | Median | Q3 | |
|---|---|---|---|---|---|---|---|
| Size | Large | 83 | 3.92 | 1.28 | 1.00 | 4.00 | 4.00 |
| Small and Medium | 32 | 3.84 | 1.44 | 1.00 | 3.25 | 4.00 | |
| Micro | 10 | 3.70 | 1.25 | 2.00 | 2.75 | 3.50 | |
| Participant | Management | 87 | 4.21 | 1.06 | 1.00 | 4.00 | 5.00 |
| Specialist | 34 | 3.12 | 1.55 | 1.00 | 1.75 | 4.00 | |
| Employee | 4 | 3.25 | 1.50 | 2.00 | 2.00 | 3.00 | |
| Company sector | Industry | 93 | 3.93 | 1.31 | 4.00 | 4.00 | 5.00 |
| Service | 32 | 3.71 | 1.30 | 3.00 | 4.00 | 5.00 |
| Variable | Description | Mean | Median | Mode | StDev | Total Count |
|---|---|---|---|---|---|---|
| A2_1 | Big Data and analytics | 3.16 | 3.00 | 4 | 1.36 | 125 |
| A2_2 | Autonomous robots | 2.65 | 2.00 | 1 | 1.50 | 125 |
| A2_3 | Simulation | 3.24 | 4.00 | 4 | 1.41 | 125 |
| A2_4 | Integrat. of the horizontal and vertical syst. | 3.15 | 3.00 | 3 | 1.18 | 125 |
| A2_5 | Internet of Things (IoT) | 2.96 | 3.00 | 3 | 1.37 | 125 |
| A2_6 | Cyber security | 4.11 | 4.00 | 5 | 1.11 | 125 |
| A2_7 | Additive manufacturing (e.g., 3D printing) | 2.96 | 3.00 | 1; 4 | 1.48 | 125 |
| A2_8 | Augmented reality | 2.51 | 2.00 | 2 | 1.26 | 125 |
| A2_9 | Cloud computing | 3.04 | 3.00 | 4 | 1.36 | 125 |
| A2_10 | Mobile technologies | 3.73 | 4.00 | 4 | 1.22 | 125 |
| A2_11 | Artificial intelligence | 2.59 | 2.00 | 1 | 1.38 | 125 |
| A2_12 | Radio Frequency Identification (RFID) | 2.98 | 3.00 | 1; 4 | 1.48 | 125 |
| A2_13 | Real-time Location System (RTLS) | 2.57 | 2.50 | 1 | 1.34 | 125 |
| Variable | Mean | Median | Mode | StDev | Total Count |
|---|---|---|---|---|---|
| A3—Our Company integrates digitalisation as part of the corporate strategy | 3.455 | 4.000 | 4 | 1.212 | 88 |
| A4—Our mission and vision are in line with digital technologies | 3.759 | 4.000 | 4 | 1.141 | 87 |
| A5—Operations in our warehouses are fully automated | 2.488 | 2.000 | 2 | 1.225 | 86 |
| A6—Transport activities are planned using digital technologies | 3.116 | 3.000 | 4 | 1.278 | 86 |
| A7—Our organisation uses digital technologies for the recruitment and selection of personnel | 3.023 | 3.000 | 4 | 1.294 | 87 |
| Value | Measures | Employee | Specialist | Management | ||||||
|---|---|---|---|---|---|---|---|---|---|---|
| Large | Micro | SME | Large | Micro | SME | Large | Micro | SME | ||
| 1 | Count | 1 | 0 | 0 | 3 | 0 | 1 | 0 | 1 | 4 |
| % of Row | 10 | 0 | 0 | 30 | 0 | 10 | 0 | 10 | 40 | |
| 2 | Count | 0 | 0 | 0 | 1 | 0 | 0 | 1 | 1 | 4 |
| % of Row | 0 | 0 | 0 | 14.29 | 0 | 0 | 14.29 | 14.29 | 57.14 | |
| 3 | Count | 0 | 0 | 0 | 5 | 0 | 4 | 7 | 1 | 3 |
| % of Row | 0 | 0 | 0 | 25 | 0 | 20 | 35 | 5 | 15 | |
| 4 | Count | 0 | 1 | 0 | 12 | 0 | 1 | 16 | 2 | 3 |
| % of Row | 0 | 2.86 | 0 | 34.29 | 0 | 2.86 | 45.71 | 5.71 | 8.57 | |
| 5 | Count | 0 | 0 | 0 | 0 | 0 | 0 | 13 | 0 | 3 |
| % of Row | 0 | 0 | 0 | 0 | 0 | 0 | 81.25 | 0 | 18.75 | |
| All | Count | 1 | 1 | 0 | 21 | 0 | 6 | 37 | 5 | 17 |
| % of Row | 1.14 | 1.14 | 0 | 23.86 | 0 | 6.82 | 42.05 | 5.68 | 19.32 | |
| Variable | Description | Mean | Median | Mode | StDev | Total Count |
|---|---|---|---|---|---|---|
| F1_1 | Big Data and analytics | 3.35 | 3.00 | 3 | 1.18 | 125 |
| F1_2 | Autonomous robots | 3.07 | 3.00 | 4 | 1.35 | 125 |
| F1_3 | Simulation | 3.38 | 4.00 | 4 | 1.31 | 125 |
| F1_4 | Integration of the horizontal and vertical syst. | 3.35 | 3.00 | 3 | 1.17 | 125 |
| F1_5 | Internet of Things (IoT) | 3.24 | 3.00 | 3 | 1.24 | 125 |
| F1_6 | Cyber security | 4.05 | 4.00 | 5 | 1.12 | 125 |
| F1_7 | Additive manufacturing (e.g., 3D printing) | 3.21 | 3.00 | 3 | 1.39 | 125 |
| F1_8 | Augmented reality | 3.06 | 3.00 | 3 | 1.18 | 125 |
| F1_9 | Cloud computing | 3.38 | 3.00 | 3 | 1.29 | 125 |
| F1_10 | Mobile technologies | 3.77 | 4.00 | 4 | 1.18 | 125 |
| F1_11 | Artificial intelligence | 3.10 | 3.00 | 3 | 1.25 | 125 |
| F1_12 | Radio Frequency Identification (RFID) | 3.22 | 3.00 | 3 | 1.31 | 125 |
| F1_13 | Real-time Location System (RTLS) | 2.99 | 3.00 | 3 | 1.25 | 125 |
| Variable | Large | SME | Micro | All |
|---|---|---|---|---|
| Big Data and analytics | −0.75 | −0.82 | −0.43 | −0.76 |
| Autonomous robots | −0.46 | −0.98 | −1.40 | −0.66 |
| Simulation | 0.23 | −0.10 | 0.29 | 0.14 |
| Integration of the horizontal and vertical system | 0.17 | 0.17 | 0.40 | 0.20 |
| Internet of Things (IoT) | 0.15 | 0.12 | −0.50 | 0.09 |
| Cyber security | 1.15 | 0.84 | 0.31 | 1.01 |
| Additive manufacturing (e.g., 3D printing) | 0.36 | 0.11 | −0.52 | 0.23 |
| Augmented reality | 0.15 | 0.10 | −0.19 | 0.11 |
| Cloud computing | 0.10 | 1.14 | 1.40 | 0.42 |
| Mobile technologies | 1.00 | 1.29 | 1.58 | 1.12 |
| Artificial intelligence | 0.58 | 0.53 | 0.00 | 0.52 |
| Radio Frequency Identification (RFID) | 0.77 | 0.38 | 0.52 | 0.65 |
| Real-time Location System (RTLS) | 0.63 | 0.06 | 0.45 | 0.47 |
| Variable | Mean | Median | Mode | StDev | Total Count |
|---|---|---|---|---|---|
| F2—Over the next 3–5 years, our Company plans to increase the degree of automation | 3.89 | 4.00 | 4 | 1.09 | 88 |
| F3—Over the next 3–5 years, our Company plans to significantly increase digitisation and computerisation | 3.86 | 4.00 | 4 | 1.04 | 87 |
| F4—Our Company plans to increase capital expenditure related to Industry 4.0 over the next five years | 3.48 | 2.00 | 3 | 1.13 | 86 |
| Variable | Mean | Median | Mode | StDev | Total Count |
|---|---|---|---|---|---|
| BP4—Our employees are afraid of being dependent on I4.0 technologies | 2.35 | 2 | 2 | 1.00 | 123 |
| BP5—We expect that I4.0 is not accepted by employees | 2.43 | 2 | 2 | 1.04 | 105 |
| BP6—We expect our employees to be unfamiliar with I4.0 | 2.97 | 3 | 4 | 1.23 | 102 |
| BP7—I4.0 makes us lose our flexibility, requiring expensive solutions | 2.05 | 2 | 2 | 0.83 | 102 |
| B1 | B2 | B3 | BP4 | BP5 | BP6 | BP7 | |
|---|---|---|---|---|---|---|---|
| A2_1 | −0.33 | −0.32 | −0.44 | 0.00 | −0.17 | −0.32 | −0.13 |
| A2_2 | −0.14 | −0.11 | −0.22 | −0.05 | −0.09 | −0.21 | −0.10 |
| A2_3 | −0.26 | −0.18 | −0.27 | −0.16 | −0.24 | −0.38 | −0.17 |
| A2_4 | −0.29 | −0.34 | −0.31 | −0.13 | −0.24 | −0.26 | −0.13 |
| A2_5 | −0.29 | −0.33 | −0.45 | 0.01 | −0.11 | −0.21 | −0.01 |
| A2_6 | −0.35 | −0.40 | −0.24 | −0.10 | −0.20 | −0.08 | −0.10 |
| A2_7 | −0.18 | −0.02 | −0.23 | −0.01 | −0.07 | −0.25 | −0.14 |
| A2_8 | −0.27 | −0.20 | −0.37 | −0.13 | −0.10 | −0.36 | −0.20 |
| A2_9 | −0.26 | −0.30 | −0.36 | −0.20 | −0.21 | −0.40 | −0.12 |
| A2_10 | −0.28 | −0.23 | −0.38 | −0.16 | −0.19 | −0.30 | −0.04 |
| A2_11 | −0.26 | −0.32 | −0.34 | −0.14 | −0.15 | −0.25 | −0.09 |
| A2_12 | −0.24 | −0.20 | −0.35 | −0.01 | −0.16 | −0.15 | −0.04 |
| A2_13 | −0.20 | −0.19 | −0.28 | 0.03 | −0.09 | −0.19 | −0.09 |
| B1 | B2 | B3 | BP4 | BP5 | BP6 | BP7 | |
|---|---|---|---|---|---|---|---|
| F1_1 | −0.50 | −0.47 | −0.51 | 0.00 | −0.13 | −0.07 | −0.08 |
| F1_2 | −0.29 | −0.23 | −0.39 | 0.02 | −0.03 | −0.08 | −0.06 |
| F1_3 | −0.39 | −0.30 | −0.34 | −0.07 | −0.11 | −0.12 | −0.15 |
| F1_4 | −0.46 | −0.35 | −0.41 | −0.09 | −0.05 | −0.06 | −0.19 |
| F1_5 | −0.42 | −0.32 | −0.47 | 0.03 | −0.07 | −0.12 | −0.01 |
| F1_6 | −0.42 | −0.45 | −0.36 | −0.02 | −0.10 | −0.02 | −0.13 |
| F1_7 | −0.28 | −0.28 | −0.37 | 0.05 | −0.01 | −0.08 | −0.06 |
| F1_8 | −0.39 | −0.36 | −0.40 | −0.06 | −0.07 | −0.19 | −0.11 |
| F1_9 | −0.42 | −0.31 | −0.40 | −0.12 | −0.16 | −0.21 | −0.10 |
| F1_10 | −0.51 | −0.45 | −0.51 | −0.06 | −0.12 | −0.02 | −0.09 |
| F1_11 | −0.40 | −0.39 | −0.36 | −0.09 | −0.09 | −0.10 | −0.04 |
| F1_12 | −0.25 | −0.24 | −0.38 | 0.08 | −0.01 | 0.00 | −0.02 |
| F1_13 | −0.29 | −0.34 | −0.42 | 0.09 | −0.08 | −0.07 | −0.03 |
| Variable 1 | Variable 2 | Pearson Value |
|---|---|---|
| B3 | F4 | −0.71 |
| BP5 | BP4 | 0.74 |
| F2 | F4 | 0.74 |
| F3 | F4 | 0.73 |
| A2_1 | A2_5 | 0.71 |
| A2_4 | A2_5 | 0.71 |
| A2_12 | A2_13 | 0.72 |
| A2_2 | F1_2 | 0.75 |
| A2_3 | F1_3 | 0.74 |
| A2_6 | F1_6 | 0.70 |
| A2_7 | F1_7 | 0.75 |
| A2_11 | F1_11 | 0.71 |
| A2_12 | F1_12 | 0.80 |
| F1_2 | F1_12 | 0.70 |
| F1_3 | F1_4 | 0.77 |
| F1_8 | F1_13 | 0.70 |
| F1_12 | F1_13 | 0.81 |
| C1 | Count | % | C2 | Count | % | C3 | Count | % | C4 | Count | % |
|---|---|---|---|---|---|---|---|---|---|---|---|
| 1 | 7 | 6.60 | 1 | 4 | 7.14 | 1 | 3 | 5.45 | 1 | 2 | 2.74 |
| 2 | 25 | 23.58 | 2 | 3 | 5.36 | 2 | 2 | 3.64 | 2 | 5 | 6.85 |
| 3 | 49 | 46.23 | 3 | 15 | 26.79 | 3 | 17 | 30.91 | 3 | 9 | 12.33 |
| 4 | 18 | 16.98 | 4 | 13 | 23.21 | 4 | 11 | 20.00 | 4 | 36 | 49.32 |
| 5 | 7 | 6.60 | 5 | 21 | 37.50 | 5 | 22 | 40.00 | 5 | 21 | 28.77 |
| N = 106 | N = 56 | N = 55 | N = 73 | ||||||||
| B1 | B2 | B3 | BP4 | BP5 | BP6 | BP7 | |
|---|---|---|---|---|---|---|---|
| C1—We are looking for a partner who will help us implement I4.0 solutions | −0.28 | 0.09 | −0.17 | 0.12 | 0.22 | 0.23 | 0.02 |
| C2—We need to find a partner who will help us implement I4.0 solutions | −0.34 | −0.23 | −0.38 | 0.14 | 0.10 | 0.13 | −0.04 |
| C3—We plan to find a partner to help us implement I4.0 solutions | −0.53 | −0.41 | −0.57 | −0.07 | −0.11 | −0.14 | −0.30 |
| C4—We plan to implement Industry 4.0 | −0.44 | −0.25 | −0.49 | 0.14 | 0.04 | −0.05 | −0.10 |
| C1 | C2 | C3 | |
|---|---|---|---|
| C2 | 0.434 | ||
| C3 | 0.284 | 0.731 | |
| C4 | 0.471 | 0.534 | 0.18 |
| C4 | C1 | C2 | C3 |
|---|---|---|---|
| 1 | 1.00 | 1.00 | 3.0 |
| 2 | 1.80 | 3.50 | 3.50 |
| 3 | 2.85 | 3.33 | 3.50 |
| 4 | 3.16 | 4.25 | 3.91 |
| 5 | 3.31 | 3.14 | 4.3 |
| F2_1 | F2_2 | F2_3 | F2_4 | F2_5 | F2_6 | F2_7 | F2_8 | F2_9 | F2_10 | F2_11 | F2_12 | F2_13 | |
|---|---|---|---|---|---|---|---|---|---|---|---|---|---|
| C1 | 0.19 | 0.27 | 0.14 | 0.22 | 0.27 | 0.16 | 0.04 | 0.20 | 0.15 | 0.21 | 0.10 | 0.28 | 0.20 |
| C2 | 0.08 | 0.10 | 0.22 | 0.14 | 0.26 | 0.19 | 0.19 | 0.18 | 0.00 | 0.26 | 0.11 | 0.20 | 0.21 |
| C3 | 0.22 | 0.10 | 0.22 | 0.26 | 0.36 | 0.27 | 0.28 | 0.27 | 0.14 | 0.38 | 0.33 | 0.31 | 0.33 |
| C4 | 0.29 | 0.29 | 0.08 | 0.18 | 0.18 | 0.33 | 0.22 | 0.23 | 0.11 | 0.24 | 0.20 | 0.18 | 0.17 |
Publisher’s Note: MDPI stays neutral with regard to jurisdictional claims in published maps and institutional affiliations. |
© 2022 by the authors. Licensee MDPI, Basel, Switzerland. This article is an open access article distributed under the terms and conditions of the Creative Commons Attribution (CC BY) license (https://creativecommons.org/licenses/by/4.0/).
Share and Cite
Michna, A.; Kruszewska, J. Determining the Level of Use of the Industry 4.0 Solutions in the COVID-19 Pandemic Era: Results of Empirical Research. Sustainability 2022, 14, 8844. https://doi.org/10.3390/su14148844
Michna A, Kruszewska J. Determining the Level of Use of the Industry 4.0 Solutions in the COVID-19 Pandemic Era: Results of Empirical Research. Sustainability. 2022; 14(14):8844. https://doi.org/10.3390/su14148844
Chicago/Turabian StyleMichna, Anna, and Joanna Kruszewska. 2022. "Determining the Level of Use of the Industry 4.0 Solutions in the COVID-19 Pandemic Era: Results of Empirical Research" Sustainability 14, no. 14: 8844. https://doi.org/10.3390/su14148844
APA StyleMichna, A., & Kruszewska, J. (2022). Determining the Level of Use of the Industry 4.0 Solutions in the COVID-19 Pandemic Era: Results of Empirical Research. Sustainability, 14(14), 8844. https://doi.org/10.3390/su14148844