
An Application of Multiple-Criteria Decision Analysis for Risk Prioritization and Management: A Case Study of the Fisheries Sector in Pakistan


Abstract
:1. Introduction
- (1)
- Is there a wide range of risks hampering sustainable development in the Pakistani fisheries sector?
- (2)
- In which order should the main and sub-risk factors be ranked?
- (3)
- Which risk factors need to be addressed the most thoroughly in order to improve management performance?
2. Review of Literature and Theoretical Model
2.1. Fuzzy AHP and IPA
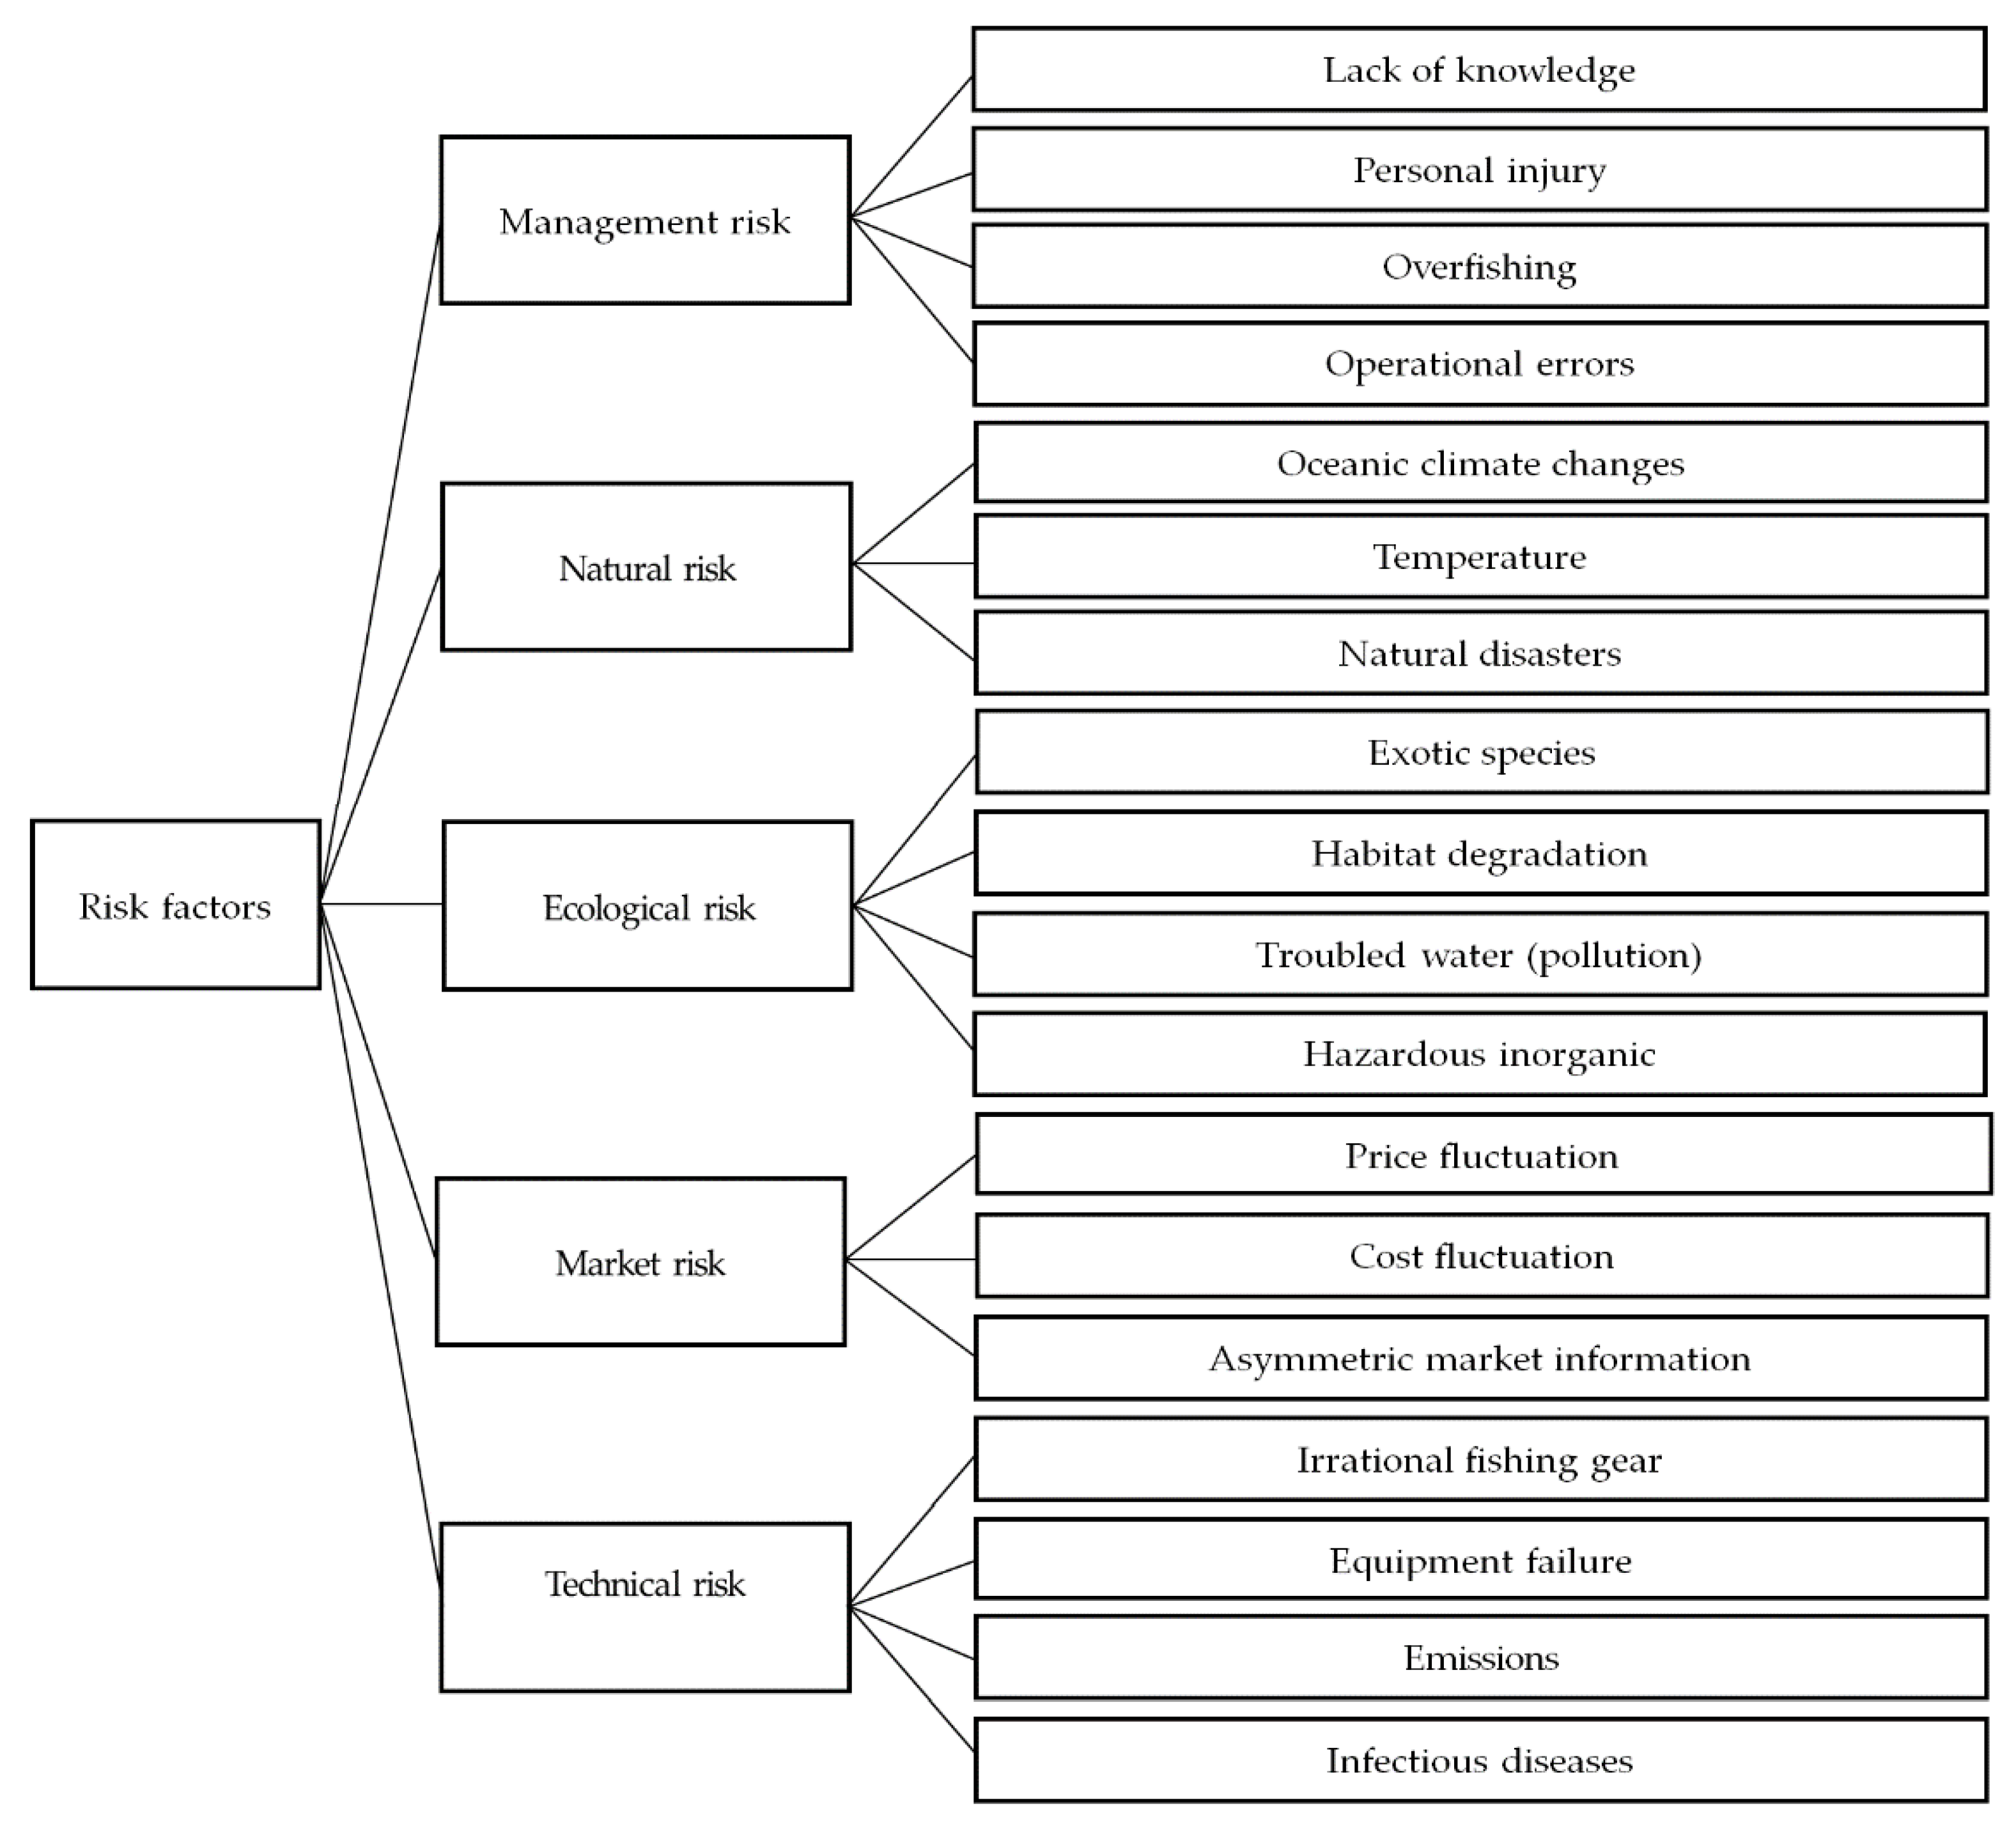
2.2. Natural Risks
2.3. Ecological Risks
2.4. Market Risks
2.5. Technical Risks
2.6. Management Risks
3. Materials and Methods
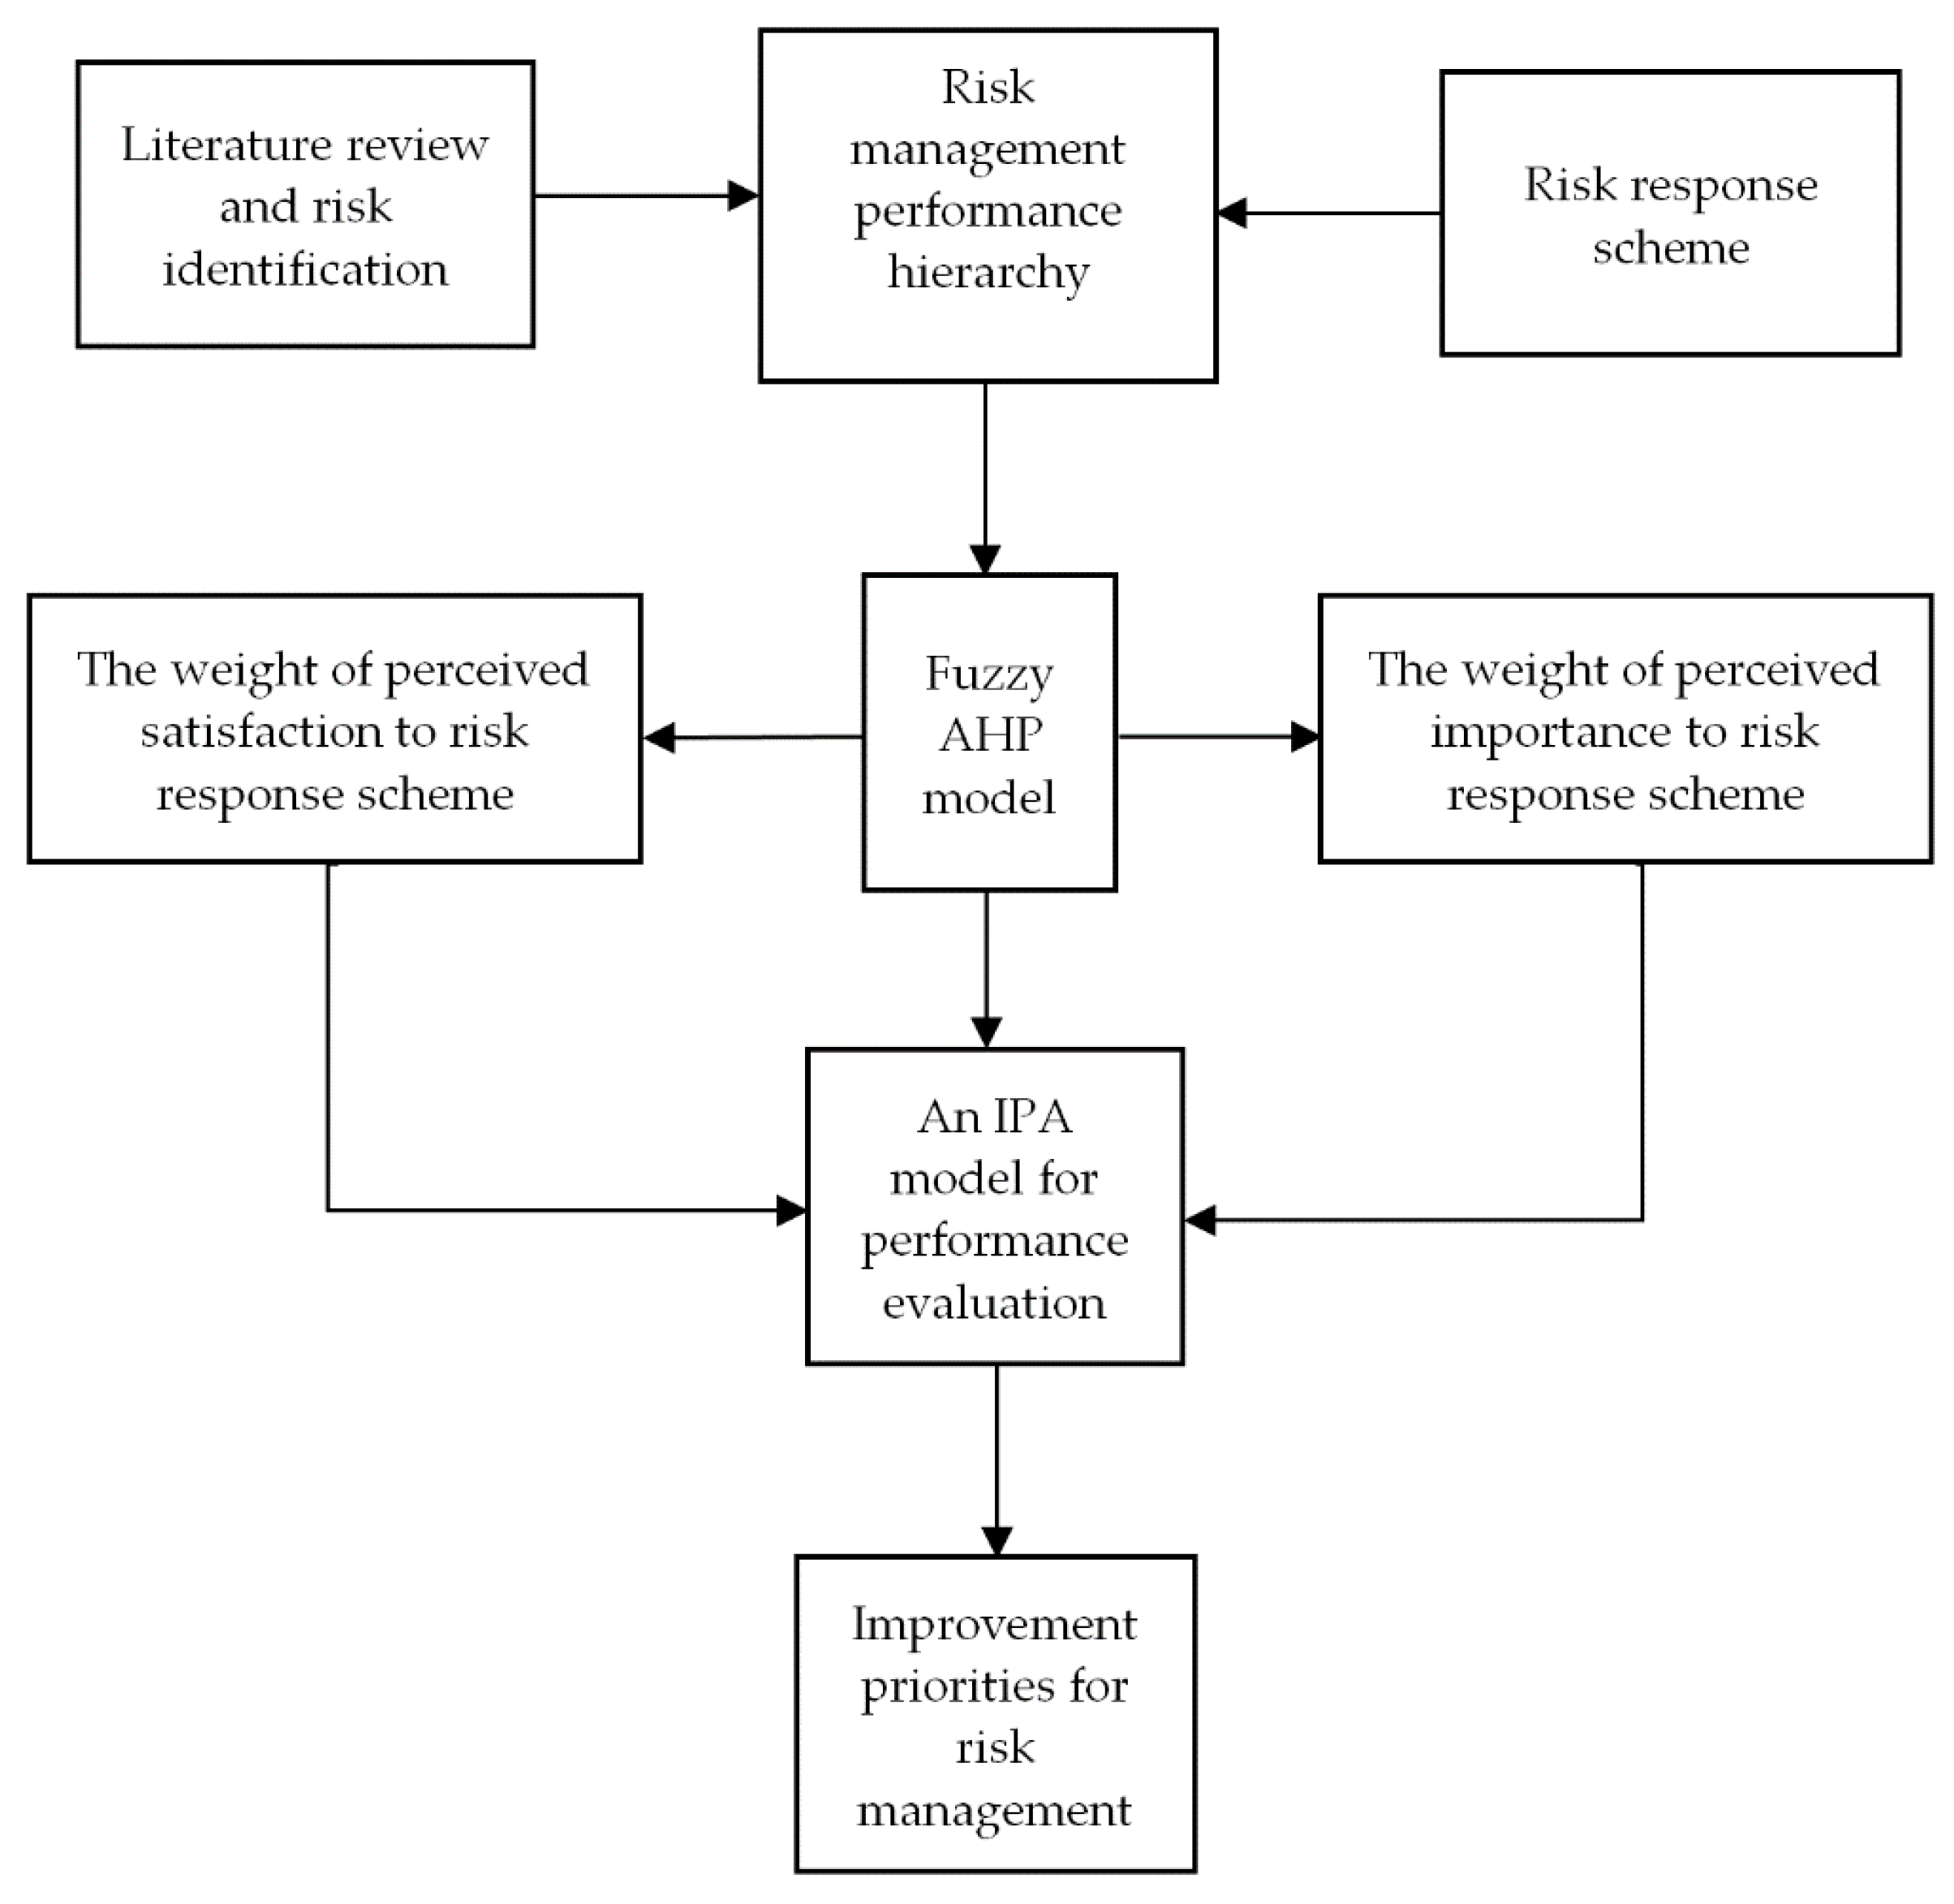
3.1. Research Outline
3.2. Data Acquisition
3.3. Data Analysis
3.3.1. Fuzzy AHP
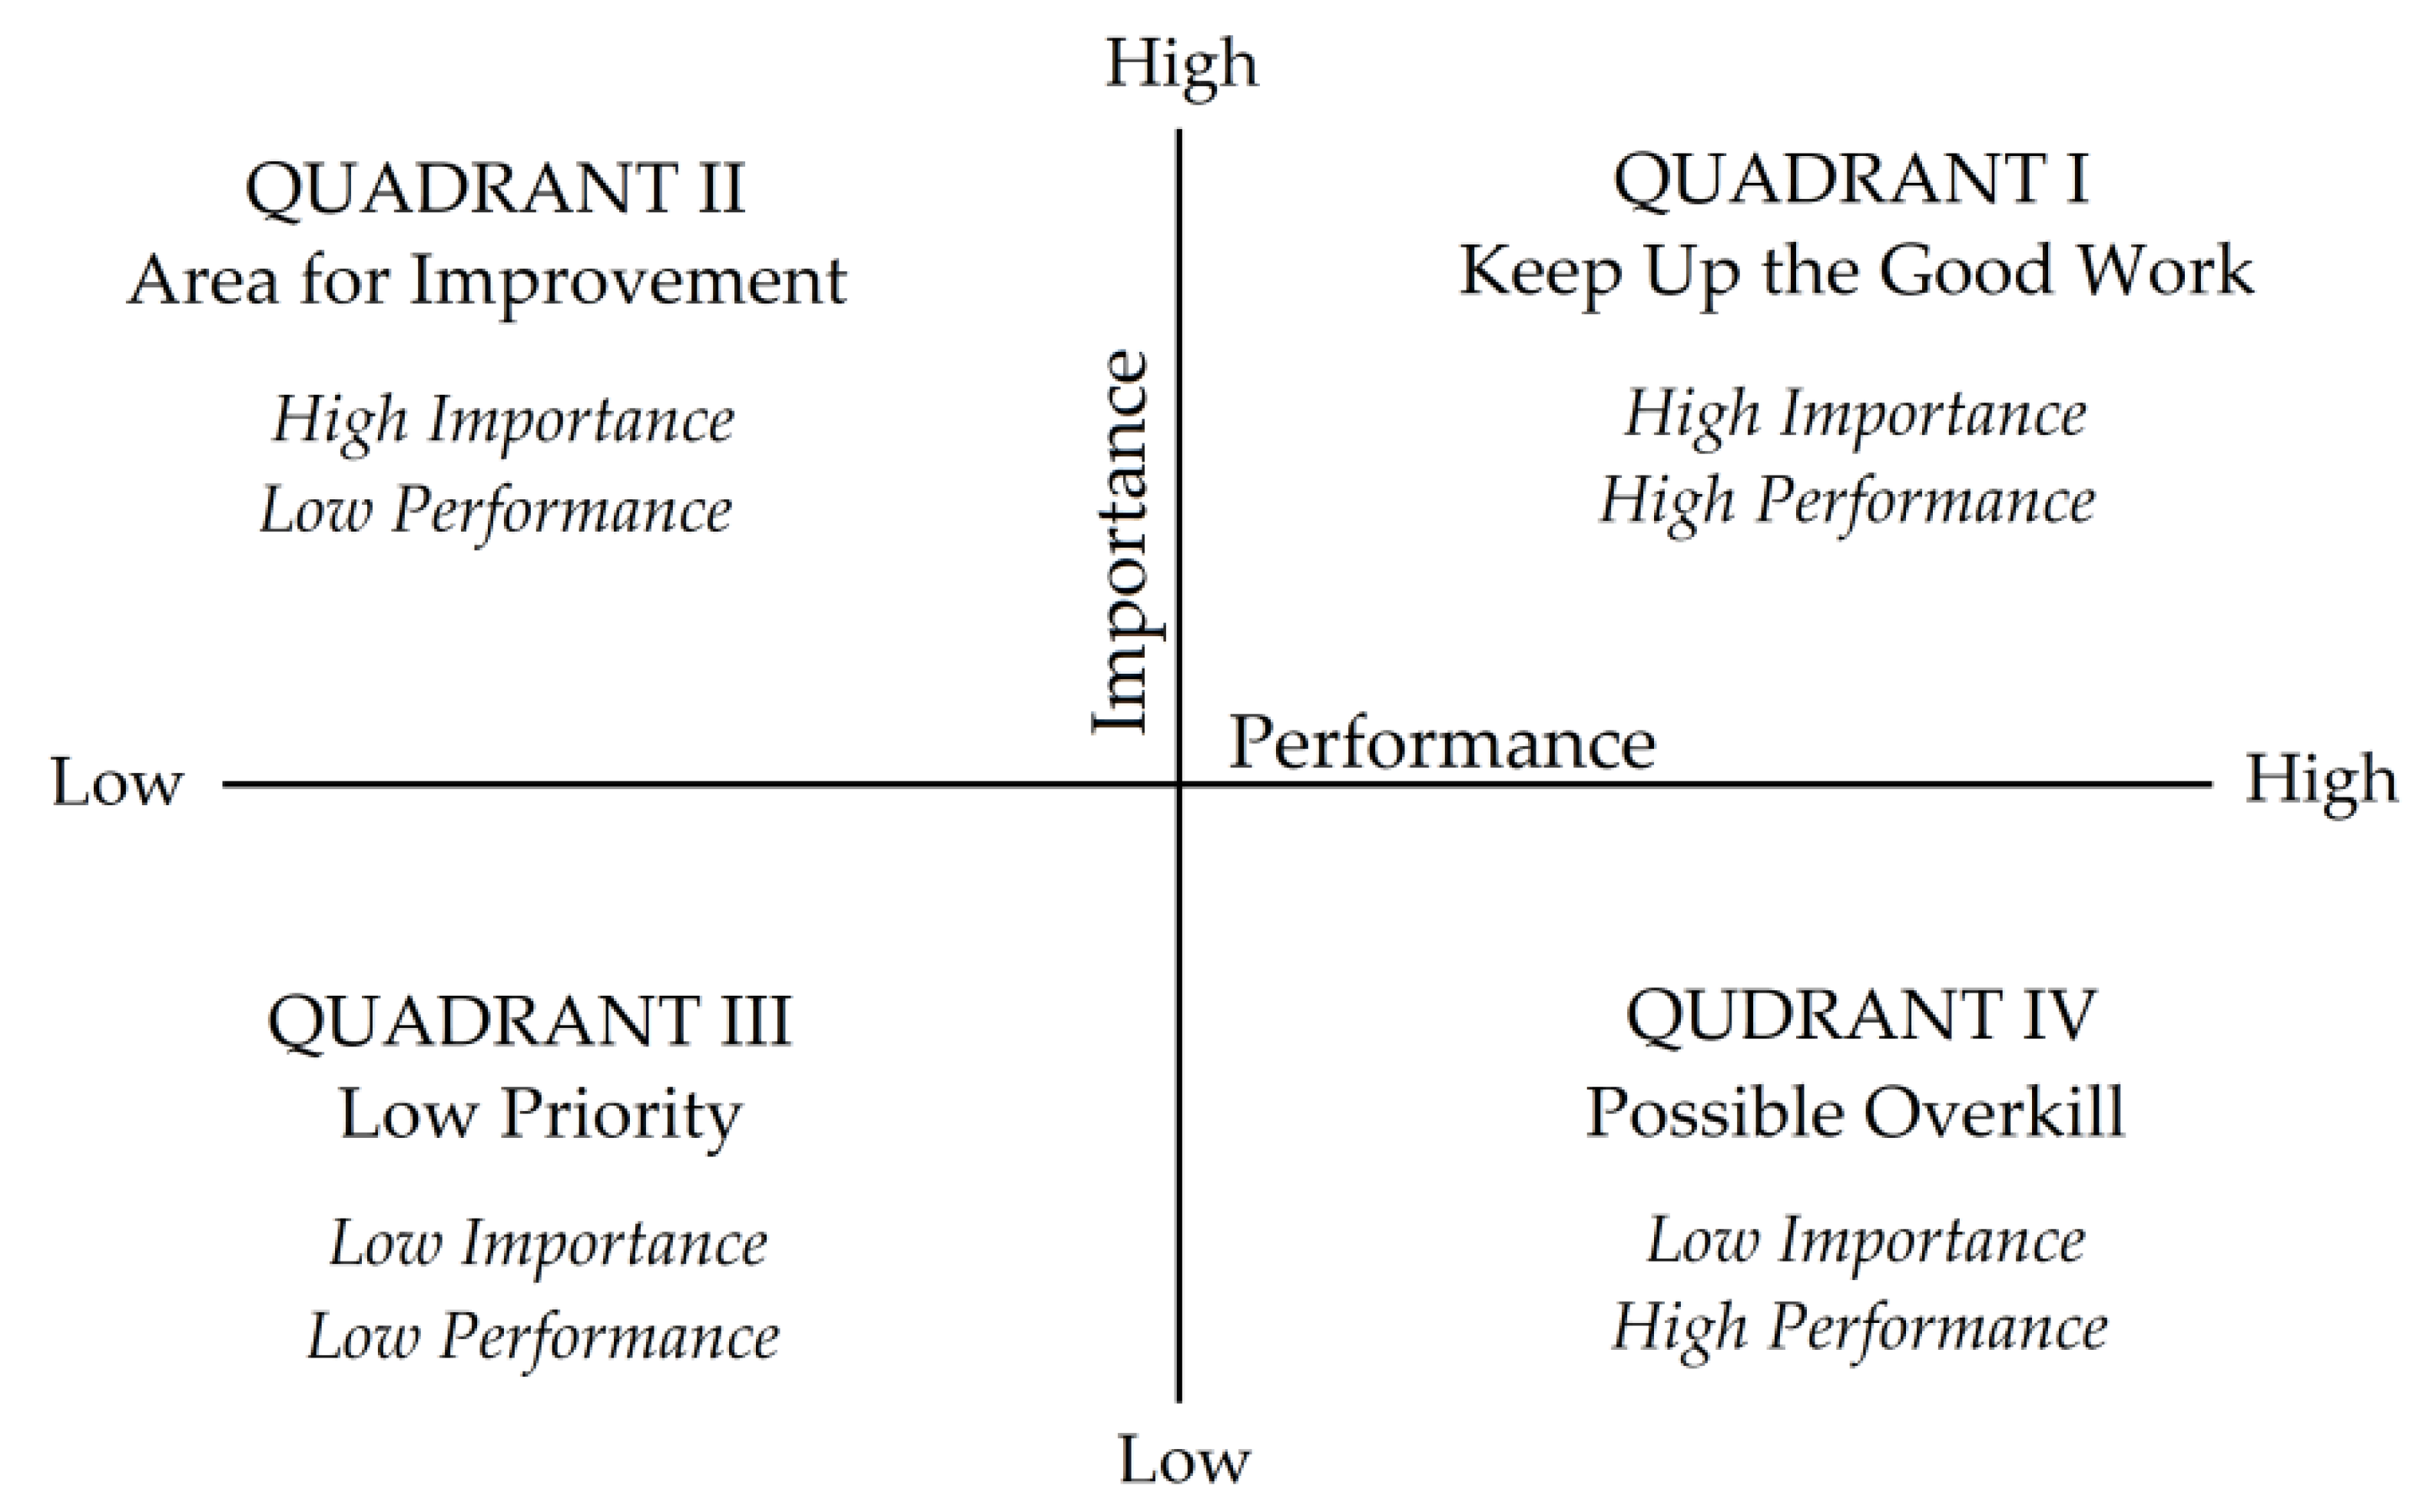
3.3.2. IPA
4. Results
4.1. Description of Research Participants
4.2. Main Risk Factors: Ranking of Importance and Priority (AHP Analysis)
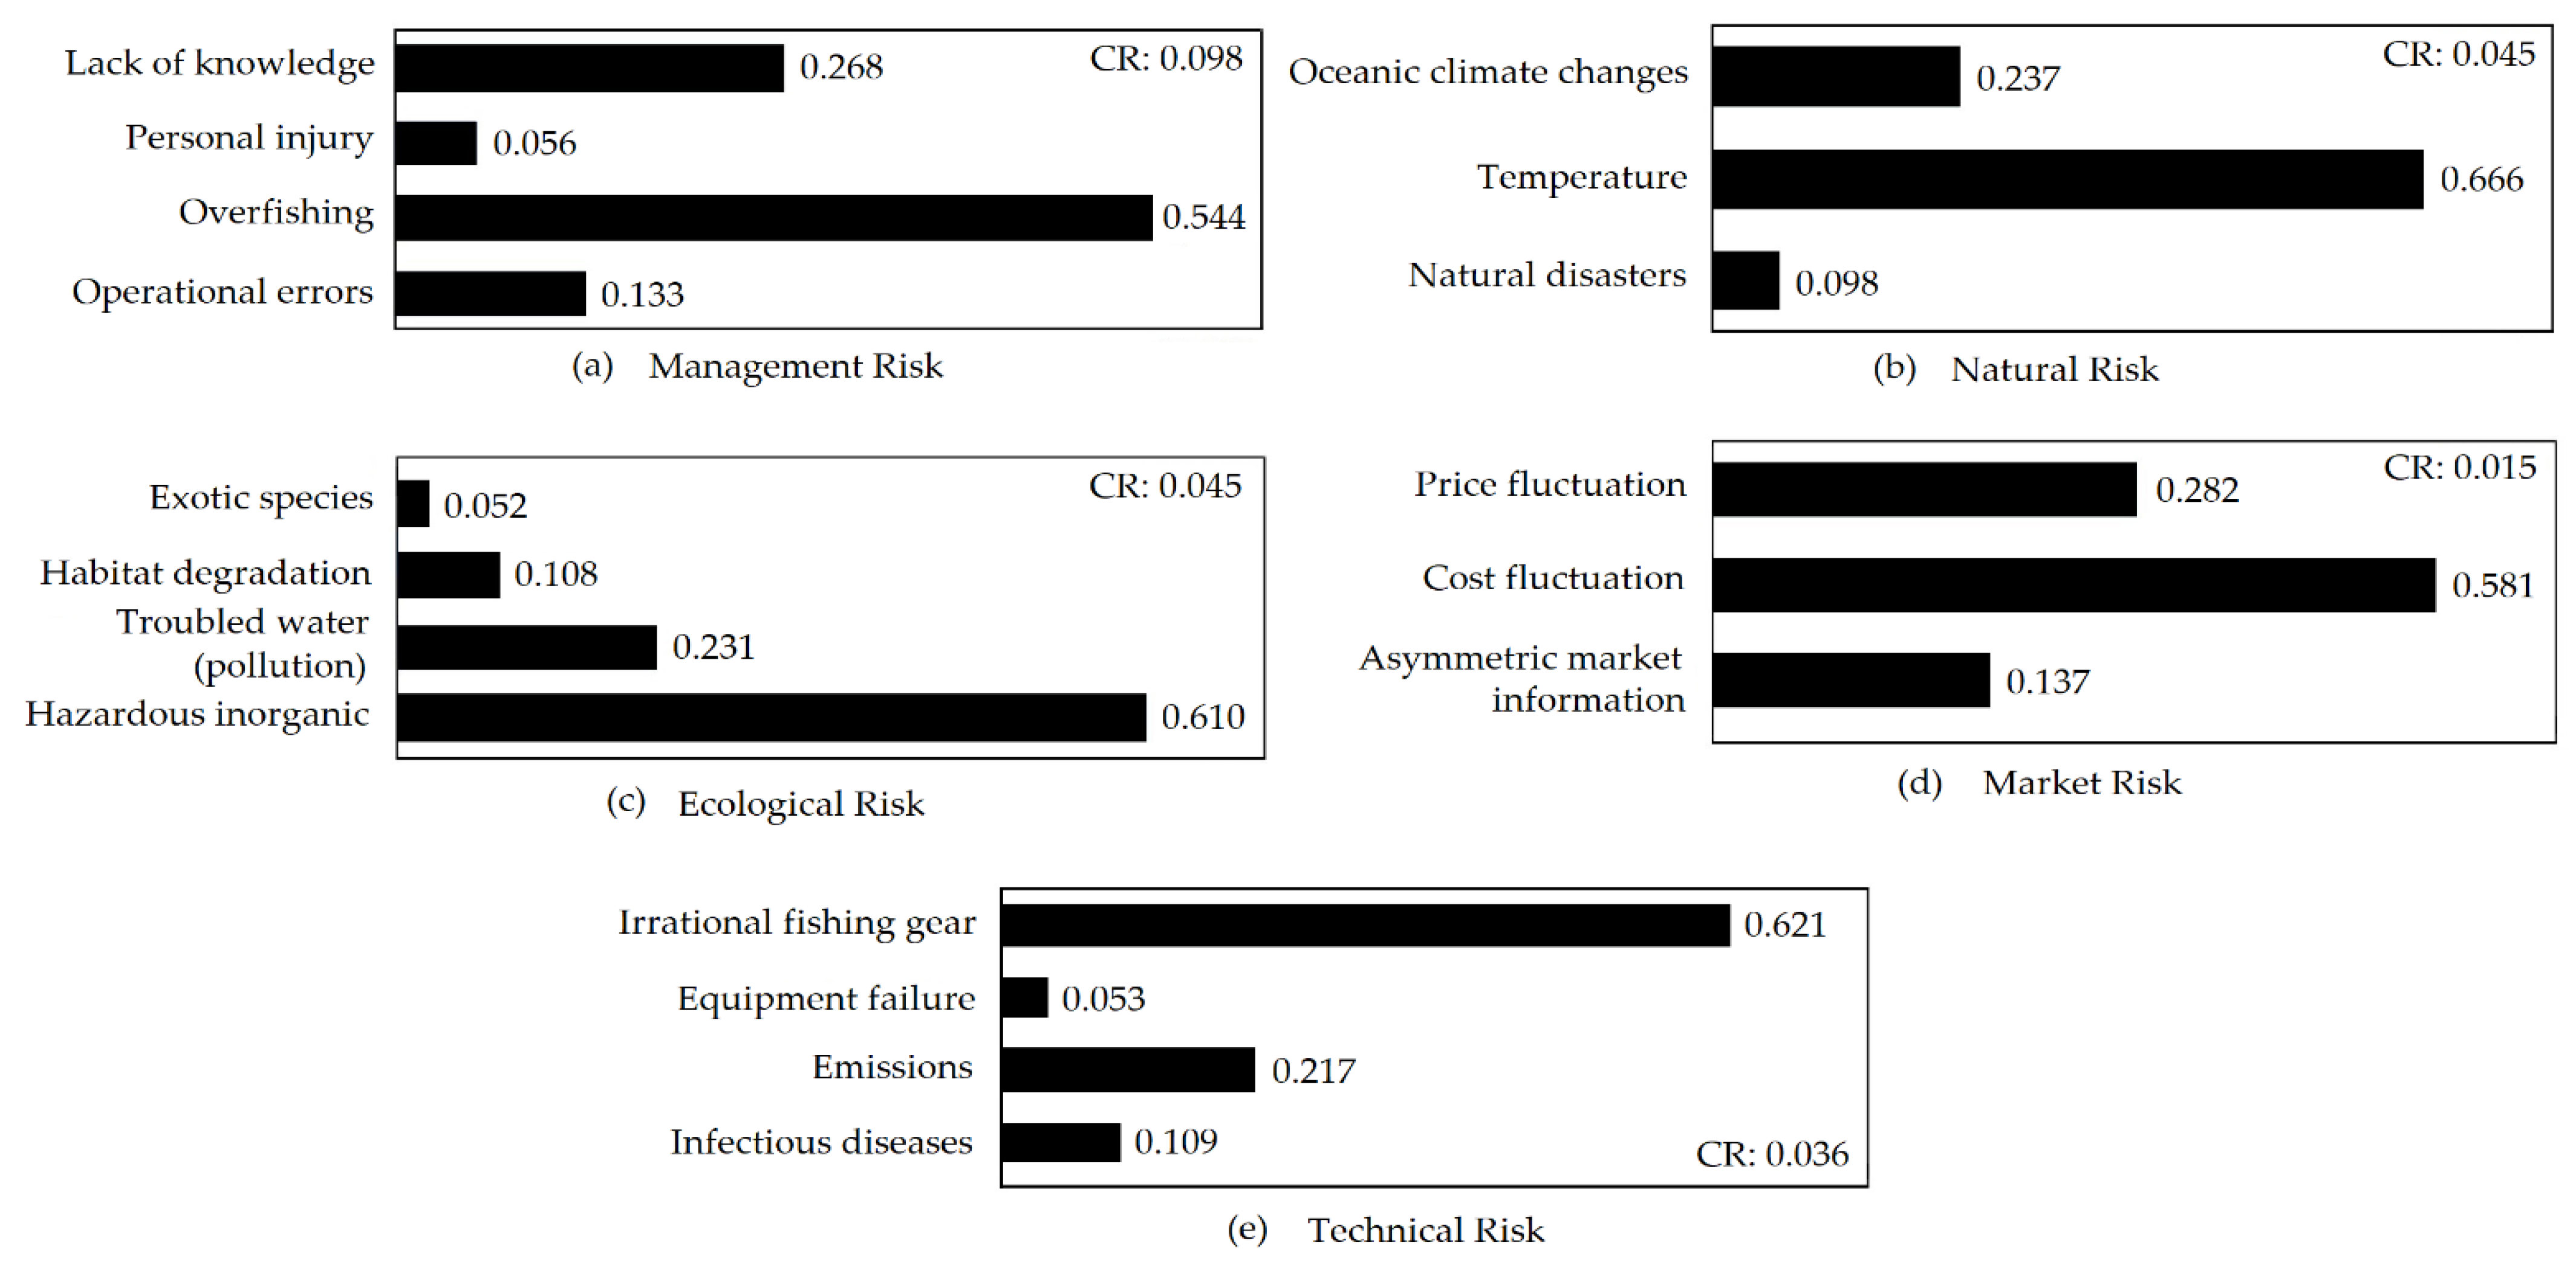
4.3. Risk Sub-Factors: Ranking of their Importance and Priority (AHP Analysis)
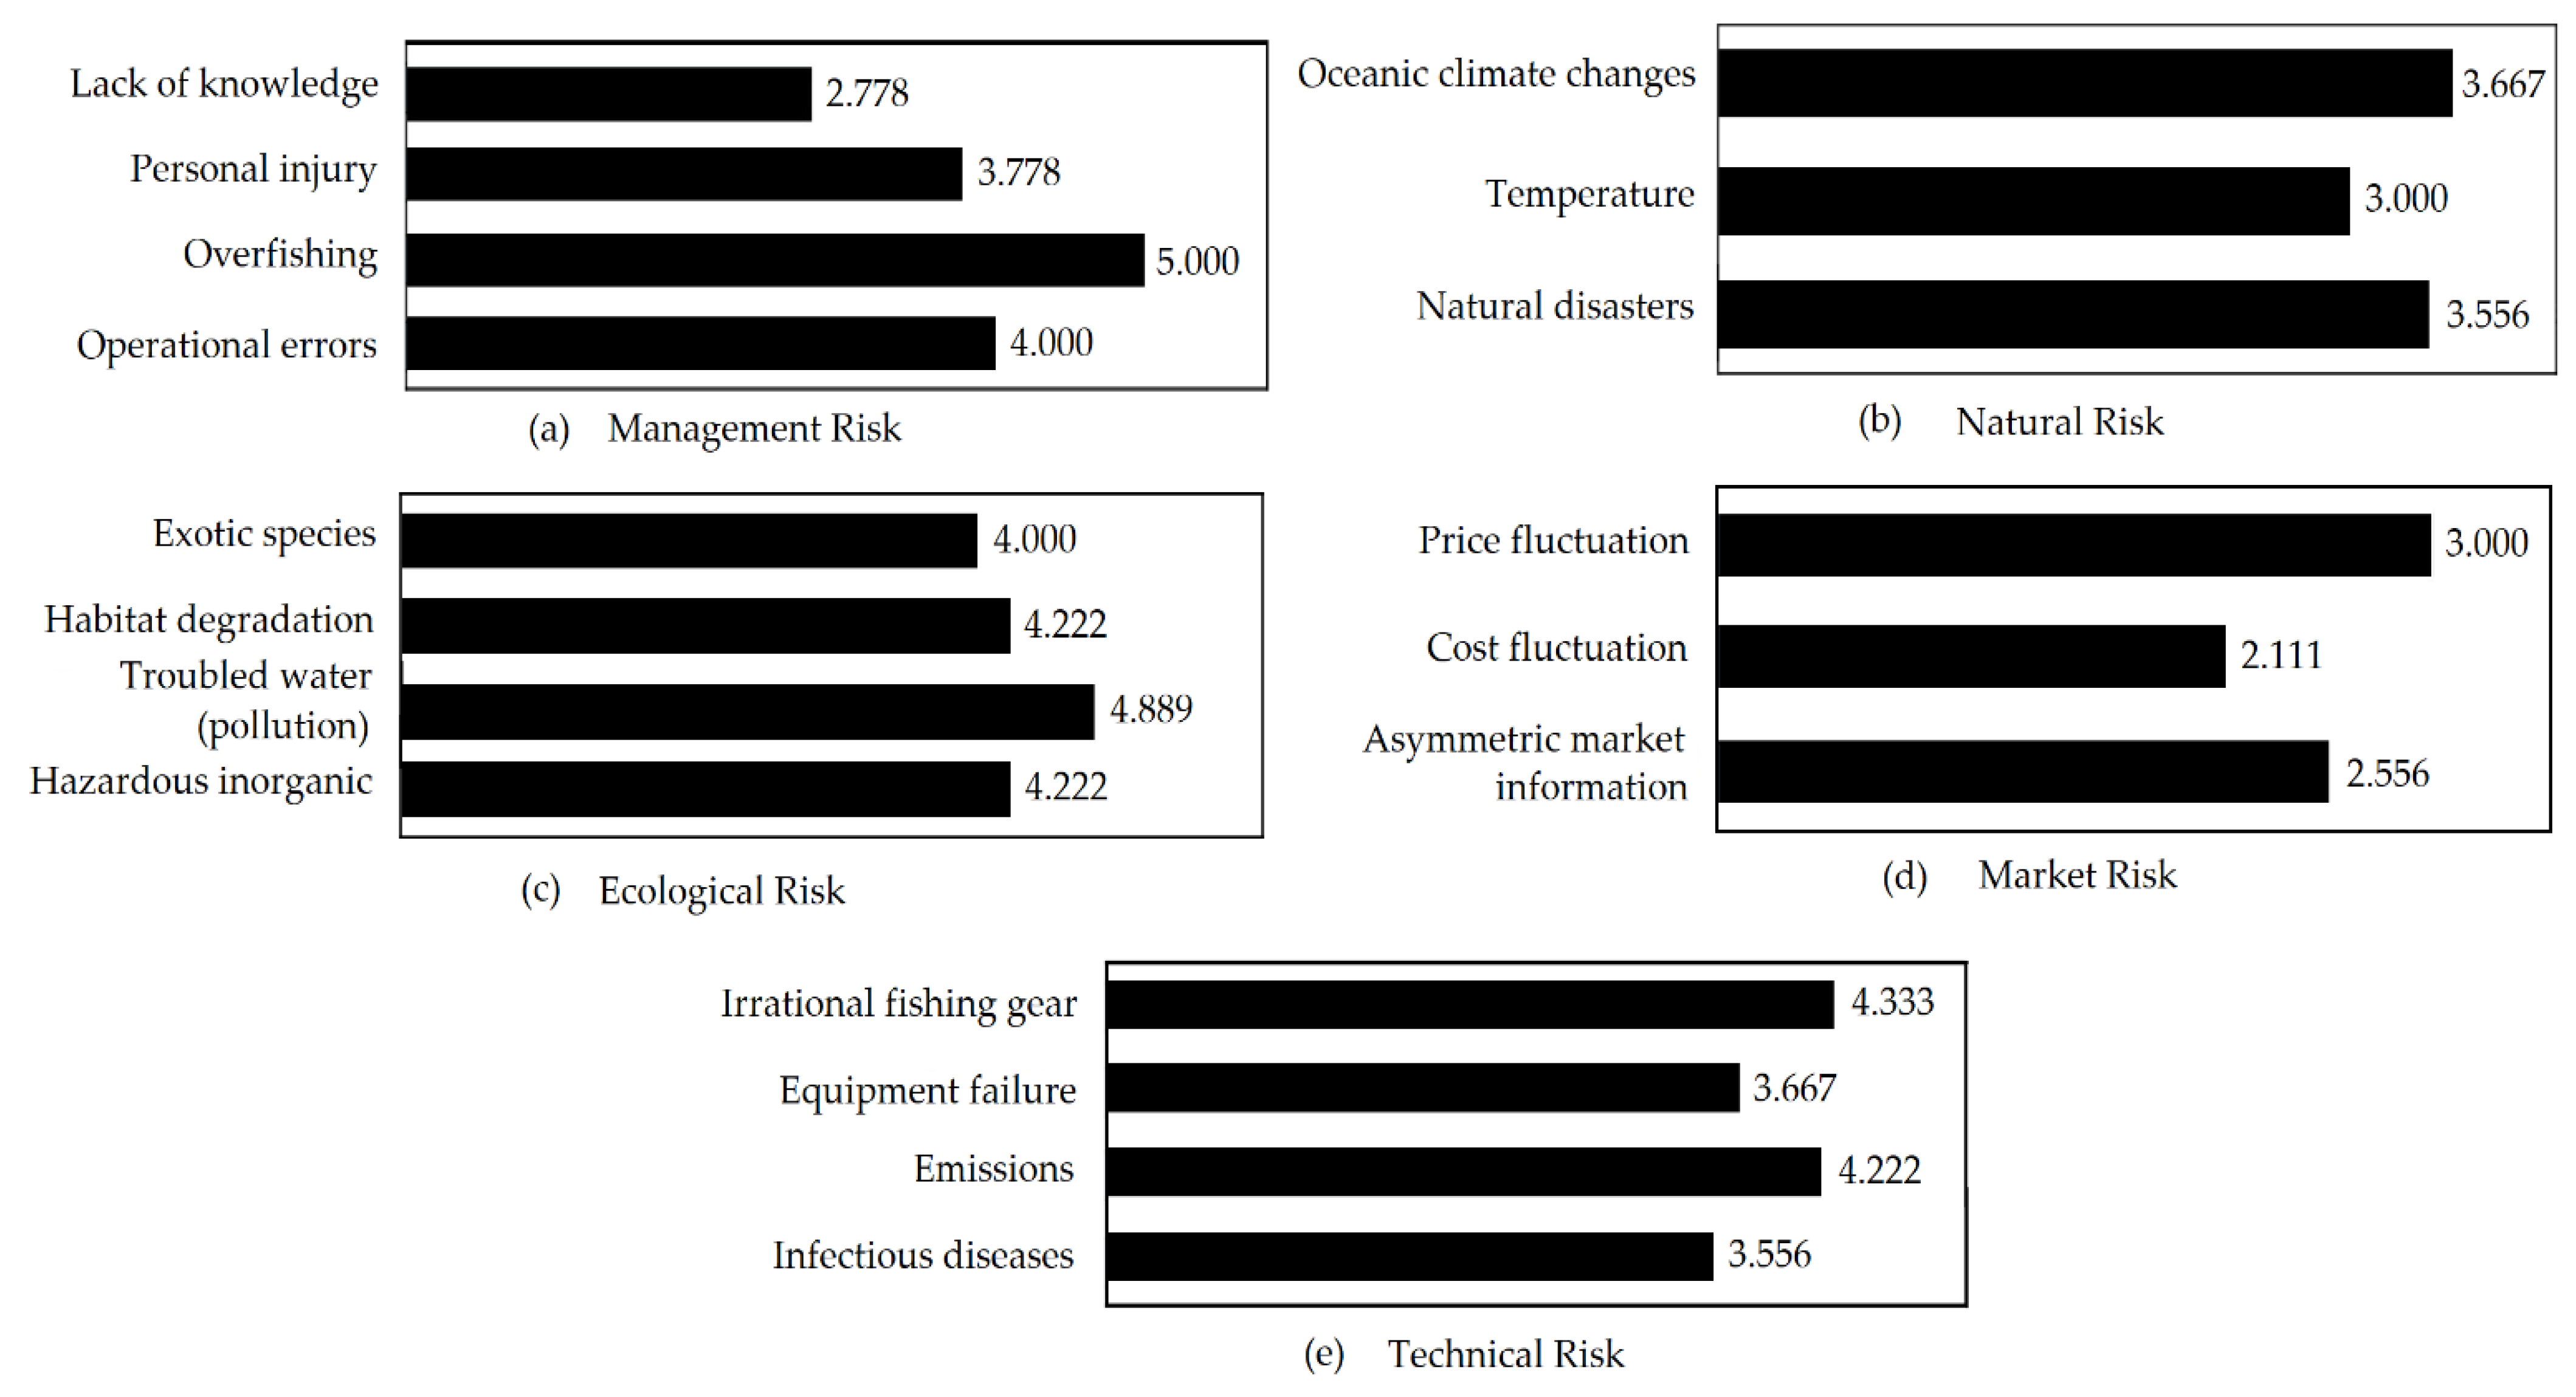
4.4. Main Risk Factors: Performance Analysis (IPA Analysis)
4.5. Risk Sub-Factors: Performance Analysis (IPA Analysis)
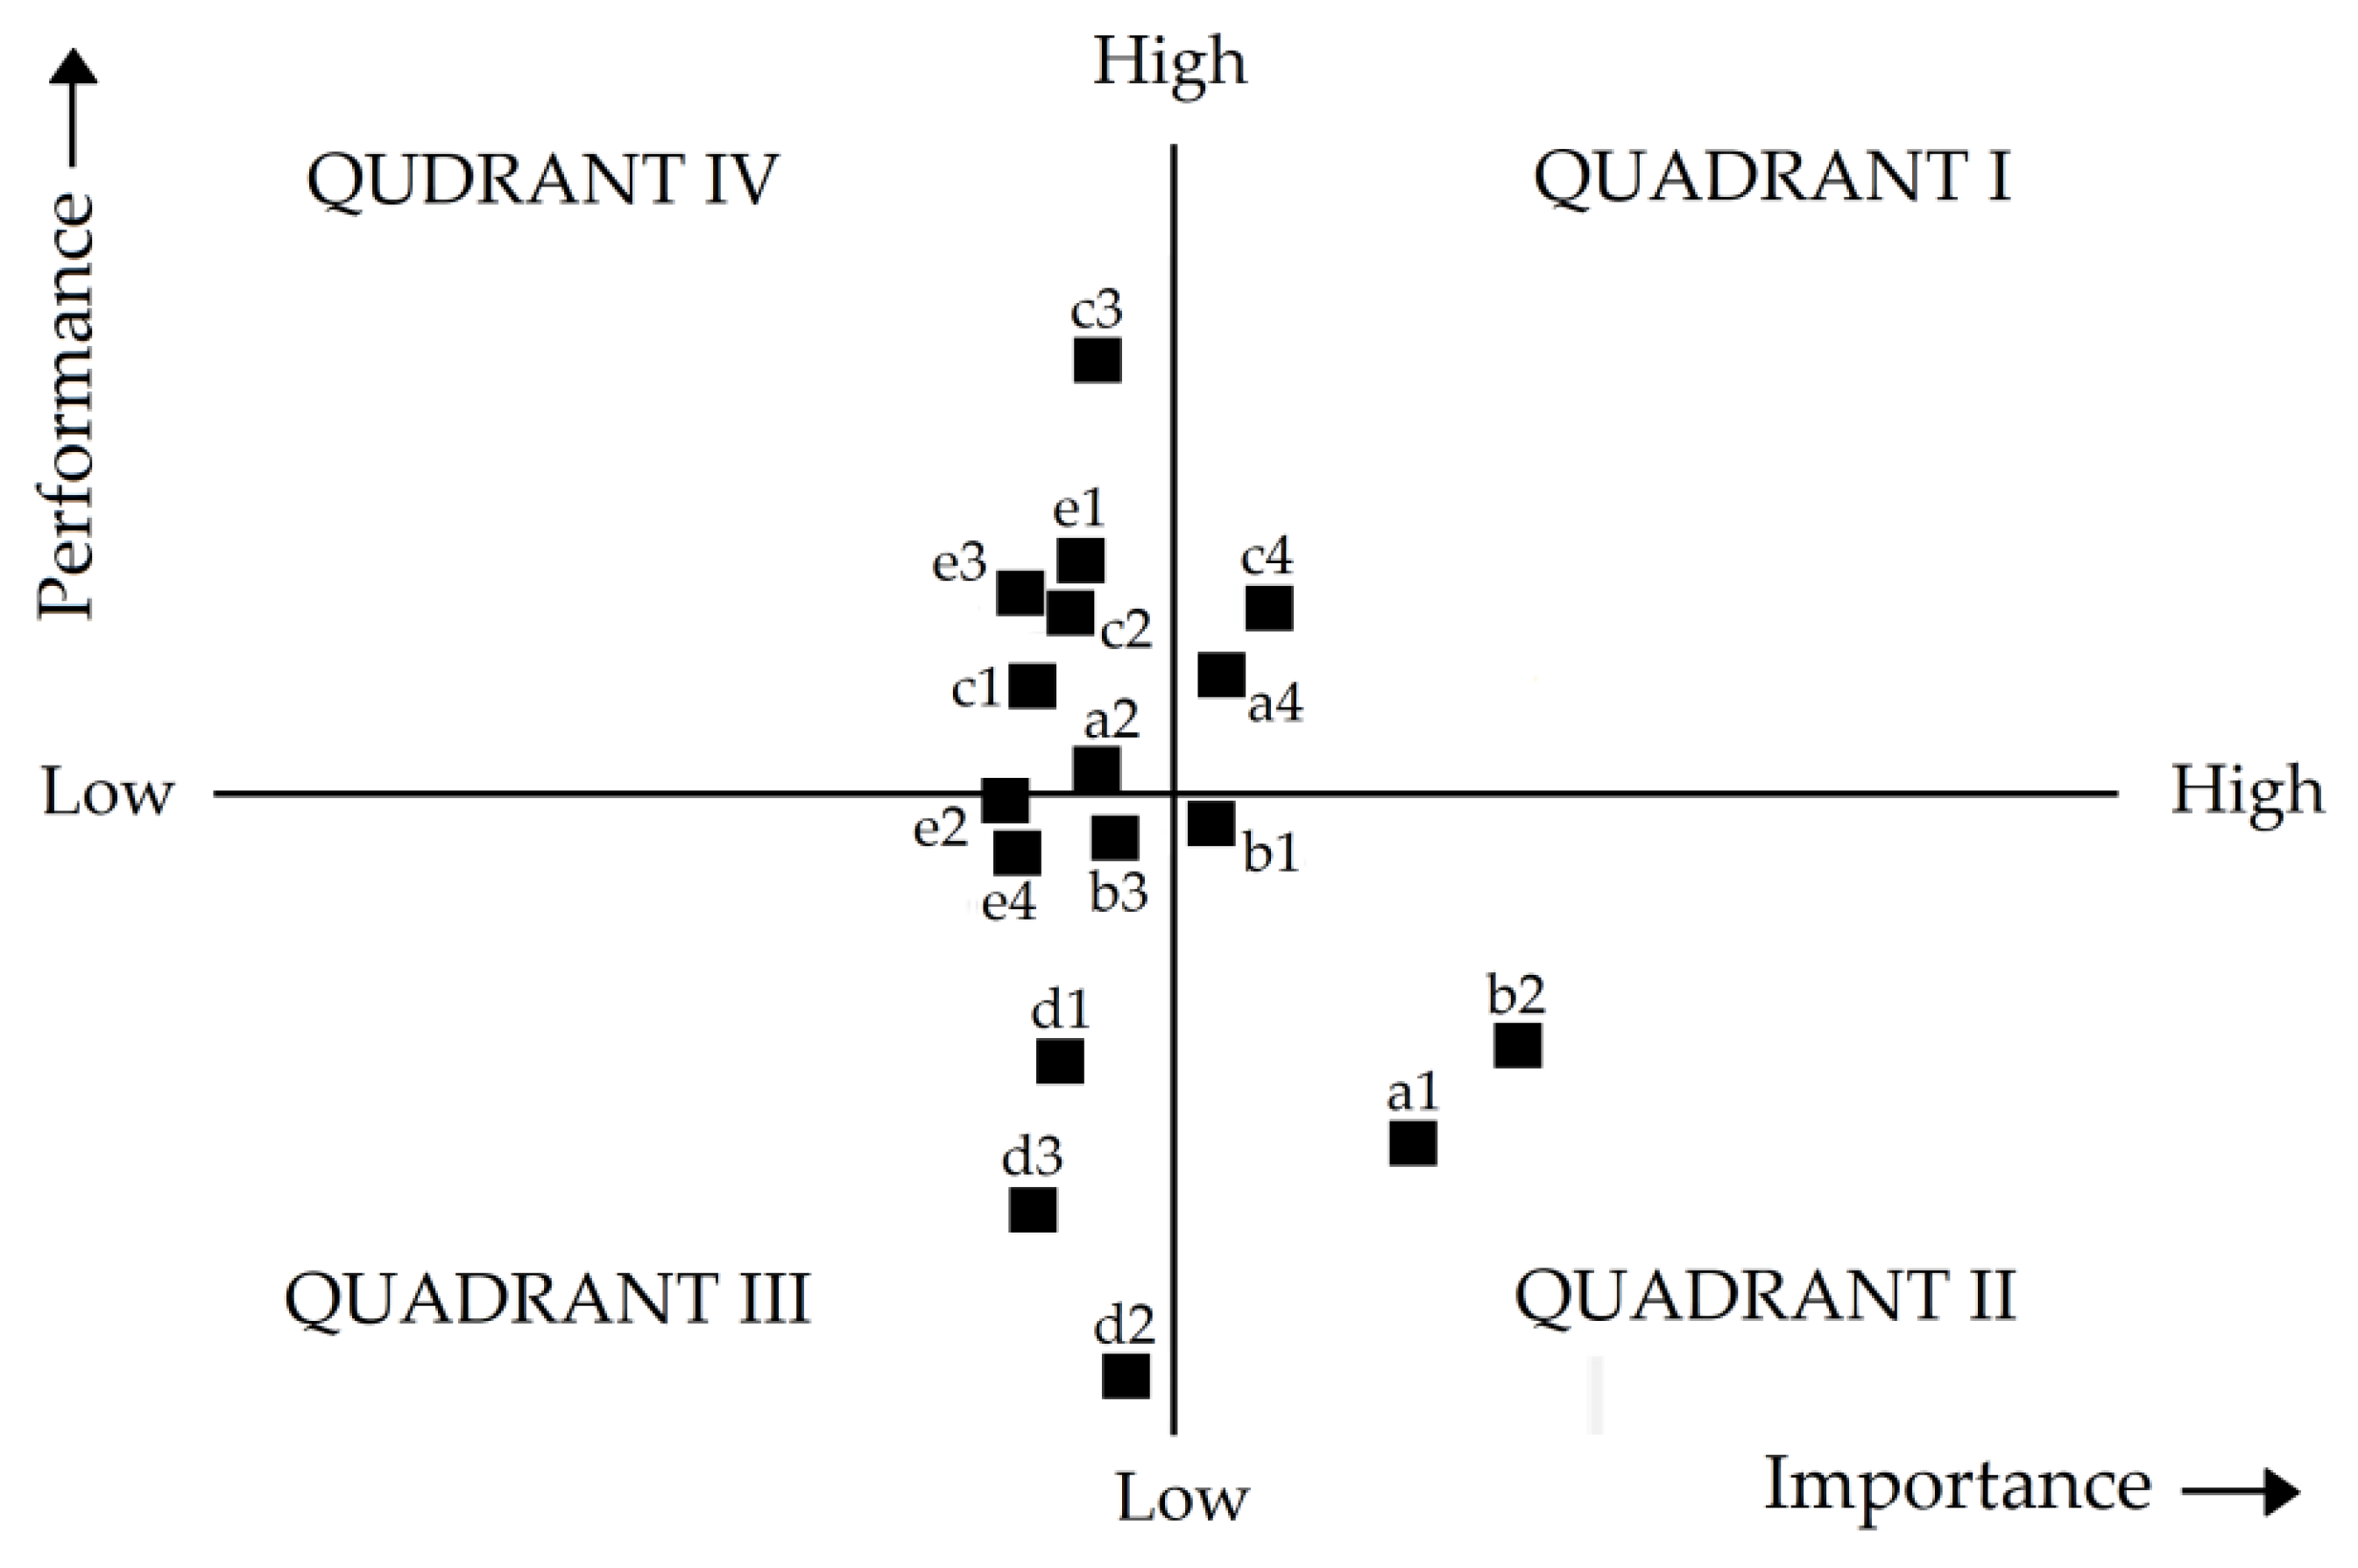
4.6. Risk Management: An Improvement Assessment (IPA Analysis)
5. Discussion
5.1. Management Risks
5.2. Market Risks
5.3. Natural Risks
5.4. Ecological Risks
5.5. Technical Risks
5.6. General Discussion
5.7. Implications
6. Conclusions
Author Contributions
Funding
Institutional Review Board Statement
Informed Consent Statement
Data Availability Statement
Conflicts of Interest
References
- Newman, S.J.; Brown, J.I.; Fairclough, D.V.; Wise, B.S. A risk assessment and prioritization approach to the selection of indicator species for the assessment of multi-species, multi-gear, multi-sector fishery resources. Mar. Pol. 2018, 88, 11–22. [Google Scholar] [CrossRef]
- Ashrafi, T.A.; Syed, S.; Eide, A. Individual quotas and revenue risk of fishing portfolio in the trawl fishery. Fish. Res. 2021, 241, 105990. [Google Scholar] [CrossRef]
- Sethi, S.A. Risk management for fisheries. Fish Fish. 2010, 11, 341–365. [Google Scholar] [CrossRef]
- Moore, J.W.; Connors, B.M.; Hodgson, E.E. Conservation risk and portfolio effects in mixed-stock fisheries. Fish Fish. 2021, 22, 1024–1040. [Google Scholar] [CrossRef]
- Cheung, W.W.L.; Jones, M.C.; Reygondeau, G.; Frolicher, T.L. Opportunities for climate-risk reduction through effective fisheries management. Glob. Chang. Biol. 2018, 24, 5149–5163. [Google Scholar] [CrossRef] [PubMed]
- Zeller, D.; Pauly, D. Back to the future for fisheries, where will we choose to go? Glob. Sustain. 2019, 2, E11. [Google Scholar] [CrossRef] [Green Version]
- Arbo, P.; Thuy, P.T.T. Use conflicts in marine ecosystem-based management—The case of oil versus fisheries. Ocean Coast. Manag. 2016, 122, 77–86. [Google Scholar] [CrossRef] [Green Version]
- Bradley, D.; Merrifield, M.; Miller, K.M.; Lomonico, S.; Wilson, J.R.; Gleason, M.G. Opportunities to improve fisheries management through innovative technology and advanced data systems. Fish Fish. 2019, 20, 564–583. [Google Scholar] [CrossRef]
- Vergara-Solana, F.; Araneda, M.E.; Ponce-Diaz, G. Opportunities for strengthening aquaculture industry through multicriteria decision-making. Rev. Aquac. 2019, 11, 105–118. [Google Scholar] [CrossRef] [Green Version]
- Wu, T.H.; Chen, C.H.; Mao, N.; Lu, S.T. Fishmeal supplier evaluation and selection for aquaculture enterprise sustainability with a fuzzy MCDM approach. Symmetry 2017, 9, 286. [Google Scholar] [CrossRef] [Green Version]
- Morgan, R. An investigation of constraints upon fisheries diversification using the Analytic Hierarchy Process (AHP). Mar. Pol. 2017, 86, 24–30. [Google Scholar] [CrossRef]
- Du, Y.W.; Gao, K. Ecological security evaluation of marine ranching with AHP-entropy-based TOPSIS: A case study of Yantai, China. Mar. Pol. 2020, 122, 104223. [Google Scholar] [CrossRef]
- Mardle, S.; Pascoe, S. A review of applications of multiple-criteria decision-making techniques to fisheries. Mar. Resour. Econ. 1999, 14, 41–63. [Google Scholar] [CrossRef]
- Saaty, T.L. Decision making with the analytic hierarchy process. Int. J. Serv. Sci. 2008, 1, 83–98. [Google Scholar] [CrossRef] [Green Version]
- Chang, D.Y. Applications of the extent analysis method on fuzzy AHP. Eur. J. Oper. Res. 1996, 95, 649–655. [Google Scholar] [CrossRef]
- Chan, F.T.S.; Kumar, N. Global supplier development considering risk factors using fuzzy extended AHP-based approach. Omega 2007, 35, 417–431. [Google Scholar] [CrossRef]
- Mohsin, M.; Zhanao, W.; Shijun, Z.; Weilun, H.; Hengbin, Y. Risk prioritization and management in gas stations by using fuzzy AHP and IPA analysis. Indian J. Geo-Mar. Sci. 2021, 80, 1107–1116. [Google Scholar]
- Su, X.; Mahadevan, S.; Xu, P.; Deng, Y. Dependence assessment in human reliability analysis using evidence theory and AHP. Risk Anal. 2015, 35, 1296–1316. [Google Scholar] [CrossRef]
- Anand, G.; Kodali, R.; Kumar, B.S. Development of analytic network process for the selection of material handling systems in the design of flexible manufacturing systems (FMS). J. Adv. Manag. Res. 2011, 8, 123–147. [Google Scholar] [CrossRef]
- Onut, S.; Kara, S.; Mert, S. Selecting the suitable material handling equipment in the presence of vagueness. Int. J. Adv. Manuf. Technol. 2009, 44, 818–828. [Google Scholar] [CrossRef]
- Saaty, T.L. How to make a decision—the analytic hierarchy process. Eur. J. Oper. Res. 1990, 48, 9–26. [Google Scholar] [CrossRef]
- Mohsin, M.; Mu, Y.T.; Memon, A.M.; Mehak, A.; Shah, S.B.H.; Kalhoro, M.T.; Baset, A. Capture fisheries production and its economic role in Pakistan. Indian J. Geo-Mar. Sci. 2017, 46, 1110–1115. [Google Scholar]
- Mohsin, M.; Mu, Y.T.; Memon, A.M.; Akhter, N.; Noman, M.; Nazir, K.; Shah, S.B.H. Molluscan fisheries in Pakistan: Trends in capture production, utilization and trade. Indian J. Geo-Mar. Sci. 2017, 46, 929–935. [Google Scholar]
- Kaczan, D.J.; Patil, P.G. Potential development contribution of fisheries reform: Evidence from Pakistan. J. Enviorn. Dev. 2020, 29, 275–305. [Google Scholar] [CrossRef]
- Wang, J.J.; Jing, Y.Y.; Zhang, C.F.; Zhao, J.H. Review on multi-criteria decision analysis aid in sustainable energy decision-making. Renew. Sust. Energ. Rev. 2009, 13, 2263–2278. [Google Scholar] [CrossRef]
- Teniwut, W.; Marimin, M.; Djatna, T. GIS-Based multi-criteria decision making model for site selection of seaweed farming information centre: A lesson from small islands, Indonesia. Decis. Sci. Lett. 2019, 8, 137–150. [Google Scholar] [CrossRef]
- Vyas, G.S.; Jha, K.N.; Patel, D.A. Development of green building rating system using AHP and fuzzy integrals: A case of India. J. Archit. Eng. 2019, 25, 04019004. [Google Scholar] [CrossRef]
- Giamalaki, M.; Tsoutsos, T. Sustainable siting of solar power installations in Mediterranean using a GIS/AHP approach. Renew. Energy 2019, 141, 64–75. [Google Scholar] [CrossRef]
- Havle, C.A.; Kılıç, B. A hybrid approach based on the fuzzy AHP and HFACS framework for identifying and analyzing gross navigation errors during transatlantic flights. J. Air Transp. Manag. 2019, 76, 21–30. [Google Scholar] [CrossRef]
- Al Mamun, M.A.; Howladar, M.F.; Sohail, M.A. Assessment of surface water quality using Fuzzy Analytic Hierarchy Process (FAHP): A case study of Piyain River’s sand and gravel quarry mining area in Jaflong, Sylhet. Groundw. Sustain. Dev. 2019, 9, 100208. [Google Scholar] [CrossRef]
- Dursun, M.; Karsak, E.E. A fuzzy MCDM approach for personnel selection. Expert Syst. Appl. 2010, 37, 4324–4330. [Google Scholar] [CrossRef]
- Karthikeya, R.; Venkatesan, K.G.S.; Chandrasekar, A. A comparison of strengths and weaknesses for analytical hierarchy process. J. Chem. Pharm. Sci. 2016, 9, 12–15. [Google Scholar]
- Zhu, L.; Aurum, A.K.; Gorton, I.; Jeffery, R. Tradeoff and sensitivity analysis in software architecture evaluation using analytic hierarchy process. Softw. Qual. J. 2005, 13, 357–375. [Google Scholar] [CrossRef] [Green Version]
- Sobczak, A.; Berry, D.M. Distributed priority ranking of strategic preliminary requirements for management information systems in economic organizations. Inf. Softw. Technol. 2007, 49, 960–984. [Google Scholar] [CrossRef]
- Wan, C.D.; Chen, C.J. Supply chain risk and its control strategy of aquatic product processing industry. Commer. Res. 2011, 1, 17–21. [Google Scholar]
- Ewald, C.O.; Wang, W.K. Sustainable yields in fisheries: Uncertainty, risk-aversion, and mean-variance analysis. Nat. Resour. Model. 2010, 23, 303–323. [Google Scholar] [CrossRef]
- Costello, C.; Gaines, S.D.; Lynham, J. Can catch shares prevent fisheries collapse? Science 2008, 321, 1678–1681. [Google Scholar] [CrossRef] [Green Version]
- McKelvey, R.; Golubtsov, P. Restoration of a depleted transboundary fishery subject to climate change: A dynamic investment under uncertainty with information updates. Environ. Resour. Econ. 2015, 61, 19–35. [Google Scholar] [CrossRef]
- Martinet, V.; Peña-Torres, J.; Lara, M.D.; Ramírez, H.C. Risk and sustainability: Assessing fishery management strategies. Environ. Resour. Econ. 2015, 64, 683–707. [Google Scholar] [CrossRef]
- Gilani, H.; Naz, H.I.; Arshad, M.; Nazim, K.; Akram, U.; Abrar, A.; Asif, M. Evaluating mangrove conservation and sustainability through spatiotemporal (1990–2020) mangrove cover change analysis in Pakistan. Estuar. Coast. Shelf Sci. 2021, 249, 107128. [Google Scholar] [CrossRef]
- Townhill, B.L.; Radford, Z.; Pecl, G.; Putten, I.V.; Pinnegar, J.K.; Hyder, K. Marine recreational fishing and the implications of climate change. Fish Fish. 2019, 20, 977–992. [Google Scholar] [CrossRef] [Green Version]
- Almendarez-Hernandez, L.C.; Ponce-Díaz, G.; Lluch-Belda, D.; Monte-Luna, P.D.; Saldívar-Lucio, R. Risk assessment and uncertainty of the shrimp trawl fishery in the Gulf of California considering environmental variability. Lat. Am. J. Aquat. Res. 2015, 43, 651–661. [Google Scholar] [CrossRef]
- Astles, K.L.; Gibbs, P.J.; Steffe, A.S.; Green, M. A qualitative risk-based assessment of impacts on marine habitats and harvested species for a data deficient wild capture fishery. Biol. Conserv. 2009, 142, 2759–2773. [Google Scholar] [CrossRef]
- Mathis, J.T.; Cooley, S.R.; Lucey, N.; Colt, S.; Ekstrom, J.; Hurst, T.; Hauri, C.; Evans, W.; Cross, J.N.; Feely, R.A. Ocean acidification risk assessment for Alaska’s fishery sector. Prog. Oceanogr. 2015, 136, 71–91. [Google Scholar] [CrossRef] [Green Version]
- Mabon, L.; Kawabe, M. Making sense of complexity in risk governance in post-disaster Fukushima fisheries: A scalar approach. Environ. Sci. Policy 2017, 75, 173–183. [Google Scholar] [CrossRef]
- Iqbal, Z.; Pervaiz, K.; Javed, M.N. Population dynamics of Tor macrolepis (Teleostei: Cyprinidae) and other fishes of Attock region, Pakistan. Can. J. Pur. App. Sci. 2013, 7, 2195–2201. [Google Scholar]
- Lam, V.W.Y.; Allison, E.H.; Bell, J.D.; Blythe, J.; Cheung, W.W.L.; Frolicher, T.L.; Gasalla, M.A.; Sumaila, U.R. Climate change, tropical fisheries and prospects for sustainable development. Nat. Rev. Earth Enviorn. 2020, 1, 440–454. [Google Scholar] [CrossRef]
- Huang, B.; Perrings, C. Managing the risks of sea lice transmission between salmon aquaculture and wild pink salmon fishery. Ecol. Econ. 2017, 142, 228–237. [Google Scholar] [CrossRef]
- Xia, Y.; Zhao, W.; Xie, Y.; Xue, H.; Li, J.; Chen, W.; Huang, Y.; Li, X. Ecological and economic impacts of exotic fish species on fisheries in the Pearl River basin. Manag. Biol. Invasions 2019, 10, 127–138. [Google Scholar] [CrossRef] [Green Version]
- Grafton, R.Q.; Little, L.R. Risks, resilience, and natural resource management: Lessons from selected findings. Nat. Resour. Model. 2017, 30, 91–111. [Google Scholar] [CrossRef]
- Yoshida, N.; Kanda, J. Tracking the fukushima radionuclides. Science 2012, 336, 1115–1116. [Google Scholar] [CrossRef] [PubMed]
- Holley, J.R.; McComas, K.A.; Hare, M.P. Troubled waters: Risk perception and the case of oyster restoration in the closed waters of the Hudson-Raritan estuary. Mar. Pol. 2018, 91, 104–112. [Google Scholar] [CrossRef]
- Issifu, I.; Alava, J.J.; Lam, V.W.Y.; Sumaila, U.R. Impact of ocean warming, overfishing and mercury on European fisheries: A risk assessment and policy solution framework. Front. Mar. Sci. 2022, 8, 770805. [Google Scholar] [CrossRef]
- Jiang, Y.; Lin, N.; Yang, L.; Cheng, J. The ecological risk of stock enhancement and the measures for prevention and control. J. Fish. Sci. China 2014, 21, 413–422. [Google Scholar]
- Gao, F. The hidden risk in protection: The understanding of the crowding out effect of Chinese fishermen’s social transformation. Rur. Econ. 2013, 4, 79–82. (In Chinese) [Google Scholar]
- Zhang, X.X.; Tao, P.; Cheng, J.Y.; Shao, M.H.; Zhu, J.H. Method and application of resource and environment carrying capacity assessment for island offshore sea areas. Res. Environ. Sci. 2016, 29, 1725–1734. [Google Scholar]
- Li, X.Z. Total mercury in the marine culture products and relative environmental samples from Sandu Bay of Fujian Province and its health risk assessment. J. Fish. Sci. China 2008, 15, 961–969. [Google Scholar]
- Yang, H.; Chen, S.; Hong, B. The assessment of fishery ecological risk caused by oil spilled in the estuary of Yangtze River. J. Shanghai Ocean Univ. 2009, 18, 345–350. [Google Scholar]
- Pan, X.; Chen, P.; Chen, Q.H. Summary and prospect of research on island carrying capacity at home and abroad. Ocean Dev. Manag. 2014, 31, 61–65. [Google Scholar]
- Kasperski, S.; Holland, D.S. Income diversification and risk for fishermen. Proc. Natl. Acad. Sci. USA 2013, 110, 2076–2081. [Google Scholar] [CrossRef] [Green Version]
- Kvamsdal, S.F.; Poudel, D.; Sandal, L.F. Harvesting in a fishery with stochastic growth and a mean-reverting price. Environ. Resour. Econ. 2016, 63, 643–663. [Google Scholar] [CrossRef]
- Jensen, F.; Frost, H.; Abildtrup, J. Fisheries regulation: A survey of the literature on uncertainty, compliance behavior and asymmetric information. Mar. Pol. 2017, 81, 167–178. [Google Scholar] [CrossRef]
- Zhang, C.; Jiang, Q.J. Problems and suggestions on China’s fisheries insurance. Jiangsu Agr. Sci. 2010, 3, 477–479. [Google Scholar]
- Liu, F.H.; Liu, X.Z. The plight and integration strategies for fishery industry chain in Qingdao. Chin. Fish. Econ. 2014, 32, 69–76. [Google Scholar]
- Daly, E.; White, M. Bottom trawling noise: Are fishing vessels polluting to deeper acoustic habitats? Mar. Pollut. Bull. 2021, 162, 111877. [Google Scholar] [CrossRef]
- Lafferty, K.D.; Harvell, C.D.; Conrad, J.M.; Friedman, C.S.; Kent, M.L.; Kuris, A.M.; Powell, E.N.; Rondeau, D.; Saksida, S.M. Infectious diseases affect marine fisheries and aquaculture economics. Ann. Rev. Mar. Sci. 2015, 7, 471–496. [Google Scholar] [CrossRef] [Green Version]
- Woodhead, A.J.; Abernethy, K.E.; Szaboova, L.; Turner, R.A. Health in fishing communities: A global perspective. Fish Fish. 2018, 19, 839–852. [Google Scholar] [CrossRef]
- Yang, W.S. The research on operating conditions of the fishery mutual insurance of Shandong province. Insur. Stud. 2012, 6, 49–57. [Google Scholar]
- Lin, Y.; Gao, Z.; Zhan, A. Introduction and use of non-native species for aquaculture in China: Status, risks and management solutions. Rev. Aquac. 2015, 7, 28–58. [Google Scholar] [CrossRef]
- Yuan, J.H. Study on aquaculture insurance in China—taking Guangdong province as an example. Issues Agric. Econ. 2012, 33, 79–83. (In Chinese) [Google Scholar]
- Chen, F.X.; Tan, W. Problems and basic countermeasures for the development of deep-water cage culture in Hainan. J. Anhui Agric. Sci. 2015, 43, 59–61. [Google Scholar]
- Cochrane, K.L. Reconciling sustainability, economic efficiency and equity in marine fisheries: Has there been progress in the last 20 years? Fish Fish. 2020, 22, 298–323. [Google Scholar] [CrossRef]
- Calhoun, S.; Conway, F.; Russell, S. Acknowledging the voice of women: Implications for fisheries management and policy. Mar. Pol. 2016, 74, 292–299. [Google Scholar] [CrossRef]
- Shen, G.; Heino, M. An overview of marine fisheries management in China. Mar. Pol. 2014, 44, 265–272. [Google Scholar] [CrossRef] [Green Version]
- Link, J.S. System-level optimal yield: Increased value, less risk, improved stability, and better fisheries. Can. J. Fish. Aquat. Sci. 2018, 75, 1–16. [Google Scholar] [CrossRef] [Green Version]
- Lucas, D.L.; Case, S.L. Work-related mortality in the US fishing industry during 2000–2014: New findings based on improved workforce exposure estimates. Am. J. Ind. Med. 2017, 61, 21–31. [Google Scholar] [CrossRef] [Green Version]
- Milne, R.; Bauch, C.T.; Anand, M. Local overfishing patterns have regional effects on health of coral, and economic transitions can promote its recovery. Bull. Math. Biol. 2022, 84, 46. [Google Scholar] [CrossRef]
- Chao, Y.; Jiajia, Z.; Simeng, L.; Shan, Y.; Mingxing, C. Assessment and analysis of regional economic collaborative development within an urban agglomeration: Yangtze river delta as a case study. Habitat Int. 2019, 83, 20–29. [Google Scholar]
- Zhang, J.; Zhao, Y.; Zhao, Q.; Shen, G.; Liu, Q.; Li, C.; Zhou, D.; Wang, S. Characteristics and source apportionment of summertime volatile organic compounds in a fast developing city in the Yangtze River delta, China. Atmosphere 2018, 9, 373. [Google Scholar] [CrossRef] [Green Version]
- Aminbakhsh, S.; Gunduz, M.; Sonmez, M. Safety risk assessment using analytic hierarchy process (AHP) during planning and budgeting of construction projects. J. Saf. Res. 2013, 46, 99–105. [Google Scholar] [CrossRef]
- Wind, Y.; Saaty, T.L. Marketing applications of the analytic hierarchy process. Manag. Sci. 1980, 7, 641–658. [Google Scholar] [CrossRef]
- Buckley, J.J. Fuzzy hierarchical analysis. Fuzzy Sets Syst. 1985, 17, 233–247. [Google Scholar] [CrossRef]
- Hsu, W.K. Assessing the safety factors of ship berthing operations. J. Navig. 2015, 68, 576–588. [Google Scholar] [CrossRef] [Green Version]
- Albayrak, E.; Erensal, Y.C. Using analytic hierarchy process (AHP) to improve human performance: An application of multiple criteria decision making problem. J. Intell. Manuf. 2004, 15, 491–503. [Google Scholar] [CrossRef]
- Saaty, T.L. Theory and Applications of the Analytic Network Process: Decision Making with Benefits, Opportunities, Costs, and Risks, 3rd ed.; RWS Publications: Pittsburgh, PA, USA, 2005; pp. 1–352. [Google Scholar]
- Thirumalaivasan, D.; Karmegam, M.; Venugopal, K. AHP-DRASTIC: Software for specific aquifer vulnerability assessment using DRASTIC model and GIS. Environ. Model. Softw. 2003, 18, 645–656. [Google Scholar] [CrossRef]
- Saaty, T.L.; Vargas, L.G. Diagnosis with dependent symptoms: Bayes theorem and the analytic hierarchy process. Oper. Res. 1998, 46, 491–502. [Google Scholar] [CrossRef]
- Raza, H.; Liu, Q.; Alam, M.S.; Han, Y. Length based stock assessment of five fish species from the marine water of Pakistan. Sustainability 2022, 14, 1587. [Google Scholar] [CrossRef]
- Razzaq, S.; Kalhoro, M.A.; Memon, A.M.; Buzdar, M.A.; Shafi, M.; Saeed, F.; Baloch, A. Fishery stock assessment of Megalaspis cordyla by using non-equilibrium surplus production models in the Arabian Sea coast of Pakistan. J. Anim. Plant Sci. 2019, 29, 132–140. [Google Scholar]
- Noman, M.; Mu, Y.T.; Nisar, U.; Mohsin, M.; Memon, M. Constraint analysis of major problems facing the marine fisheries sector in accordance with the national fisheries policy of Pakistan. Indian J. Geo-Mar. Sci. 2022, 51, 94–103. [Google Scholar]
- Rehman, A.; Deyuan, Z.; Hena, S.; Chandio, A.A. Do fisheries and aquaculture production have dominant roles within the economic growth of Pakistan? a long-run and short-run investigation. Br. Food J. 2019, 121, 1926–1935. [Google Scholar] [CrossRef]
- Khan, M.A.; Khan, J.A.; Ali, Z.; Ahmed, I.; Ahmad, M.N. The challenge of climate change and policy response in Pakistan. Environ. Earth Sci. 2016, 75, 412. [Google Scholar] [CrossRef]
- Mohsin, M.; Hengbin, Y.; Luyao, Z.; Shah, S.B.H. Investigation of current risk types faced by the global fisheries: A comprehensive review. J. Anim. Plant Sci. 2021, 31, 19–25. [Google Scholar]
- De Bruyn, P.; Murua, H.; Aranda, M. The precautionary approach to fisheries management: How this taken into account by Tuna regional fisheries management organizations (RFMOs). Mar. Pol. 2013, 38, 397–406. [Google Scholar] [CrossRef]
- Mildenberger, T.K.; Berg, C.W.; Kokkalis, A.; Hordyk, A.R.; Wetzel, C.; Jacobsen, N.S.; Punt, A.E.; Nielsen, R. Implementing the precautionary approach into fisheries management: Biomass reference points and uncertainty buffers. Fish Fish. 2022, 23, 73–92. [Google Scholar] [CrossRef]
- Levontin, P.; Baranowski, P.; Leach, A.W.; Mumford, J.D.; Quetglas, A.; Kell, L.T. On the role of visualization in fisheries management. Mar. Pol. 2017, 78, 114–121. [Google Scholar] [CrossRef]
- Kirby, D.S.; Ward, P. Standards for the effective management of fisheries bycatch. Mar. Pol. 2014, 44, 419–426. [Google Scholar] [CrossRef]
- Pan, M.; Huntington, H.P. A precautionary approach to fisheries in the Central Artic Ocean: Policy, science, and China. Mar. Pol. 2016, 63, 153–157. [Google Scholar] [CrossRef]
- Rice, J.C. A generalization of the three-stage model for advice using the precautionary approach in fisheries, to apply broadly to ecosystem. ICES J. Mar. Sci. 2009, 66, 433–444. [Google Scholar] [CrossRef]
- Tosun, J. How the EU handles uncertain risks: Understanding the role of the precautionary principle. J. Eur. Public Policy 2013, 10, 1517–1528. [Google Scholar] [CrossRef]
- Gianelli, I.; Ortega, L.; Pittman, J.; Vasconcellos, M.; Defeo, O. Harnessing scientific and local knowledge to face climate change in small-scale fisheries. Glob. Environ. Change 2021, 68, 102253. [Google Scholar] [CrossRef]
- Barclay, K.; Voyer, M.; Mazur, N.; Payne, A.M.; Mauli, S.; Knich, J.; Fabinyi, M.; Smith, G. The importance of qualitative social research for effective fisheries management. Fish. Res. 2017, 186, 426–438. [Google Scholar] [CrossRef]
- Jacobsen, N.S.; Burgess, M.G.; Andersen, K.H. Efficiency of fisheries in increasing at the ecosystem level. Fish Fish. 2017, 18, 199–211. [Google Scholar] [CrossRef] [Green Version]
- Abdi, M.J.; Raffar, N.; Zulkafli, Z.; Nurulhuda, K.; Rehan, M.B.; Muharam, F.M.; Tangang, F. Index-based insurance and hydroclimatic risk management in agriculture: A systematic review of index selection and yield-index modelling methods. Int. J. Disaster Risk Reduct. 2022, 67, 102653. [Google Scholar] [CrossRef]
- Barr, R.; Bruner, A.; Edwards, S. Fisheries improvement projects and small-scale fisheries: The need for a modified approach. Mar. Pol. 2019, 105, 109–115. [Google Scholar] [CrossRef]
- Jin, D.; DePiper, G.; Hoagland, P. Applying portfolio management to implement ecosystem-based fishery management (EBFM). N. Am. J. Fish. Manag. 2016, 36, 652–669. [Google Scholar] [CrossRef]
- Chu, J.; Garlock, T.M.; Sayon, P.; Asche, F.; Anderson, J.L. Impact evaluation of a fisheries development project. Mar. Pol. 2017, 85, 141–149. [Google Scholar] [CrossRef]
- Dahl, R.E.; Oglend, A.; Yahya, M. Salmon stock market prices revealing salmon price information. Mar. Resour. Econ. 2021, 36, 173–190. [Google Scholar] [CrossRef]
- Xiang, R.; Jones, C.; Mamon, R.; Chavez, M. Modelling exchange-driven fish price dynamics. J. Model. Manag. 2021, 16, 1054–1069. [Google Scholar] [CrossRef]
- Lam, M.E.; Pauly, D. Who is right to fish? Evolving a social contract for ethical fisheries. Ecol. Soc. 2010, 15, 16. [Google Scholar] [CrossRef] [Green Version]
- Saqib, S.; Ahmad, M.M.; Panezai, S.; Ali, U. Factors influencing farmers’ adoption of agricultural credit as a risk management strategy: The case of Pakistan. Int. J. Disaster Risk Reduct. 2016, 17, 67–76. [Google Scholar] [CrossRef]
- Zheng, H.; Li, J.; Zhao, X. How does financial policy support the development of China’s fishery? Characteristics, experience and prospects. Mar. Pol. 2021, 132, 104678. [Google Scholar] [CrossRef]
- Velandia, M.; Rejesus, R.M.; Knight, T.O.; Sherrick, B.J. Factors affecting farmers’ utilization of agricultural risk management tools: The case of crop insurance, forward contracting, and spreading sales. J. Agric. Appl. Econ. 2009, 41, 107–123. [Google Scholar] [CrossRef] [Green Version]
- Giri, S.S. (Ed.) Small-Scale Fisheries in South Asia; SAARC Agriculture Centre: Dhaka, Bangladesh, 2018; 137p, Available online: https://www.researchgate.net/publication/333089404 (accessed on 15 May 2022).
- Seara, T.; Clay, P.M.; Colburn, L.L. Perceived adaptive capacity and natural disasters: Fisheries case study. Mar. Pol. 2016, 38, 49–57. [Google Scholar] [CrossRef] [Green Version]
- Zheng, H.; Mu, H.; Zhao, X. Evaluating the demand for aquaculture insurance: An investigation of fish farmers’ willingness to pay in central coastal areas in China. Mar. Pol. 2018, 96, 152–162. [Google Scholar] [CrossRef]
- Shaffril, H.A.M.; Samah, A.A.; Samsuddin, S.F.; Ali, Z. Mirror-mirror on the wall, what climate change adaptation strategies are practiced by the Asian’s fishermen of all? J. Clean. Prod. 2019, 232, 104–117. [Google Scholar] [CrossRef]
- Faivre, N.; Sgobbi, A.; Happaerts, S.; Raynal, J.; Schimdt, L. Translating the sendai framework into action: The EU approach to ecosystem-based disaster risk reduction. Int. J. Disaster Risk Reduct. 2018, 32, 4–10. [Google Scholar] [CrossRef]
- Pitcher, T.J.; Kalikoski, D.; Short, K.; Varkey, D.; Pramod, G. An evaluation of progress in implementing ecosystem-based management of fisheries in 33 countries. Mar. Pol. 2009, 33, 223–232. [Google Scholar] [CrossRef]
- Klemas, V. Fisheries applications of remote sensing: An overview. Mar. Pol. 2013, 148, 124–126. [Google Scholar] [CrossRef]
- Krkosek, M. Population biology of infectious diseases by wild and farmed fish. Can. J. Fish. Aquat. Sci. 2017, 74, 620–628. [Google Scholar] [CrossRef] [Green Version]
- GoP. National Policy and Strategy for Fisheries and Aquaculture Development in Pakistan; Ministry of Food, Agriculture and Livestock, Government of Pakistan: Islamabad, Pakistan, 2007; Available online: http://faolex.fao.org/docs/pdf/pak150786.pdf (accessed on 16 April 2022).
- FAO. Code of Conduct for Responsible Fisheries; FAO Fisheries and Aquaculture Department: Rome, Italy, 1995; pp. 1–41. [Google Scholar]
- Baset, A.; Liu, Q.; Hanif, M.T.; Liao, B.; Memon, A.M.; Mohsin, M. Estimation of maximum sustainable yield using production modeling: A stock appraisal of Indian oil sardine (Sardinella longiceps) from Pakistani waters. Pak. J. Zool. 2017, 49, 521–528. [Google Scholar] [CrossRef]
- Mehak, A.; Mu, Y.T.; Mohsin, M.; Memon, A.M. Bioeconomic analysis and management aspects of metapenaeus shrimp fisheries in Pakistan. Indian J. Geo-Mar. Sci. 2018, 47, 1413–1419. [Google Scholar]


| Category | Frequency | Percent | |
|---|---|---|---|
| Status | Senior Research Fellow/Other | 154 | 62.3 |
| Associate Research Fellow/Other | 93 | 37.7 | |
| Marital status | Single | 61 | 24.7 |
| Married | 186 | 75.3 | |
| Gender | Male | 208 | 84.2 |
| Female | 39 | 15.7 | |
| Education | Ph.D. | 43 | 17.4 |
| Masters | 94 | 38.1 | |
| Bachelor/Others | 110 | 44.5 | |
| Working Experience | 5–10 years | 129 | 52.2 |
| More than 10 years | 118 | 47.8 | |
| Region | Karachi Central District | 152 | 61.5 |
| Thatta District | 61 | 24.7 | |
| Sujawal District | 34 | 13.8 | |
| Total | 247 | 100.0 | |
| Scale | Interpretation (i as a Substitute for j) |
|---|---|
| 1 | Strongly preferred |
| 2 | Equal to moderately preferred |
| 3 | Moderately preferred |
| 4 | Moderately to strongly preferred |
| 5 | Strongly preferred |
| 6 | Strongly to very strongly preferred |
| 7 | Strongly preferred |
| 8 | Very strongly to extremely preferred |
| 9 | Extremely preferred |
| Matrix Value | 1 | 2 | 3 | 4 | 5 | 6 | 7 | 8 | 9 | 10 |
|---|---|---|---|---|---|---|---|---|---|---|
| RCI | 0.00 | 0.00 | 0.58 | 0.90 | 1.12 | 1.24 | 1.32 | 1.41 | 1.45 | 1.49 |
| Risk Type | Importance | Rank |
|---|---|---|
| Technical | 0.037 | 5 |
| Market | 0.067 | 4 |
| Ecological | 0.140 | 3 |
| Natural | 0.256 | 2 |
| Management | 0.499 | 1 |
| Risk Type | Performance | Rank |
|---|---|---|
| Management | 4.778 | 1 |
| Natural | 3.333 | 4 |
| Ecological | 4.000 | 2 |
| Market | 2.889 | 5 |
| Technical | 3.344 | 3 |
| Risk Type | Code | Factor | Importance (Weights %) | Performance (Weights %) | Quadrant |
|---|---|---|---|---|---|
| Management Risk | a1 | Lack of knowledge | 0.134 | 2.778 | II |
| a2 | Personal injury | 0.028 | 3.778 | IV | |
| a3 | Overfishing | 0.271 | 5.000 | I | |
| a4 | Operational errors | 0.066 | 4.000 | I | |
| Natural Risk | b1 | Oceanic climate changes | 0.061 | 3.667 | II |
| b2 | Temperature | 0.170 | 3.000 | II | |
| b3 | Natural disasters | 0.025 | 3.556 | III | |
| Ecological Risk | c1 | Exotic species | 0.007 | 4.000 | IV |
| c2 | Habitat degradation | 0.015 | 4.222 | IV | |
| c3 | Troubled waters (pollution) | 0.032 | 4.889 | IV | |
| c4 | Hazardous inorganic | 0.086 | 4.222 | I | |
| Market Risk | d1 | Price fluctuation | 0.019 | 3.000 | III |
| d2 | Cost fluctuation | 0.039 | 2.111 | III | |
| d3 | Asymmetric market information | 0.009 | 2.556 | III | |
| Technical Risk | e1 | Irrational fishing gear | 0.023 | 4.333 | IV |
| e2 | Equipment failure | 0.002 | 3.667 | III | |
| e3 | Emissions | 0.008 | 4.222 | IV | |
| e4 | Infectious diseases | 0.004 | 3.556 | III |
Publisher’s Note: MDPI stays neutral with regard to jurisdictional claims in published maps and institutional affiliations. |
© 2022 by the authors. Licensee MDPI, Basel, Switzerland. This article is an open access article distributed under the terms and conditions of the Creative Commons Attribution (CC BY) license (https://creativecommons.org/licenses/by/4.0/).
Share and Cite
Mohsin, M.; Hengbin, Y.; Luyao, Z.; Rui, L.; Chong, Q.; Mehak, A. An Application of Multiple-Criteria Decision Analysis for Risk Prioritization and Management: A Case Study of the Fisheries Sector in Pakistan. Sustainability 2022, 14, 8831. https://doi.org/10.3390/su14148831
Mohsin M, Hengbin Y, Luyao Z, Rui L, Chong Q, Mehak A. An Application of Multiple-Criteria Decision Analysis for Risk Prioritization and Management: A Case Study of the Fisheries Sector in Pakistan. Sustainability. 2022; 14(14):8831. https://doi.org/10.3390/su14148831
Chicago/Turabian StyleMohsin, Muhammad, Yin Hengbin, Zhang Luyao, Li Rui, Qian Chong, and Ana Mehak. 2022. "An Application of Multiple-Criteria Decision Analysis for Risk Prioritization and Management: A Case Study of the Fisheries Sector in Pakistan" Sustainability 14, no. 14: 8831. https://doi.org/10.3390/su14148831
APA StyleMohsin, M., Hengbin, Y., Luyao, Z., Rui, L., Chong, Q., & Mehak, A. (2022). An Application of Multiple-Criteria Decision Analysis for Risk Prioritization and Management: A Case Study of the Fisheries Sector in Pakistan. Sustainability, 14(14), 8831. https://doi.org/10.3390/su14148831