Article

Sequential Formation of CO2 Hydrates in a Confined Environment: Description of Phase Equilibrium Boundary, Gas Consumption, Formation Rate and Memory Effect

by
Alberto Maria Gambelli
*,
Mirko Filipponi
and
Federico Rossi
Engineering Department, University of Perugia, Via G, Duranti 93, 06125 Perugia, Italy
*
Author to whom correspondence should be addressed.
Sustainability 2022, 14(14), 8829; https://doi.org/10.3390/su14148829
Submission received: 9 June 2022 / Revised: 7 July 2022 / Accepted: 18 July 2022 / Published: 19 July 2022
(This article belongs to the Special Issue Geological Engineering and Sustainable Energy Geotechnics)

Abstract

:
Since 1980, one of the most promising solutions for the exploitation of natural gas hydrate reservoirs was found to be the replacement of methane with carbon dioxide in order to improve the efficiency of methane recovery and, at the same time, permanently store carbon dioxide. However, the process efficiency is still too low and far from reaching technical maturity and becoming economically competitive. In this sense, studying the intrinsic properties of CO2 hydrates formation and dissociation processes may help in better defining the reasons for this low efficiency and finding feasible solutions. This work deals with carbon dioxide hydrates formation in a natural silica-based porous medium and in fresh water. A lab-scale apparatus was used for experiments, which were carried out consecutively and with the same gas–water mixture in order to detect the possible occurrence of the “memory effect”. Six tests were carried out: the quantity of gas available for the formation of hydrates led to an initial pressure equal to 39.4 bar within the reactor (the initial pressure was 46 bar; however, the dissolution of CO2 in water during the first test caused a reduction in the quantity of gas available for the process). Each experiment started and ended at temperatures equal or higher than 20 °C. Considering the local pressures, these temperatures ensured the complete dissociation of hydrates. Besides thermodynamic parameters, the gas consumption and the rate constant were evaluated throughout the whole of the experiments. Conversely to what is asserted in the literature, the results demonstrated the weak persistence of the memory effect at a temperature slightly above 25 °C. As expected, ice formation competed with hydrates; however, during tests, it caused the partial release of carbon dioxide previously trapped into hydrates or dissolved in water. Finally, the rate constant completely agreed with the labile Cluster Theory and proved that primordial clusters and hydrate crystals formed and dissociated during the whole test. The first phenomenon was predominant during the formation phase, while the opposite occurred during the following step. The rate constant was found to be an effective parameter to quantify differences between measured and real equilibrium conditions for the system.

1. Introduction

Natural gas hydrates are solid and ice-like crystalline compounds consisting of solid structures, made with water molecules which contain gaseous molecules. The first compound mentioned is referred to as “host”, while the second plays the role of “guest” [1]. Three different structures exist in nature: the cubic stricture I (sI), the cubic structure II (sII) and the hexagonal structure H (sH) [2]. One of the most promising properties of gas hydrates is their relatively high energy density: one cubic meter of methane hydrate can contain up to 164 m3 of methane and only 0.8 m3 of water (these two values are referred to as standard pressure and temperature conditions). In addition, based on current estimations, the amount of gas hydrates diffused worldwide ranges from 1015 to 1017 m3 [3]. This means that they potentially contain more than twice the energy which can be still produced from all conventional energy sources currently known by humans [4]. A second advantage exists in the possibility of making them a completely carbon neutral energy source [5]. Approximately 97% of naturally occurring hydrate deposits are offshore reservoirs, while the remaining 3% are found in permafrost regions [6]. Today, most energy consuming countries (for instance America, China and Japan) carry out field tests both in offshore and inshore reservoirs. Methane recovery can be performed with some well-known techniques, such us depressurization [7,8], thermal stimulation [9,10], chemical inhibitor injection [11], or a combination of them (mainly a combination of depressurization and thermal stimulation) [12]. The first method consists of lowering the local pressure while maintaining a constant temperature in order to move the thermodynamic conditions outside from the hydrate stability zone and cause methane release. The contrary occurs when the second technique is applied, and the final achievement is the same. Differently from the previous methods, the use of chemical inhibitors allows to maintain the local conditions unchanged but, at the same time, make them unfeasible for methane hydrates stability. Currently, the main challenge associated with the first two techniques is the high thermal energy required to achieve high efficiencies, while the main disadvantages, related to the use of chemical inhibitors, are their high costs and their impact on the surrounding environment. For the first time in 1980, the recovery of methane was proposed to be performed via carbon dioxide injection in order to favor a direct exchange between these two types of molecules in water cages and contemporarily increase the efficiency of methane recovery and permanently store carbon dioxide. This latter compound leads to the formation of more thermodynamically stable hydrates than methane, thus enabling the exothermic replacement of methane [13]. In the past few decades, the replacement mechanism was deepened both in laboratory scale apparatuses and directly in field tests. Several studies were carried out, including the injection of liquid carbon dioxide [14], in situ Raman spectroscopy [15], micro differential scanning calorimetry [16] and magnetic resonance imaging [17]. However, more efforts are needed to make this option competitive and feasible for large-scale applications [18].
In more detail, a deepened comprehension of the hydrate dissociation mechanism and the wider characterization of natural elements able to intervene on the process, which are commonly found in natural gas hydrates reservoirs, are needed. Kamath and co-workers [19] studied the heat transfer properties of the dissociation interface for propane hydrates. A strong similarity was observed between this process and the nucleate boiling of liquids. Similar experiments were made with methane and other guest compounds and the achievements were similar. These experiments allowed us to assert that one of the most limiting factors is the heat transfer. A model to define the heat and mass transfer during hydrate dissociation was proposed by Selim et al. [20]. This model considers the presence of a porous media, as commonly occurs in offshore sediments; it established that the heat transfer mainly depends on the surrounding sediments [21,22].
The dissociation of hydrate structures produces liquid water, whose molecules form a sort of insulating layer over the already existing solid cages [23]. This liquid thickness reduces the heat transfer and consequently lowers the dissociation rate. Conversely, the gas released during dissociation produces bubbles, which enhance the heat transfer via convection and favor the dissociation process. Similarly, the mass transfer may represent a limiting factor during methane hydrates dissociation. Katsuki [24] tested this latter process in a glass micro model. He concluded that hydrate structures adjacent to the gaseous phase dissociate first, while direct contact with liquid water may temporarily stop the process [25]. However, immediately after dissociation, methane molecules diffuse in water and migrate to the gaseous phase, differently from carbon dioxide molecules, which take more time for migration.
The porous medium plays a key role in this sense. Hachikubo et al. [26] proved that particle size has a crucial role during hydrates dissociation. They established that the hydrate dissociation rate is higher in coarse glass sand than in fine silica sand. This is due to the tendency of water molecules to form a thin layer on grains of this latter compound.
The process kinetic is also a function of specific properties of hydrate sediments, such as the so-called “memory effect” and “anomalous self-preservation”. If hydrates are formed two times consecutively with the same gas–water mixture, the process will occur faster in the second attempt. Several studies confirmed the higher suitability of hydrate dissociated solutions for new formation than fresh solutions [27,28]. Two different hypotheses were defined to explain such phenomenon. According to the first hypothesis, the memory effect is due to the permanence of residual structures in water; conversely, the second theory is based on the permanence of hydrate crystallites [29]. The memory effect was discovered for the first time approximately 130 years ago [30,31] and was immediately found to be crucial for their exploitation [32]. Takeya studied the memory effect for carbon dioxide hydrates and found that it persists only at melting temperatures below 298 K [33]. Similar results were achieved by using methane as a guest compound [34]. Additionally, time plays a key role in the permanence of such effects [35]: it disappears when hydrates are decomposed at superheating temperatures, about 2–4 °C above the equilibrium, for more than two hours. Moreover, the porous medium might also play a role in this sense; in addition to the previous mentioned hypotheses, some authors defined the so-called impurity imprinting theory [36]. The anomalous “self-preservation” was observed for the first time in 1986 [37] and represents the tendency of gas hydrates to remain stable outside from the hydrate stability zone, even if for a limited time period.
Experiments described in this manuscript deal with carbon dioxide hydrates formation and dissociation in the presence of a natural porous medium and fresh water. The experiments were carried out in a small-scale experimental apparatus and with the same gas–water mixture in order to observe the properties previously mentioned. In these tests, temperature was shifted below the ice-point during formation and above 20 and 25 °C during dissociation. During the discussion of the results, different parameters such as pressure, temperature, gas consumption and formation rate constant were considered. This latter parameter was calculated by considering the process describable with the first order chemical kinetic equation for the time dependence [38,39].
This experimental work allowed us to produce some meaningful achievements. In the literature, there is a substantial lack of information about the memory effect for carbon dioxide hydrates and the little information already present must be compared with new data. Here, such properties were observed and described at different temperatures and its presence was related to the difference existing between formation and dissociation curves, widely documented in the literature [29] and commonly observed during experiments [40]. This article also provides useful information about the competition between hydrates and ice formation when temperature moves below 0 °C. Finally, the rate constant was used to explain why the kinetic process is often the limiting factor during experiments and field applications. Thank to this parameter, we were able to establish the uncertainty of pressure and temperature conditions describing hydrates equilibrium for a certain guest compound. This latter conclusion was defined according to what was expressed in the Labile Cluster Theory. This research aims to answer to the substantial lack of data about the presence of memory effect during the formation of carbon dioxide hydrates. Moreover, differently from the current literature, such an effect was also investigated at temperatures equal to or higher than 24 °C. Finally, the experiments allowed us to describe in detail the evolution of a system with the contemporary formation of ice and hydrates at temperatures slightly below the freezing point of water.

2. Materials and Methods

2.1. Experimental Apparatus

Experiments were performed in a small-scale experimental apparatus, consisting of a 316 stainless steel reactor and a cooling room and required sensors and auxiliary devices to manage gas flows inside and outside the reactor. For gas hydrates formation and dissociation, such a reactor has the same characteristics of the apparatus used in [41]. It was designed in order to assume the same properties and, at the same time, make it more manageable.
The reactor has an internal volume equal to 1000 cm3; its geometry is shown in Figure 1.
On the top, the reactor is closed with a flange, while the bottom is sealed with a 36SS plate, about 3 cm thickness. The flange tightness has been ensured with the use of a spiro-metallic gasket (model DN8U PN 10/40 316-FG C8 OR). The perimetral wall has an integrated coil, which is useful when fast cooling or heating is required, or when the target temperature is outside the operating range of the cooling room.
Gas is injected from the bottom; two channels are placed in communication cylinders (which are sited inside the room in order to maintain the gas at the same temperature as the reactor, even before its injection) with the reactor. The reactor has also been used for injecting gas from the top; however, the first option is usually preferred to obtain a higher diffusion of gaseous molecules into sand pores. The upper flange has five channels: two of them are used for temperature sensors, a third for the pressure sensor; the fourth hosts a safety valve (model E10 LS/150 by New General instruments); finally, the last channel is used for gas ejection and can also be appositely adapted to take gas samplings for further analyses. A scheme of the whole experimental apparatus is visible in Figure 2.
While pressure is directly regulated via gas injection/ejection, temperature is controlled with the cooling room. It consists of a 3 × 3 m2 room, in which temperature can be lowered up to −10 °C, with an accuracy of ±0.1 °C. Pressure was measured with a digital manometer, model MAN-SD, with an accuracy equal to ±0.5 of the full scale; conversely, temperature was measured with six Type K thermocouples. These devices were positioned at six different depths inside the reactor (3, 7, 8, 12, 15 and 19 cm depth from the top) and in two opposite sides of the reactor. This solution was chosen for experiments in which temperature gradients may occur inside the reactor. In the tests carried out in this work, gradients were not noted, and all thermocouples measured the same temperature (differences were negligible). Finally, all these devices were connected to a data acquisition system manufactured by National Instrument and managed in LabView.

2.2. Materials

Ultra-High-Purity (UHP) carbon dioxide was used as a guest compound, while the formation environment was made with fresh water and a natural porous sand. This latter compound has a heterogeneous composition: it mainly contains silica (about 99.1 wt%) but further substances were found in traces. Additionally, the size of its grains is not uniform and ranges from 0.1 to 1.0 mm. The porosity of the porous medium, considered as sum of pores volume and space present between grains, was measured with a porosimeter (model Thermo Scientific Pascal 140, provided by Microtracbel, Japan) and is approximately equal to 34–35%. More detailed information about this sand can be easily found in the literature [42].

2.3. Experimental Procedure

Before tests, the reactor was filled with approximately 800 cm3 of sand and 270 cm3 of water. Then, the flange was closed. Carbon dioxide was inserted with the opposite channel [43]. During gas injection, the temperature was kept above 20 °C in order to completely avoid hydrates formation during this phase (the formation of hydrates during this step might create uncertainties in defining the exact amount of gaseous moles inserted in the reactor). Finally, the channel was closed, and no further mass exchanges occurred with the external.
Experiments were carried out consecutively and only the temperature was modified from the external. The cooling room was regulated in order to produce a slow and gradual decrease in temperature inside the reactor during hydrates formation, and an increase, with the same characteristics during hydrates dissociation. The first phase started at relatively high temperatures (>20 °C in Test 1 and Test 2 and >26 °C in the remaining experiments) and finished at temperatures below the ice-point (approximately −1.5/−2.5 °C). Such a solution allowed us to observe and describe what happens to the system when hydrates formation competes with ice formation, both in terms of gas consumption and formation rate. The time duration of the whole series was approximately equal to 345 h. In the diagram plotted in Figure 3, all the experiments are shown on the time axis and, in some cases, the diagrams assume constant trends. This deepened the impossibility of managing the reactor for such a long time period without pauses. However, these periods did not cause variations in the results, nor in the accuracy of the data.
Despite pressure and temperature, for each test the gas consumption and the rate constant were calculated and their trends over time are shown [44,45].
The gas consumption was calculated as a percentage of the initial amount of gas injected, according to Equation (1):
GU = CO 2 inj CO 2 g CO 2 inj × 100   [ % ]
In the equation, the term CO2inj is the initial amount of carbon dioxide injected inside the reactor, while CO2g is the quantity of CO2 present in the gaseous phase in correspondence with the specific measure. These quantities were measured in moles by using Equation (2):
mol HYD = V PORE P i Z f P f Z i Z f RT P f ρ HYD         [ mol ]
In the equation: VPORE is the volume, present inside pores or between grains, suitable to host gaseous molecules, “R” is the gas constant, “Z” is the compressibility factor, calculated with the Peng-Robinson Equation, “P” and “T”, respectively, indicate pressure and temperature, subscripts “i” and “f” indicate the beginning and the ending of the time period considered for the evaluation of moles. Finally, “ρHYD” is the ideal molar density for hydrates and was calculated according to Takeya [46] and Aregba [47].
Hydrates formation and dissociation were considered a first-order chemical kinetic equation for the time dependence [38,39] and the formation and dissociation rate constant were calculated according to it (Equation (3)):
k = 1 t ln CO 2 i CO 2 i 1 1 min
Subscripts used in Equation (3) mean that the two quantities of gaseous carbon dioxide considered belong to two consecutive measures.
Finally, the uncertainty of all measures, used to produce the diagrams shown in the following section, was defined by considering the accuracy of the instruments (digital manometer and thermocouples; this information is provided in Section 2.1) and with the auxilium of the document JCGM 100:2008 (GUM with minor corrections)—Evaluation of measurement data—Guide to the expression of uncertainty in measurement. The evaluated uncertainty is equal to ±0.01 °C for measurements of temperature and it is equal to ± for measurements of pressure. The other parameters were calculated and their uncertainty is exclusively associated with the process detailed in the following section.

3. Results and Discussion

In this section, six experiments have been shown and discussed. As explained in the previous section, experiments were carried out consecutively and with the same gas–water mixture in order to observe effects associated with the memory effect.
Figure 3 shows the pressure and temperature trend throughout all the tests.
Figure 3 shows all experiments consecutively and indicates their evolution over time. The first portion of the diagram (highlighted in the figure and referred to as “gas injection”) confirmed that carbon dioxide was injected inside the reactor at a high temperature to avoid hydrates formation during this phase. All experiments began and finished at relatively high temperatures. The difference between the initial and final pressure observed in Test 1 and Test 2 allowed us to evaluate the quantity of carbon dioxide dissolved in water. The solubility of this compound in water is equal to 1.688 g/L (evaluated at 20 °C). Test 1 started at 46 bar and finished at 39.4 bar. Moreover, when hydrates were already completely dissociated (the thermodynamic conditions remained outside from the stability zone for several hours), a further decrease in pressure was observed, until reaching approximately 37 bar. Measures of pressure did not allow us to distinguish the portion of carbon dioxide involved in hydrates formation and the one dissolved in water. However, it was previously proved that this latter quantity, in presence of suitable thermodynamic conditions, will inevitably form hydrates [48]. The analysis of gas consumption allowed us to well quantify the amount of carbon dioxide dissolved in water. Moreover, the dissolution of CO2 in water may vary with temperature. Such a variation was observed and described with parameter GU.
In the first experiments (Test 1 and Test 2), the temperature was brought to approximately 20 °C to cause hydrates dissociation. Considering the maximum pressure measured during experiments, at this temperature, hydrates permanence is not possible. However, it was found that when this temperature was used to dissociate hydrates, the system maintained “memory” of the previous presence of hydrate structures. For that reason, in the following experiments, temperature was shifted above 26–28 °C. Such a range was chosen because in previous research, the memory effect was found to vanish at these temperatures, both for carbon dioxide and for methane [33,34]. Differently from what is presented in the literature, the analysis of pressure–temperature evolution during experiments revealed that the memory effect also remained at these temperatures (this concept will be deepened in the paragraph describing pressure–temperature diagrams).
Finally, during the last phase of hydrates formation, the temperature was brought slightly below the ice-point in order to cause the partial formation of ice inside the reactor and describe the related effects. In all tests, when the temperature approached 0 °C, the formation process was expected to finish and all pressure diagrams approached a horizontal trend. Consequently, ice formation did not particularly affect this process. However, it caused an increase in the free gas present inside the reactor. This latter experimental evidence was observed with parameter GU and has been discussed in the related paragraph.

3.1. Pressure–Temperature Diagrams and Comparison with Equilibrium Phase Boundaries for CO2 Hydrates

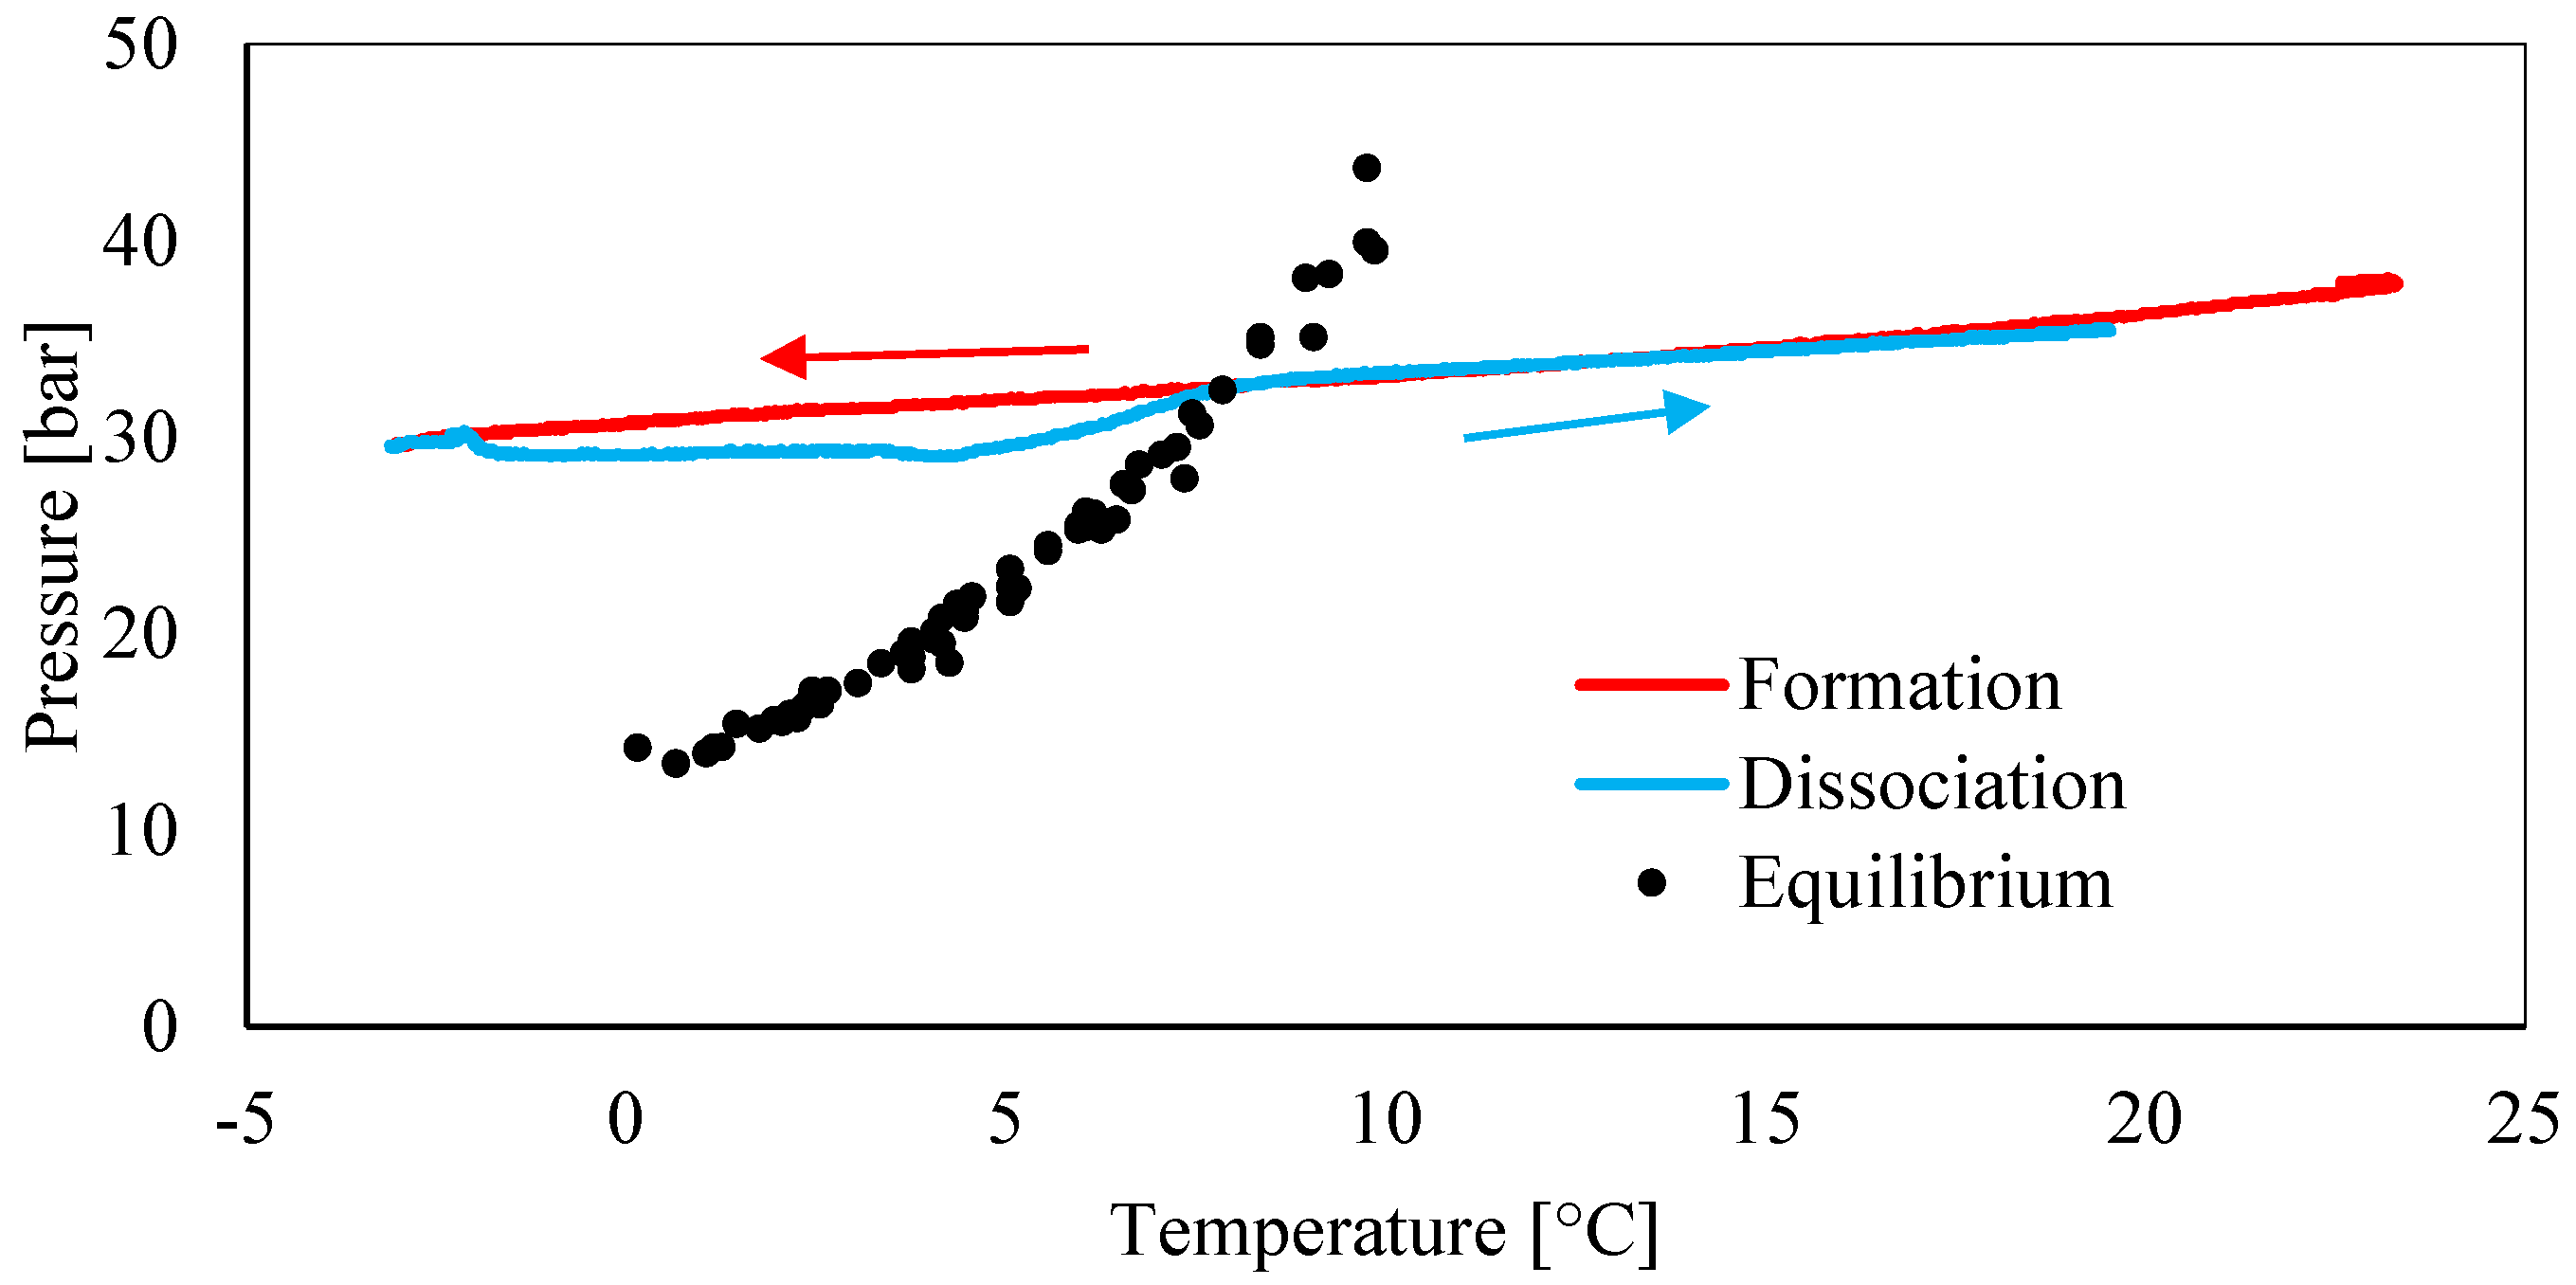
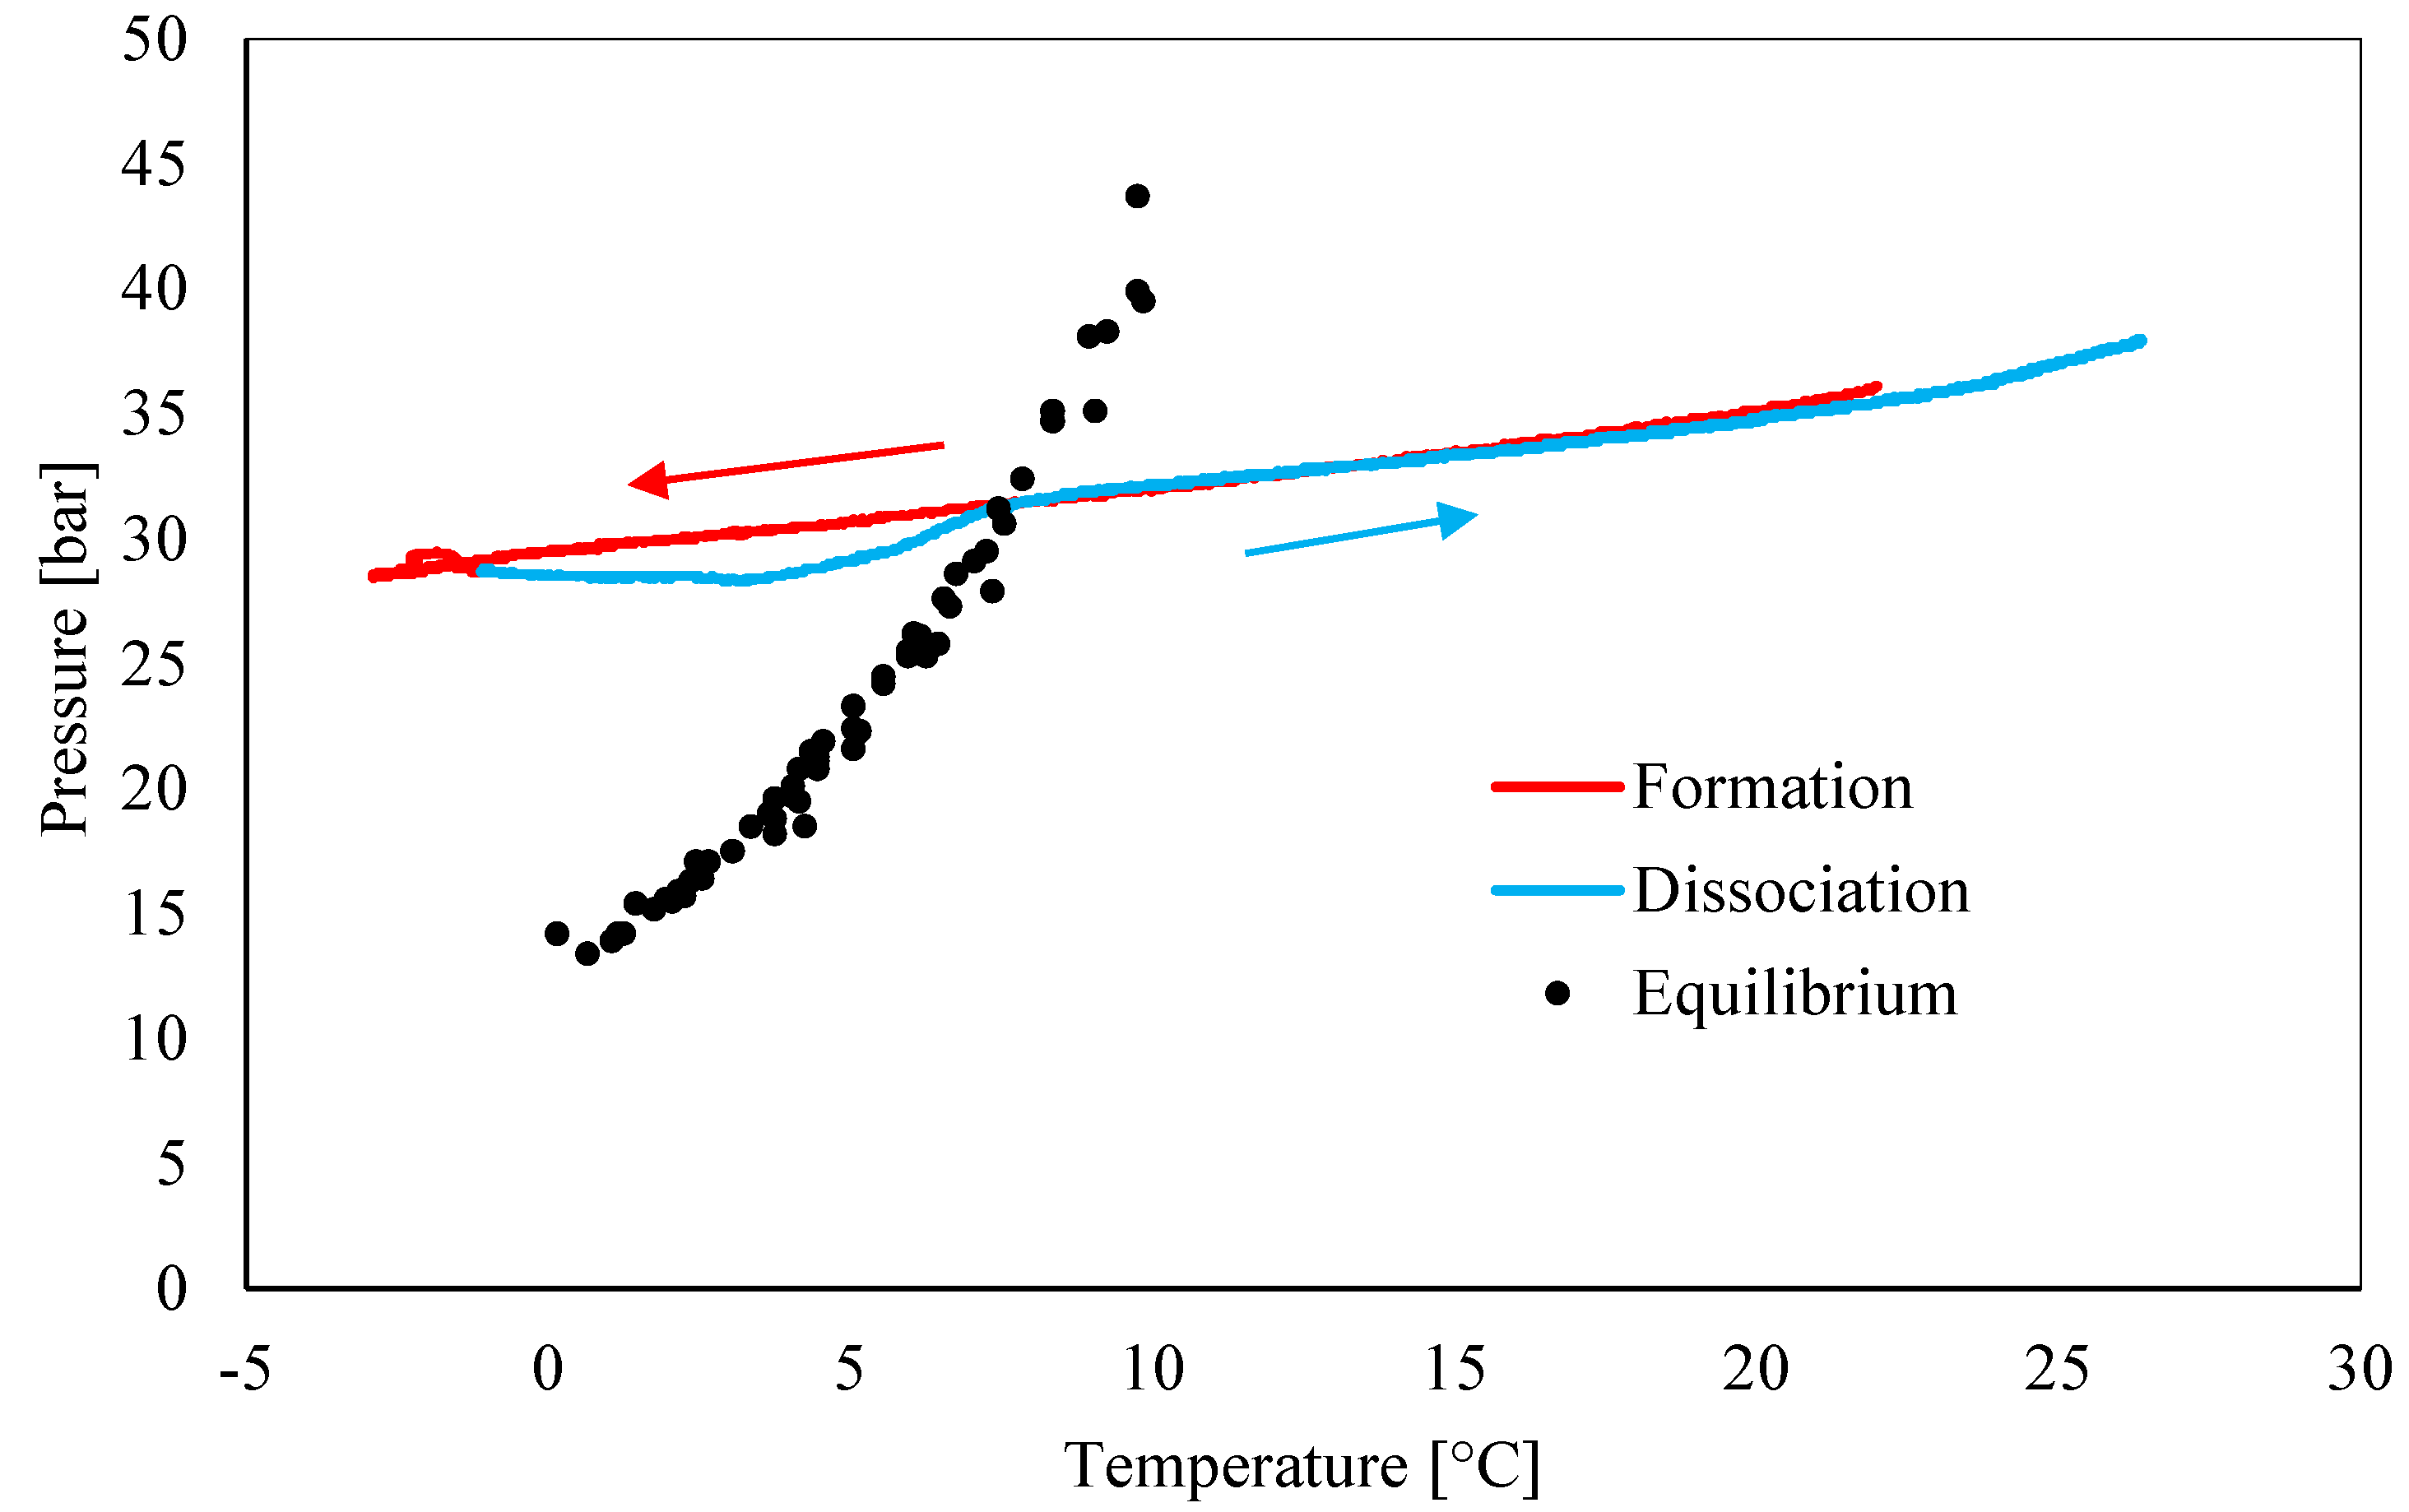
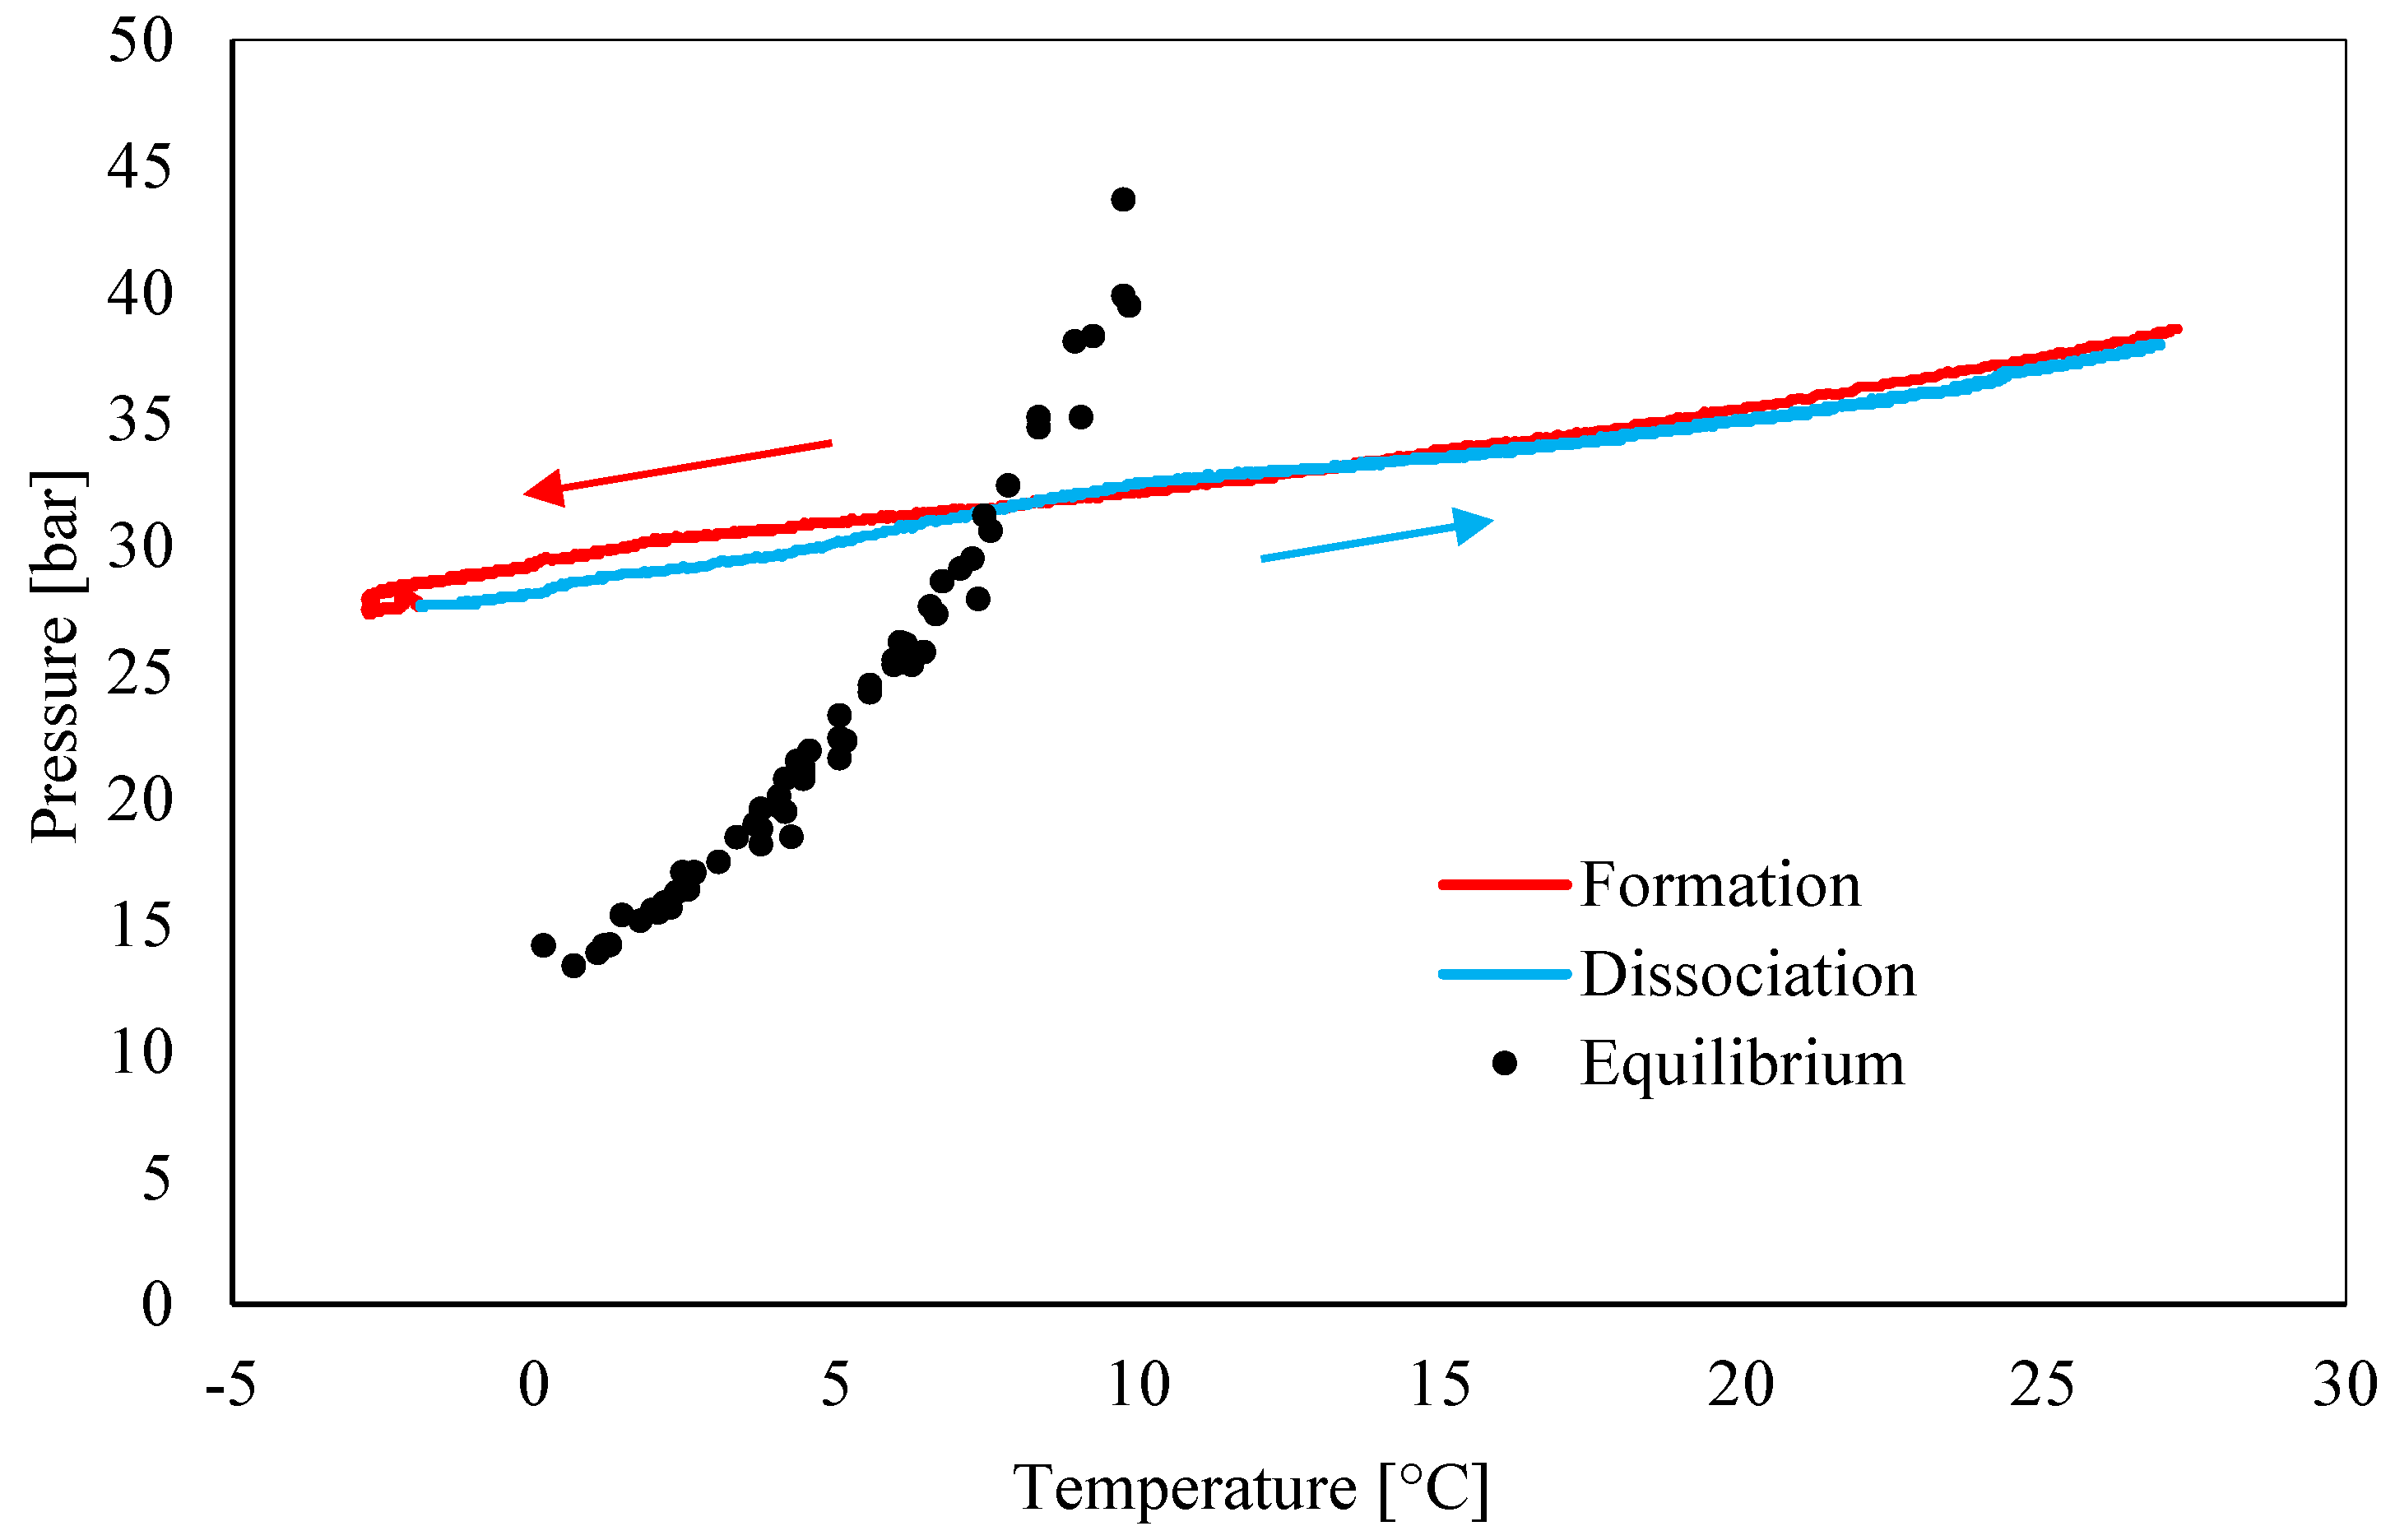
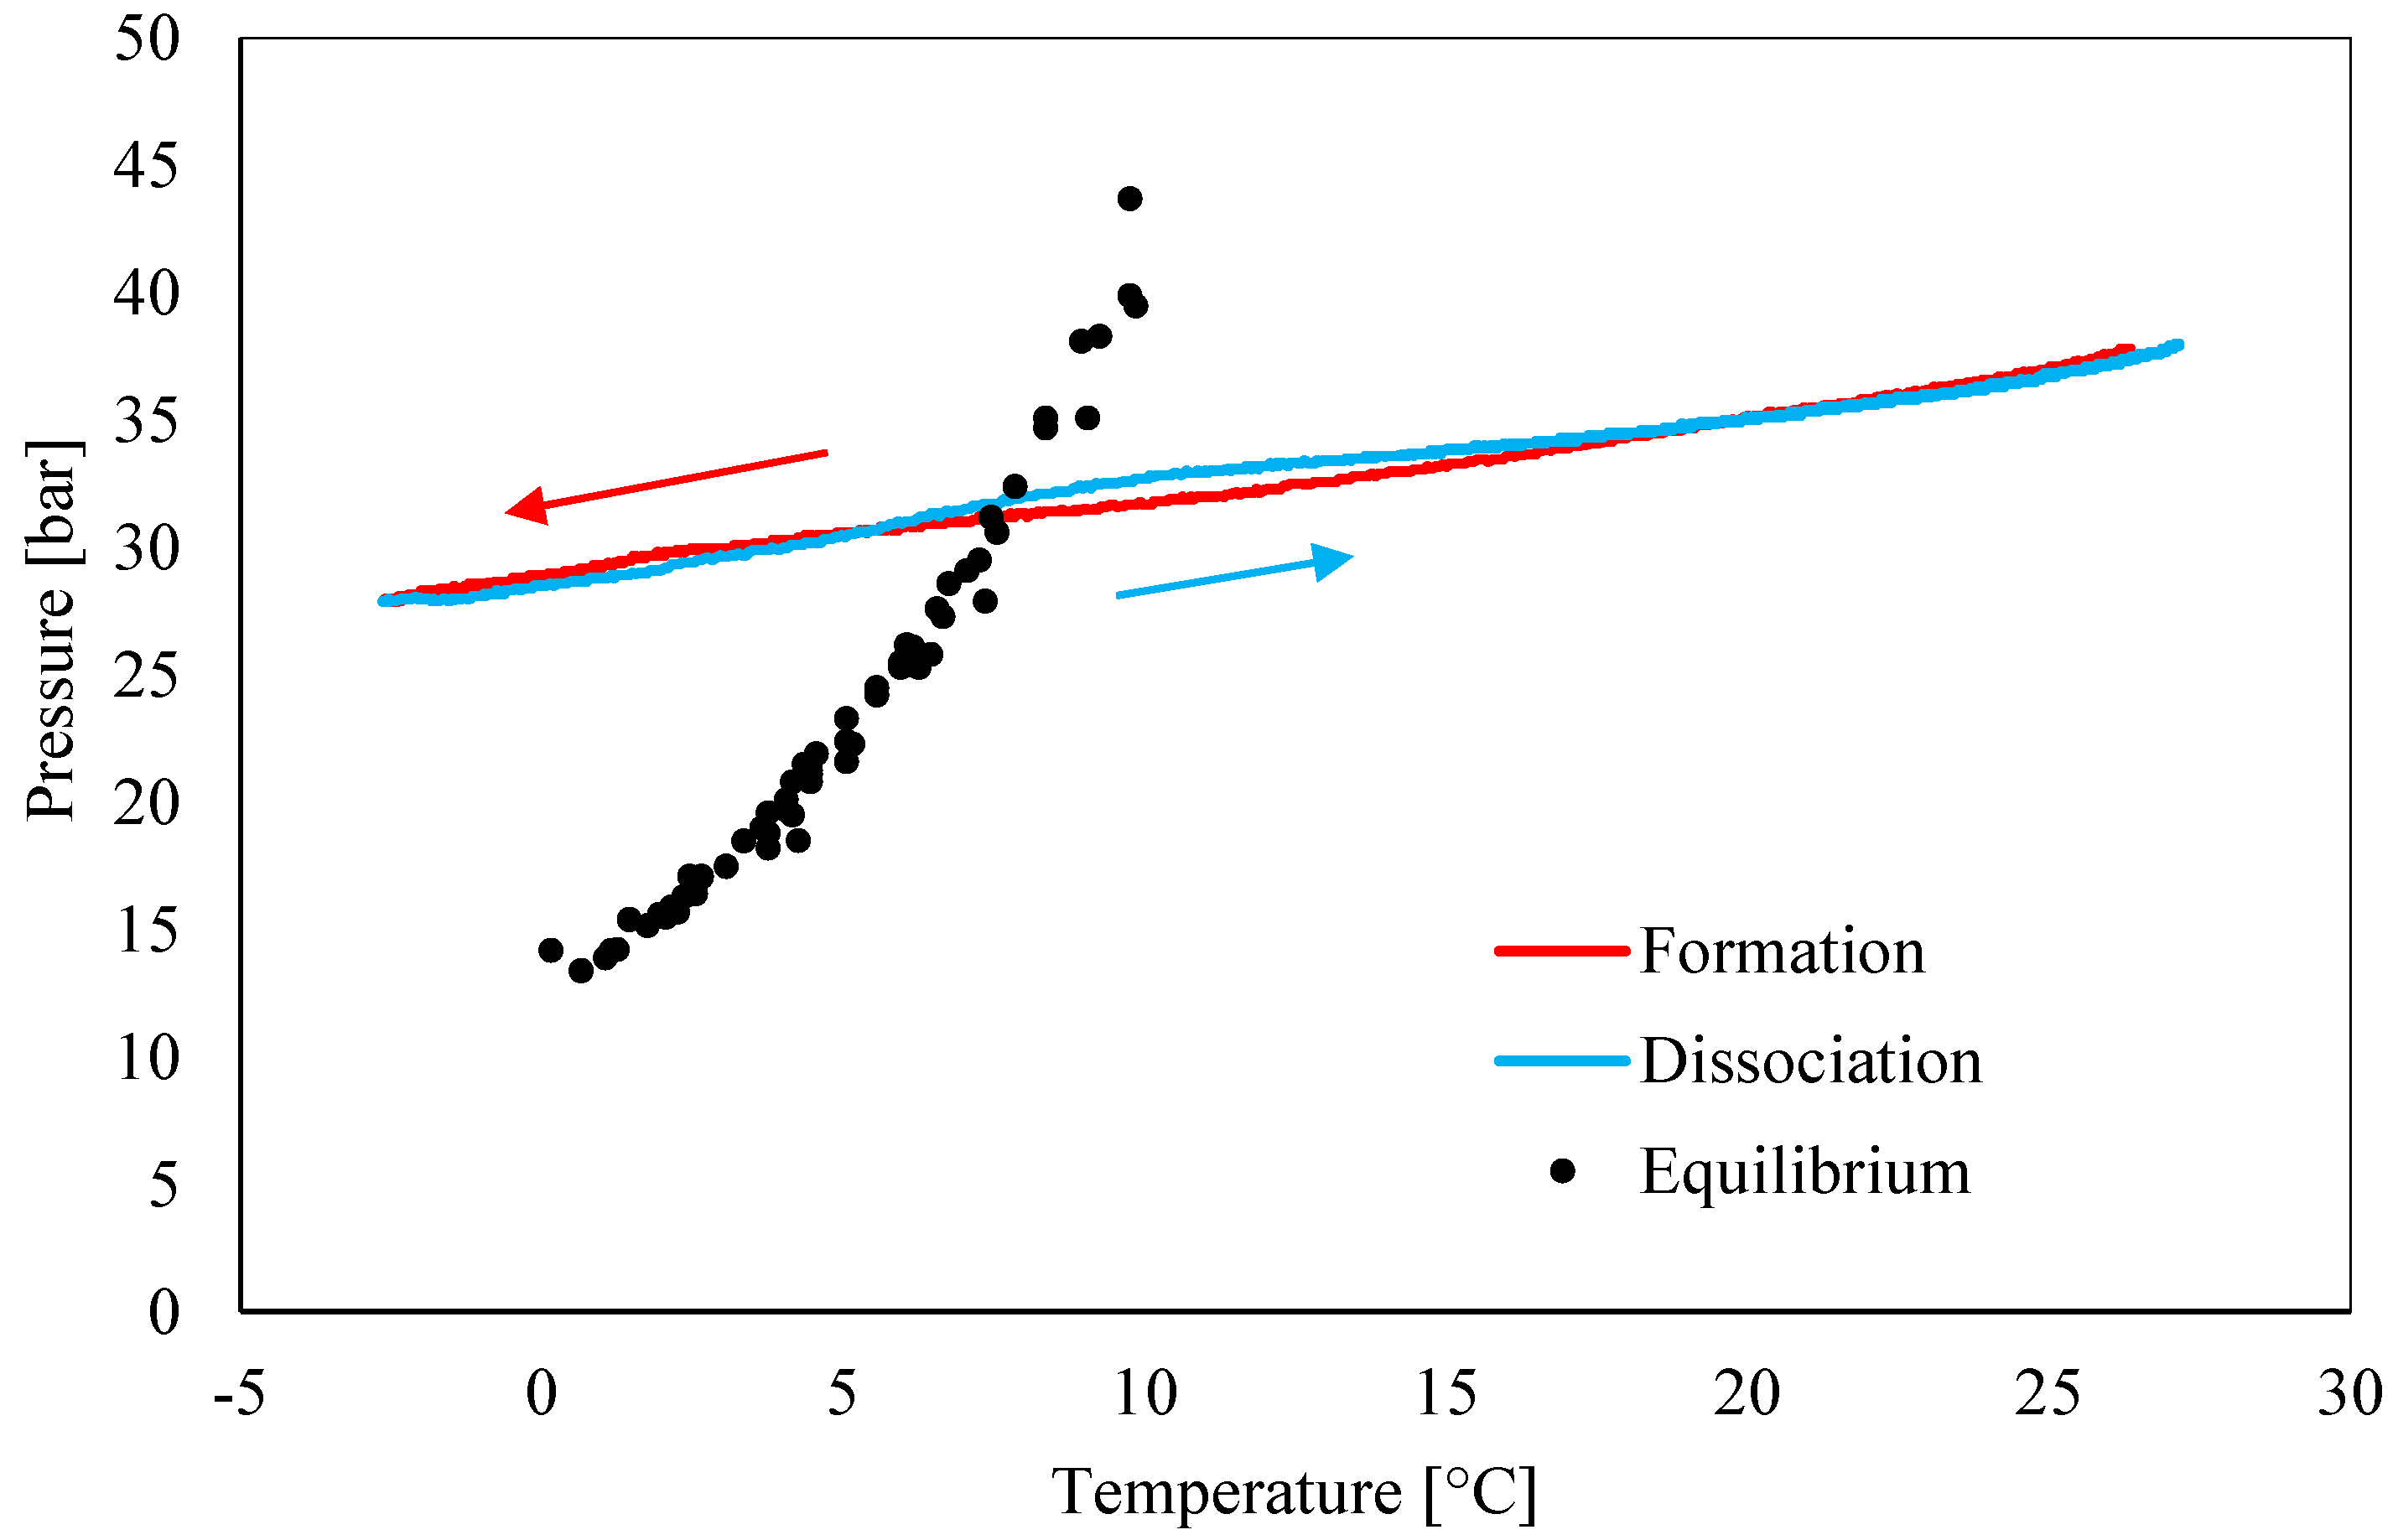
Figure 4, Figure 5, Figure 6, Figure 7, Figure 8 and Figure 9 show the pressure–temperature trend for each test. Hydrates formation and dissociation are indicated with two different colors (hydrates formation is in red, while the blue color was used for the following dissociation). Finally, a black pointer was used to describe CO2 hydrates equilibrium. It was drawn by using equilibrium data previously collected from literature [2,49,50,51,52,53,54,55,56,57,58,59,60].
In all diagrams, two arrows were inserted to show how tests proceeded over time: similarly to the diagrams, a red arrow was used for hydrates formation and a blue one for their dissociation.
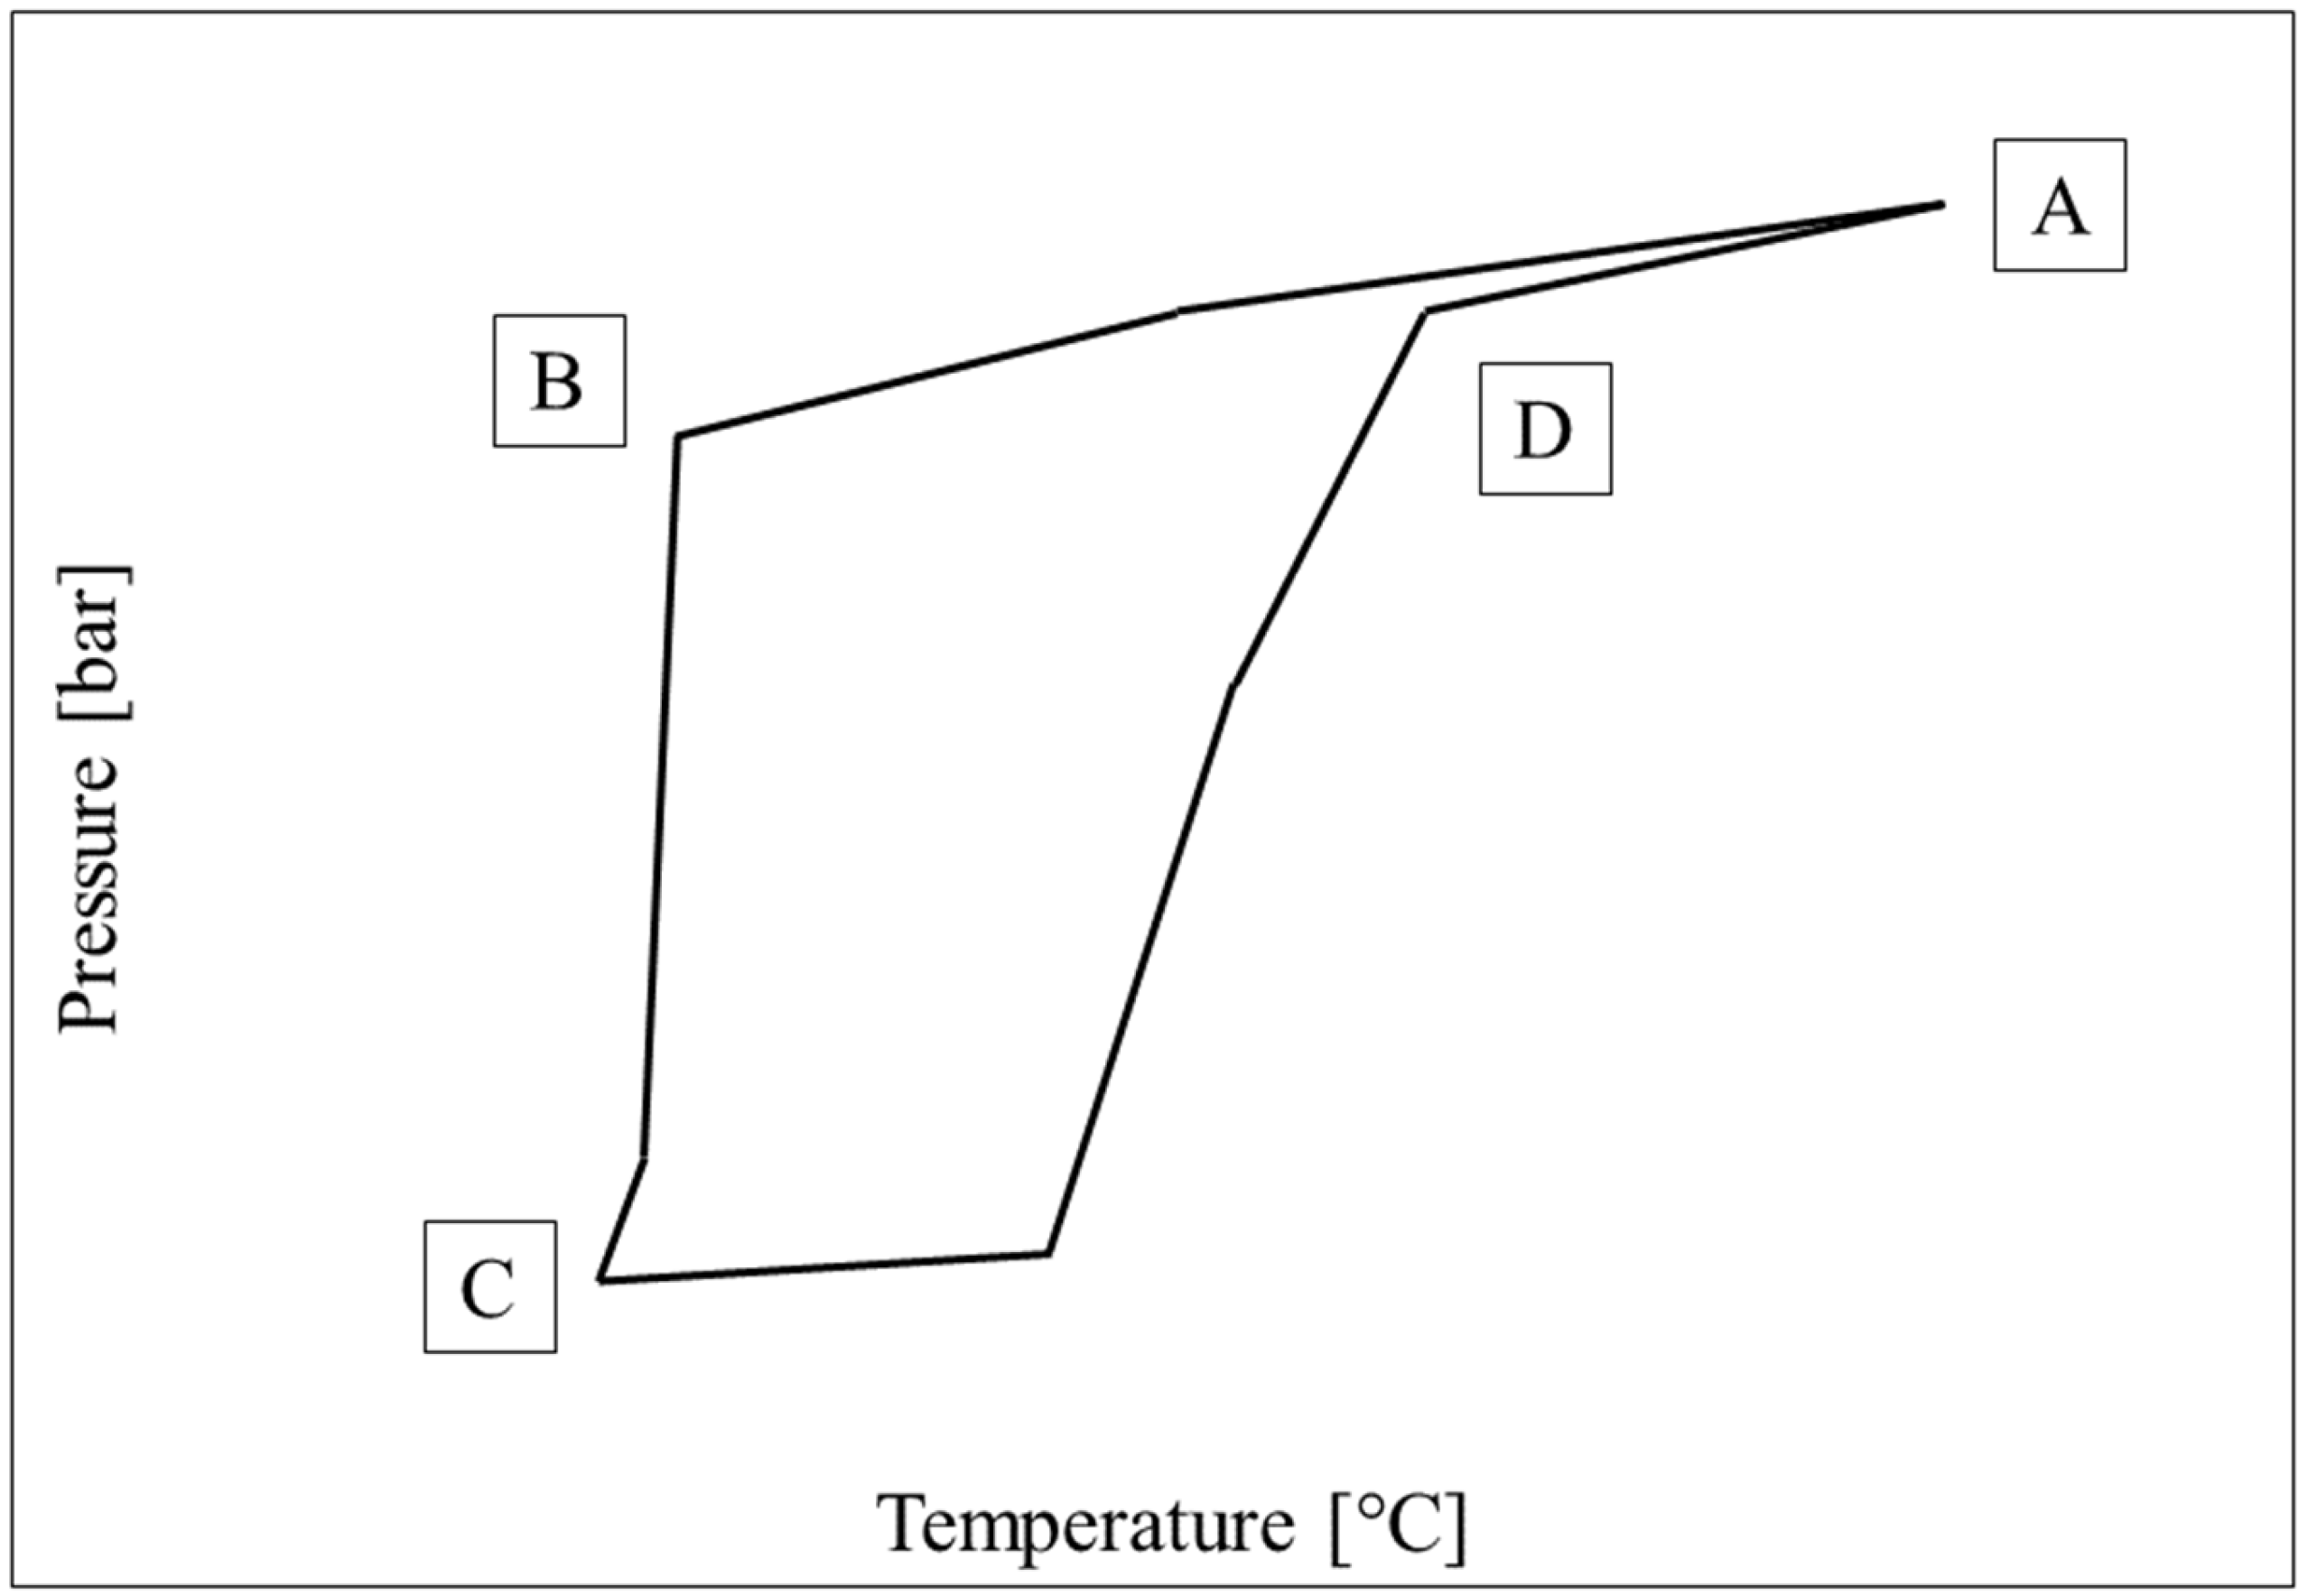
As explained in Section 2, all tests started in a thermodynamic condition widely unfeasible for hydrates formation, or on the right of the equilibrium diagram (the black line in diagrams). On the right side of the equilibrium, the formation and dissociation trends were extremely similar between each other. In this region, the relationship between pressure and temperature was almost exclusively associated with the equation of state of gases; this explained such a similarity. Conversely, on the left side, the two phases showed relevant differences and assumed a trend similar to that described in [29], which is schematized in the following Figure 10.
According to Li et al. [29], the two phases can be divided into several different steps and often present differences, thus producing a closed figure, as shown in Figure 10. In most cases, the dissociation curve is more adherent with the equilibrium configuration because it is less affected by “disturbing variables” which often intervene during formation. The first variable is the stochastic nature of the process, mainly during the initial nucleation phase. Even if the thermodynamic conditions are feasible for hydrates formation along the whole reactor, the process might not occur immediately everywhere. Due to the exothermic nature of the reaction, the formation of hydrates and their subsequent growth leads to a very visible increase in temperature, especially in small-scale reactors. After such a peak, pressure and temperature started decreasing together due to the entrapment of gaseous molecules into water cages. However, the occurrence of further formation and growth of hydrates nuclei lead to secondary temperature peaks, delayed over time if compared with the first one. These peaks cause a relevant variation in temperature; however, they do not significantly modify the pressure, thus moving the overall thermodynamic condition away from the equilibrium boundaries. A second variable is associated with hydrates or, in some cases, ice formation. The early formation of solid structures can reduce the permeability of the sediment and hinder the diffusion of gas molecules in the whole reactor. Consequently, hydrates formation may be less abundant than that expected, and the pressure drop less pronounced. Moreover, the heat released during secondary formation of nuclei usually leads to a fast increase in temperature (less than one minute may be enough to observe an increase in temperature of some degrees) and can generate undesired gradients, even if for a very contained time lapse.
However, neither formation nor dissociation followed the equilibrium line in these tests. This can be explained by considering the chemical composition of the sand, where, despite silica, it contains other compounds, some of them already known to inhibit the process. Previous studies, carried out with the same porous medium, have proved the inhibiting role of this sand during hydrates formation and dissociation for carbon dioxide and also in the presence of different guest compounds [61,62].
The observation of a pressure–temperature trend during tests confirmed the occurrence of the so-called “memory effect”. From Test 1 to Test 6, differences existing between formation and dissociation curves narrowed. In particular, the dissociation phase remained similar in all experiments, while hydrates formation changed and became more and more similar to dissociation. The gas–water mixture maintained a memory of the previous tests and hydrates formation occurred on a more homogeneous manner. In addition, challenges related to gas diffusion in the whole sediments had the possibility to affect the process only in Test 1, while in the other experiments this issue obviously disappeared. In this first test, the difference between the two phases was extremely pronounced. In the following two tests, it reduced drastically, but the two phases remained well distinguishable. Finally, in the other three tests, the two phases were overlapped (with an only little exception occurring in Test 5). Because the experiments were carried out with the same method and the same conditions, such a linear trend was associated with the memory effect and to the role it played in making hydrates formation more homogeneous, linear and adherent with the equilibrium conditions for the system (CO2 + natural porous sand). These data suggest that the memory effect also occurred at temperatures above 25 °C. In the literature, a few studies were proposed about memory effect for carbon dioxide hydrates and some of them asserted that for such a system, the memory effect has the same properties
A brief study is required for Test 1. Here, formation and dissociation were also different outside from the hydrate stability zone and two different arguments can be used to explain it. Firstly, the abovementioned difficulties in gas diffusion along the whole internal volume occurred only during this test (after the first dissociation, gas molecules had the possibility to occupy the whole sediment, because they did not find further impediments). The initial portion of hydrates dissociation was equal to that observed in formation; then, a drastic increase in pressure was observed at a constant temperature. In this phase, the temperature was below 0 °C and the presence of ice, which inevitably occurred, since the system remained below 0 °C for many hours, hindered the escape of CO2 molecules from water cages. As soon as the temperature approached 0 °C, these molecules found a way to move from the dissolved hydrates structure to the gaseous phase present above the sediment. This second effect is clearly predominant and more interesting from a scientific point of view (as previously asserted, the first aspect is due to the experimental procedure and can be found only during the first test of the series). When the temperature moves below the freezing point of water and the contemporary formation of ice and hydrates is observed, the dissociation curve might be not completely adherent to the process. While the capture of gas into solid structures can be exclusively attributed to the formation of hydrates, the following increase in pressure is also affected by the presence of ice. For instance, if some hydrates nuclei form and are then completely surrounded by ice structures, their dissociation (independently from the reason) cannot lead to an increase in pressure, because the gas released from hydrates remains trapped in the ice cavity (which is not hydrate) and cannot be detected from the pressure transducer. As soon as this quantity of gas finds a way to escape, the system immediately registers an instantaneous increase in pressure. The difference in pressures measured at the beginning and at the end of the whole experiments is due to the dissolution of carbon dioxide and is explained in more detail in the next paragraph.

3.2. Analysis of Gas Consumption over Time

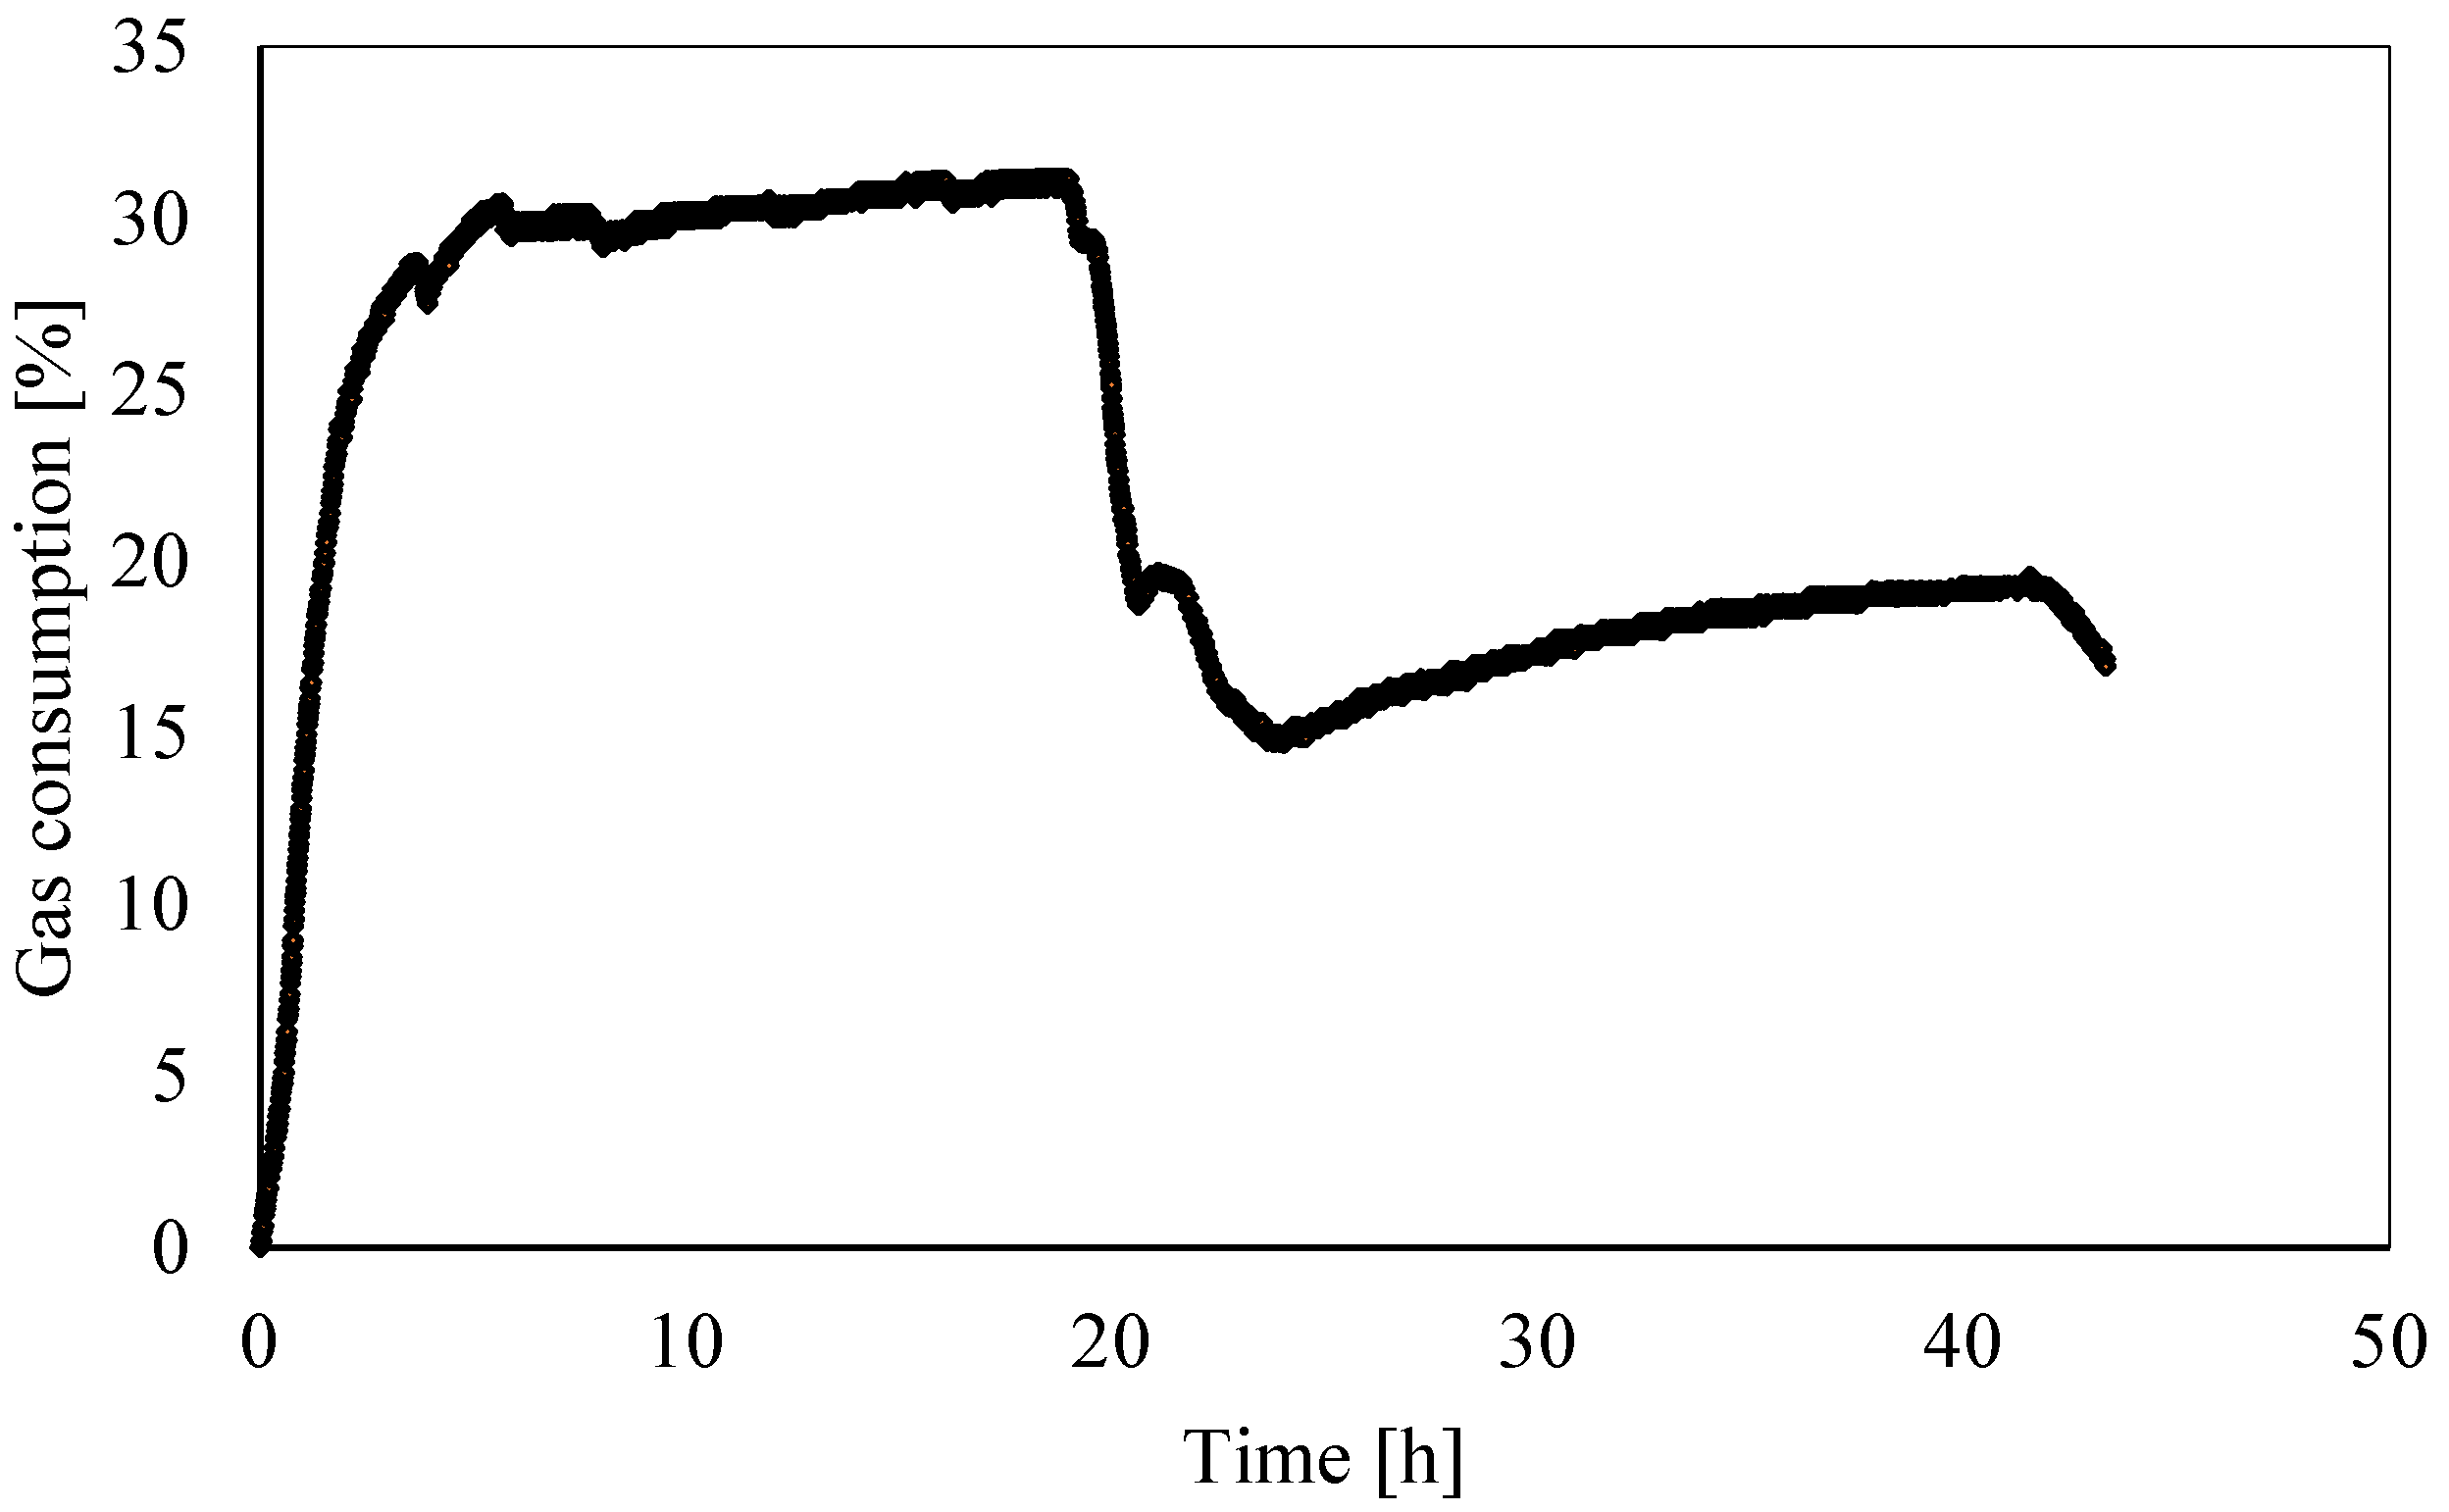
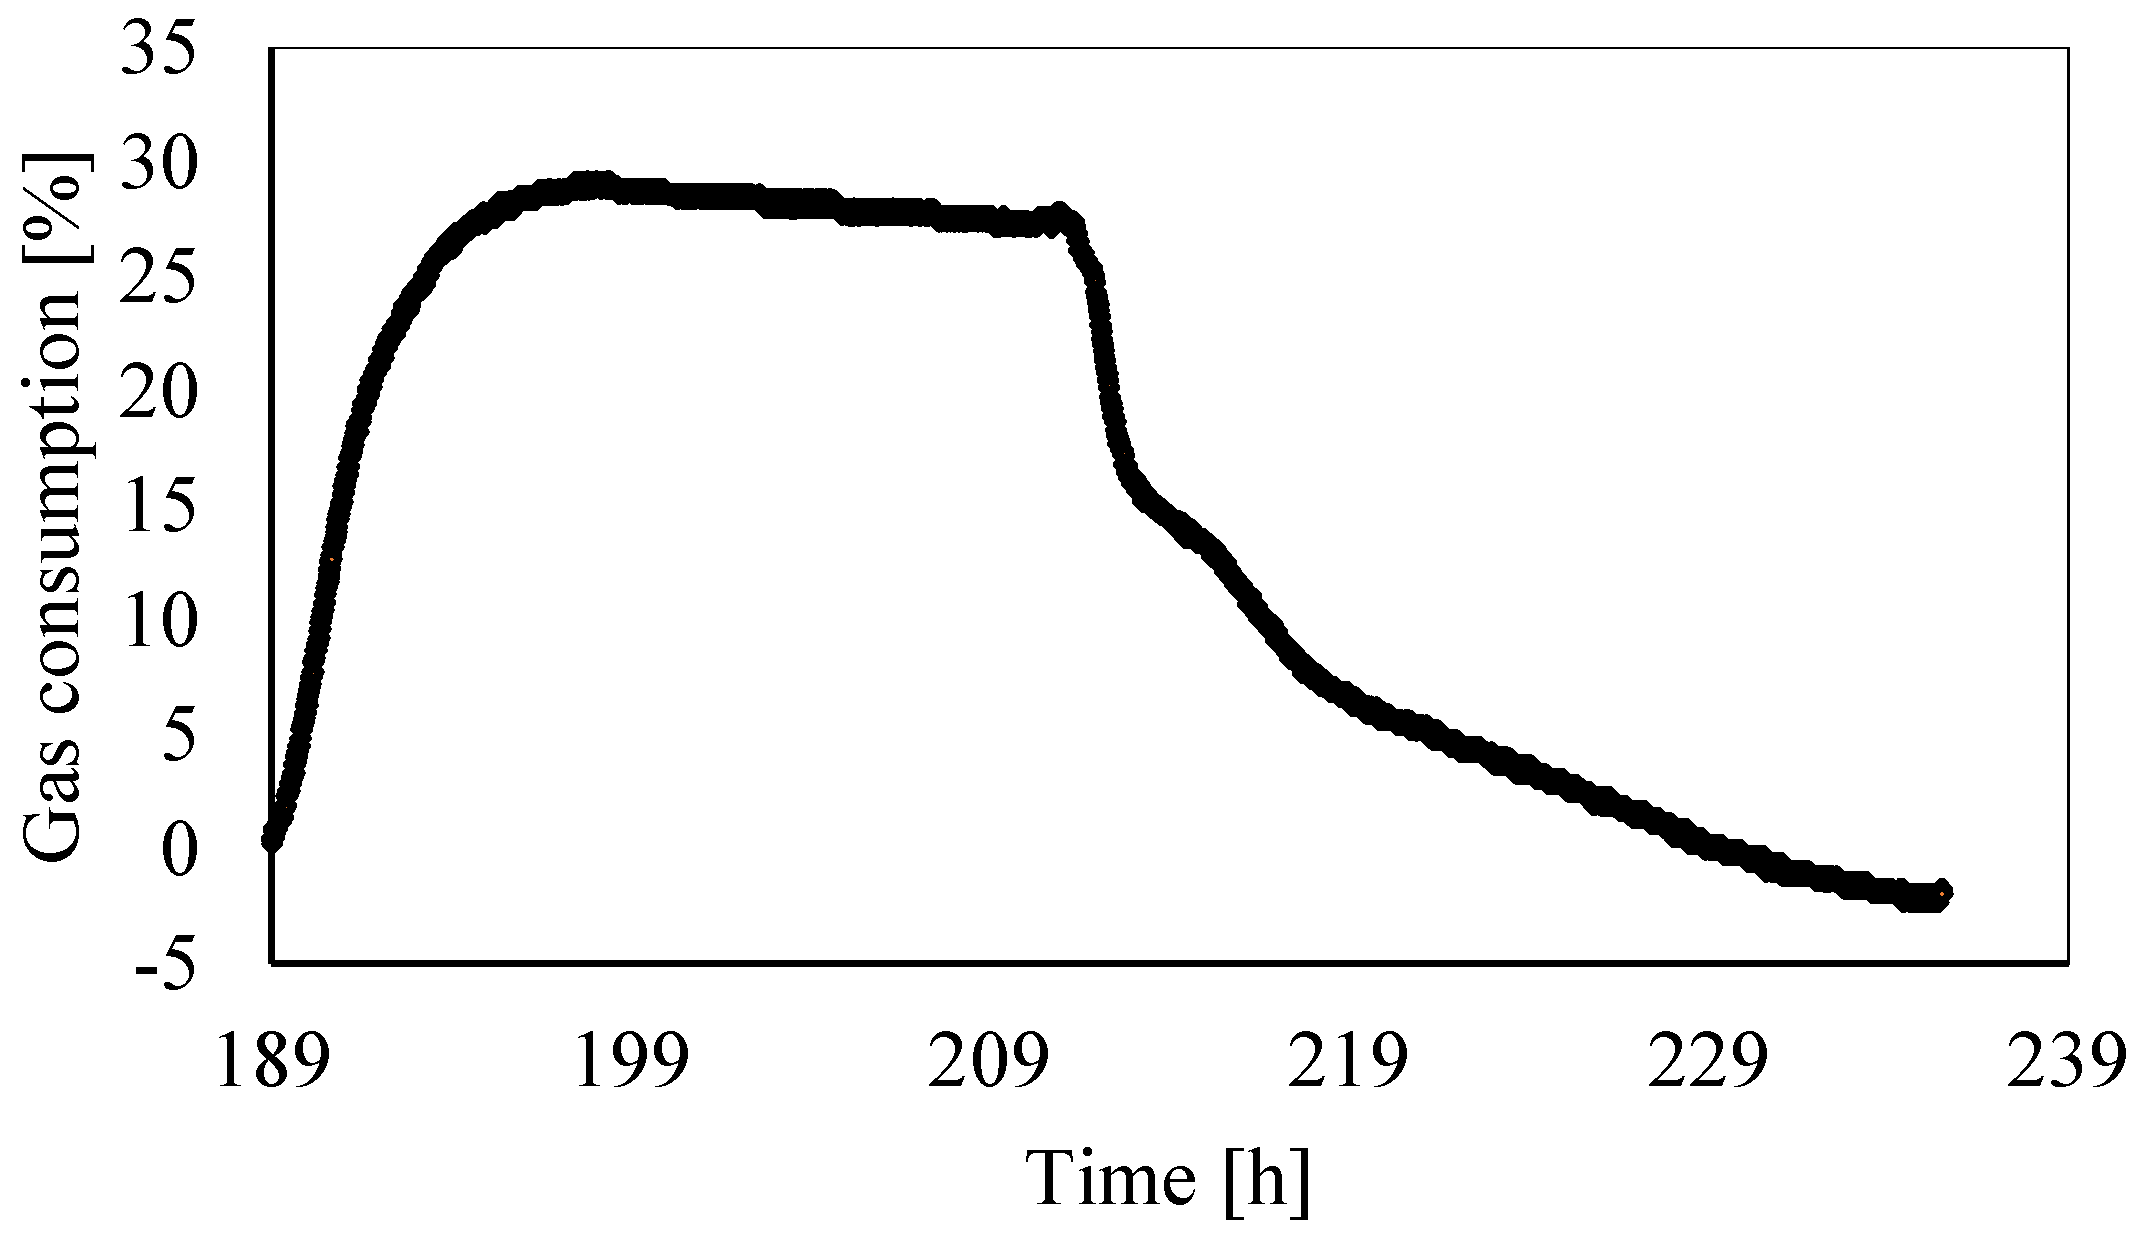
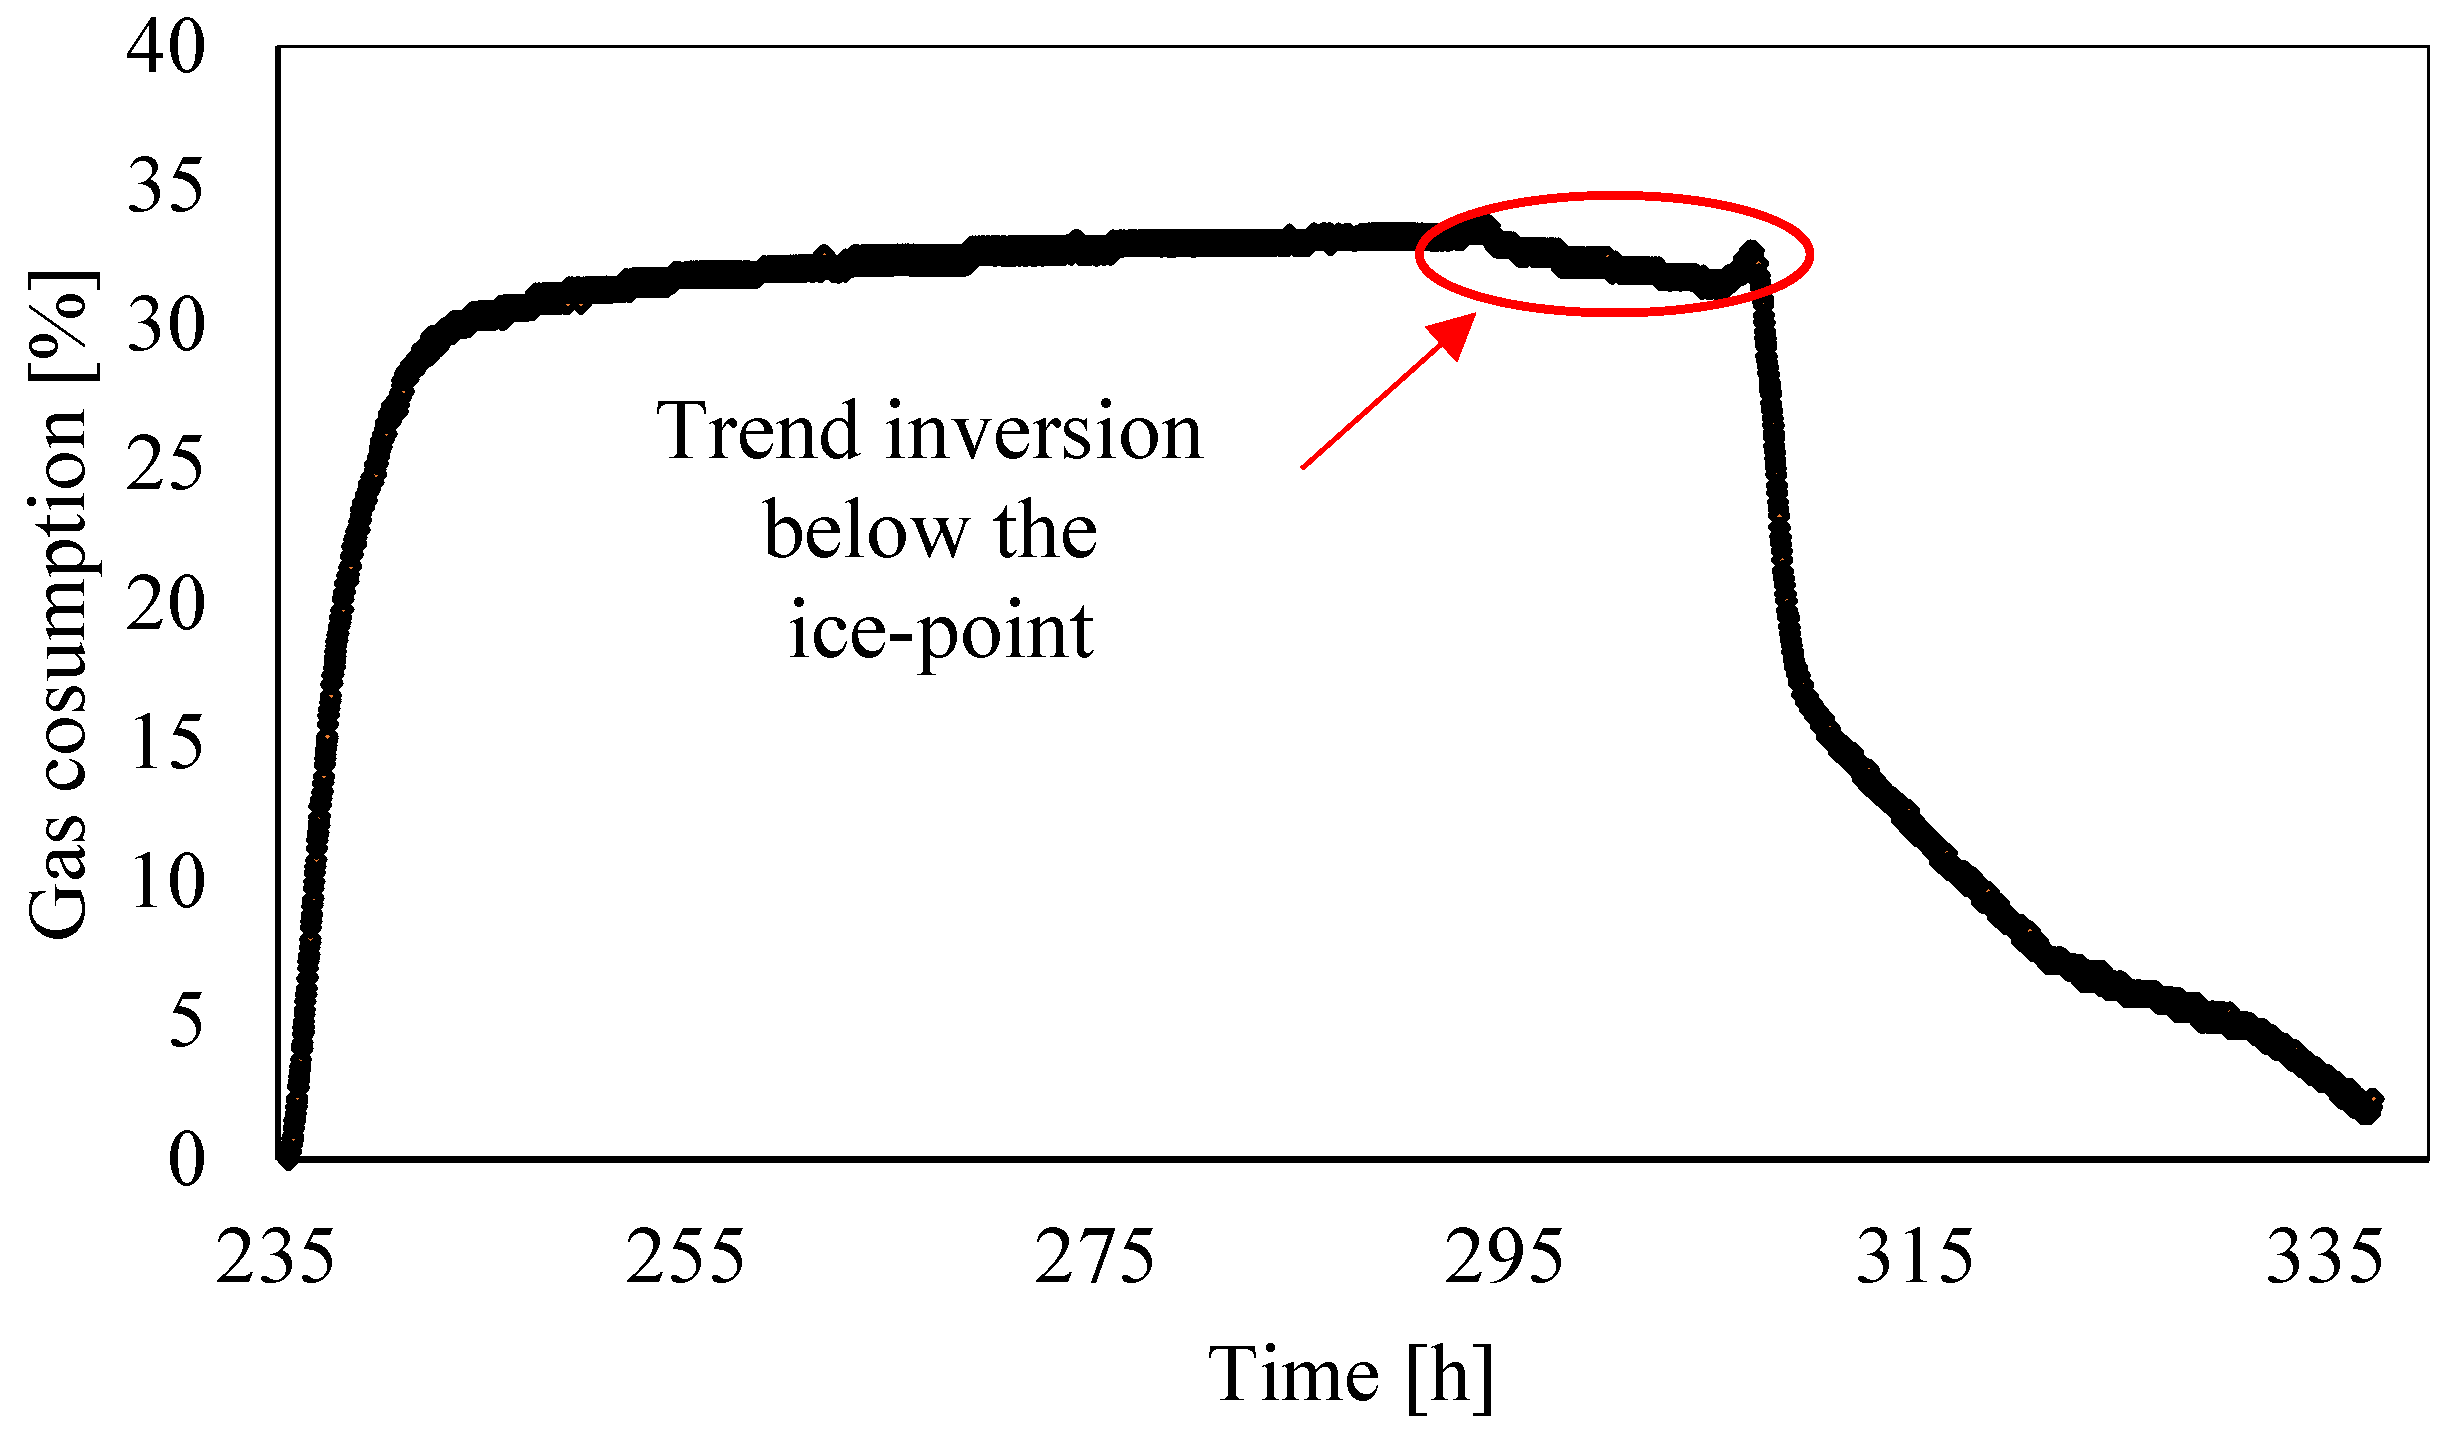
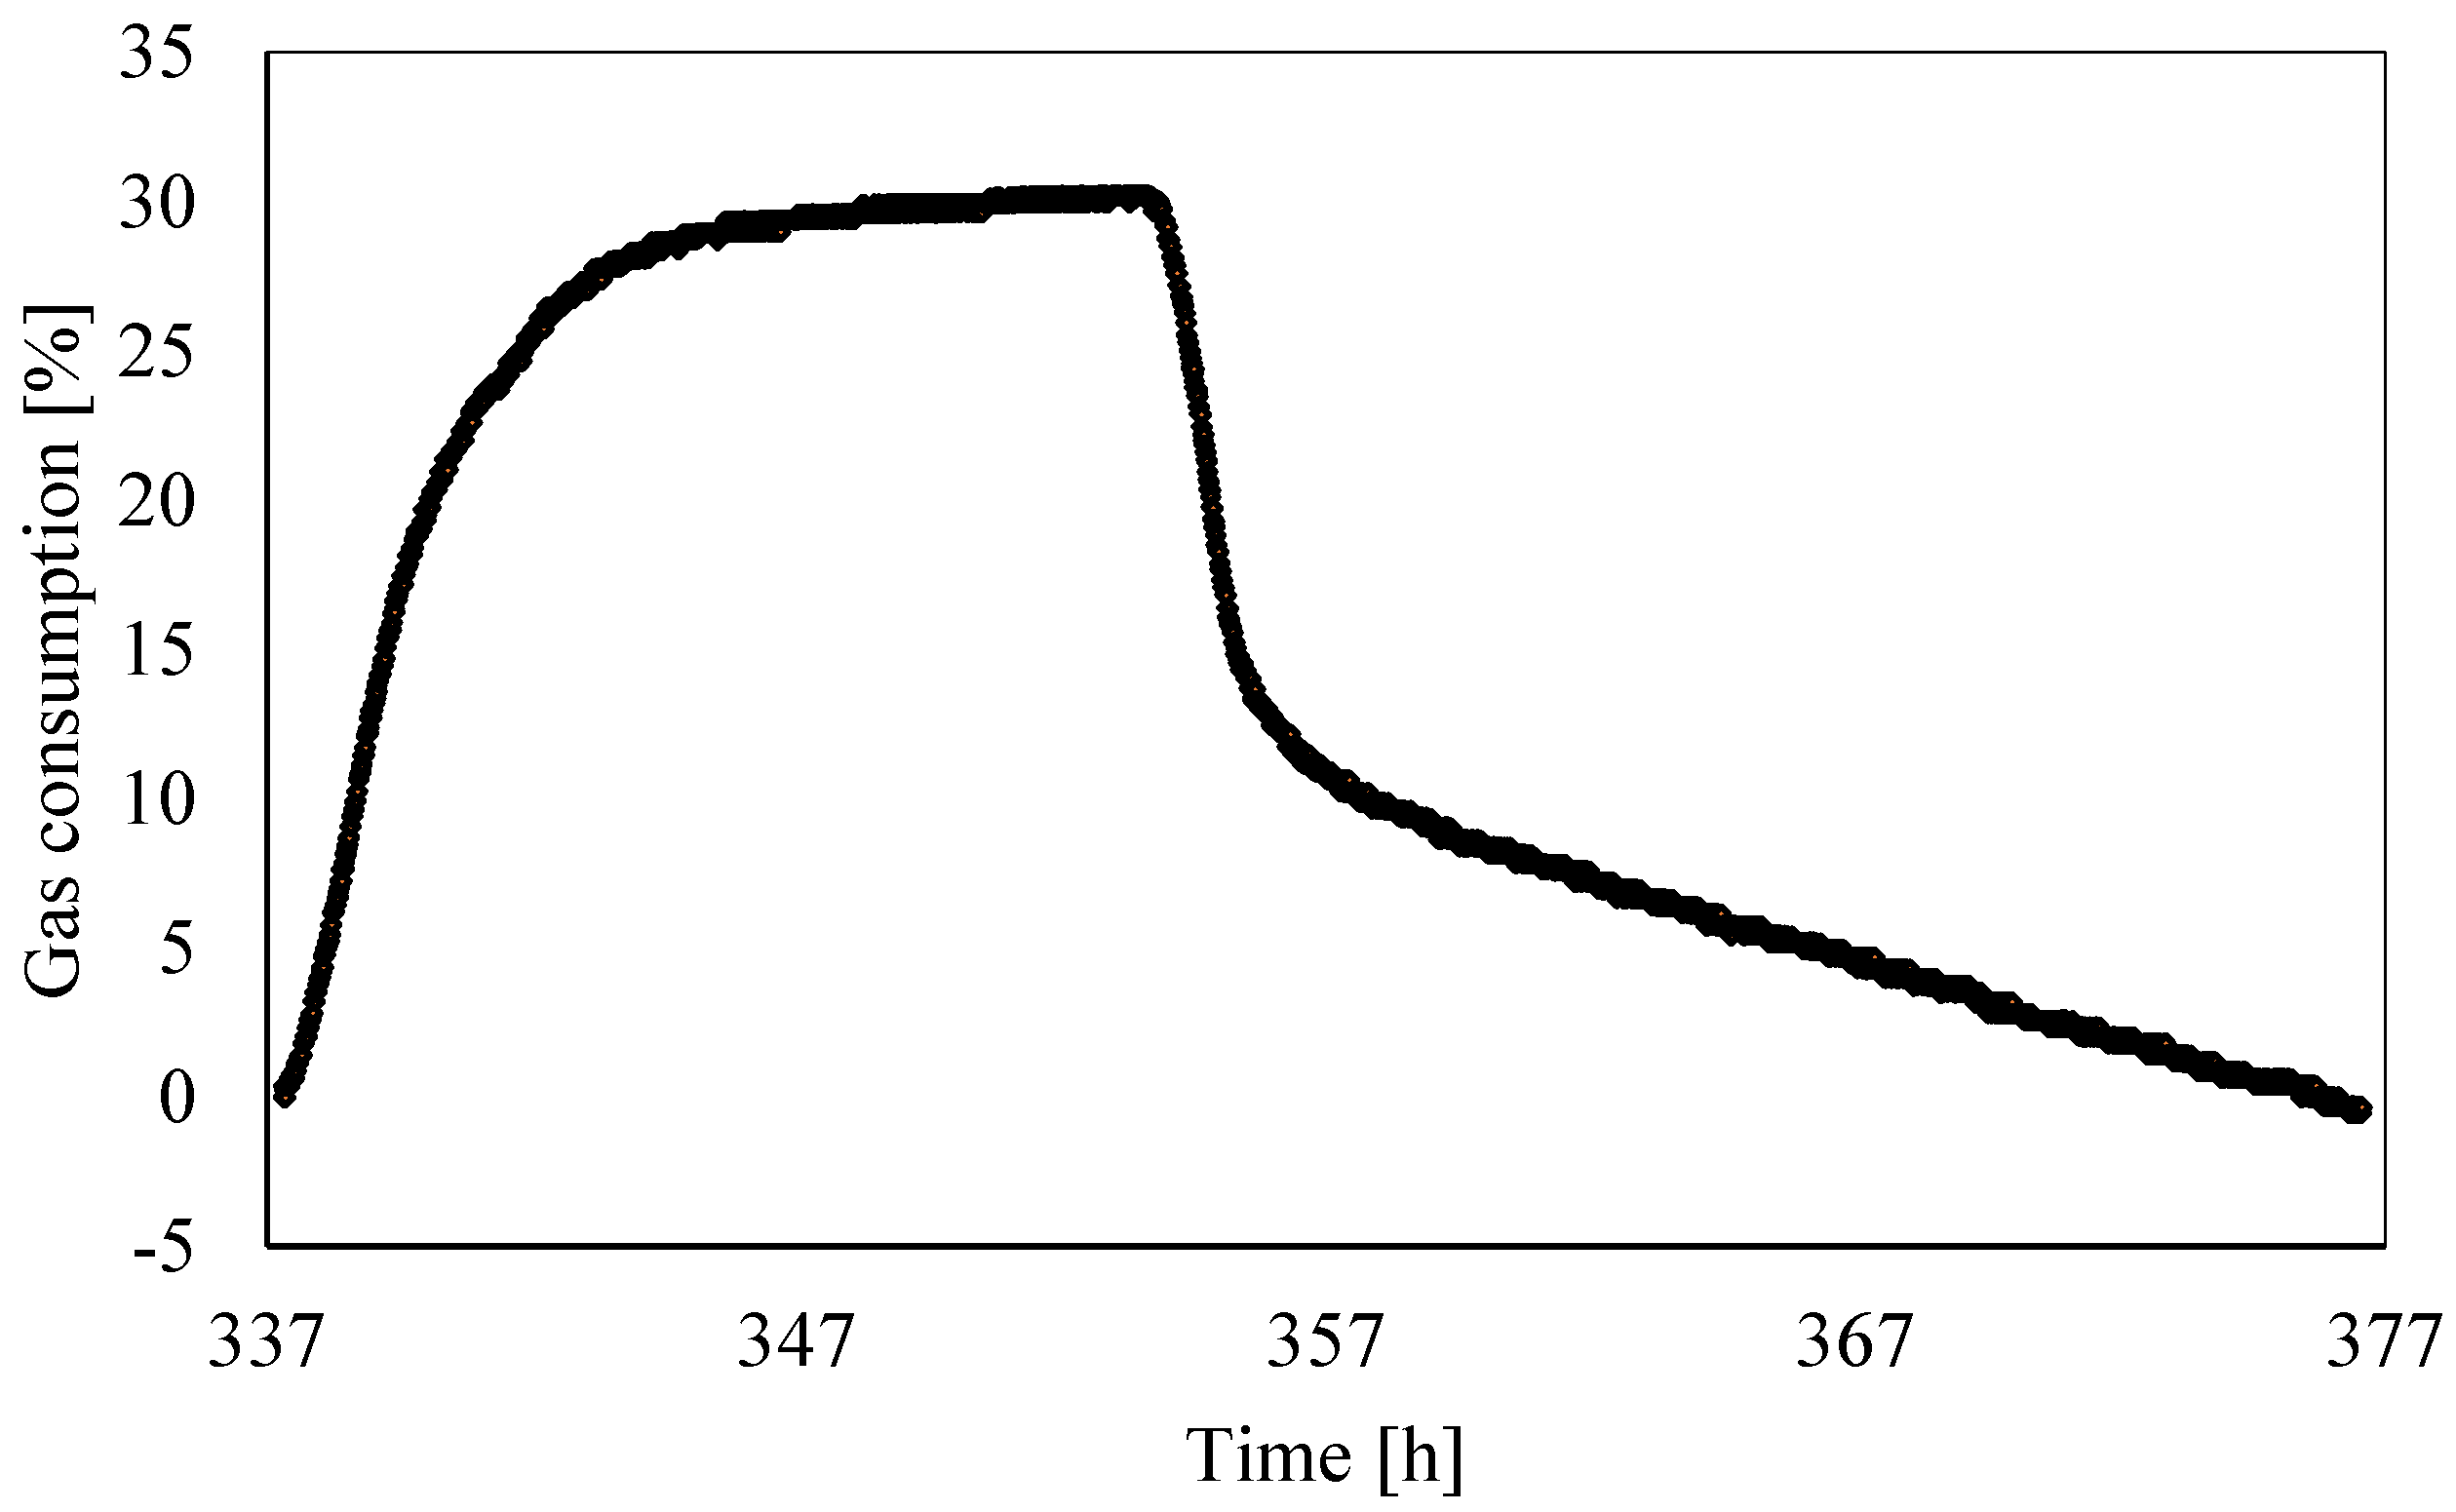
Gas consumption was measured over time and its trend is shown in Figure 11, Figure 12, Figure 13, Figure 14, Figure 15 and Figure 16.
As expected, this parameter strictly followed the pressure trend over time. The highest consumption was measured during the first phases of hydrates formation. Then, it lowered, reached the maximum and stabilized. The following decrease is associated with hydrates dissociation. Once the dissociation finished, this parameter should have been equal to zero. Conversely, this did not occur in Test 1 and Test 2, where some of the carbon dioxide molecules did not turn back into the gaseous phase, and in Test 3 and Test 4, where it reached negative values. In Test 1, approximately 17.2% of the initial quantity of CO2 injected was not released at the end of hydrates dissociation. However, the thermodynamic conditions and the time considered to complete the process impeded the presence of hydrates at this phase. The “lost” quantity corresponded to the amount of carbon dioxide dissolved in water. Test 1 started immediately after gas injection, or as soon the reactor was closed. Consequently, CO2 molecules dissolved in water during Test 1 and Test 2. Only in these two experiments did the gas consumption remain significantly above zero after the complete dissociation of hydrates. Moreover, such a phenomenon decreased with time and, in Test 2, occurred with lower intensity. In tests from 3 to 6, the whole amount of gas captured during hydrates formation was then released during dissociation. The percentage of gas dissolved in water is a function of the temperature and, in particular, a reverse proportionality exists between these two parameters. This explains why in Test 4 the final gas consumption was below zero. The whole quantity of gas involved in the process was released and, in addition, a portion of gas dissolved in water moved again to the gaseous phase. In Test 3, the dissociation temperature was moved for the first time up to 26 °C, while in the previous experiments it was limited to approximately 20 °C; even higher values were reached in Test 4 (≈28 °C). These higher temperatures led to the migration of some CO2 molecules dissolved in water to the gaseous phase. Such a quantity moved the gas consumption below zero and can be quantified with this parameter. Finally, in the last two experiments, the final temperature was not varied and remained approximately equal to zero. As a consequence, the quantity of carbon dioxide dissolved in water remained stable and the parameter GU only measured the amount of gas involved in the hydrates formation/dissociation process. For that reason, it started from zero and approached the same value at the end of the dissociation phase.
This parameter assumed a dual behavior as a function of temperature, in particular, in the presence of temperatures above or below the ice-point.
In some tests, the gas consumption also increased at temperatures below 0 °C, while in other tests, for instance in Test 3 and in Test 5, it lowered, even if the thermodynamic conditions were extreme inside the hydrate stability zone. Additionally, in experiments where GU continued to decrease, the pressure gradient lowered significantly. Considering the time lapse, during which the temperature remained below the ice-point, this means that the ice formation competes with hydrates. Figure 11, Figure 12, Figure 13, Figure 14, Figure 15 and Figure 16 proved that when the temperature reached the ice-point, hydrates formation had already occurred abundantly; consequently, ice and hydrates competed in the small amount of free space that remained and only a very contained amount of gas was involved in this competition. However, in Test 3 and in Test 5, ice formation led to a partial release of gas and a consequent reduction in parameter GU. Further analyses will be performed to understand if the gas released in this phase belonged to the amount trapped into hydrates, to the amount dissolved in water, or both of them. As soon as the temperature started increasing again (it was regulated from the external) and approached 0 °C, the pressure decreased again, with a trend similar to that observed during the initial phase of hydrates formation. The higher temperature made hydrates formation more probable than ice formation and a higher quantity was trapped in the unit of time, if compared with that observed at temperatures lower than 0 °C. Finally, the dissociation phase started, and the gas consumption dropped until the process ended. This brief analysis allowed us to assert that above 0 °C, hydrates formation is obviously predominant, while at a lower temperature, it has to compete with ice-formation. Such information has already been proved and discussed in the literature. However, these experiments proved that the competition between these two compounds is a function of temperature and, when the system is close to 0 °C, hydrates formation prevails.

3.3. Analysis of Formation and Dissociation Rate Constant

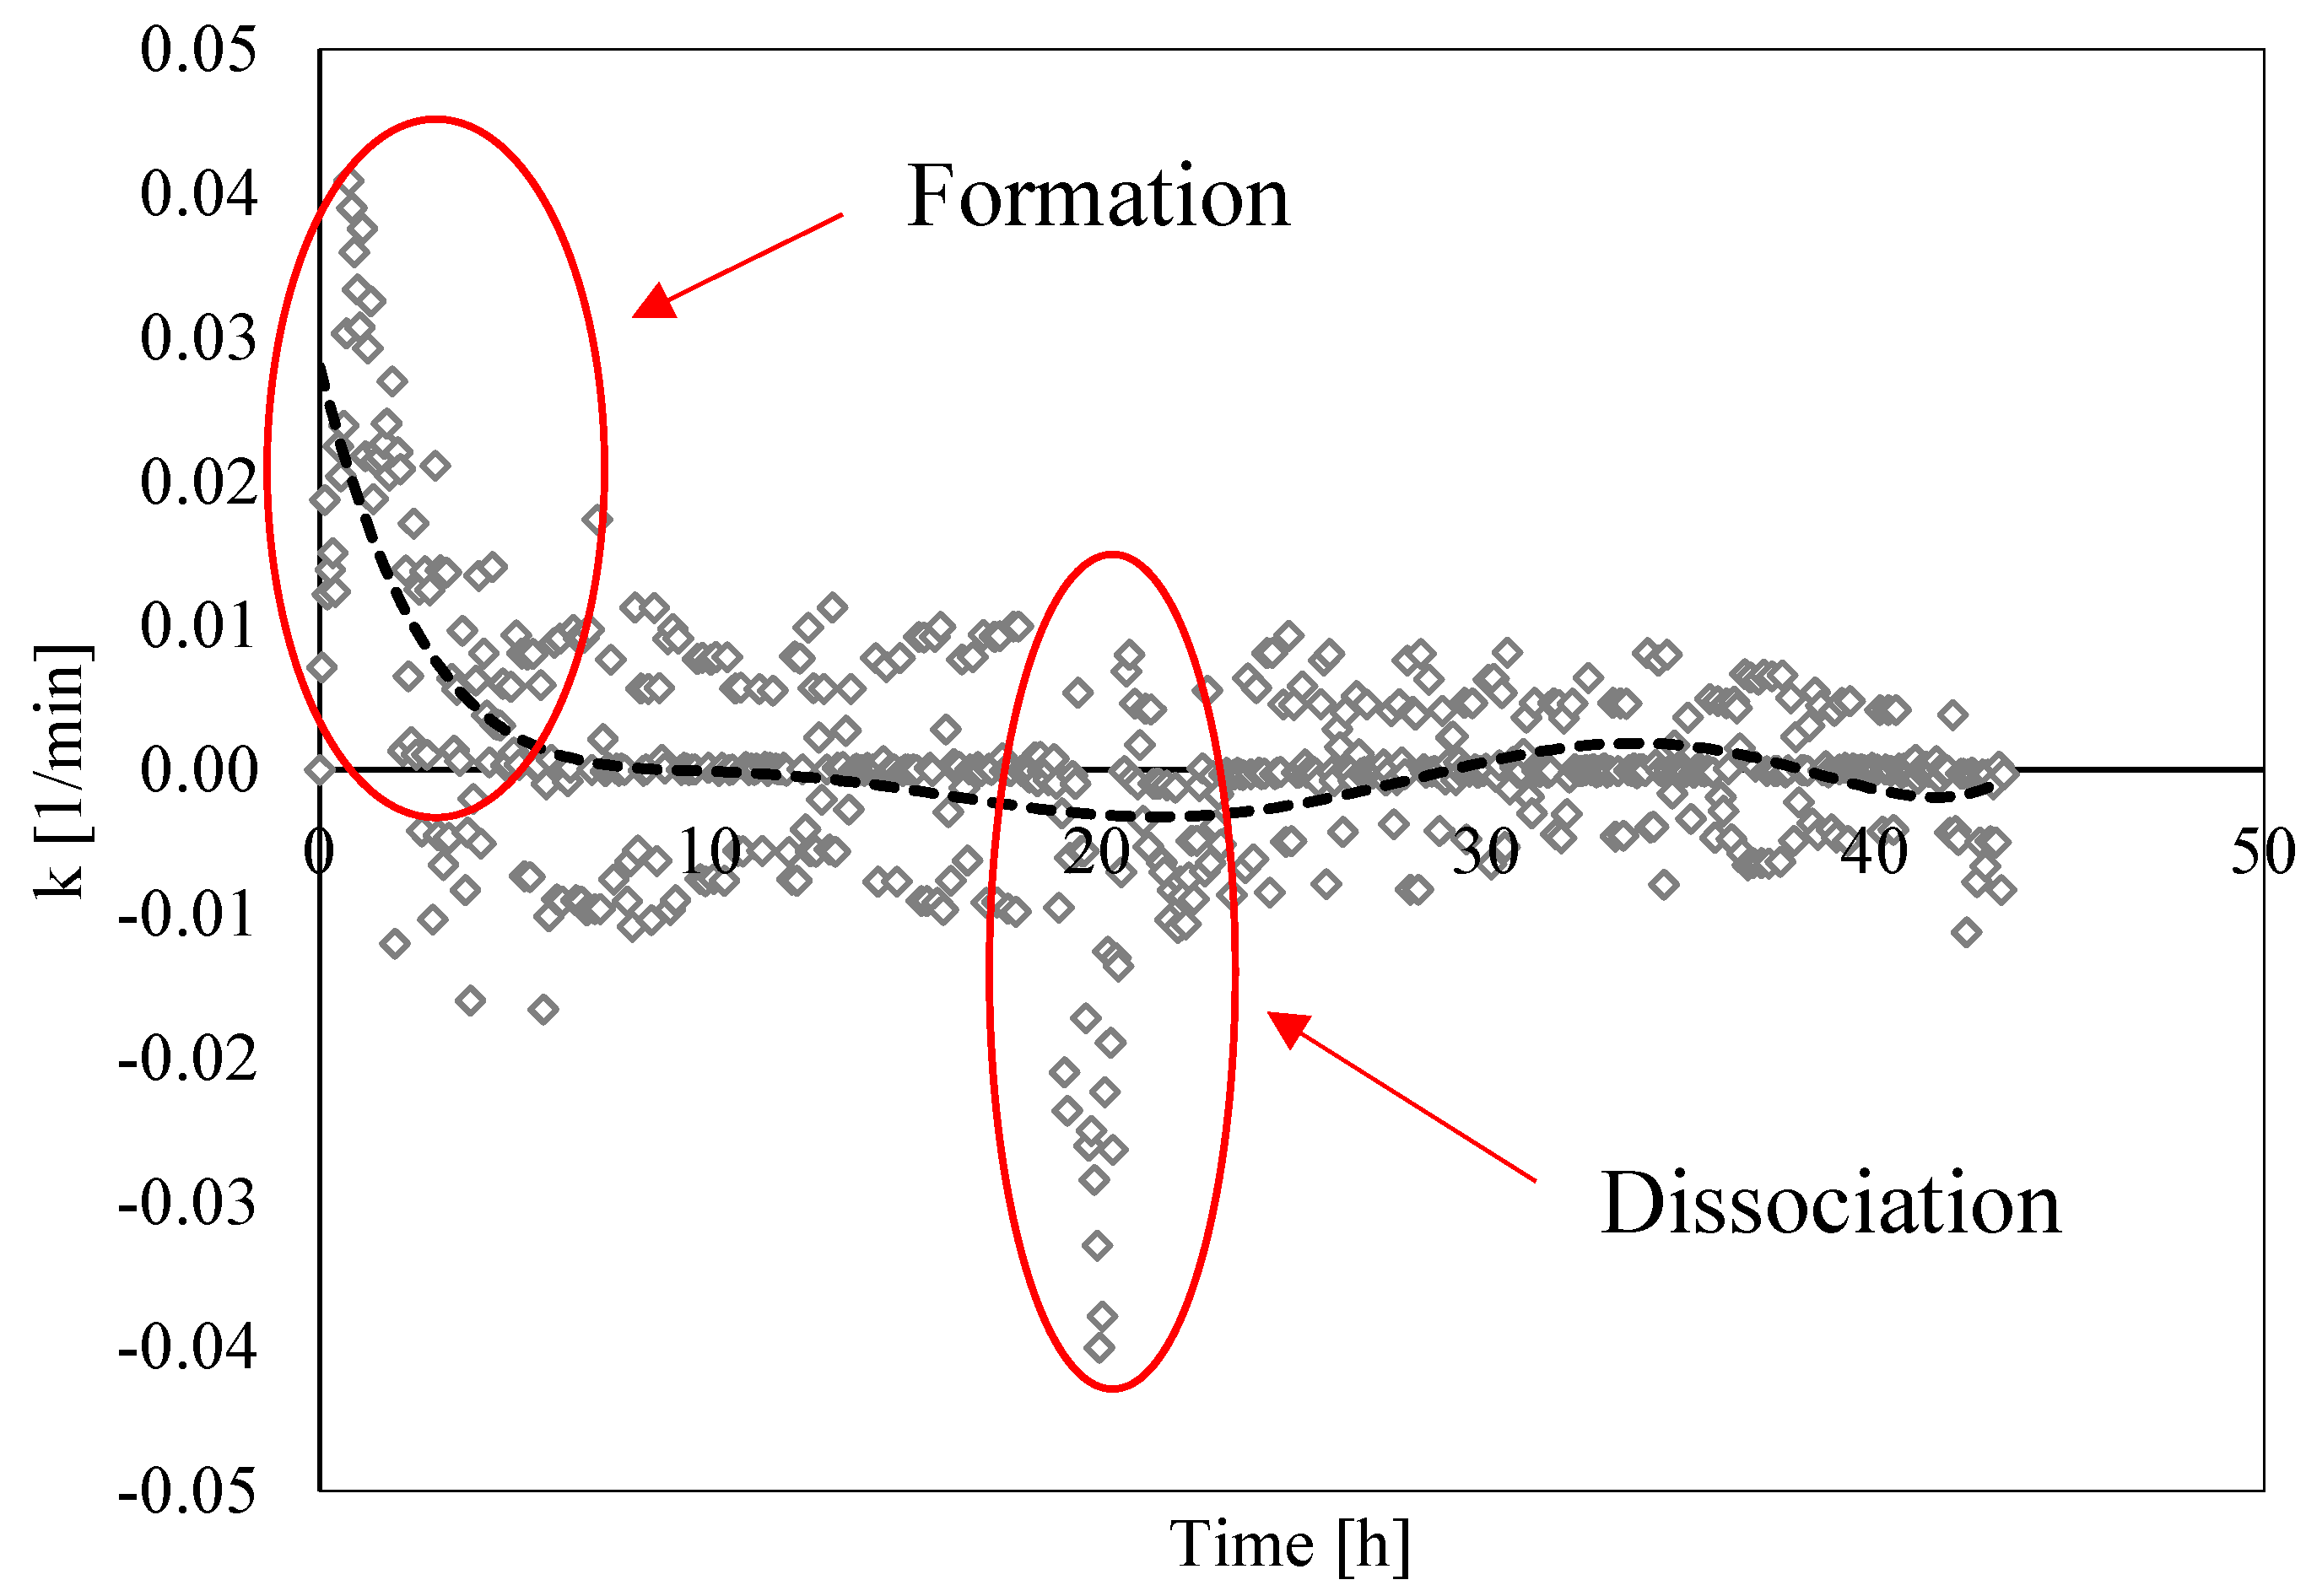
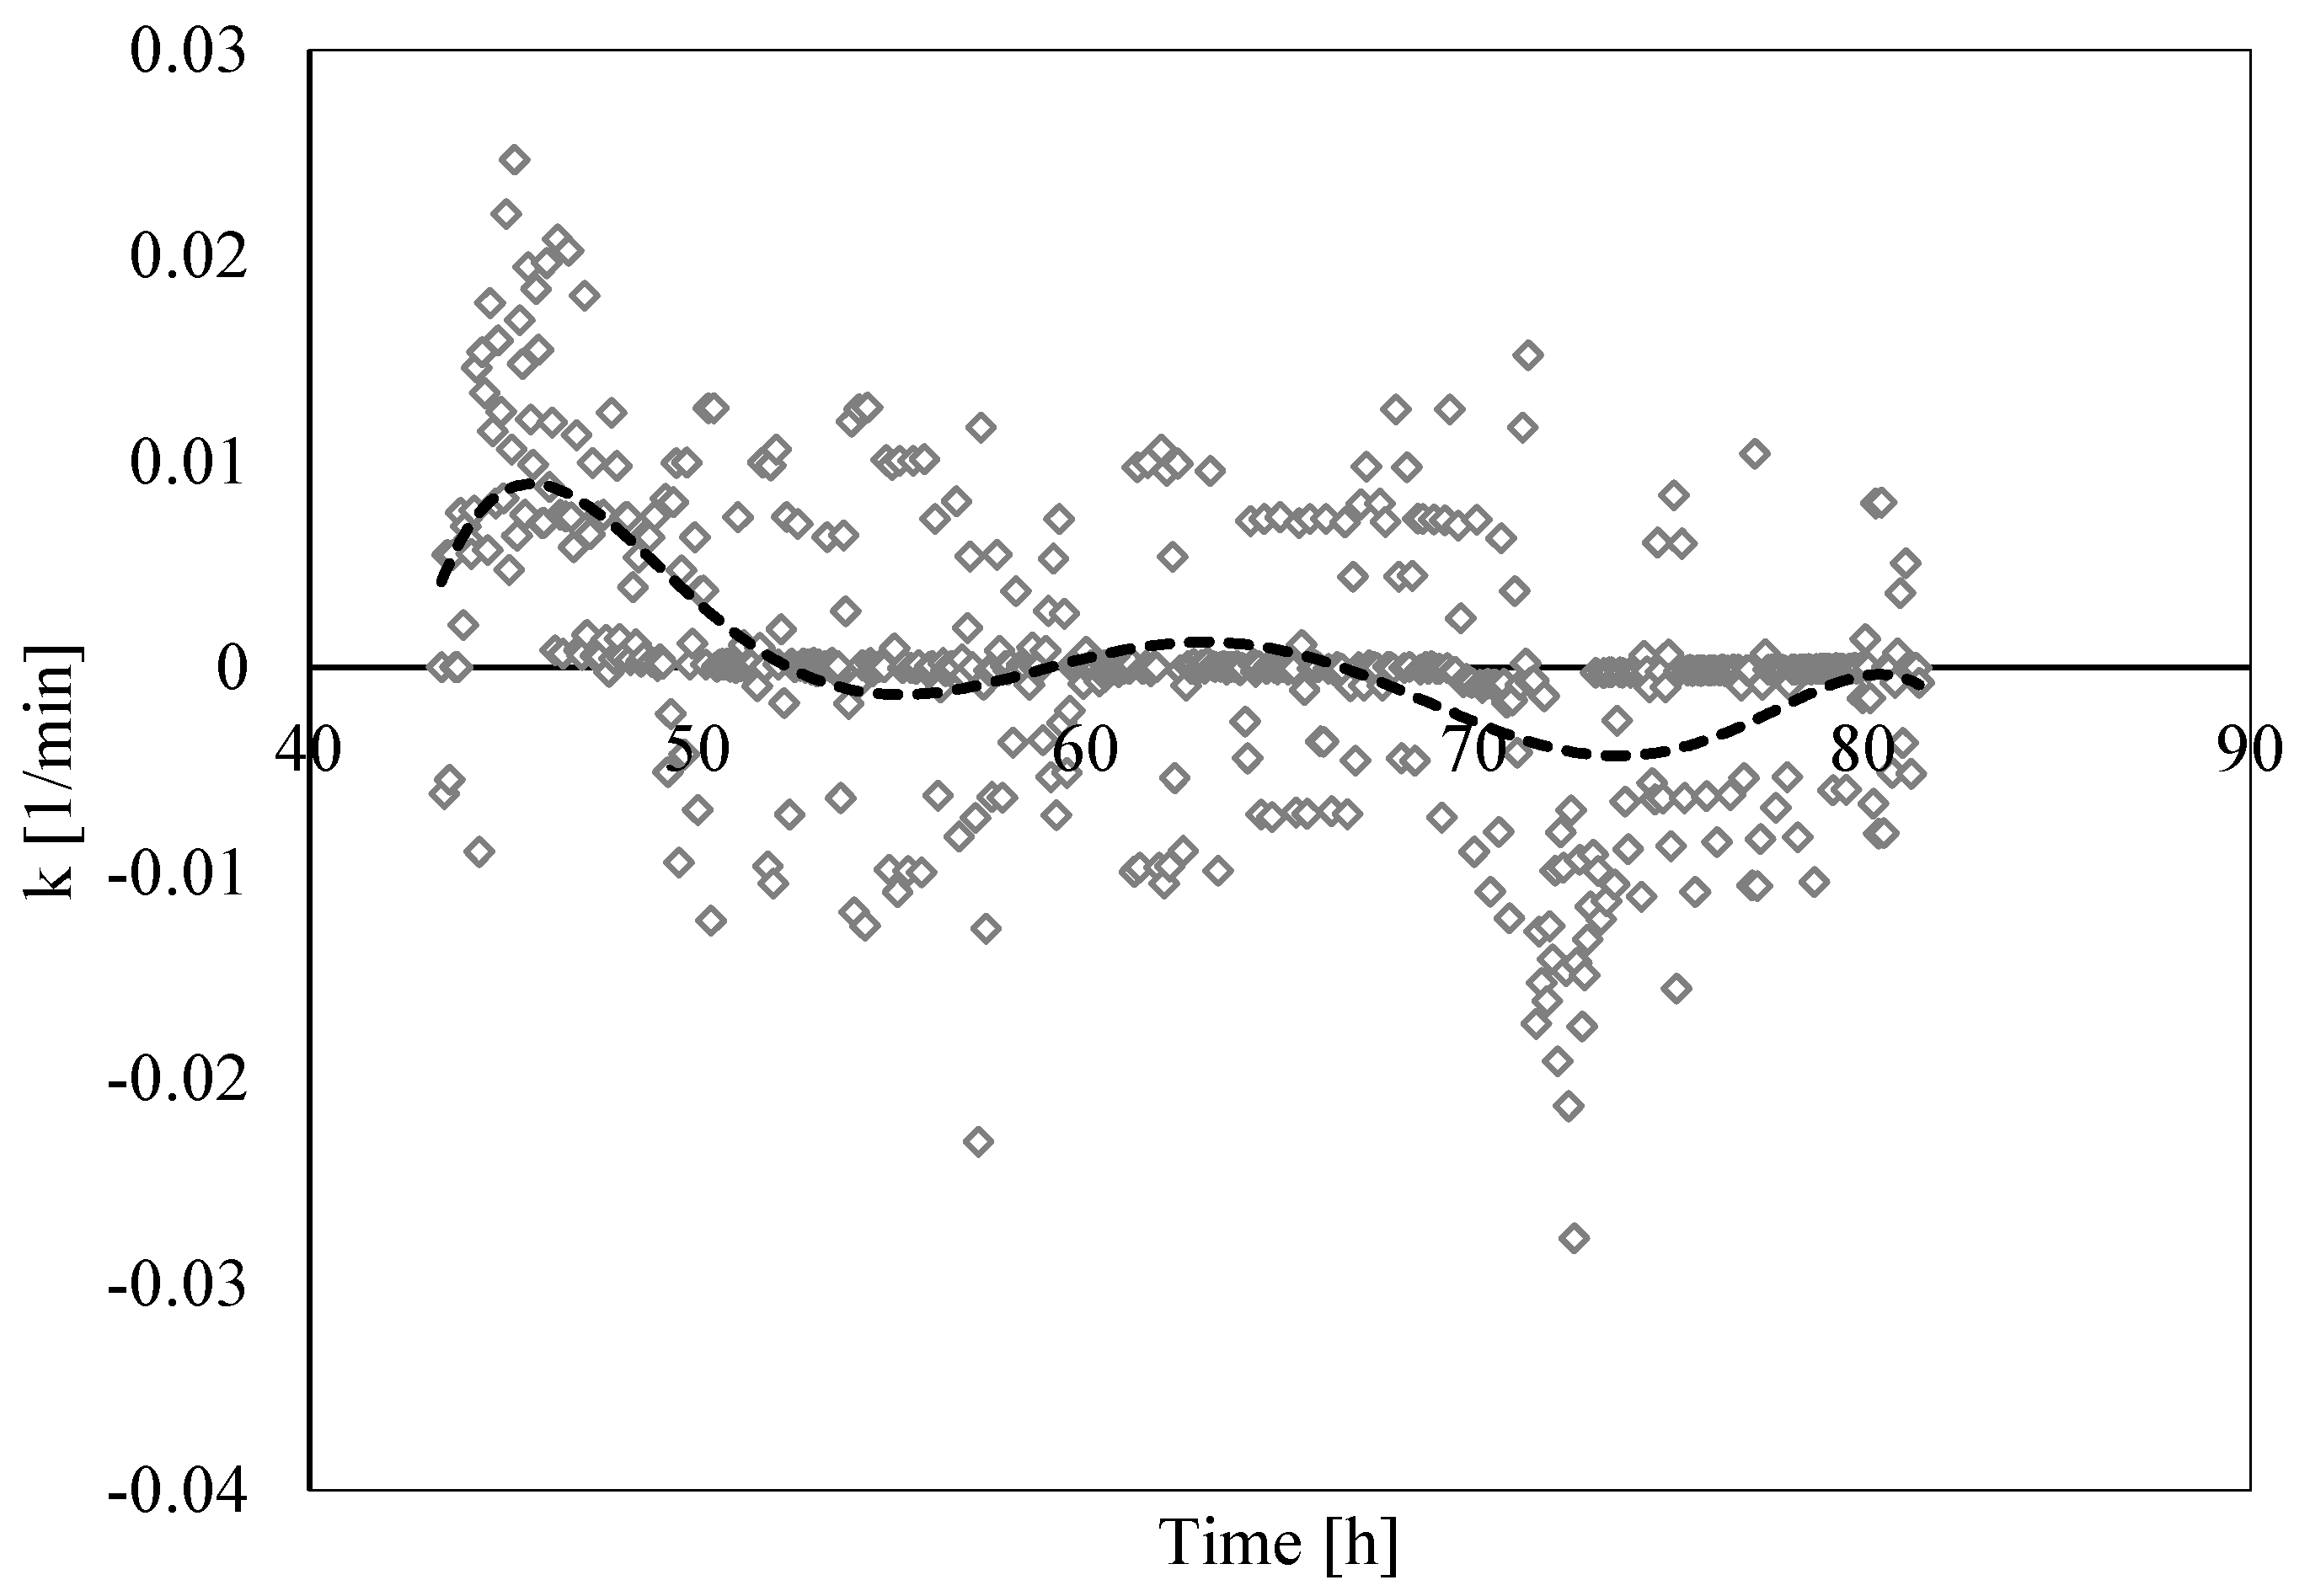
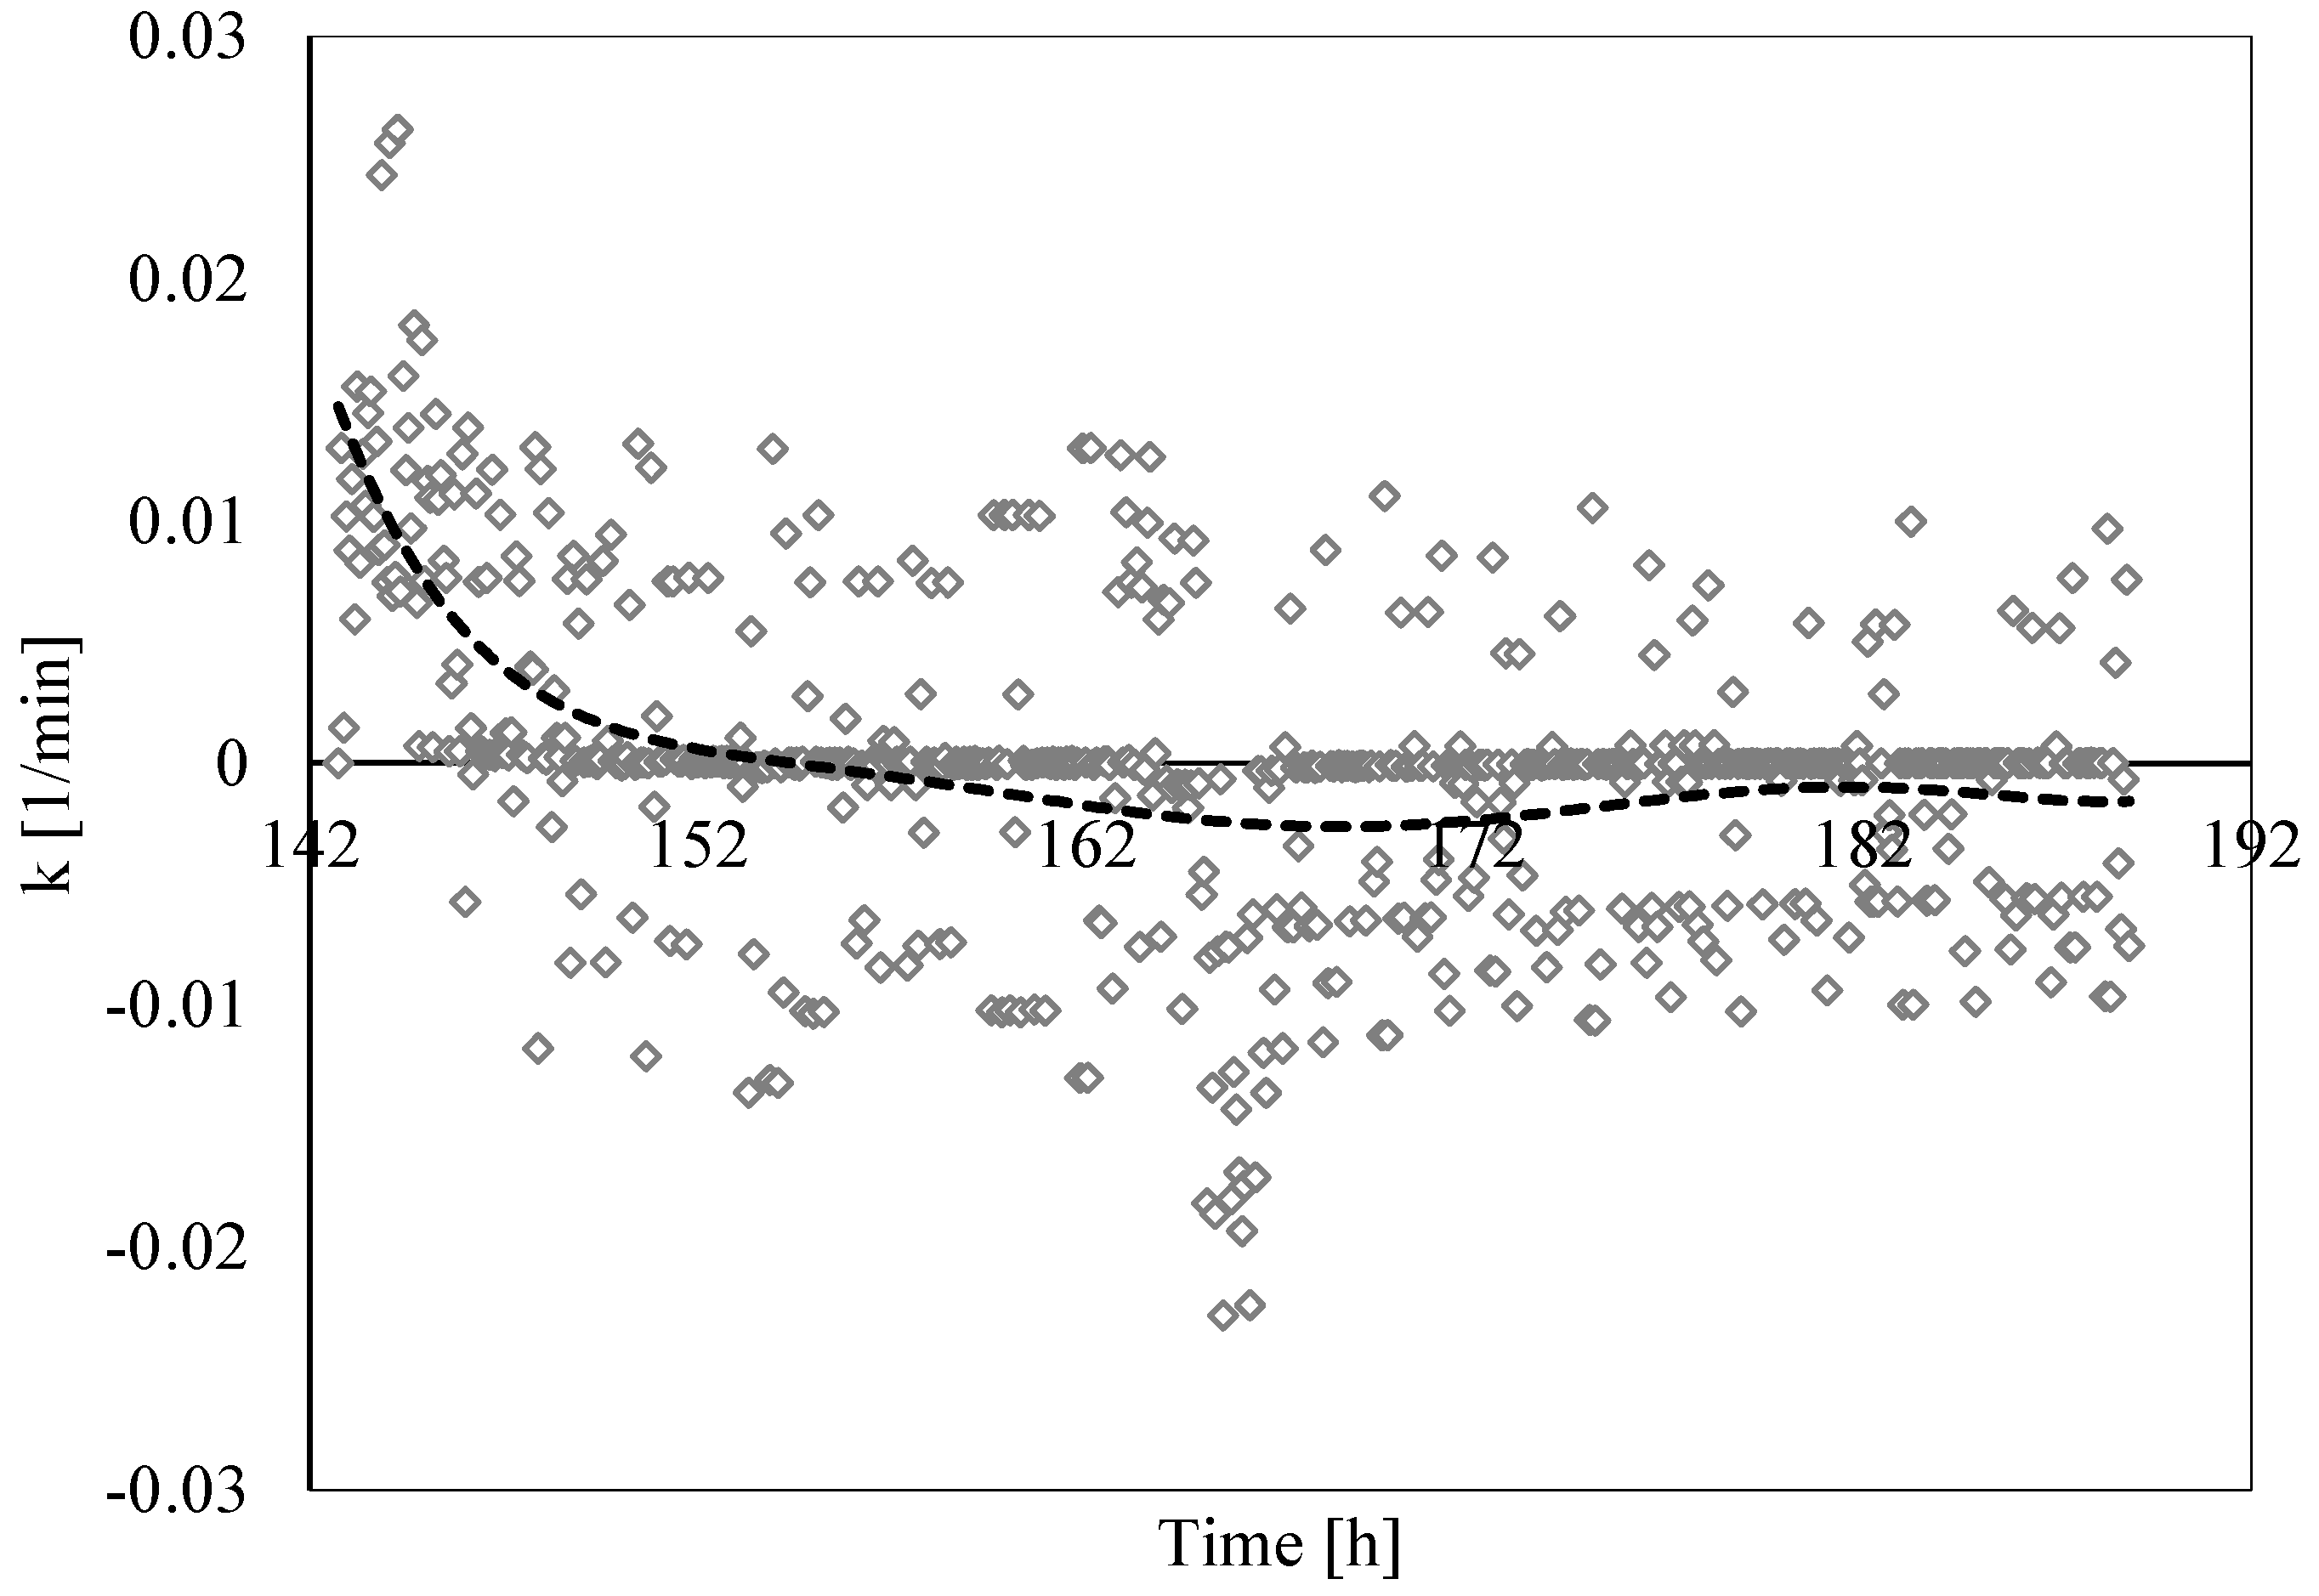
This paragraph analyses the formation/dissociation rate constant measured during the experiments and shows its trend over time. While the time axis is in hours (as in previous diagrams), parameter “k” has been calculated in minutes (min−1). The unit was chosen according to the information present in the literature: we opted to use the same unit in order to improve the comparability of the results with the material already present in the literature.
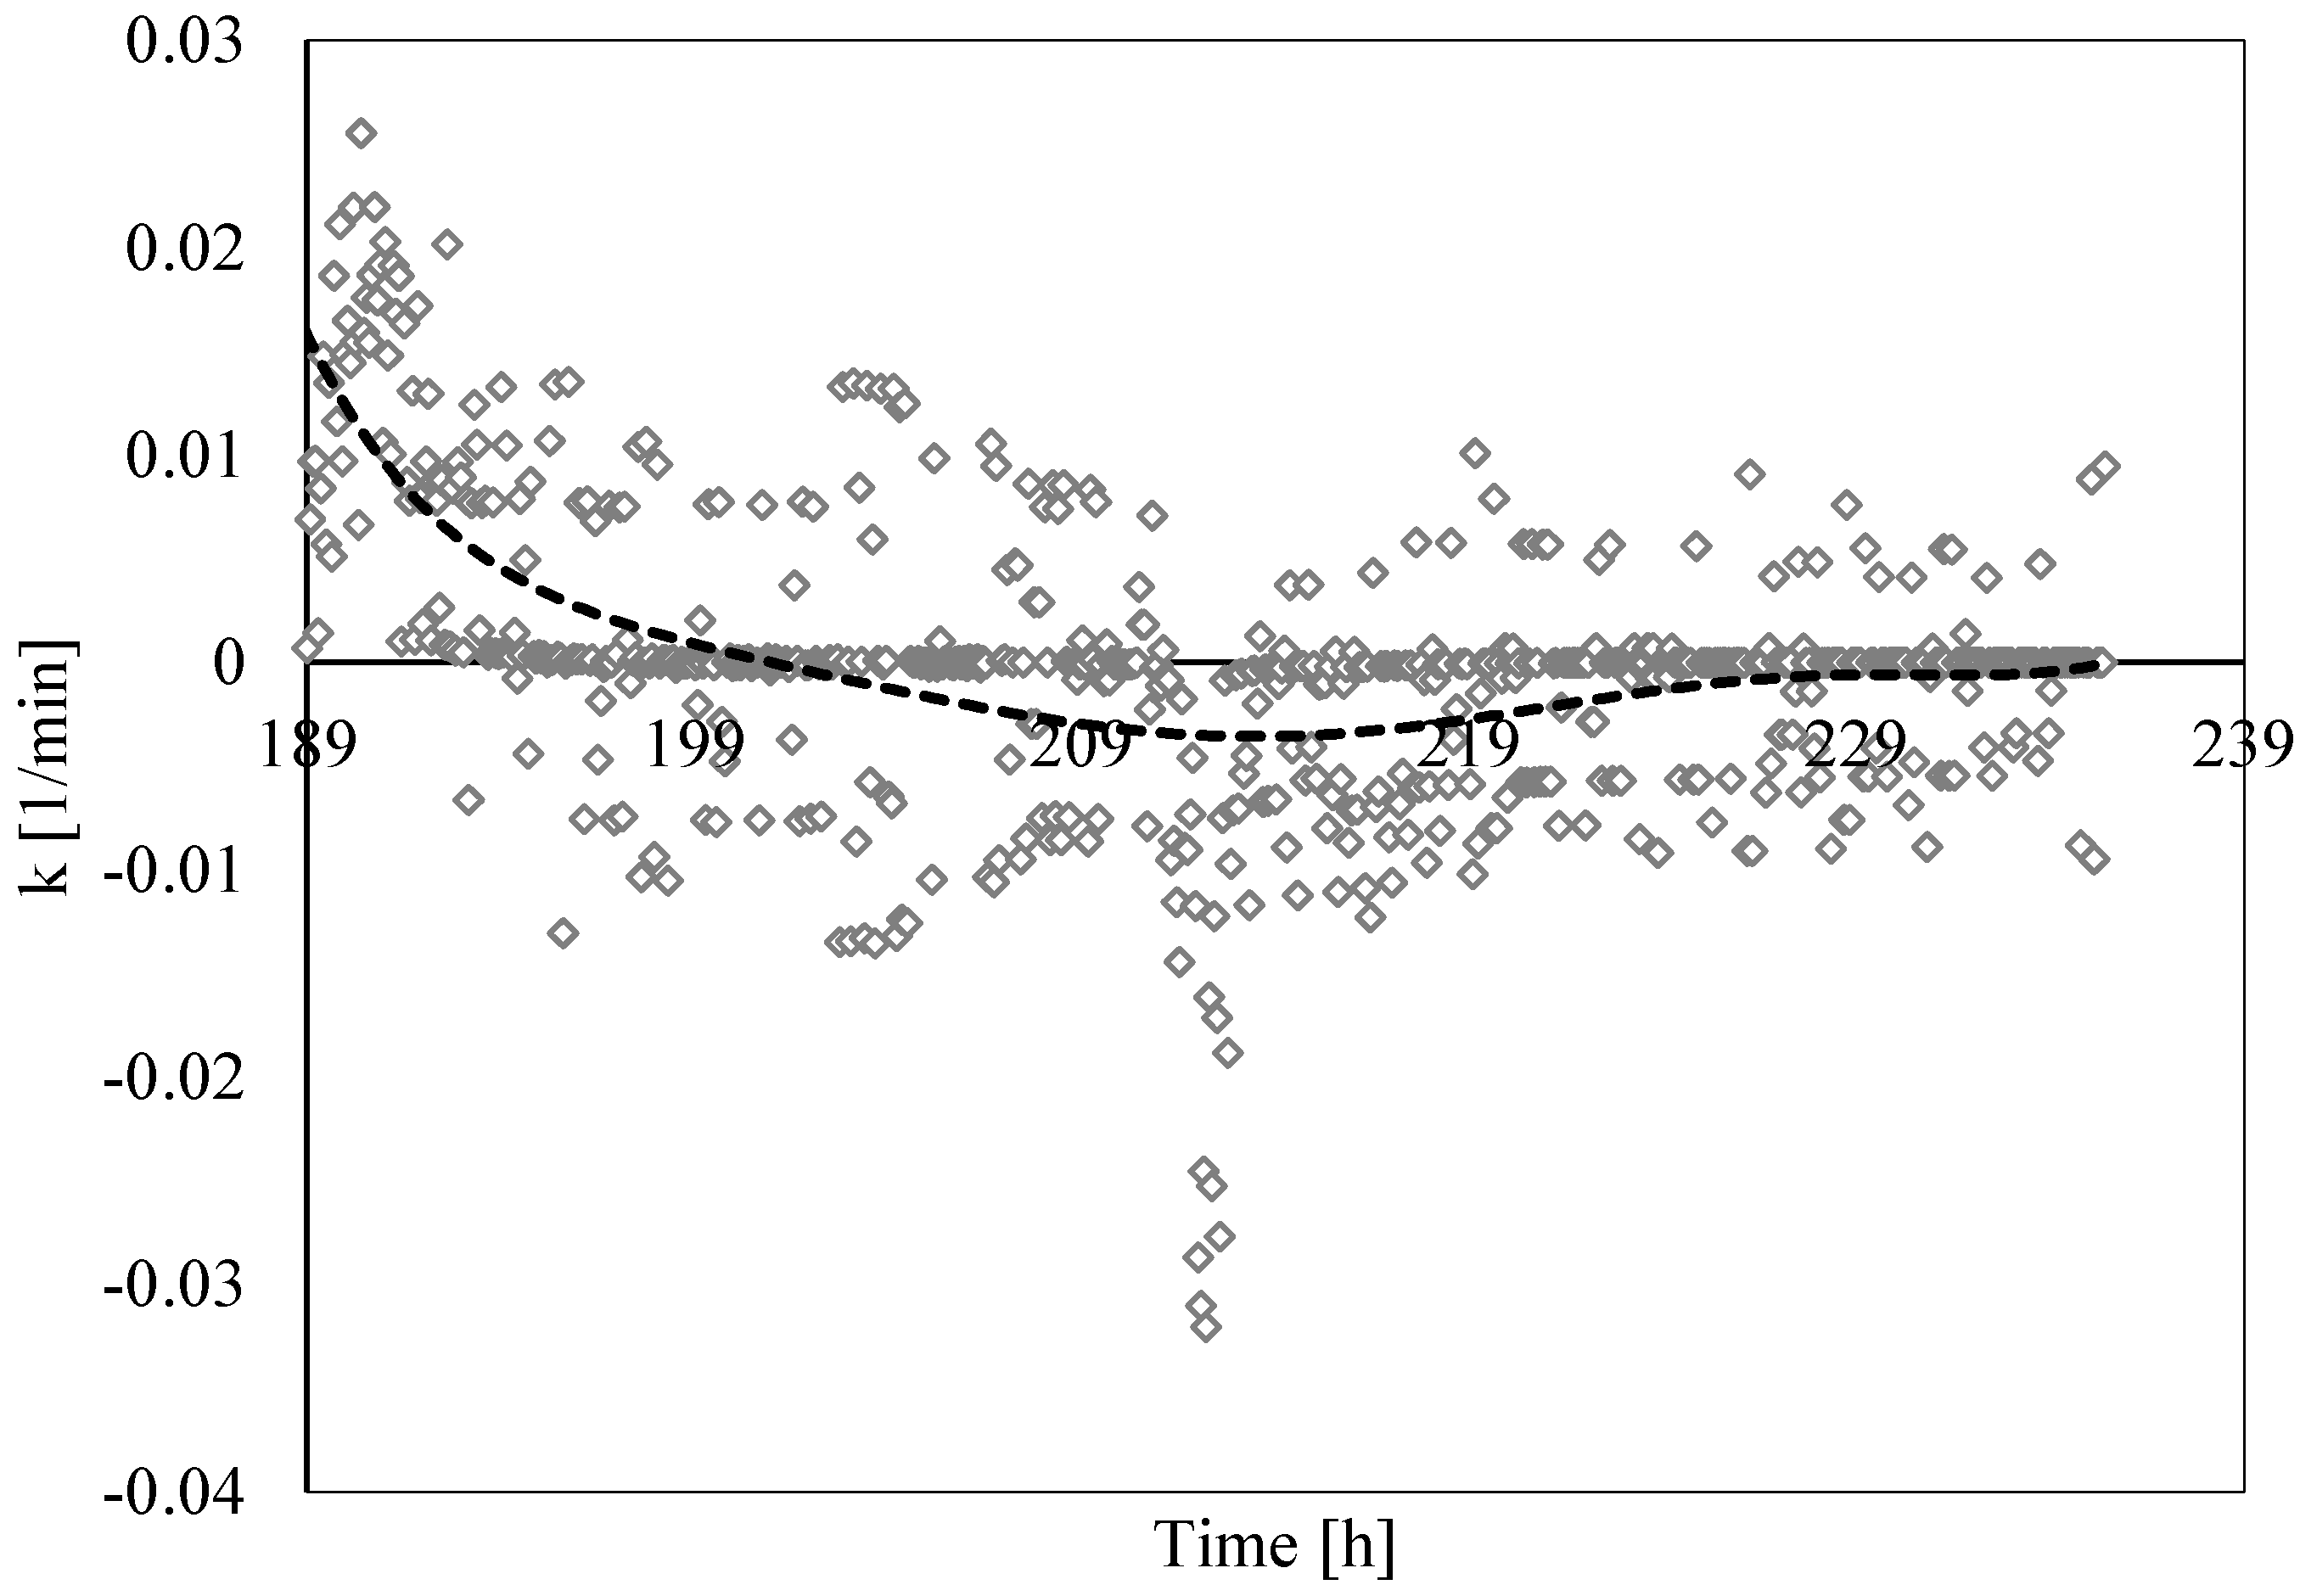
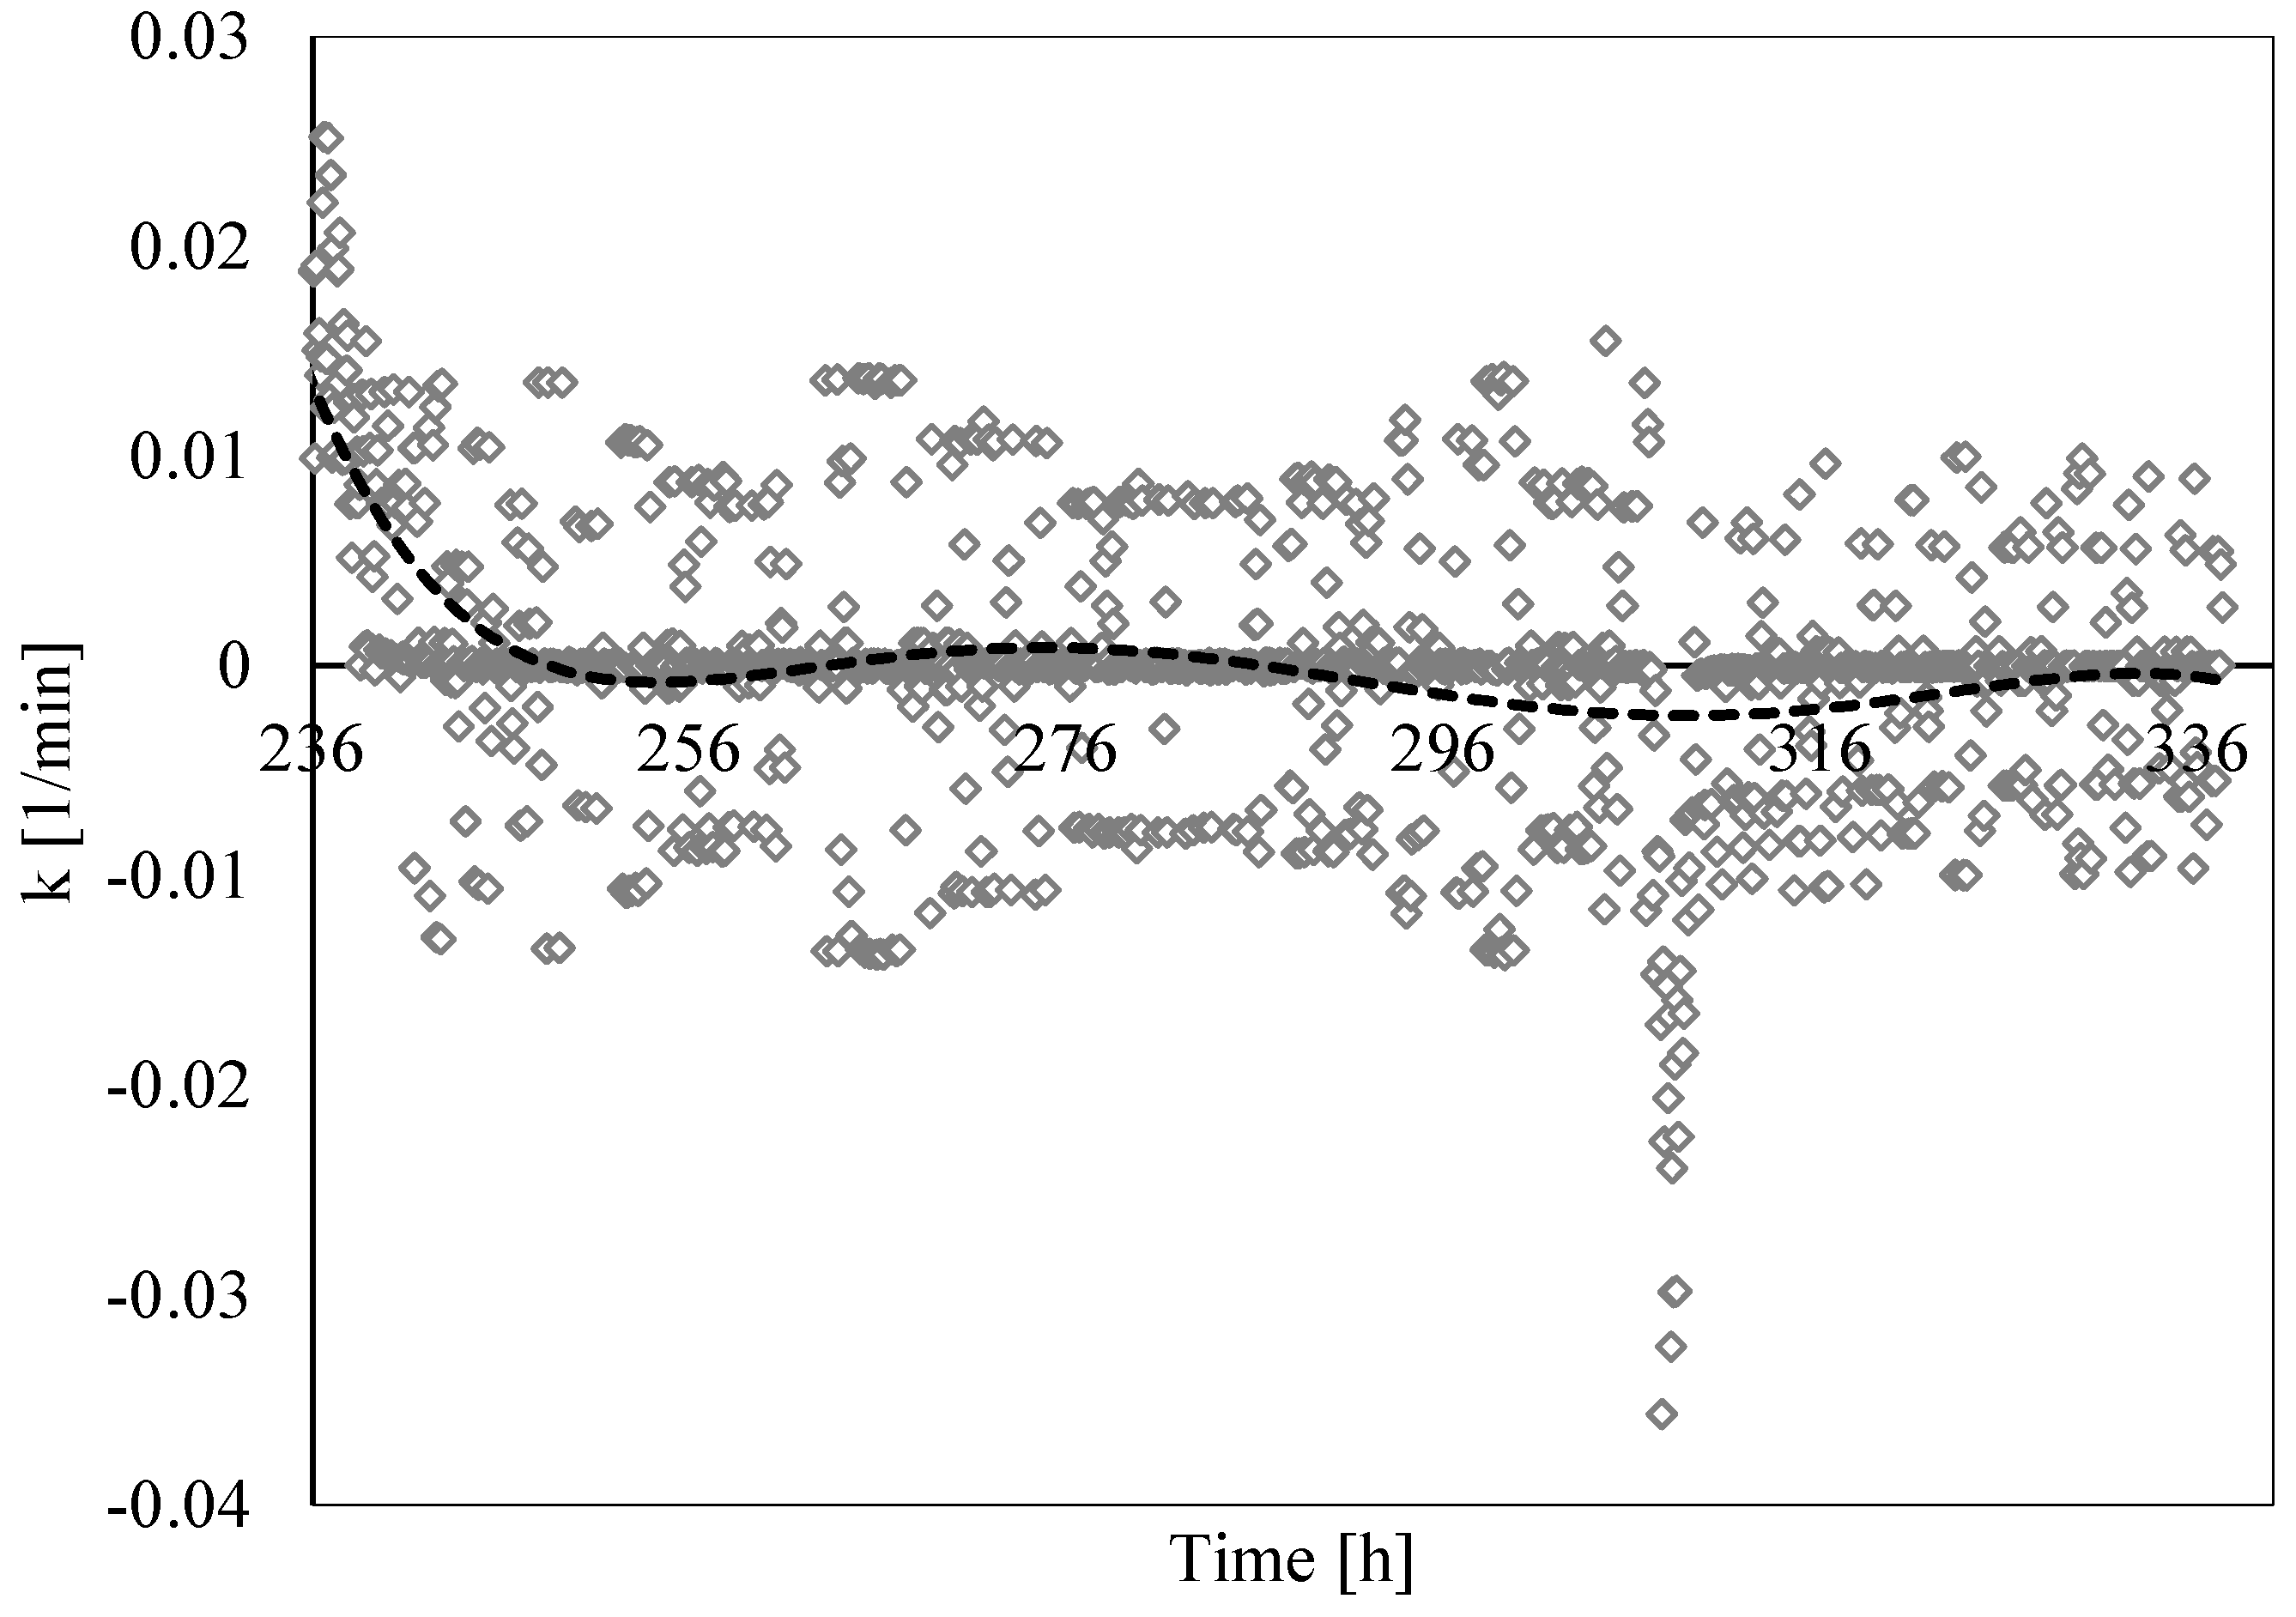
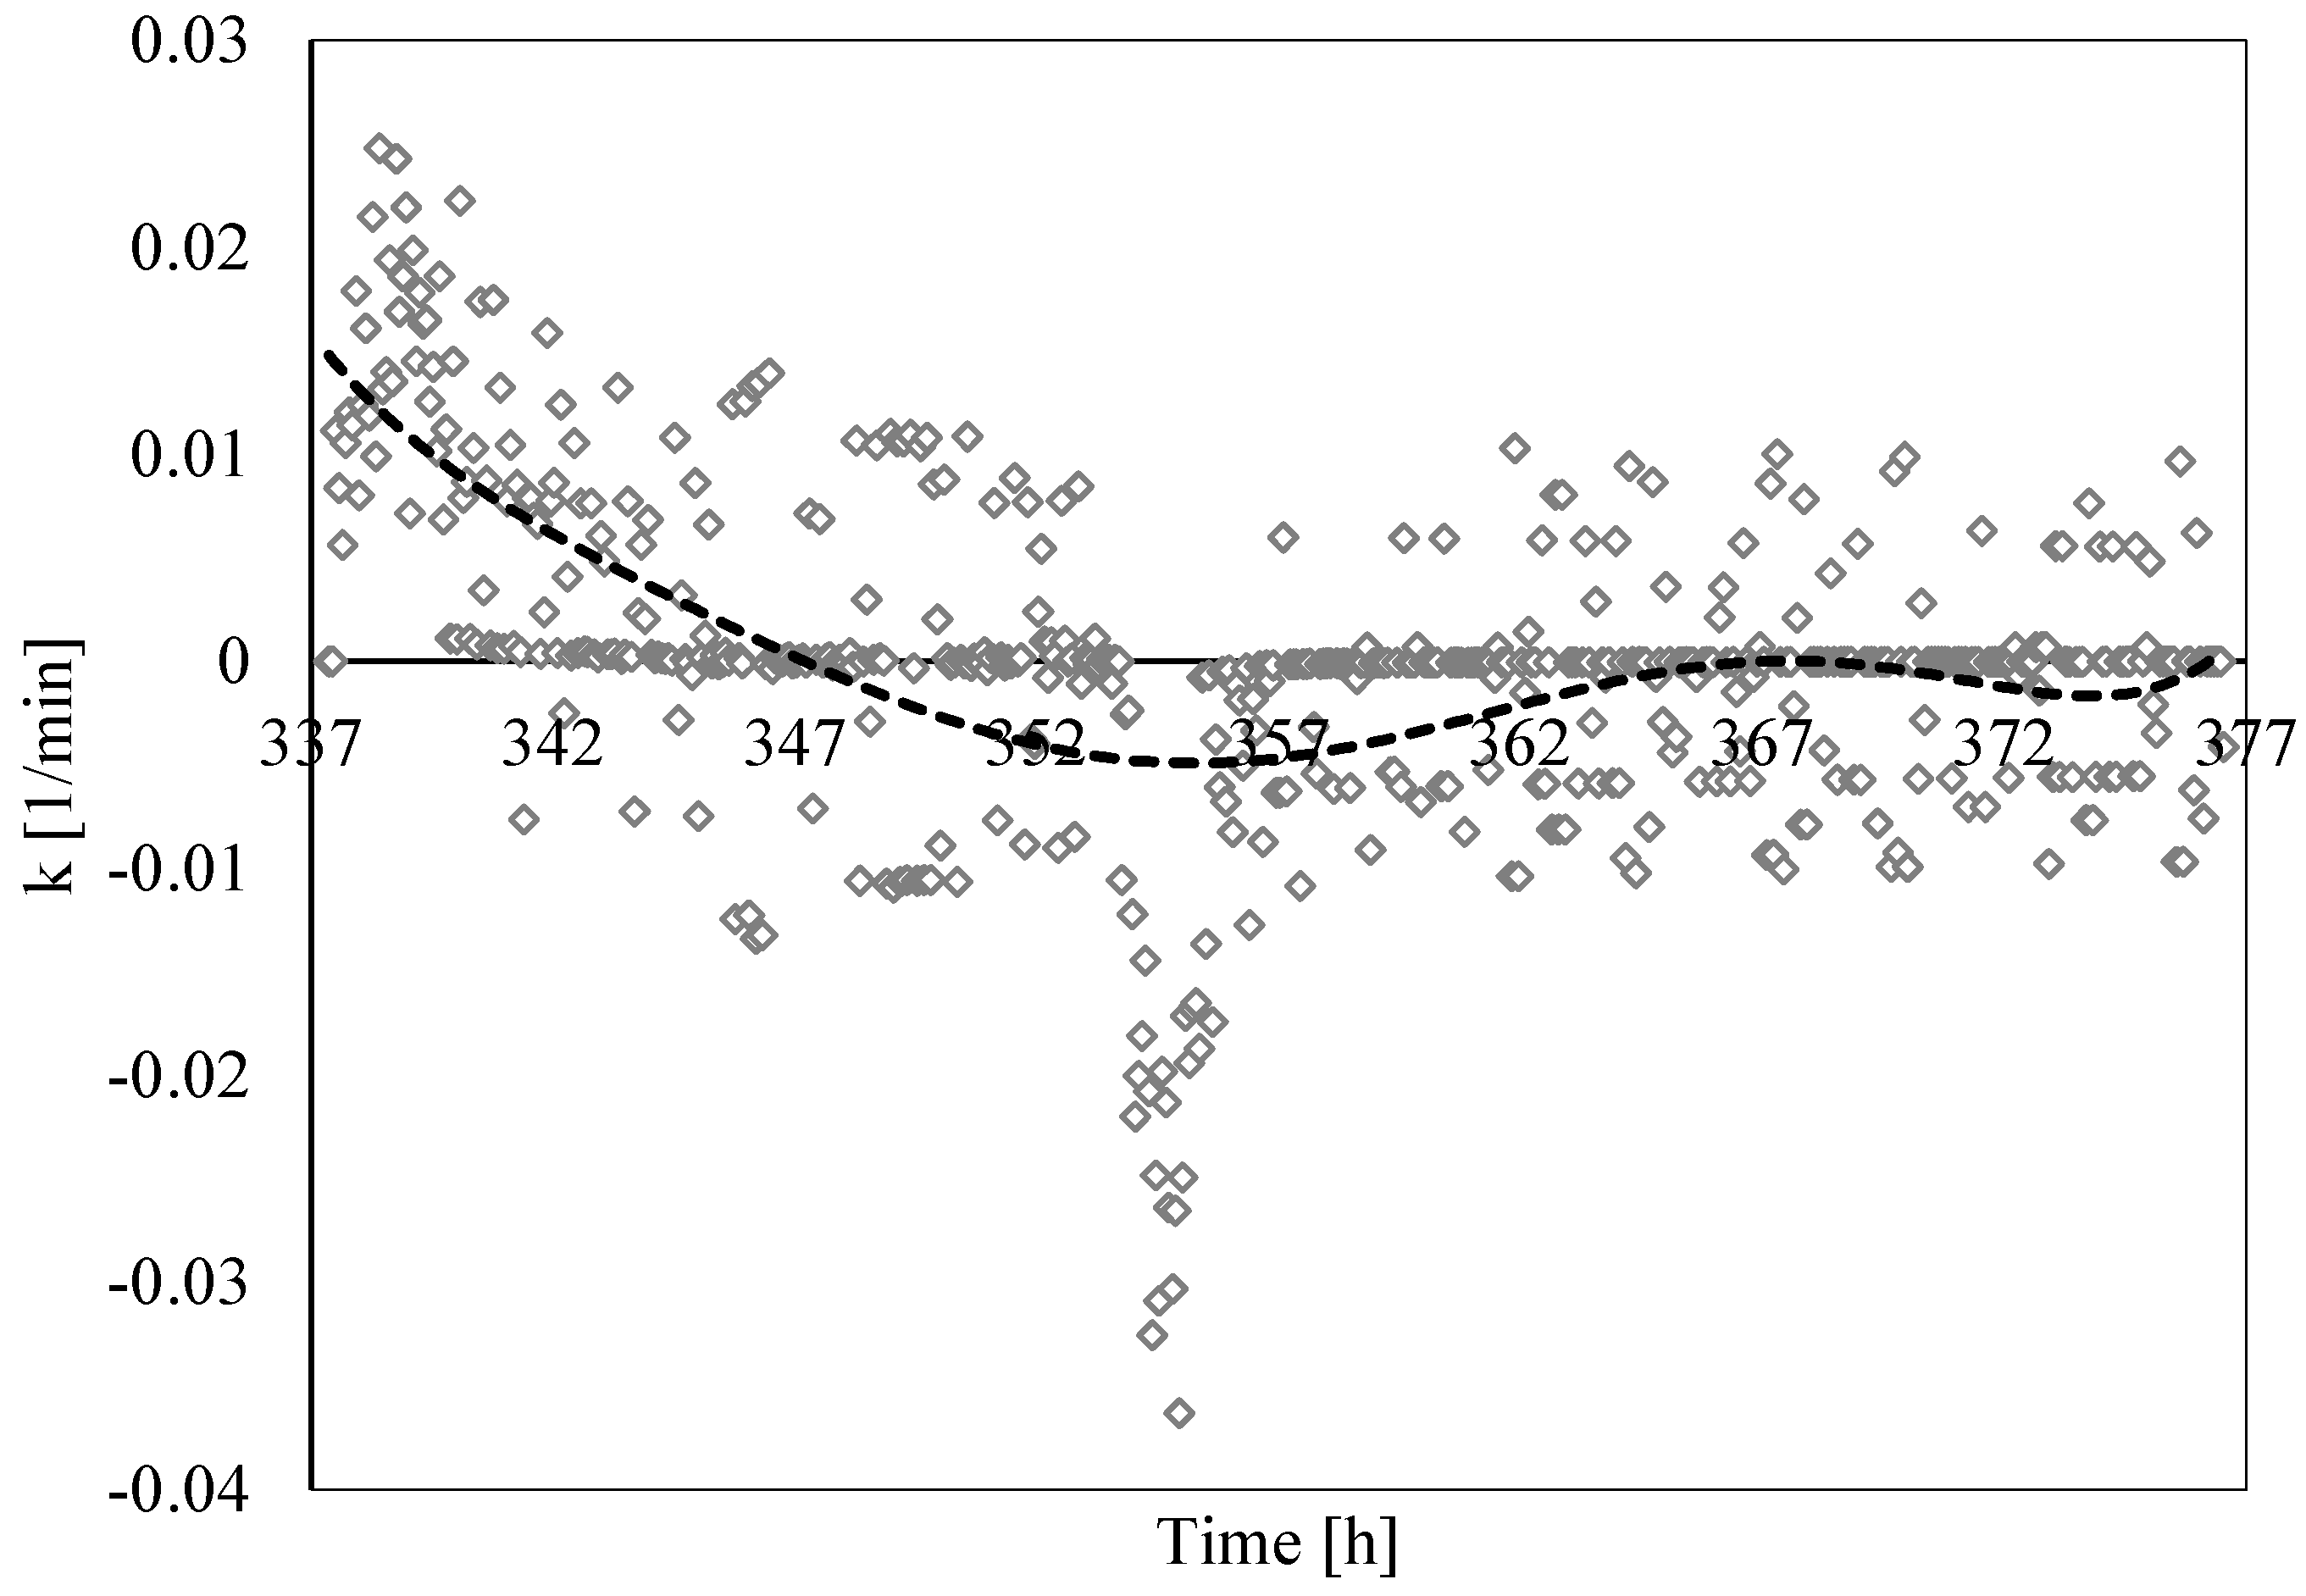
The following Figure 17, Figure 18, Figure 19, Figure 20, Figure 21 and Figure 22 show the rate constant trend over time observed during each experiment.
In all experiments, the rate constant alternated positive and negative values, proving that hydrates contemporarily formed and dissociated. Such behavior was observed during the whole of the experiments, or both during hydrates formation and dissociation, but with different intensity. During the formation process, hydrates mainly formed, while the contrary happened during the following dissociation phase. The overall trend was shown with a tendency line, which provided a clear idea about how the process worked. The alternate trend shown by parameter “k” strongly agrees with the Labile Cluster Theory. Such a theory describes in detail the formation mechanism of the first hydrates nuclei and is consequently mainly related to the initial nucleation phase. However, the presence of thermodynamic conditions particularly close to the equilibrium phase boundary and the continuous variation of them by varying temperature from the external led to a continuous generation/destruction of labile clusters and hydrates nuclei, thus making the LCT extendible to the whole process. According to this theory, the process begins with free gas molecules, which absorb the guest molecules and firstly form labile clusters for then generating the first unstable 512 structures. These compounds can dissociate again into free water and gas molecules or continue their growth via collision and aggregation with surrounding structures. When the cages share their vertices, small sI units are formed, while small sII units are formed when cages share their faces. Once again, these more complex structures may dissociate or continue their growth via aggregation. The process continues in this way until the nuclei reach the so-called critical size. The stepped trend of parameter “k” exactly described such a contemporary formation and dissociation of hydrate structures.
Theoretically, the surface between the tendency line and the time axis should be equal above and below such an axis. Even if a strong similarity between these two surfaces was found in all experiments, only in Test 5 and in Test 6 did it effectively occur. On the other hand, a small difference was noted; this was related to the variations in the quantity of carbon dioxide dissolved in water.
In all tests, the formation phase appeared as a more gradual and lower process compared with the following dissociation. The two respective phases are highlighted in Figure 17 (Test 1) and can be extended to all other figures due to the similarity between all tests carried out in this work.
Among these two phases, hydrates formation always showed a higher alternation between positive and negative values. More in general, its trend was not the same in all experiments. Conversely, the rate constant had a more deterministic trend during the dissociation phase and showed high similarity between tests. This specific property proved again that hydrate formation is a more stochastic process than the dissociation one, mainly for effects related to the nucleation phase. Regarding formation, the results obtained in this study were compared with those already available in the literature. To do this, the average “k” value for the formation phase was calculated for each experiment. The results are shown in Table 1.
The results shown in Table 1 strongly agree with the current literature. Chaturvedi and colleagues [63] evaluated the formation rate in pure water and with the presence of porous sediments. During the formation of hydrates, they measured values ranging from 1.9 × 10⁻⁵ mol/min to 3.5 × 10⁻³ mol/min in pure water and values ranging from 2.28 × 10⁻⁴ mol/min to 9.68 × 10⁻⁴ mol/min in the presence of porous sediments. With the only exception of Test 2, all values obtained in this study are extremely close or within the range obtained by Chaturvedi and colleagues. Similar results were also verified in previous research [5], where this parameter varied from 6.23 × 10⁻⁵ mol/min to 6.53 × 10⁻⁴ mol/min. In this latter study, as in [41], the highest values were obtained when the reaction began and the first nuclei of hydrates occurred in the system.
The formation rate constant also gave an idea of the uncertainty associated with measures. The dissociation phase can be used to describe the equilibrium phase boundary for the system. However, the detected conditions did not describe exactly the equilibrium, because they also considered the formation of new hydrates structures, which clearly occurred and was noted with parameter “k”. If only negative values were found during dissociation, this phase and the real equilibrium conditions would have coincided. In this sense, the analysis of the rate constant allowed us to explain the differences which commonly occur between the experimental and theoretical values regarding equilibrium. In this work, such a difference mainly depended on the chemical composition of sand; thus, the weak variation due to this “undesired formation” had a negligible effect and was not observed in Figure 4, Figure 5, Figure 6, Figure 7, Figure 8 and Figure 9.

4. Conclusions

This experimental study deals with carbon dioxide hydrates formation with fresh water and a natural porous medium with a variegated chemical composition and is characterized in previous research. Experiments were carried out consecutively: the same gas–water mixture was used for each of them. Thanks to this solution, it was possible to detect variations related to the memory effect. Firstly, the pressure and temperature trend over time was shown for all experiments; then, thermodynamic conditions were combined to characterize the phase equilibrium for the system, which was then compared with the theoretical equilibrium, previously defined with values taken from the literature. Moreover, gas consumption was measured throughout the experiments and expressed as a percentage of the initial quantity of gas injected inside the reactor. Finally, the process was considered as a first order chemical kinetic equation for the time dependence and the formation/dissociation rate constant was calculated according to it. These analyses allowed us to assert the following conclusions:
(1)
Data about pressure and temperature conditions and the comparison between experimental and theoretical equilibrium proved the persistence of the so-called “memory effect” during tests. The difference between formation and dissociation diagrams constantly decreased from Test 1 to Test 3, while in the remaining three tests, the two curves were perfectly overlapped. In particular, in Test 1, the difference between the formation and the dissociation curves reached values up to 4.5 bar, while in Test 6, such a difference was completely negligible (absent or lower than 0.1 bar).
(2)
Conversely to the evidence presented in the literature, this work led us to assert that the “memory effect” also partially persists at temperatures equal or slightly above 25 °C. In the literature, there is a substantial lack of information about the properties of such a phenomenon in the presence of carbon dioxide and the present work proved the need for further insights.
(3)
The gas consumption allowed us to quantify the percentage of carbon dioxide dissolved in water and its variation over time as a function of the local thermodynamic conditions. Moreover, this parameter assumed a dual behavior in the presence of temperatures, respectively, above or below the freezing point. In the latter case, it showed a partial increase. Its trend proved the expected competition between ice and hydrates formation; in addition, it proved that ice formation also caused a partial release of gas molecules. Similar to point 2, here, further research will focus on defining if the released quantity was related to the portion of CO2 trapped into hydrates, dissolved in water, or both.
(4)
The analysis of the formation/dissociation rate constant confirmed what was asserted in the Labile Cluster Theory and extended its conclusion to the whole process (both formation and dissociation). During experiments, the thermodynamic conditions varied and, especially during hydrates dissociation, constantly remained close to the phase boundary equilibrium; consequently, labile clusters and hydrates nuclei formed and dissolved along the whole process.
(5)
Finally, such a parameter allowed us to characterize and explain the differences which often occur between experimental and theoretical equilibrium values. Hydrates formation constantly occurred during the dissociation phase, even if clearly less pronounced than hydrates dissociation. This secondary phenomenon affected the thermodynamic conditions and moved them away from the equilibrium. The analysis of parameter “k” allowed us to well identify and quantify it in order to give an idea of the uncertainty associated with the measurements.

Author Contributions

Conceptualization, A.M.G. and M.F.; methodology, A.M.G.; software, M.F.; validation, F.R.; formal analysis, M.F.; investigation, A.M.G.; resources, F.R.; data curation, A.M.G.; writing—original draft preparation, A.M.G. and M.F.; supervision, F.R.; funding acquisition, F.R. All authors have read and agreed to the published version of the manuscript.

Funding

This research received no external funding.

Informed Consent Statement

Not applicable.

Data Availability Statement

Not applicable.

Conflicts of Interest

The authors declare no conflict of interest.

References

  1. Koh, C.A.; Sloan, E.D. Natural gas hydrates: Recent advances and challenges in energy and environmental applications. AIChE J. 2007, 53, 1636–1643. [Google Scholar] [CrossRef]
  2. Rossi, F.; Gambelli, A.M. Thermodynamic phase equilibrium of single-guest hydrate and formation data of hydrate in presence of chemical additives: A review. Fluid Phase Equilibr. 2021, 536, 112958. [Google Scholar] [CrossRef]
  3. Brewer, K.C.H.P.G. Clathrate hydrates in nature. Ann. Rev. Mar. Sci. 2009, 1, 303–327. [Google Scholar]
  4. Sloan, E.D.; Koh, C.A. Clathrate Hydrates of Natural Gases, 3rd ed.; CRC Press: Boca Raton, FL, USA, 2008. [Google Scholar]
  5. Gambelli, A.M.; Filipponi, M.; Rossi, F. How methane release may affect carbon dioxide storage during replacement processes in natural gas hydrate reservoirs. J. Pet. Sci. Eng. 2021, 205, 108895. [Google Scholar] [CrossRef]
  6. Li, X.Y.; Li, X.S.; Wang, Y.; Liu, J.W.; Hu, H.Q. The optimization mechanism for gas hydrate dissociation by depressurization in the sediment with different water saturations and different particle sizes. Energy 2021, 215, 119129. [Google Scholar] [CrossRef]
  7. Song, Y.; Tian, M.; Zheng, J.N.; Yang, M. Thermodynamic analysis and ice behavior during the depressurization process of methane hydrate reservoir. Energy 2022, 250, 123801. [Google Scholar] [CrossRef]
  8. Dong, S.; Yang, M.; Chen, M.; Zheng, J.N.; Song, Y. Thermodynamics analysis and temperature response mechanism during methane hydrate production by depressurization. Energy 2022, 241, 122902. [Google Scholar] [CrossRef]
  9. Lv, J.; Cheng, Z.; Duan, J.; Wang, S.; Xue, K.; Liu, Y.; Mu, H. Enhanced CH4 recovery from hydrate-bearing sand packs via CO2 replacement assisted thermal stimulation method. J. Nat. Gas Sci. Eng. 2021, 96, 104326. [Google Scholar] [CrossRef]
  10. Yang, Z.; Si, H.; Zhong, D. AI-based composition model for energy utilization efficiency optimization of gas hydrate recovery by combined method of depressurization and thermal stimulation. J. Nat. Gas Sci. Eng. 2021, 92, 104001. [Google Scholar] [CrossRef]
  11. Tupsakhare, S.S.; Castaldi, M.J. Efficiency enhancements in methane recovery from natural gas hydrates using injection of CO2/N2 gas mixture simulating in-situ combustion. Appl. Energy 2019, 236, 825–836. [Google Scholar] [CrossRef]
  12. Gambelli, A.M.; Castellani, B.; Nicolini, A.; Rossi, F. Water Salinity as Potential Aid for Improving the Carbon Dioxide Replacement Process’ Effectiveness in Natural Gas Hydrate Reservoirs. Processes 2020, 8, 1298. [Google Scholar] [CrossRef]
  13. Hassanpouryouzband, A.; Yang, J.; Tohidi, B.; Chuvilin, E.; Istomin, V.; Bukhanov, B.; Cheremisin, A. CO2 Capture by Injection of Flue Gas or CO2-N2 Mixtures into Hydrate Reservoirs: Dependence of CO2 Capture Efficiency on Gas Hydrate Reservoir Conditions. Environ. Sci. Technol. 2018, 52, 4324–4330. [Google Scholar] [CrossRef]
  14. Ota, M.; Morohashi, K.; Abe, Y.; Watanabe, M.; Lee Smith, R., Jr.; Inomata, H. Replacement of CH4 in the hydrate by use of liquid CO2. Energy Convers. Manag. 2005, 46, 1680–1691. [Google Scholar] [CrossRef]
  15. Ota, M.; Abe, Y.; Watanabe, M.; Lee Smith, R., Jr.; Inomata, H. Methane recovery from methane hydrate using pressurized CO2. Fluid Phase Equilibr. 2005, 228–229, 553–559. [Google Scholar] [CrossRef]
  16. Lee, S.; Lee, Y.; Lee, J.; Lee, H.; Seo, Y. Experimental verification of methane-carbon dioxide replacement in natural gas hydrate using a differential scanning calorimeter. Environ. Sci. Technol. 2013, 47, 13184–13190. [Google Scholar] [CrossRef]
  17. Ersland, G.; Husebo, J.; Graue, A.; Baldwin, B.A.; Howard, J.; Stevens, J. Measuring gas hydrate formation and exchange with CO2 in Bentheim sandstone using MRI tomography. Chem. Eng. J. 2010, 158, 25–31. [Google Scholar] [CrossRef]
  18. Feron, P.H.M.; Hendriks, C.A. CO2 Capture Process Principles and Costs. Oil Gas Sci. Technol. 2005, 60, 451–459. [Google Scholar] [CrossRef] [Green Version]
  19. Kamath, V.A.; Holder, G.D.; Angert, P.F. 3 phase interfacial heat-transfer during the dissociation of propane hydrates. Chem. Eng. Sci. 1984, 39, 1435–1442. [Google Scholar] [CrossRef]
  20. Selim, M.S.; Sloan, E.D. Heat and mass transfer during the dissociation of hydrates in porous media. AIChE J. 1989, 35, 1049–1052. [Google Scholar] [CrossRef]
  21. Kvamme, B.; Coffin, R.B.; Zhao, J.; Wei, N.; Zhou, S.; Li, P.; Saeidi, N.; Chien, Y.C.; Dunn-Rankin, D.; Sun, W.; et al. Stages in the dynamics of hydrate formation and consequences for design of experiments for hydrate formation in sediments. Energies 2019, 12, 3399. [Google Scholar] [CrossRef] [Green Version]
  22. Hu, F.; Tong, S.; Lu, K.; Chen, C.M.; Su, F.Y.; Zhou, J.; Lu, Z.H.; Wang, X.; Feng, G.; Zhang, R. Reduced graphene oxide supported Ni-Ce catalysts for CO2 methanation: The support and ceria promotion effects. J. CO2 Util. 2019, 34, 676–687. [Google Scholar] [CrossRef]
  23. Kamath, V.A.; Holder, G.D. Dissociation heat-transfer characteristics of methane hydrates. AIChE J. 1987, 33, 347–350. [Google Scholar] [CrossRef]
  24. Katsuki, D.; Ohmura, R.; Ebinuma, T.; Narita, H. Visual observation of dissociation of methane hydrate crystals in a glass micro model: Production and transfer of methane. Int. J. App. Phys. 2008, 104, 083514. [Google Scholar] [CrossRef]
  25. Almenningen, S.; Flatlandsmo, J.; Ferno, M.A.; Ersiand, G. Multiscale laboratory verification of depressurization for production of sedimentary methane hydrates. SPE J. 2017, 22, 138–147. [Google Scholar] [CrossRef]
  26. Hachikubo, A.; Takeya, S.; Chuvilin, E.; Istomin, V. Preservation phenomena of methane hydrate in pore spaces. Phys. Chem. Chem. Phys. 2011, 13, 17449–17452. [Google Scholar] [CrossRef]
  27. Kou, X.; Feng, J.C.; Li, X.S.; Wang, Y.; Chen, Z.Y. Memory effect of gas hydrate: Influencing factors of hydrate reformation and dissociation behaviors. Appl. Energy 2022, 306, 118015. [Google Scholar] [CrossRef]
  28. Li, Y.; Wu, N.; Ning, F.; Gao, D.; Hao, X.; Chen, Q.; Liu, C.; Sun, J. Hydrate-induced clogging of sand-control screen and its implication on hydrate production operation. Energy 2020, 206, 118030. [Google Scholar] [CrossRef]
  29. Li, Y.; Chen, J.; Gambelli, A.M.; Zhao, X.; Gao, Y.; Rossi, F. In situ experimental study on the effect of mixed inhibitors on the phase equilibrium of carbon dioxide hydrate. Chem. Eng. Sci. 2022, 248, 117230. [Google Scholar] [CrossRef]
  30. Roozeboom, H.W.B. Sur l’hydrate de l’acide sulfureux. Recl. Trav. Chim. Pays Bas 1884, 3, 29–58. [Google Scholar] [CrossRef]
  31. Wilson, P.W.; Haymet, A.D.J. Hydrate formation and re-formation in nucleating THF/water mixtures show no evidence to support a “memory” effect. Chem. Eng. J. 2010, 161, 146–150. [Google Scholar] [CrossRef]
  32. Li, Y.; Wu, N.; He, C.; Sun, Z.; Zhang, Z.; Hao, X.; Chen, Q.; Bu, Q.; Liu, C.; Sun, J. Nucleation probability and memory effect of methane-propane mixed gas hydrate. Fuel 2021, 291, 120103. [Google Scholar] [CrossRef]
  33. Takeya, S.; Hori, A.; Hondoh, T.; Uchida, T. Freezing-Memory Effect of Water on Nucleation of CO2 Hydrate Crystals. J. Phys. Chem. B 2000, 104, 4164–4168. [Google Scholar] [CrossRef]
  34. Wu, Q.; Zhang, B. Memory effect on the Pressure-Temperature Condition and Induction Time of Gas Hydrate nucleation. J. Nat. Gas Chem. 2010, 19, 446–451. [Google Scholar] [CrossRef]
  35. Duchateau, C.; Glénat, P.; Pou, T.E.; Hidalgo, M.; Dicharry, C. Hydrate Precursor Test Method for the Laboratory Evaluation of Kinetic Hydrate Inhibitors. Energy Fuels 2010, 24, 616–623. [Google Scholar] [CrossRef]
  36. Zeng, H.; Wilson, L.D.; Walker, V.K.; Ripmeester, J.A. Effect of Antifreeze Proteins on the Nucleation, Growth, and the Memory Effect during Tetrahydrofuran Clathrate Hydrate Formation. J. Am. Chem. Soc. 2006, 128, 2844–2850. [Google Scholar] [CrossRef]
  37. Davidson, D.W.; Garg, S.K.; Gough, S.R.; Handa, Y.P.; Ratcliffe, C.I.; Ripmeester, J.A.; Tse, J.S.; Lawson, W.F. Laboratory analysis of a naturally occurring gas hydrate from sediment of the Gulf of Mexico. Geochim. Cosmochim. Acta 1986, 50, 619–623. [Google Scholar] [CrossRef]
  38. Sloan, E.D.; Fleyfel, F. A molecular mechanism for gas hydrate nucleation from ice. AIChE J. 1991, 37, 1281–1292. [Google Scholar] [CrossRef]
  39. Muller-Bongartz, B.; Wildeman, T.R.; Sloan, E.D. A hypothesis for hydrate nucleation phenomena. In Proceedings of the Second International Offshore and Polar Engineering Conference, San Francisco, CA, USA, 14–19 June 1992; International Society of Offshore and Polar Engineers: Mountain View, CA, USA, 1992. [Google Scholar]
  40. Gambelli, A.M. An experimental description of the double positive effect of CO2 injection in methane hydrate deposits in terms of climate change mitigation. Chem. Eng. Sci. 2021, 233, 116430. [Google Scholar] [CrossRef]
  41. Gambelli, A.M.; Rossi, F. Thermodynamic and kinetic characterization of methane hydrate nucleation, growth and dissociation processes, according to the Labile Cluster Theory. Chem. Eng. J. 2021, 425, 130706. [Google Scholar] [CrossRef]
  42. Gambelli, A.M.; Tinivella, U.; Giovannetti, R.; Castellani, B.; Giustiniani, M.; Rossi, A.; Zannotti, M.; Rossi, F. Observation of the Main Parameters Influencing the Formation of Gas Hydrates. Energies 2021, 14, 1803. [Google Scholar] [CrossRef]
  43. Gambelli, A.M. Variations in terms of CO2 capture and CH4 recovery during replacement processes in gas hydrate reservoirs, associated to the “memory effect”. J. Clean. Prod. 2022, 360, 132154. [Google Scholar] [CrossRef]
  44. Rossi, F.; Li, Y.; Gambelli, A.M. Thermodynamic and kinetic description of the main effects related to the memory effect during carbon dioxide hydrates formation in a confined environment. Sustainability 2021, 13, 13797. [Google Scholar] [CrossRef]
  45. Gambelli, A.M.; Presciutti, A.; Rossi, F. Kinetic considerations and formation rate for carbon dioxide hydrate, formed in presence of a natural silica-based porous medium: How initial thermodynamic conditions may modify the process kinetic. Thermochim. Acta 2021, 705, 179039. [Google Scholar] [CrossRef]
  46. Takeya, S.; Kida, M.; Minami, H.; Sakagami, H.; Hachikubo, A.; Takahashi, N.; Shoji, H.; Soloviev, V.; Wallmann, K.; Biebow, N.; et al. Structure and thermal expansion of natural gas clathrate hydrates. Chem. Eng. Sci. 2006, 61, 2670–2674. [Google Scholar] [CrossRef]
  47. Aregba, A.G. Gas Hydrate—Properties, Formation and Benefits. Open J. Yangtze Oil Gas 2017, 2, 27–44. [Google Scholar] [CrossRef] [Green Version]
  48. Fitzgerald, G.C.; Castaldi, M.J.; Zhou, Y. Large scale reactor details and results for the formation and decomposition of methane hydrates via thermal stimulation dissociation. J. Pet. Sci. Eng. 2012, 94, 19–27. [Google Scholar] [CrossRef]
  49. Nema, Y.; Ohmura, R.; Senaha, I.; Yasuda, K. Quadruple point determination in carbon dioxide hydrate forming system. Fluid Phase Equilibr. 2017, 441, 49–53. [Google Scholar] [CrossRef]
  50. Nagashima, H.D.; Fukushima, N.; Ohmura, R. Phase equilibrium condition measurements in carbon dioxide clathrate hydrate forming system from 199.1 K to 247.1 K. Fluid Phase Equilibr. 2016, 413, 53–56. [Google Scholar] [CrossRef]
  51. Khan, M.S.; Partoon, B.; Bavoh, C.B.; Lal, B.; Mellon, B.M. Influence of tetramethylammonium hydroxide on methane and carbon dioxide gas hydrate phase equilibrium conditions. Fluid Phase Equilibr. 2017, 440, 1–8. [Google Scholar] [CrossRef]
  52. Khan, M.S.; Bavoh, C.; Partoon, B.; Lal, B.; Bustam, M.A.; Shariff, A.M. Thermodynamic effect of ammonium based ionic liquids on CO2 hydrates phase boundary. J. Mol. Liq. 2017, 238, 533–539. [Google Scholar] [CrossRef]
  53. Sadeq, D.; Iglauer, S.; Lebedev, M.; Smith, C.; Barifcani, A. Experimental determination of hydrate phase equilibrium for different gas mixtures containing methane, carbon dioxide and nitrogen with motor current measurements. J. Nat. Gas Sci. Eng. 2017, 38, 59–73. [Google Scholar] [CrossRef] [Green Version]
  54. Chen, L.; Sun, C.; Chen, G.; Nie, Y.; Sun, Z.; Liu, Y. Measurements of Hydrate Equilibrium Conditions for CH4, CO2, and CH4+C2H6+C3H8 in Various Systems by Step-heating Method. Chin. J. Chem. Eng. 2009, 17, 635–641. [Google Scholar] [CrossRef]
  55. Jarrahian, A.; Nakhaee, A. Hydrate-liquid-vapor equilibrium condition for N2 + CO2 + H2O system: Measurement and modelling. Fuel 2019, 237, 769–774. [Google Scholar] [CrossRef]
  56. Kyung, D.; Lee, K.; Kim, H.; Lee, W. Effect of marine environmental factors on the phase equilibrium of CO2 hydrate. Int. J. Greenh. Gas Control 2014, 20, 285–292. [Google Scholar] [CrossRef]
  57. Seo, Y.T.; Lee, H. Multiple-phase hydrate equilibria of the ternary carbon dioxide, methane, and water mixtures. J. Phys. Chem. B 2001, 105, 10084–10090. [Google Scholar] [CrossRef]
  58. Yu, Y.S.; Zhou, S.D.; Li, X.S.; Wang, S.L. Effect of graphite nanoparticles on CO2 hydrate phase equilibrium. Fluid Phase Equilibr. 2016, 414, 23–28. [Google Scholar] [CrossRef]
  59. Pahlavanzadeh, H.; Farhoudi, A.; Manteghian, M. Experimental measurement of carbon dioxide clathrate hydrate in the presence of adamantane and other water soluble and insoluble additives. J. Chem. Thermodyn. 2019, 135, 352–358. [Google Scholar] [CrossRef]
  60. Herri, J.M.; Bouchemoua, A.; Kwatersky, M.; Fezoua, A.; Ouabbas, Y.; Cameirao, A. Gas hydrate equilibria for CO2-N2 and CO2-CH4 gas mixtures—Experimental studies and thermodynamic modelling. Fluid Phase Equilibr. 2011, 301, 171–190. [Google Scholar] [CrossRef] [Green Version]
  61. Gambelli, A.M.; Rossi, F. Experimental investigation on the possibility of defining the feasibility of CO2/CH4 exchange into a natural gas hydrate marine reservoir via fast analysis of sediment properties. Chem. Eng. Res. Des. 2021, 171, 327–339. [Google Scholar] [CrossRef]
  62. Gambelli, A.M. Analyses on CH4 and CO2 hydrate formation to define the optimal pressure for CO2 injection to maximize the replacement efficiency into natural gas hydrate in presence of a silica-based natural porous medium, via depressurization techniques. Chem. Eng. Process. 2021, 167, 108512. [Google Scholar] [CrossRef]
  63. Chaturvedi, E.; Maiti, M.; Laik, S.; Mandal, A. Mineralogical and structural characterization of the sediments of Krishna Godavari and Mahanadi Basin and their influences on hydrate formation kinetics. Adv. Powder Technol. 2021, 32, 1247–1263. [Google Scholar] [CrossRef]
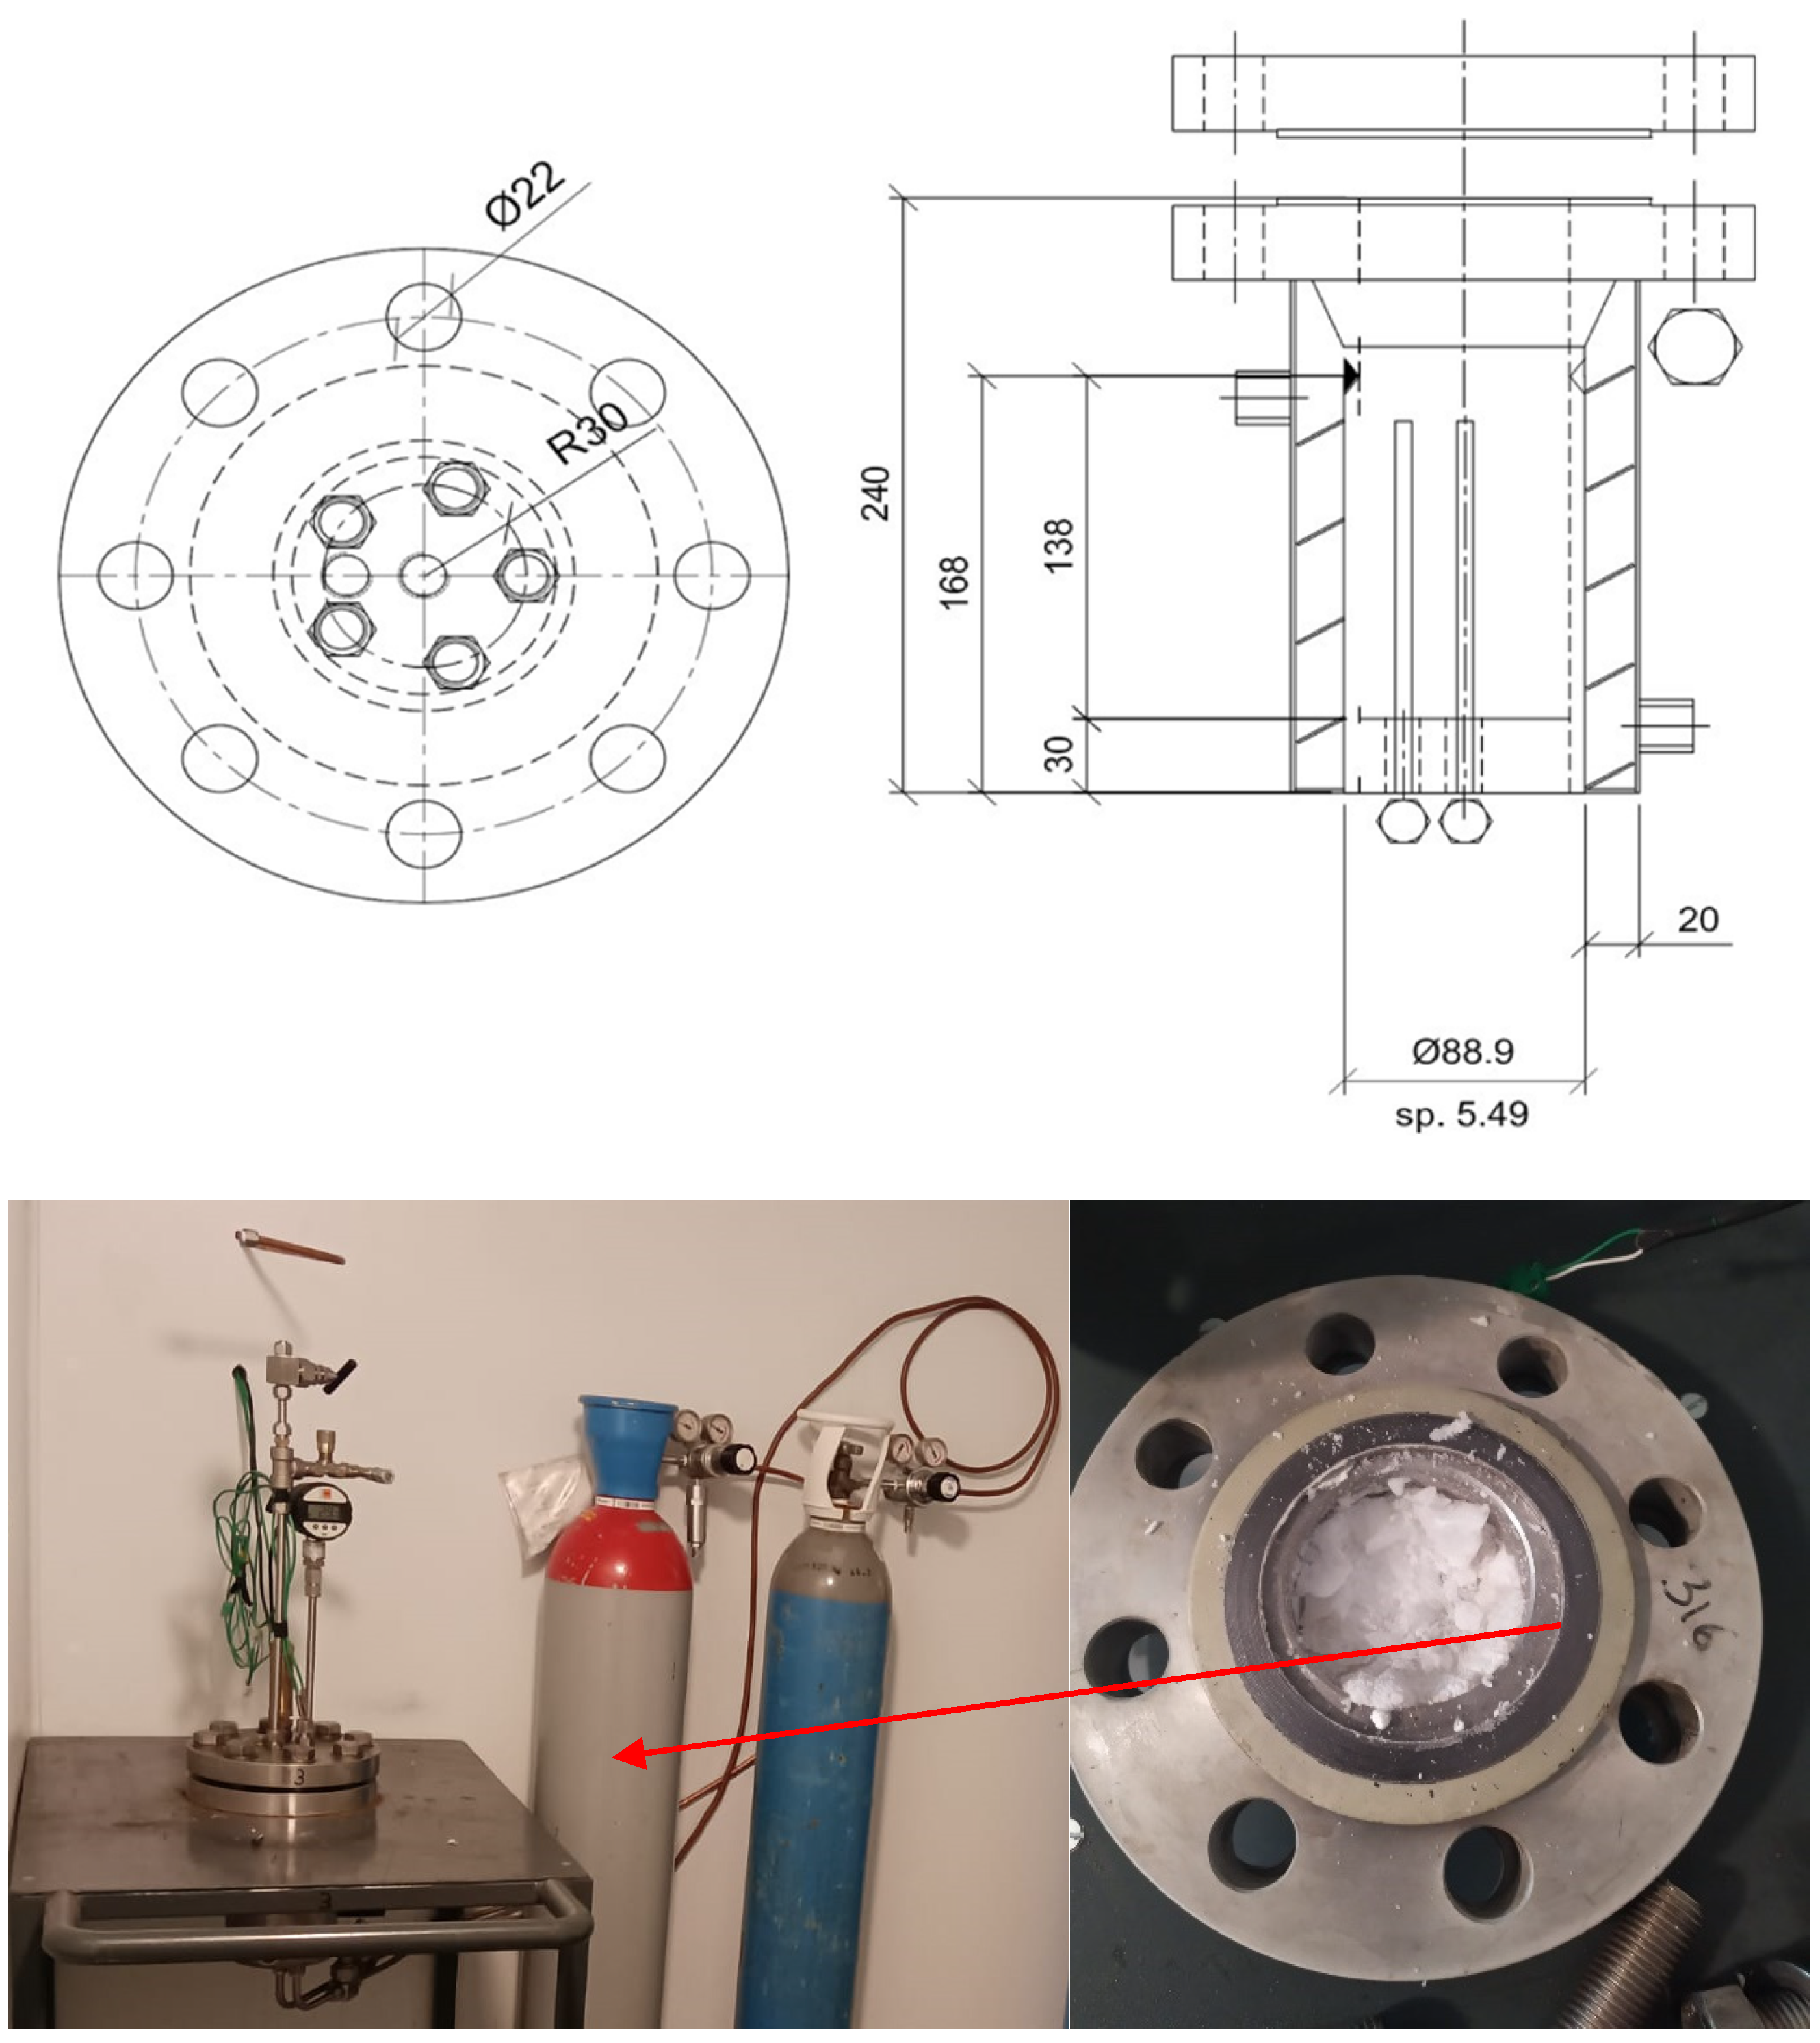
Figure 1. Scheme (above) and image (below) of the reactor used for gas hydrates production.
Sustainability 14 08829 g001
Figure 2. Scheme of the assembled experimental apparatus.
Sustainability 14 08829 g002
Figure 3. Time lapse of experiments carried out in this study and description of their pressure and temperature trend over time.
Sustainability 14 08829 g003
Figure 4. Pressure–temperature trend observed in Test 1.
Sustainability 14 08829 g004
Figure 5. Pressure–temperature trend observed in Test 2.
Sustainability 14 08829 g005
Figure 6. Pressure–temperature trend observed in Test 3.
Sustainability 14 08829 g006
Figure 7. Pressure–temperature trend observed in Test 4.
Sustainability 14 08829 g007
Figure 8. Pressure–temperature trend observed in Test 5.
Sustainability 14 08829 g008
Figure 9. Pressure–temperature trend observed in Test 6.
Sustainability 14 08829 g009
Figure 10. Illustration of CO2 hydrate formation and dissociation on a pressure–temperature diagram, according to [29].
Sustainability 14 08829 g010
Figure 11. Gas consumption observed in Test 1.
Sustainability 14 08829 g011
Figure 12. Gas consumption observed in Test 2.
Sustainability 14 08829 g012
Figure 13. Gas consumption observed in Test 3.
Sustainability 14 08829 g013
Figure 14. Gas consumption observed in Test 4.
Sustainability 14 08829 g014
Figure 15. Gas consumption observed in Test 5.
Sustainability 14 08829 g015
Figure 16. Gas consumption observed in Test 6.
Sustainability 14 08829 g016
Figure 17. Description of parameter “k” over time in Test 1.
Sustainability 14 08829 g017
Figure 18. Description of parameter “k” over time in Test 2.
Sustainability 14 08829 g018
Figure 19. Description of parameter “k” over time in Test 3.
Sustainability 14 08829 g019
Figure 20. Description of parameter “k” over time in Test 4.
Sustainability 14 08829 g020
Figure 21. Description of parameter “k” over time in Test 5.
Sustainability 14 08829 g021
Figure 22. Description of parameter “k” over time in Test 6.
Sustainability 14 08829 g022
Table 1. Average “k” values measured during the formation phase of each test.
Test n°k [mol/min]
18.9 × 10⁻⁴
22.82 × 10⁻⁵
32.25 × 10⁻⁴
42.63 × 10⁻⁴
51.16 × 10⁻⁴
63.91 × 10⁻⁴
Publisher’s Note: MDPI stays neutral with regard to jurisdictional claims in published maps and institutional affiliations.