Article

An Integrated Approach for Developing an Urban Livability Composite Index—A Cities’ Ranking Road Map to Achieve Urban Sustainability

1
College of Earth and Environmental Sciences, University of the Punjab, Lahore 54000, Pakistan
2
The Urban Unit, Shaheen Complex, 503 Edgerton Rd Lahore, Lahore 54000, Pakistan
3
Department of Environmental Science and Policy, Lahore School of Economics, Lahore 54000, Pakistan
*
Author to whom correspondence should be addressed.
Sustainability 2022, 14(14), 8755; https://doi.org/10.3390/su14148755
Submission received: 12 May 2022 / Revised: 16 June 2022 / Accepted: 13 July 2022 / Published: 18 July 2022
(This article belongs to the Section Sustainability in Geographic Science)

Abstract

:
Livability is a concept that assesses the quality of life and relative performance of different regions and communities, based on various qualitative and quantitative factors. The assessment of urban livability is a complex and multidimensional task, which is of utmost importance for informed and transparent policy and decision making. The present study aimed to develop a road map for cities’ ranking on the bases of their livability. We have used a case study of eight major cities of Punjab, Pakistan. Indicators of cities’ sustainability considered for the cities’ ranking were spatial planning and growth, individual wellbeing, urban economy, connectivity and infrastructure, quality of life, and the urban environment. In the first stage, after the consolidation of socio-economic, environmental, and other indicators, they are converted into dimension indices by taking geometric means. In the second stage, the Analytical Hierarchical Process (AHP) has been employed for assigning weights to each dimension into a composite index. The results of the study depict the disparities among cities through a multidimensional analysis. Lahore is ranked as first overall from the bottom. Thus, the study recommends that, despite the high standing of Lahore on the livability ladder, it must address the issue of connectivity and traffic congestion and per capita needs of the public infrastructure for a growing mega metropolitan city of over 10 million people. Similarly, Rawalpindi is ranked as the second-best city with regard to livability in Punjab. The main contributing factors for Rawalpindi city are ‘individual well-being’, ‘urban economy’, and ‘urban environment’. Moreover, the current study also suggests important policy implications for decision makers to highlight the areas that must be reconsidered for improvement in terms of the selected indicators and dimensions.

1. Introduction

Ecological livability is based on environmental sustainability principles and assesses the relative performance of cities over various qualitative and quantitative factors around the world [1]. Livability scales define the best or the worst living conditions presented for an individual’s lifestyle [2], allowing direct comparison between places [3]. It correlates with social and physical well-being indicators to develop and sustain a meaningful human existence [3]. The world has become more urbanized over the last few decades, with half of the world’s population living in urban areas and generating environmental problems in developing countries [4]. It was observed that in the 1950s thirty percent of the world’s population was living in urban areas [5], which increased up to fifty percent in 2011 and would be expected to increase to seventy percent by the 2050s [6]. Moreover, urbanized heterogeneity makes the situation worse in some parts of the world, i.e., Asia has 70% of its population living in urban areas [7]. Livability is linked to the quality of urban life [8] including the availability of parking spaces, walkways, and walkability of neighborhoods [9,10].
Cities’ livability ranking is calculated on the basis of healthcare, cultural, environmental, educational, and infrastructural perspectives [11]. The rapid growth of cities reduces [12] green spaces in cities, which are important for the enhancement of livability in cities based upon a sustainable array of environmental services and physical health benefits, welfare, and social consistency [12]. Regarding the quality of the urban environment, green areas are crucial, providing air-filtering services and reducing the particulate matter (PM) concentration in the urban air.
To make cities economically vibrant, it is essential to study the genetic code of cities by evaluating competitiveness and livability [13]. It is important to focus on cities’ dimensions and sustainability indicators to assess cities’ performance and ranking accordingly [14]. These rankings can be updated and revised every five years after the release of secondary data and the collection of new primary data if required, and the development expenditure of cities shall be linked to this livability ranking so that the performance of cities can be enhanced by setting targets of livability rankings and upgrades [15]. This will generate healthy competition amongst local governments and city administrations to improve the infrastructure and performance of cities. Furthermore, quality of life (QOL) and wellbeing are closely related concepts by which living conditions can be measured [16]. Livability refers to the quality of life in human–environment relations. Different criteria have been proposed to determine livability at different stages of economic development [17]. For example, in 2007, “China launched a livable city science evaluation standard” and officially released a guide to determine livability.
In Pakistan, particularly, the Punjab province is facing a massive urban transition. There is not a single study on cities in Pakistan available that categorizes cities using spatial indicators and datasets [18]. This research is significant and highly beneficial in providing an in-depth analysis of major cities of Punjab based on a comprehensive catalog of indicators using their own developed primary datasets and multi-source open secondary datasets. We used a multivariate and multidimensional approach to gauge urban livability [18]. Other than just the identification of primary and secondary variables, the utilization of geo-spatial techniques for livability ranking helps illustrate a comparative analysis for urban planners and decision-makers to initiate interventions to upgrade the livability of cities. This study provides an efficient framework of cities’ ranking, which can be replicable in Pakistan and other parts of the world.
The main objective of this paper is to define the relevant spatial and non-spatial indicators of livability across major cities of Punjab and highlight the suitability of selected cities on the basis of those indicators to comprehend the overall impact of spatial characteristics, the economy, the environment, quality of life, and individual wellbeing in the context of urban livability. We developed a Livability Composite Index (LCI) for cities and ranked these selected cities on the basis of suitability for urban livability [18].

Literature Review

For the livability ranking of cities, the identification of suitable indicators is a crucial step. The accurate selection of indicators/dimensions and sub-indicators helps in understanding the components of livability. The choice of indicators usually depends upon the intended purpose of measuring livability. In this research, the main focus was to select the most appropriate indicators from all possible dimensions in order to measure the livability of different cities. Through a review of the literature, a diverse range of objective and subjective livability indicators were identified, and data against each indicator were collected/developed accordingly. Table 1 provides a detailed list of all of the citations of the indicators relevant to livability and housing, education, employment, health, connectivity and transportation, understanding of open spaces, local and social cohesion, the natural urban environment, etc. Numerous case studies of different regions related to cities’ ranking have also been studied.
The following table mentions the research papers that have been consulted for the selection and shortlisting of indicators. It explains the frequency with which the various types of indicators have been quoted in various research papers across the globe.
Livability is a real-world, multi-dimensional, and hierarchical concept that usually correlates with the various themes and indicators being selected and analyzed in different ways. In this research, the indicators were selected and reviewed based on a systematic approach. The five-stage methodological framework of O’Malley and Arksey was used to conduct this scoping and shortlisting of the livability indicators [35]. A systematic search of electronic databases, including the Web of Science, EMBASE, Scopus, EBSCO, and PubMed, was conducted until 29 December 2019 [35]. Searching reference lists on the web was also initiated to access more relevant articles regarding the shortlisting of the livability of indicators. Numerous papers were screened for the eligibility of the indicators for consideration to be included in the domain of livability or Quality of Life. Out of 3599 papers initially searched, only 87 met the selection criteria. This review process enabled us to identify the six domains or themes, which include spatial characteristics, individual wellbeing, urban economy, connectivity and infrastructure, quality of life, and urban environment [36].
The first step was to outline the details of the domains as a sub-indicator of quality of life. The literature review helped to define most of the possible indicators and dimensions that contribute to the livability of a city.

2. Materials and Methods
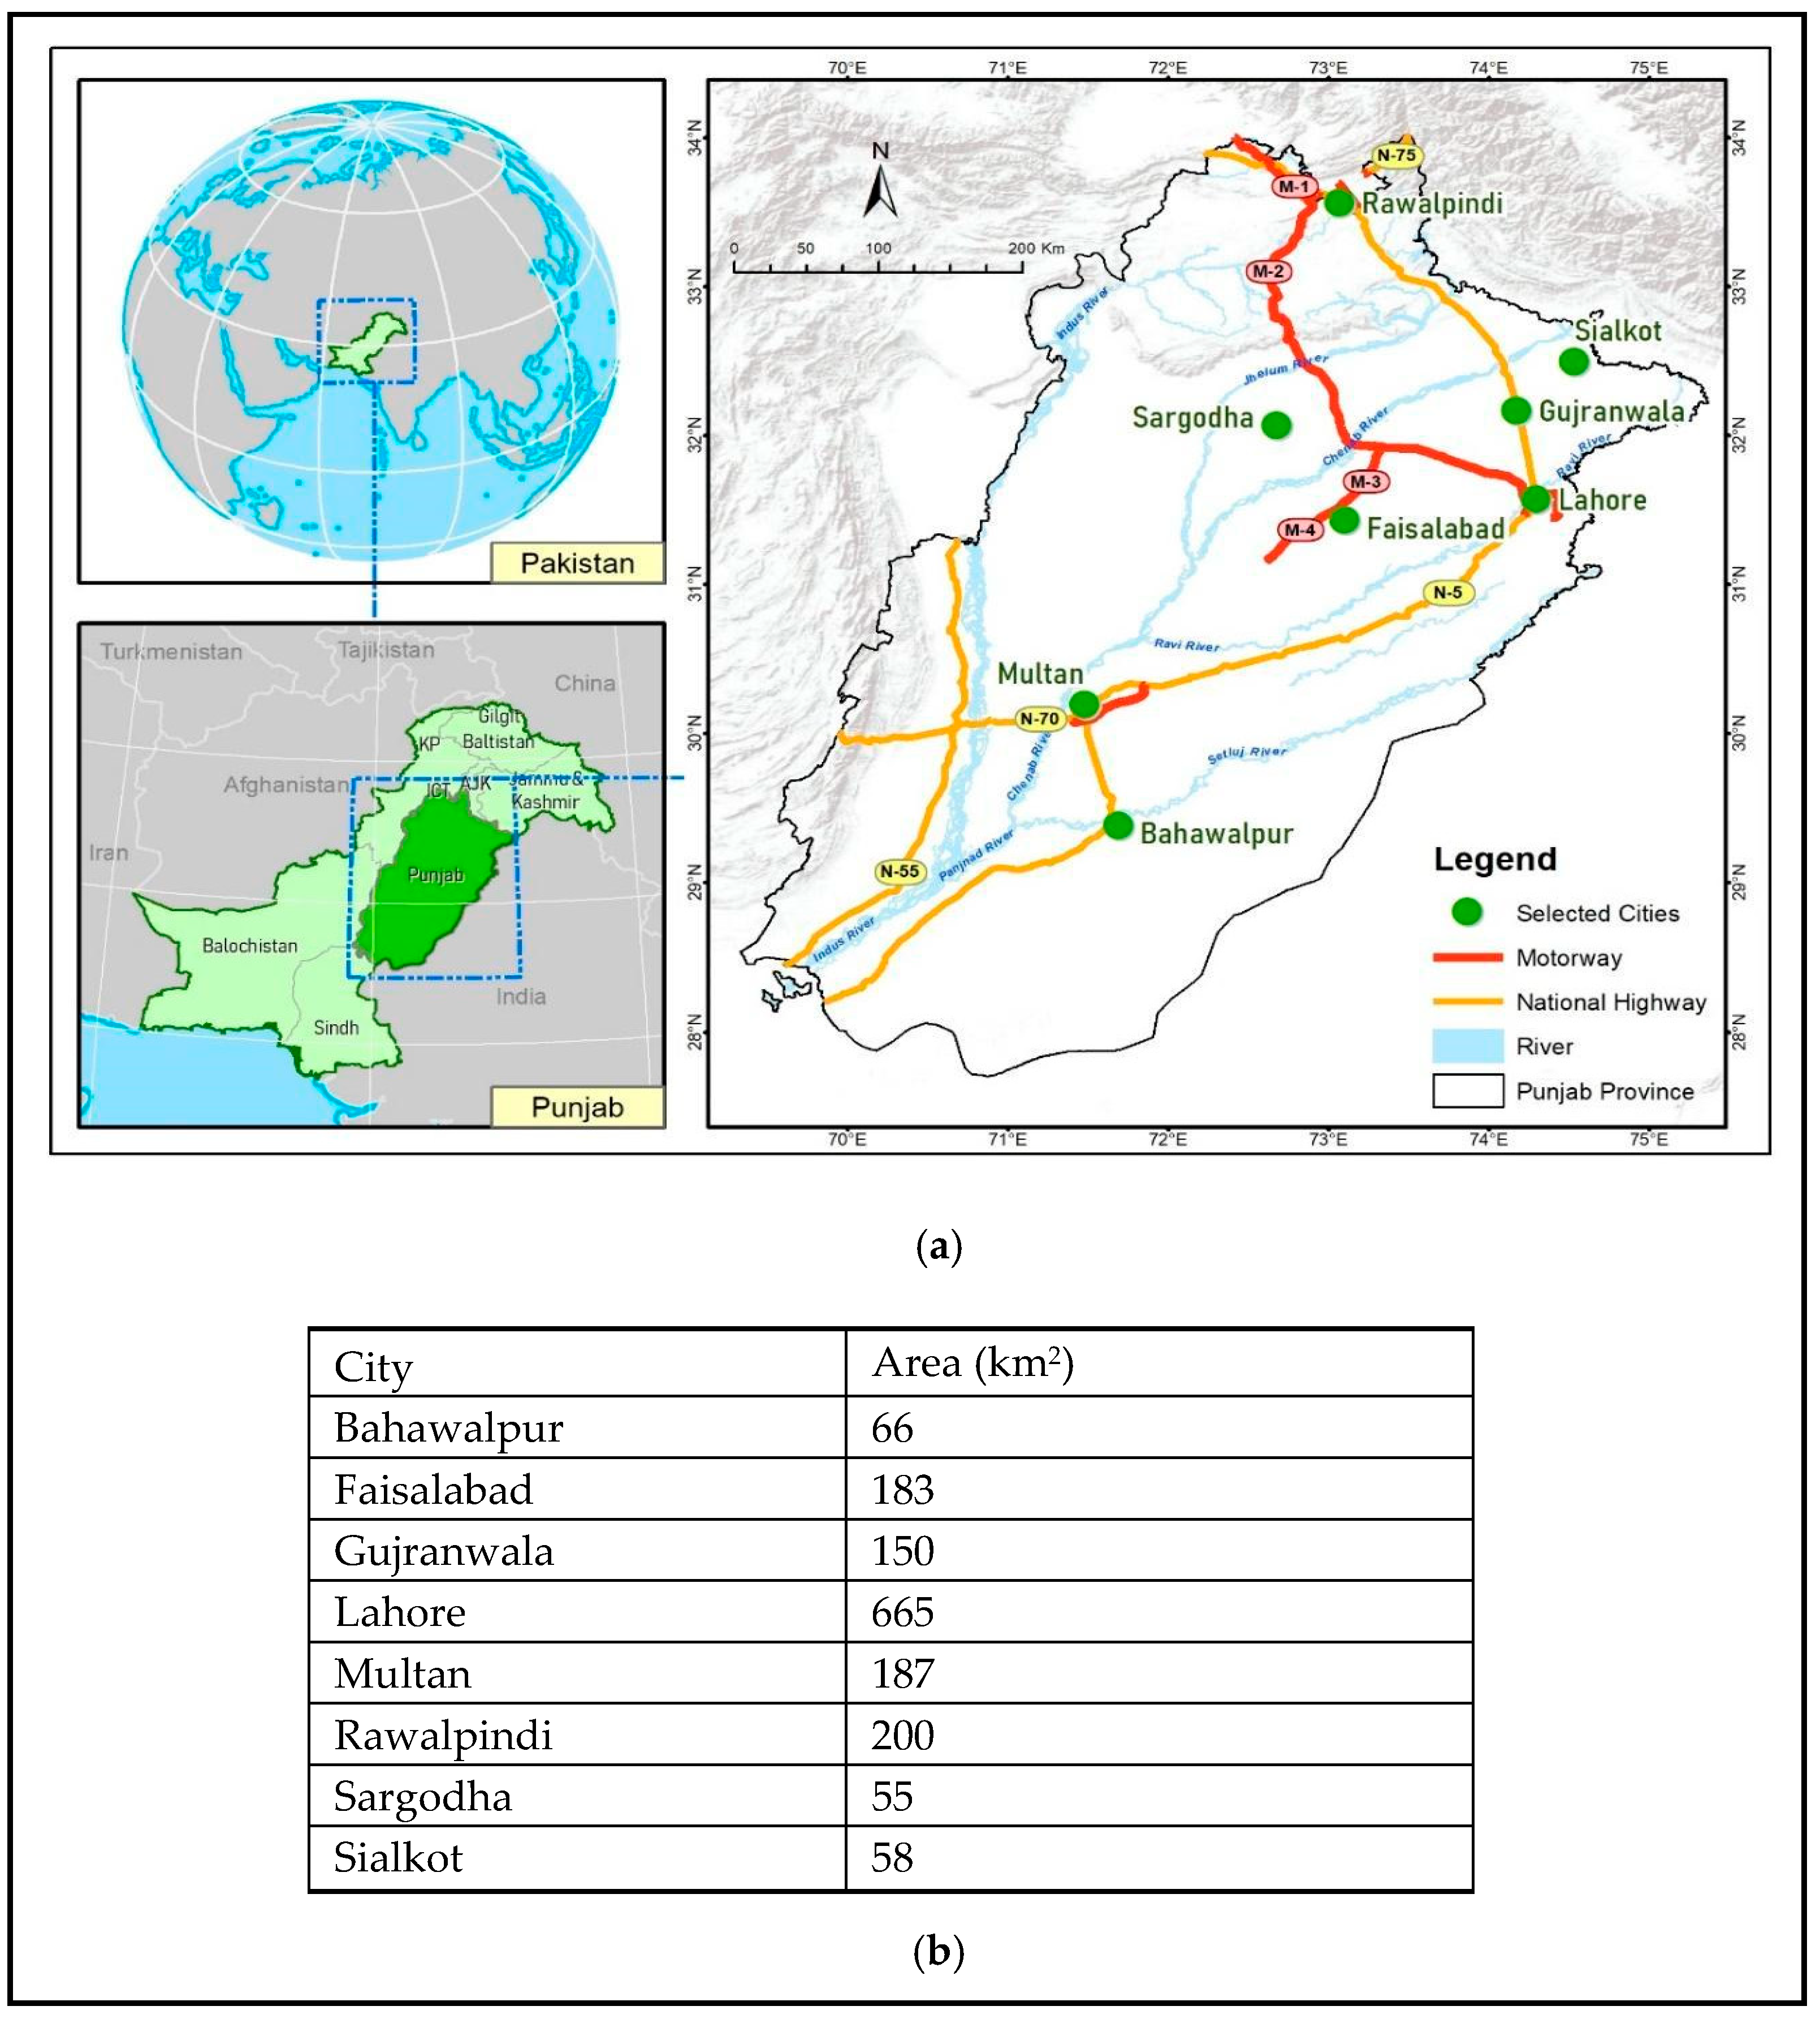
2.1. Study Area

Punjab is the most populated province of Pakistan, housing a population of more than 110 million (31.1704° N, 72.7097° E). The Punjab Province has many prime swarming urban centers, but this research is focused on eight selected cities of Punjab, i.e., Lahore, Gujranwala, Sargodha, Sialkot, Rawalpindi, Multan, Bahawalpur, and Faisalabad (Figure 1a,b). The socio-economic and demographic data, as well as the rural areas, are collected at the administrative district and sub-district tehsil level. Punjab is located in a relatively flat area with few hills, located northward (Rawalpindi city). The climate is a subtropical monsoon with four distinct seasons.

2.2. Conceptual Framework and Selection of Indicators

2.2.1. Conceptual Framework

The literature review was conducted to define the most possible indicators and dimensions that contribute to the livability of a city. Most of the data, such as NO2, PM2.5, land cover, public parks and green spaces, protected areas, flood zones, and nightlight flux, were acquired from primary sources against each indicator such as open-source web portals and the Google Earth Engine (Landsat, Sentinel 2A, Sentinel 5p, Quick bird, MODIS terra). The data were also collected from departments/organizations such as the Urban Unit, the Punjab Disaster Management Authority, World Wildlife, and the Punjab Bureau of Statistics. The results were further verified at the micro-level using Google Earth’s latest satellite imagery. A total of six dimensions (spatial planning and urban growth development; individual wellbeing; urban economy; connectivity and infrastructure quality of life; and urban environment) with 44 indicators were chosen. The main content includes 6 aspects, that is, economic prosperity, a better environment, convenience of life, security, social aspects, and resources/facilities. The evaluation criteria of livable communities can help in identifying livable cities, although residential communities are the basic unit of urban-dwelling districts. Initiated from the current situation of the existing urban residential communities in Punjab, this paper proposes that a livable community should meet the following conditions with respect to the dimensions: Spatial planning, individual wellbeing, urban economy, connectivity and infrastructure, quality of life, and urban environment. Therefore, we chose objective evaluation indicators from these six dimensions and used different groups’ subjective opinions to build a comprehensive evaluation framework for judging livability, as shown in Figure 2.

2.2.2. Indicators

The measurement and monitoring of indicators were also necessary to validate the national and international sustainable development progress. The model was built using criteria on the basis of the selected indicators, including the traditional conceptual values of economic, social, environmental, and national infrastructure [37]. Current trends in the research on indicators are entirely based upon the development of simple and informative indicators, which recommends that the selected criteria are not too complicated or do not have a large number of sub-indicators, because the complex structure of indicators creates difficulties in quantifying or understanding the objectives [38].

2.2.3. Selection of Indicators

Six dimensions (themes) including 44 indicators are discussed in detail in this section, as shown in Table 1. The six dimensions selected for the identification of suitable cities include (1) spatial characteristics, (2) individual wellbeing, (3) the urban economy, (4) connectivity and infrastructure, (5) the quality of life, and (6) the urban environment. The indicators used to define dimensions are the following: Urban sprawl, isolation, built-up area as a percentage of the city area, planned area percentages, open space, percentages of high-density areas in a city, emergency services by ambulance per 1000 people, percentage of the population getting sick, percentage of households satisfied by the Police Service, percentage of households satisfied by the economic situation of the community compared to the previous year, % of expenditure spent on recreation, average annual hours worked by each person, economically active population (percentage), bank/branches in the city per 1000 people, percentage of commercial/industrial property as a percentage of the total land area, nightlight flux, percentage of migrants entering a city in the past 4 years, road density (per 100 Sq. km), road traffic fatalities, number of flights from other cities to the selected city, road density (dual carriageways) Km, traffic accident rate, PTAL, percentage of literate population, percentage of population access to Government Schools, colleges and universities, percentage of population access to healthcare, percentage of houses with improved walls and an improved roof, percentage of police staff per 10,000 people, number of mosques/churches/etc., per 10,000 people, percentage of households with access to internet, percentage of households with access to a mobile phone, cinemas/museum/restaurants/cafe per 10,000 people, volume of waste generation (tons) per 1000 people, air quality (NO2), natural assets (river, canal, etc.), pollution/PM2.5, percentage of protected areas, percentage of land in heat island, percentage of good water quality (TDS), green space as a percentage of the city area, percentage of households with improved drinking, percentage of households with improved sanitation facilities, flood zone, etc. A millennial survey (online questionnaire survey) was also conducted to assess the perceptions of the intra-urban inequalities and disparities in the living conditions and safety of the cities.

2.3. Data Acquisition and Processing

Different datasets were adopted in this study, including (1) the spatial data of eight cities obtained from primary and secondary sources; (2) economic and social data collected from the Punjab Bureau of Statistics, etc.; (3) other geospatial data processed through various algorithms elaborated below (e.g., air quality, green spaces, housing, education, employment, health, connectivity and transportation, understanding open spaces, local and social cohesion, natural urban environment, etc.); (4) questionnaire-based data used to characterize different preferences for living. Thirty experts from various backgrounds were randomly selected to complete responses to the questionnaire. We finally obtained 25 valid questionnaires; therefore, the effective return ratio was 83%.

2.3.1. Data Creation Using GIS and Remote Sensing

Fifteen analyses were performed in this study to generate data for use in the geostatistical model and AHP to rank the cities. We extracted the urban sprawl for 2008–2018 through random forest classification for all the cities. The random forest classifier was chosen to better classify all satellite imagery by training pixels on the basis of five classes, namely water, built-up area, vegetation, sand, and open land. The change in the transformation of the built-up land cover class was extracted for 2008–2018 using sentinel-2A. Built-up areas were masked out from the land cover dataset using the cellular automata technique. Isolated areas were identified using built-up areas to assess the suitable approach from other cities using a buffer analysis. Macro-level digitization at a scale of 1:20,000 was performed to digitize the planned and unplanned localities. Moreover, the Landscan data were used to calculate populous densities and their percentage cover on the land. The pixel size of the Landscan data was 1 km (30″ × 30″) and serves the purpose of estimating data for large cities.
We needed the population for each city for that purpose, so the landscan population was obtained and utilized. Nighttime light was obtained from (VIIRS) [39] for the year 2020–2021 and identified the nightlight flux. The NO2 air quality parameter was used to identify the environmental conditions in the study area, which helped us to identify pollution patterns using the Google Earth engine as shown in the Supplementary Material. The tropospheric column density was calculated for NO2 [40].
PM2.5 was observed for all the cities to identify the air quality index. The sources of PM2.5 are coal-fired power plants, industry, traffic, etc. Heat islands were identified using the land surface temperature, and hotspot analysis was conducted. All individual datasets acquired through the different analyses mentioned above were inserted into the geo-statistical model and analytical hierarchical process to assess the ranking of the cities. Min–max normalization, the geometric mean, and the analytical hierarchical process (AHP) [41] were used to assign weights, and weighted average techniques were used to examine and construct individual/dimensional and composite livability indices. A flowchart of the detailed methodology is provided in the supplementary material.

2.3.2. Data Processing and Methods

The composite final ranking was established using a three-step methodology:
  • Firstly, the ‘Normalization of the Indicators/Variables’ was performed to obtain the normalized value at a single scale unit. This was followed by the AHP method, which was used to find the weights of all respective indicators in each dimensional Index.
  • The weights of each dimension in the final composite index were also assigned using AHP.
  • Thirdly, the final composite was prepared using a weighted sum statistical equation to aggregate the dimension indices into a composition index.
The livability of the cities was assessed through the development/processing of primary and secondary datasets and spatial indices in a multidimensional approach, which included forty-four factors in the domain of spatial characteristics and demographics, individual well-being, the urban economy, connectivity and infrastructure, quality of life, and the urban environment. A separate analysis of each dimension and indicator was performed, which cumulatively resulted in an overall livability ranking of the cities. The quantification of each indicator was essential, using geostatistical techniques to assess the suitability of the cities. By using the min–max normalization technique, the choice of measurement units was avoided to minimize the dependency on measurement units, thus the data would be normalized or standardized. Such an analysis involves transforming the data so that they fall within a common range of [−1, 1] or [0.0 to 1.0] [39]. The following formula was used to calculate the minimum and maximum normalization [42]:
y i = ( y i m i n ( y ) ) / ( m a x ( y ) m i n ( y ) )
where yi is the current value of the indicator, min(y) represents the minimum value, and max(y) represents the maximum value.
The geometric mean measures the center of the data, which helps in measuring the common point in the dataset. In this research, all the data values were combined by adding and redistributing the data [40].
Following is the formula used to calculate the geometric mean [43]:
( i = 1 n x i ) 1 n = x 1 x 2   x n n
where Π is the geometric mean, n is the number of values, and xi is the value to average [33].
The geometric mean helped us in achieving the mid value of the normalized indicators and gathering the best results for ranking [30]. Thirdly, re-normalization was used to maintain the large variation of prediction, and the renormalization technique was required to make them closer [14]. This technique provided linear transformation of the raw data by maintaining a strong relationship among all variables using the formula mentioned above in (2).

2.3.3. Assigning Weightage to Each Dimension: Analytical Hierarchical Process

We used the analytic hierarchy process (AHP) technique to assign weights to different dimensions of livability in this study. This technique is used to analyze complex decisions using mathematical theorists. AHP has three parts, including the solutions [44] goal, alternatives, and criteria [45]. In this research, data were quantified on the basis of the Likert scale, which helped in determining global weights for each indicator in each dimension [46]. The data were collected from experts through the questionnaire shown in Table 2, which included a scaling questions technique that allows the respondents to answer the questions on a scale with a range of values, i.e., 1–5. The survey helped to identify weights for the final model to rank the livability index of cities.

Structure of Questionnaire

For the pairwise comparison of dimensions, a questionnaire was developed, and the final questions were prepared using the pairwise comparison as shown in Table 2. The structured questionnaire (Table 2) was prepared using Google forms for this research, with almost 15 questions, and was filled by 25 respondents working in reputable private and governmental organizations. The responses to the questionnaire were inserted into the analytical hierarchical model and the global weights were calculated for each dimension. The following combination of questions was prepared for the respondents to evaluate the outcome of this research work.
Using the Likert scale, 1 represents the least importance and 5 is marked as the most important. The 15 questions were added to the questionnaire to assess the importance of the 6 dimensions to experts and decision-makers.
There were six dimensions used in this research study to evaluate the global weights for the livability ranking, i.e., spatial growth and development, individual wellbeing, the urban economy, connectivity and infrastructure, quality of life, and the urban environment. We received responses from 40+ decision makers from different departments, including Transportation, Connectivity, Urban Planning, Infrastructure, Economy, Health, Education, Policy Makers, GIS sector, etc. We determined the degree of importance of each dimension through the results of the AHP model. Each question in the questionnaire was assigned a unique identifier in order to analyze the results accordingly, as shown in Figure 3.
We added all respondents’ weights into the AHP model and assessed the importance of the dimensions.

2.3.4. Composite Livability Index: Aggregation of Dimension Indices into Composite Index

We selected eight major cities of Punjab for the development of the composite livability index. The weighted average statistical analysis was used to average the results and helped to assemble a more accurate picture of the dataset. The importance of the data is determined by the weight assigned to each variable in the dataset. It recognizes certain numbers as more important than others [47]. The weighted sum is described as:
C o m p o s i t e   S c o r e = n = 1 n W i Y i
where Y is the variable and W is the assigned weight of that variable. The summation of the weighted products is called the composite score.

2.3.5. Assigning Weights to Dimensions Using AHP Technique

The AHP technique was used to assign weights to each dimension based on expert opinion [48]. The consistency ratio was also calculated on the basis of the AHP technique, which concluded the ranking of cities. The results of the questionnaire were inserted into the AHP model.
The consistency ratio is marked as the ratio between the given evaluation matrix and the ratio of the random matrix [19]. A consistency ratio smaller than or equal to ten percent defines acceptable inconsistency, whereas a revision in the subjective judgment is required when the consistency ratio is greater than ten percent [20]. The lambda was 6.177, the mean root error value was 26.5%, and the overall Consistency Ratio (CR) was 2.8%, which is most appropriate as per the standard of being less than 5–10%.
According to the result of the AHP model, quality of life (QOL) has the highest weight in terms of the normalized Eigenvector shown in Table 3, whereas the urban environment shows 15.34%, individual well-being shows 16.74%, urban shows 12.33%, and spatial growth was marked as the lowest normalized principal eigenvector. Pairwise matrices helped us in developing the measurements of values in dimensions. The next step was to calculate (lambda) λmax to check the consistency ratio and index for accuracy assessment [21].
The elements were derived from the eigenvector and identified that Aω = λmax, so we obtained an estimation of λmax by dividing the rows of Eigenvalues by the corresponding Eigen element. If any value for λmax is less than n, then there will be an error in estimations [26]. Then, the final step was to calculate the consistency index and consistency ratio.
Consistency ratio = (λmax − n)/(n − 1)
In this study, the AHP model helped in calculating the consistency ratio and prioritized attributes A and B with an overall rating of up to nine [49]. This type of pairwise comparison was performed for all the dimensions in the study area to reach a final matrix. In the next step, relative weights were defined, indicating the importance of the indicators such as operability and value, which was ideally relevant to the problem and named an eigenvector, as shown in Figure 4. The final stage was to calculate the consistency ratio to measure the judgements and conclude the final results.
The dimensions’ weights were calculated through the AHP technique (Figure 5), and the weights were multiplied by the dimension score/value. The final results were concluded in terms of the final livability index for eight cities of Punjab.
The final step was to determine the consistency ratio by using the consistency index for the corresponding value from the matrix of purely random judgements, the upper rows of the matrix, and the lower rows of the index of consistency.
Saaty defined that if the CR value is greater than 0.1 (i.e., 10%), the judgments are at the limit of consistency. If the CR value is greater than 0.1, the pairwise comparison is completely unsuitable [50]. The exercise must be repeated if the CR value is in excess of 0.1 (i.e., 10%) [51]. The overall consistency ratio must be less than 10% and ideally less than 5%. However, the individual questionnaire-level CR value should be lower than 40% (ideally less than 30 %), and values greater than 40% are unacceptable. The overall consistency as per our respondents was 25%, which is less than 30% and quite reasonable. The individual CR values and responses of respondents are shown in Table 4.

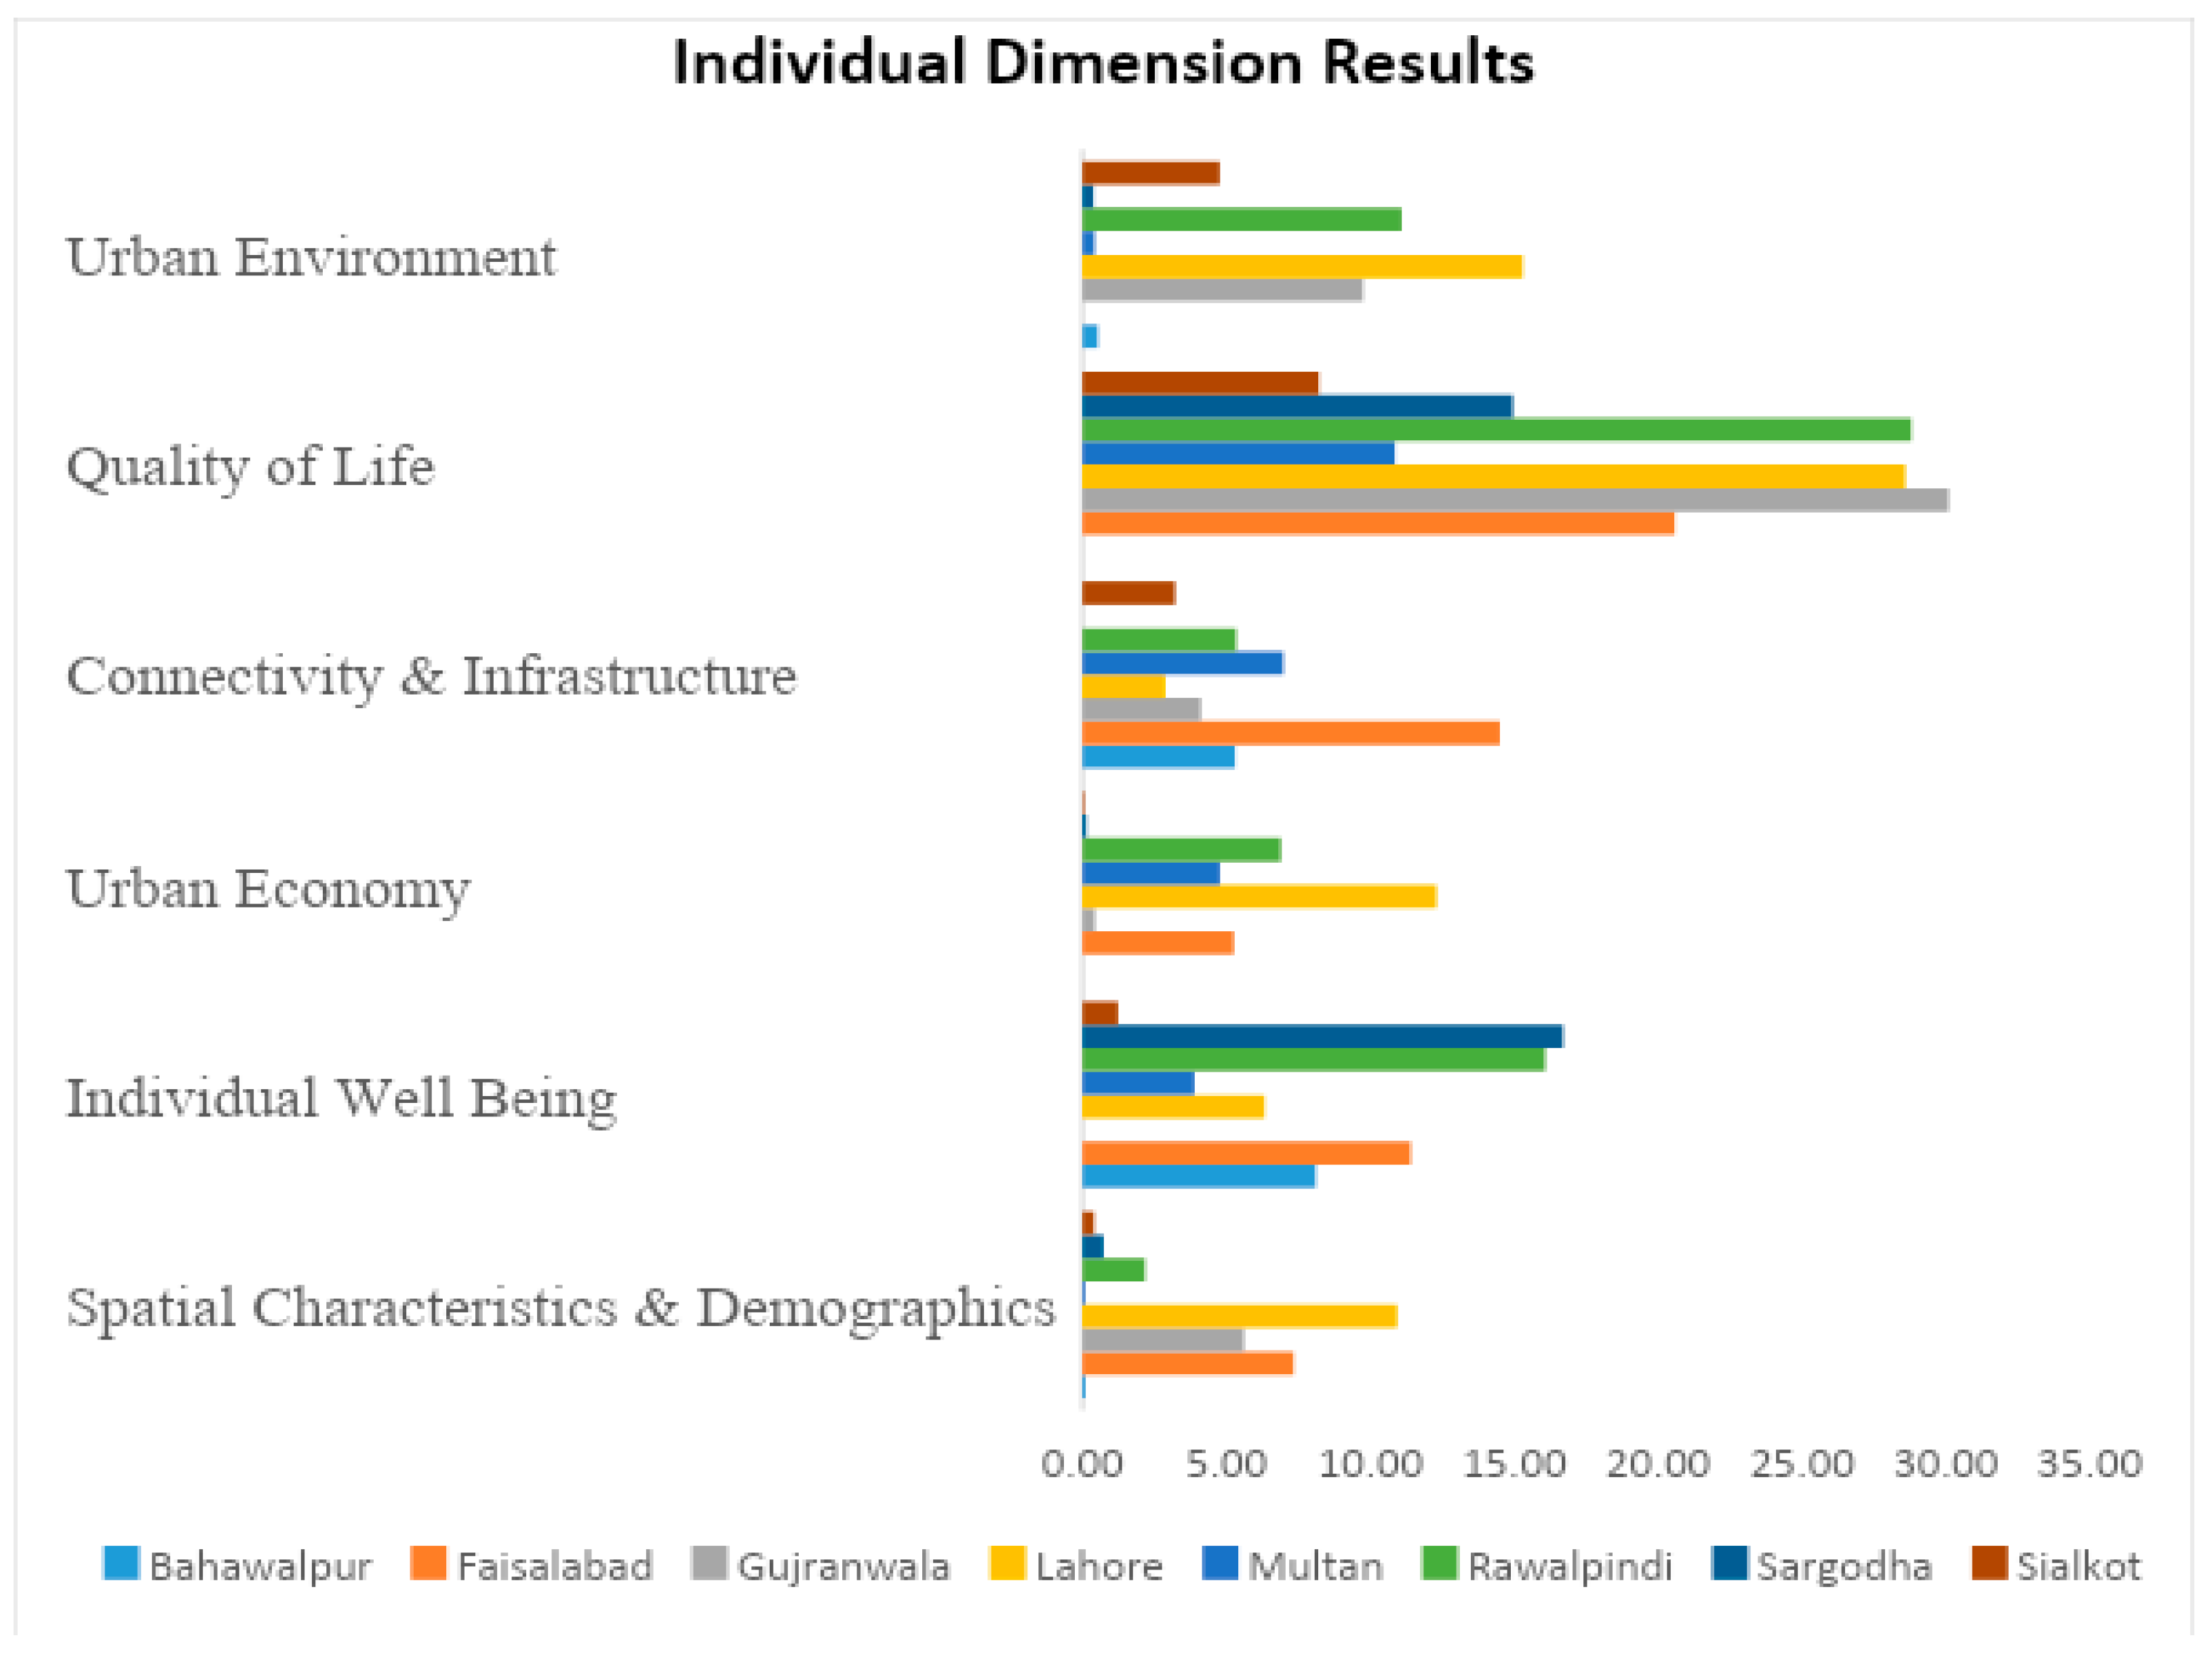
3. Results and Discussions

3.1. Livability and Index Ranking

The renormalized geometrical mean values of all data indicators within ‘spatial characteristics and demographics’ helped to rank cities within the specified domain or theme. The renormalized mean values were 1.0 for Lahore, 0.67 for Faisalabad, 0.51 for Gujranwala, 0.20 for Rawalpindi, 0.01 for Bahawalpur and Multan, 0.04 for Sialkot, and 0.07 for Sargodha. Lahore is the top-ranked city as per spatial characteristics and demographics as it is expanding greatly, with six urban centers in the outer peripheries, which show greater economic activity, and fifty-five percent of the land is planned to have open spaces. The peripheries of Lahore have primary and intermediate cities within the vicinity of 40 km. Finally, the nearest cities in Lahore were found to be equally distributed, so the overall spatial distribution highly promotes economic activities. The lowest-ranked city in this dimension is Bahawalpur, which seems to be due to low expansion rates, lower connectivity with other cities in the region, and 37% planned built-up areas.
In the dimension of individual wellbeing, the cities are ranked as follows: Sargodha (1.0), Rawalpindi (0.96), Faisalabad (0.68), Bahawalpur (0.49), Lahore (0.38), Multan (0.23), Gujranwala (0.00), and Sialkot (0.07). This shows that Sargodha and Rawalpindi are the most suitable in terms of individual wellbeing due to higher percentages of hospitals per 1000 people, an increased ratio of satisfaction from police services, etc. Rawalpindi is located in the vicinity of Islamabad (the federal capital) and has good accessibility to hospitals from Islamabad as well as Rawalpindi itself.
The spatial distribution of hospitals in Lahore shows them to be located on the east central and northeastern sides of Lahore. Most towns in Lahore are either partially or completely covered by health facilities within a distance of 12 km. Most hospitals in the 12 km buffer area did not cover Nishtar town, Iqbal town, Wagha town, Naz town, etc. There is a need to build more hospitals to accommodate chunks of the population as Lahore has the largest population of any city in Punjab.
The ‘Urban Economy’ domain concluded cities to be ranked as Lahore (1.0), Rawalpindi (0.56), Faisalabad (0.43), Multan (0.39), Sargodha (0.01), Gujranwala (0.03), Bahawalpur (0.0), and Sialkot (0.00). Bahawalpur’s and Sialkot’s renormalized values were 0, as both cities are at the lowest scale when ranked amongst the eight largest cities of Punjab. Lahore ranked at the top, serving its citizens with high commercial and industrial activities and a higher number of bank branches per 1000 people. Due to the highest level of commercial and industrial activity, it is used as a magnetic hub and hosted the highest number of migrants (11.60%) over past years. Sialkot was seen to have good commercial activities in sports products, but the migration level was only 0.10, which was considered unsuitable [52].
The final renormalized geometrical mean values of ‘Connectivity and Infrastructure’ helped to rank cities within the domain. In the context of min/max normalized results of all indicators, the renormalization of the geometric mean was calculated, where, in this dimension, Faisalabad is ranked first with 1.0, followed by Multan (0.48), Rawalpindi (0.37), Bahawalpur (0.37), Gujranwala (0.28), Lahore (0.20), Sialkot (0.22), and Sargodha (0.00). Lahore was among the lowest ranked, which seemed to contradict the perception that Lahore has more roads and better infrastructure than other cities. Lahore has good scores in terms of PTAL and dual carriageway roads, but due to its large land area/population and higher reporting of road accidents and fatalities, it resulted in an overall low marking [31]. Faisalabad was ranked first due to the road densities and PTAL index value being high, and the overall connectivity remains better than other observed cities. However, Sargodha was ranked lower due to having the lowest score in overall connectivity and infrastructure, especially in road densities as well as the flight ratio. It was concluded that most of the roads in Lahore were marked as insufficient in quality due to the higher number of lanes, large widths of road segments, and the large number of all-direction intersection points, causing accidents and casualties. Furthermore, a positive impact also exists in the case of Lahore as the PTALs score is good due to the high density of roads for accessibility. As per the latest developments in the research, GIS and remote sensing played a vital role in accurately assessing the livability of various cities. India selected 21 spatial indicators to assess the spatial pattern of Raiganj, and this city showed a 0.75 livability index score, being ranked as the most livable city. The findings of the study recommend that the southern part of the city is the least suitable for living because future expansion will mainly be in the eastern direction of the city. As per the results of the study, despite Lahore being at the top position in multiple indicators and ranked as the most livable city, there are very serious policy implications that future expansion will be more likely towards the southern and northern sides of the city [53]. Therefore, development expenditure on the infrastructure of the southern and northern sides of the city and the urban sprawl must be regulated through land use zoning and better urban planning.
The ‘Quality of Life’ dimension modeling assessed Gujranwala as the best city as it produced a score of 1.0 because almost 100% of the population of Gujranwala has access to basic health and education facilities. The other observed cities were ranked in the following order: Rawalpindi (0.96), Lahore (0.95), Faisalabad (0.68), Sargodha (0.50), Multan (0.36), Sialkot (0.27), and Bahawalpur (0.00). The results showed that Gujranwala’s score was the highest because of the literate population, as well as health facilities, and the quality-of-life standards were high with respect to other observed cities. Lahore has the highest value of nightlight flux, while Bahawalpur is considered to be the lowest ranked due to the illiteracy and low percentage of the population that has access to educational institutes. Gujranwala has better access to the health facilities, as most of the facilities are within reach of the residents.
Under the dimension of ‘Urban Environment’, Lahore is at the top with a score of 1.0 followed by Rawalpindi (0.72), Gujranwala (0.64), Sialkot (0.31), Bahawalpur (0.04), Multan (0.03), Sargodha (0.02), and Faisalabad (0.00). Lahore has more green areas (46%). The research identified that the average PM2.5 concentrations were higher in other cities than that of Lahore. The quality of ambient air in Faisalabad deteriorated beyond the safe limits defined by the World Health Organization [54]. The air quality PM2.5 was reported as poor in Faisalabad as compared to Lahore but the NO2 levels were extremely unsuitable in both cities.
In this study, Lahore was ranked the best city in the livability ranking, due to high scores in various positive factors. Lahore is marked as a big city due to the high rate of migration from other cities to Lahore. Some studies show that Lahore has the highest employment rates, which attracts migrants from other cities to come and work in Lahore. Better-quality hospitals are available as compared to other cities where accessibility is appropriate but the quality of the services is marked as poor. Gujranwala, Sialkot, Bahawalpur, and other cities do not have proper sanitation facilities while many studies proved that 59% of built-up areas in Lahore have good-quality sanitation facilities. The results determined that the overall urban environment of Lahore is worse than other observed cities. The dimension-based results were also measured, as shown in Figure 6.

3.2. Composite Livability Score

The final composite score extracted using AHP and the weighted sum technique concluded that Lahore is the most livable city as the livability score is the highest. The estimated final composite livability index is shown in Table 5.
This study defines a final composite livability index, and the absolute suitability for each city has been identified and the cities are ranked accordingly. The livability analysis on the basis of all dimensions shows that Lahore is ranked first with a maximum score of 76.31. Lahore is followed by Rawalpindi (70.39) and Faisalabad (59.08), whereas Sialkot (17.90) is seventh and Bahawalpur achieved the lowest score (14.06). The overall assessment shows that Bahawalpur is the lowest-ranked city in the estimated city ranking.
The present study also estimated the urban sprawl and urban extent of the eight largest cities of Punjab. For the Lahore metropolitan area, major expansion is observed on the northern side towards Shahdara and southwards towards Gajjumata along Ferozepur Road.
The results highlighted the percentage of planned land that exists in each study area and found that the planned built-up percentage for Rawalpindi is 58, Lahore is 55, Sargodha is 55, Faisalabad is 45, Bahawalpur is 37, Gujranwala is 34, Multan is 31, and Sialkot is 27. Similarly, it was also revealed by the results that Lahore, one of the largest metropolitan areas of Pakistan, has 20% of the land that is in the category open land. This might be due to the planned developments of DHA and Cantonment areas, which contribute a major chunk of the land of Lahore City.
If we look at the top-ranked city in particular, i.e., Lahore, then it becomes evident that the high standing of Lahore is in terms of ‘spatial characteristics and demography’, ‘urban economy’, and ‘urban environment’, whereas Lahore is ranked in the middle in terms of ‘quality of life’ and ‘individual well-being’. In terms of ‘connectivity and infrastructure’, Lahore is ranked last overall.
Similarly, Rawalpindi is ranked the second-best city with regard to the livability ranking in Punjab. The main contributing factors for Rawalpindi city are ‘individual well-being’, ‘urban economy’, and ‘urban environment’. However, Rawalpindi is ranked in the middle in terms of ‘connectivity and infrastructure’ and ‘spatial characteristics and demography’.
The overall ranking of Faisalabad is third in the livability index. The worst dimension, which brings this city down, is ‘Urban Environment’ as Faisalabad is at the bottom in terms of environment ranking as compared to the rest of the cities. However, Faisalabad is the best in terms of ‘connectivity and infrastructure’ as compared to the rest of the seven largest cities in Punjab. Similarly, the city is ranked second in terms of ‘spatial characteristics and demographics’. However, Faisalabad is ranked in the middle with regard to ‘individual well-being’, ‘urban economy’, and ‘quality of life’.
Gujranwala is ranked fourth in the livability standings in Punjab. The worst dimension, which pushed this city down, is ‘Individual Wellbeing’ as Gujranwala is at the bottom in terms of individual wellbeing as compared to the rest of the seven cities. Other dimensions that are poor in Gujranwala include ‘urban economy’ and ‘connectivity and infrastructure’. However, Gujranwala is the best in terms of ‘quality of life’ as compared to the rest of the seven large cities in Punjab. However, Gujranwala is ranked in the middle with regard to ‘spatial characteristics’ and ‘urban environment’. These findings highlight that ‘individual wellbeing’ is a high-priority area, which needs the utmost attention of urban planners and city administration, followed by ‘connectivity and infrastructure’ and ‘urban economy’.
Sargodha is ranked fifth in terms of livability in Punjab. The worst dimension, which pushed this city down, is ‘connectivity and infrastructure’ as Sargodha is at the bottom in terms of connectivity and infrastructure as compared to the rest of the cities. Similarly, the ‘urban environment’ is the second-worst factor in Sargodha. Despite these poor performances in these two dimensions, Sargodha is ranked best in terms of ‘individual wellbeing’. However, Sargodha is ranked poor with regards to ‘spatial characteristics, ‘urban economy’, and ‘quality of life’. This finding highlights that ‘connectivity and infrastructure’ and ‘urban environment’ are the high-priority areas that need the utmost attention of planners and policy-makers, followed by ‘spatial characteristics, ‘urban economy’, and ‘quality of life’.
Multan ranked sixth in livability in Punjab. The worst dimension, which pushed this city down, is ‘spatial characteristics and demographics’ as Multan is at the bottom in terms of spatial characteristics’ as compared to the rest of the cities. However, Multan is relatively better in terms of ‘connectivity and infrastructure’. Multan is ranked poorly with regards to ‘individual wellbeing’, ‘urban environment ‘, and ‘quality of life’. These findings highlight that ‘spatial characteristics’ is a high-priority area that needs the keen attention of planners and policy-makers, followed by ‘individual wellbeing’, ‘urban environment‘, and ‘quality of life’.
Sialkot ranked seventh in terms of livability in Punjab. The worst dimensions, which pushed this city down, are ‘individual wellbeing’, ‘urban economy’, and ‘quality of life’ as Sialkot is the second-worst in terms of these themes as compared to the rest of the cities. However, Multan is comparatively moderate in terms of ‘urban environment’. Multan is ranked poorly with regards to ‘spatial characteristics’ and ‘connectivity and infrastructure’. These findings highlight that almost all areas of the livability index need attention in terms of policy intervention in Sialkot.
Bahawalpur is ranked eighth in terms of livability in Punjab. The worst dimensions, which pushed this city down, are ‘urban economy’ and ‘quality of life’ as Bahawalpur is ranked worst (eighth position) in terms of these dimensions, as compared to the rest of the cities. However, Bahawalpur is comparatively moderate in terms of ‘individual wellbeing’ and ‘connectivity and infrastructure’. Bahawalpur City is also ranked poorly with regards to ‘urban environment’. These findings highlight that almost all areas of the livability index need attention for policy intervention in Bahawalpur.

4. Conclusions

The present study investigated and analyzed the livability of selected cities in Punjab, i.e., Lahore, Rawalpindi, Gujranwala, Faisalabad, Multan, Sargodha, Sialkot, and Bahawalpur. The aim was to rank the cities based on multiple geospatial indicators and dimensions, which can be used as the main reference for the planning and management of cities. The livability index was defined by considering a wide range of indicators in six dimensions, namely spatial characteristics and demographics, individual wellbeing, the urban economy, connectivity and infrastructure, quality of life, and the urban environment. The Analytical Hierarchical Process (AHP) technique was implemented to assign weights to each of the dimensions in the composite index. Geo-spatial and geostatistical tools and techniques were applied for spatial data development and analysis. A composite livability index and the absolute suitability for each city were identified, and the cities were ranked, which resulted in Lahore city being ranked first with a maximum score of 76.31, followed by Rawalpindi (70.39) and Faisalabad (59.08), whereas Sialkot (17.90) was ranked seventh and Bahawalpur produced the lowest score (14.06). The final evaluations depict that Bahawalpur is ranked lowest of the observed cities. Therefore, a serious focus on Bahawalpur City is required to facilitate the people of Bahawalpur to reach better living standards.
The current study suggests significant implications for decision-makers. Similar to other ranking systems, this study not only provided results that are not surprising but also highlighted the areas that should be considered to improve the performance of cities. It helped in highlighting the disparities among cities through a multidimensional analysis. A transparent and inclusive strategy should be devised to reduce disparities in local government budget allocations for interventions. Cities that are lagging behind in all dimensions and in the composite index include Sialkot and Bahawalpur. These cities shall be given priority for future investments.
These are the policy recommendation for future interventions.
Therefore, serious attention from policy-makers and planners is required towards Bahawalpur City in order to facilitate the people of Bahawalpur to meet a better living standard.
Thus, the study recommends that, despite the highest ranking for Lahore on the livability ladder, it must address the issue of connectivity and traffic congestion and per capita needs of public infrastructure for the growing mega metropolitan city of over 10 million people. In addition, areas of ‘quality of life’ and ‘individual well-being’ also require the attention of policy-makers and planners to retain the city’s position with regard to ‘livability’. This finding also highlights that infrastructure, individual wellbeing, and quality of life are not able to keep up with the rapidly growing population coupled with the internal migration towards this provincial capital.
Thus, the study recommends that Rawalpindi city’s administration must address the issue of connectivity and traffic congestion and per capita needs of the public infrastructure for this growing mega metropolitan city of over 10 million people, as well as also focusing on improving the ‘spatial characteristic’ of the city. In addition, the rest of the dimensions also require the attention of policy-makers and planners to retain the city’s position regarding ‘livability’.
Access to a livable environment and conditions of the masses in each city of the country are of supreme importance. This study has provided a true picture of cities through data and also provided a relative benchmarking of cities under various dimensions. It should be implemented by the local governments of Punjab. The study was designed in a manner such that it can be replicated in different cities and regions. However, the selection of indicators would be based on the availability of data and their relevance to the livable conditions of the cities/regions.
The study is unique in nature as it included micro-level geospatial data of cities, making it possible to understand the indicators that generally affect livability. Such a composite ranking of cities based on the different dimensions of livability needs to be conducted every five years to enhance competitive improvements and allow city management to celebrate their ranking on these indexes. The city governments (at metropolitan, Municipal Corporation, and municipal committee levels) must be empowered, and an economic unit should be formed at these levels for data collection, analysis, and dissemination. The aim should be to achieve better overall performance and improved livability and quality of life in cities, which cannot be achieved solely depending on a single indicator, but rather a multi-pronged strategy is required to improve multidimensionality.

5. Limitation and Future Scope

As the scope of this study, we have concluded that Lahore is the top-ranked city to live in whereas Bahawalpur ranked last of all eight cities. Governments may make policies based on the current situation of services and issues highlighted in this study for making poor cities livable. The development of livable cities involves causal relationships among the various parameters. A lack of adequate data, reservations of stakeholders in explaining the true situation of people, the environment, governance, and living conditions are said to be the major limitations of the model. It is important to add all dimensions mentioned in this study, which must be included in future modeling to assess cities’ conditions in a timely manner. Mostly, the data in Punjab Pakistan are available only for administrative boundaries (i.e., district or sub-district/tehsil levels) and not at the city-boundaries level. The non-availability of data on a city level is also a major constraint due to which only eight major cities could be considered for this study.

Supplementary Materials

The following supporting information can be downloaded at: https://www.mdpi.com/article/10.3390/su14148755/s1. The supporting information will be provided upon request.

Author Contributions

U.S. contributed to the development of conceptual design, analysis, and writing and in all aspects of research. S.R.A. supervised overall and reviewed this research work. G.M.-u.-d. contributed to design of the composite index model, application of the AHP approach, and editing of the manuscript. H.J.B. contributed to drafting and writing of the manuscript and preparation of maps and graphs. U.A. reviewed and improved the initial draft of the manuscript. All authors have read and agreed to the published version of the manuscript.

Funding

This research received no external funding.

Institutional Review Board Statement

Not applicable.

Informed Consent Statement

Not applicable.

Data Availability Statement

All relevant data are available and included in the paper and supporting files are ready to publish.

Acknowledgments

Authors are greatly thankful to the Urban Unit, Government of the Punjab for the support throughout the conduct of the study. The Urban Unit provided data and technical input for the conduct of the study which is greatly acknowledged by the authors. We would also like to thank the Punjab Disaster Management Authority, World Wildlife Fund for Nature (WWF-Pakistan), Health Department Punjab, Pakistan Bureau of Statistics and all open-source data platforms (quoted in this research document) for providing the data, without which, this study could not be possible.

Conflicts of Interest

The authors declare no conflict of interest.

References

  1. Okulicz-Kozaryn, A. City life: Rankings (livability) versus perceptions (satisfaction). Soc. Indic. Res. 2013, 110, 433–451. [Google Scholar] [CrossRef]
  2. Brown, G.G.; Pullar, D.V. An evaluation of the use of points versus polygons in public participation geographic information systems using quasi-experimental design and Monte Carlo simulation. Int. J. Geogr. Inf. Sci. 2012, 26, 231–246. [Google Scholar] [CrossRef]
  3. Kashef, M. Urban livability across disciplinary and professional boundaries. Front. Archit. Res. 2016, 5, 239–253. [Google Scholar] [CrossRef] [Green Version]
  4. Burt, J.E.; Barber, G.M.; David, L.R. Elementary Statistics for Geographers, 3rd ed.; Guilford Press: New York, NY, USA, 2009; pp. 1–653. [Google Scholar]
  5. Clark, P.J.; Evans, F.C. Distance to Nearest Neighbor as a Measure of Spatial Relationships in Populations. Ecology 1954, 35, 445–453. [Google Scholar] [CrossRef]
  6. Fairbairn, D.; Al-Bakri, M. Using geometric properties to evaluate possible integration of authoritative and volunteered geographic information. ISPRS Int. J. Geo-Inf. 2013, 2, 349–370. [Google Scholar] [CrossRef] [Green Version]
  7. Faka, A. Assessing Quality of Life Inequalities. A Geographical Approach. ISPRS Int. J. Geo-Inf. 2020, 9, 600. [Google Scholar] [CrossRef]
  8. Pacione, M. Urban environmental quality and human wellbeing—A social geographical perspective. Landsc. Urban Plan. 2003, 65, 19–30. [Google Scholar] [CrossRef]
  9. Lovell, R.; Wheeler, B.W.; Higgins, S.L.; Irvine, K.N.; Depledge, M.H. A systematic review of the health and well-being benefits of biodiverse environments. J. Toxicol. Environ. Health. Part B Crit. Rev. 2014, 17, 1–20. [Google Scholar] [CrossRef] [Green Version]
  10. Balsas, C.J. Measuring the livability of an urban centre: An exploratory study of key performance indicators. Plan. Pract. Res. 2004, 19, 101–110. [Google Scholar] [CrossRef]
  11. Blomquist, G.C.; Berger, M.C.; Hoehn, J.P. New estimates of quality of life in urban areas. Am. Econ. Rev. 1988, 78, 89–107. [Google Scholar]
  12. Chabuk, A.J.; Al-Ansari, N.; Hussain, H.M.; Knutsson, S.; Pusch, R. GIS-based assessment of combined AHP and SAW methods for selecting suitable sites for landfill in Al-Musayiab Qadhaa, Babylon, Iraq. Environ. Earth Sci. 2017, 76, 209. [Google Scholar] [CrossRef] [Green Version]
  13. Antognelli, S.; Vizzari, M. Landscape liveability spatial assessment integrating ecosystem and urban services with their perceived importance by stakeholders. Ecol. Indic. 2017, 72, 703–725. [Google Scholar] [CrossRef]
  14. Giffinger, R.; Fertner, C.; Kramar, H.; Meijers, E. City-ranking of European medium-sized cities. Cent. Reg. Sci. Vienna UT 2007, 9, 1–12. [Google Scholar]
  15. Faircloth, C.A. Epilepsies, identities, and difference: Horizons of meaning for individuals with an epilepsy. Qual. Health Res. 1998, 8, 602–617. [Google Scholar] [CrossRef]
  16. Walljasper, J. A quest for jobs in San Antonio. Nation 1997, 265, 30–32. [Google Scholar]
  17. Ruth, M.; Franklin, R.S. Livability for all? Conceptual limits and practical implications. Appl. Geogr. 2014, 49, 18–23. [Google Scholar] [CrossRef] [Green Version]
  18. Paul, A. Developing a methodology for assessing livability potential: An evidence from a metropolitan urban agglomeration (MUA) in Kolkata, India. Habitat Int. 2020, 105, 102263. [Google Scholar] [CrossRef]
  19. Cipollone, A.; Patacchini, E.; Vallanti, G. Female labour market participation in Europe: Novel evidence on trends and shaping factors. IZA J. Eur. Labor Stud. 2014, 3, 18. [Google Scholar] [CrossRef] [Green Version]
  20. Anselin, L. Local indicators of spatial association—LISA. Geogr. Anal. 1995, 27, 93–115. [Google Scholar] [CrossRef]
  21. Pandey, R.U.; Garg, Y.K.; Bharat, A. Understanding qualitative conceptions of livability: An Indian perspective. Int. J. Res. Eng. Technol. 2013, 2, 374–380. [Google Scholar]
  22. Azapagic, A.; Perdan, S. Indicators of sustainable development for industry: A general framework. Process Saf. Environ. Prot. 2000, 78, 243–261. [Google Scholar] [CrossRef]
  23. Elvidge, C.D.; Baugh, K.; Zhizhin, M.; Hsu, F.C.; Ghosh, T. VIIRS night-time lights. Int. J. Remote Sens. 2017, 38, 5860–5879. [Google Scholar] [CrossRef]
  24. Ellis, P.; Roberts, M. Leveraging Urbanization for Greater Prosperity and Livability. 2015. Available online: https://openknowledge.worldbank.org/bitstream/handle/10986/22549/9781464806629.pdf?sequence=4 (accessed on 2 February 2022).
  25. Franek, J.; Kresta, A. Judgment scales and consistency measure in AHP. Procedia Econ. Financ. 2014, 12, 164–173. [Google Scholar] [CrossRef] [Green Version]
  26. Zhan, D.; Kwan, M.P.; Zhang, W.; Fan, J.; Yu, J.; Dang, Y. Assessment and determinants of satisfaction with urban livability in China. Cities 2018, 79, 92–101. [Google Scholar] [CrossRef]
  27. Stević, S. International Encyclopedia of Statistical Science; Lovric, M., Ed.; Springer: Berlin/Heidelberg, Germany, 2011; pp. 608–609. [Google Scholar] [CrossRef]
  28. Hasan, A. Migration, small towns and social transformations in Pakistan. Environ. Urban. 2010, 22, 33–50. [Google Scholar] [CrossRef]
  29. Haseeb, A.; Saleemi, A.; Haseeb, Z.; Amin, S.; Islam, H.S. Spatial Analysis for the Identification of High-Risk Locations of Road Accidents with Pedestrian Fatalities in Lahore. Pak. J. Sci. 2018, 70, 317. [Google Scholar]
  30. Kovacs-Györi, A.; Cabrera-Barona, P.; Resch, B.; Mehaffy, M.; Blaschke, T. Assessing and representing livability through the analysis of residential preference. Sustainability 2019, 11, 4934. [Google Scholar] [CrossRef] [Green Version]
  31. Giap, T.K.; Thye, W.W.; Aw, G. A new approach to measuring the liveability of cities: The Global Liveable Cities Index. World Rev. Sci. Technol. Sustain. Dev. 2014, 11, 176–196. [Google Scholar] [CrossRef] [Green Version]
  32. Li, L.; Zhong, S.; Guo, F.; Guo, X.; Guo, X. Paying for the quality of life: The impacts of urban livability on CEO compensation. Habitat Int. 2021, 116, 102416. [Google Scholar] [CrossRef]
  33. Patro, S.G.K.; Sahu, K.K. Normalization: A Preprocessing Stage. Int. Adv. Res. J. Sci. Eng. Technol. 2015, 2, 20–22. [Google Scholar] [CrossRef]
  34. Sieber, R. Public participation geographic information systems: A literature review and framework. Ann. Assoc. Am. Geogr. 2006, 96, 491–507. [Google Scholar] [CrossRef]
  35. Arksey, H.; O’Malley, L. Scoping studies: Towards a methodological framework. Int. J. Soc. Res. Methodol. 2005, 8, 19–32. [Google Scholar] [CrossRef] [Green Version]
  36. Lee, H.G.; Lee, J.H. A Study on the Spatial Characteristics Analysis of the Urban Public Space, applying a Pattern Language. J. Korea Acad. Ind. Coop. Soc. 2015, 16, 5608–5618. [Google Scholar]
  37. Veefkind, J.P.; Aben, I.; McMullan, K.; Förster, H.; De Vries, J.; Otter, G.; Claas, J.; Eskes, H.J.; De Haan, J.F.; Kleipool, Q.; et al. TROPOMI on the ESA Sentinel-5 Precursor: A GMES mission for global observations of the atmospheric composition for climate, air quality and ozone layer applications. Remote Sens. Environ. 2012, 120, 70–83. [Google Scholar] [CrossRef]
  38. Malczewski, J. Multiple Criteria Decision Analysis and Geographic Information Systems. In Trends in Multiple Criteria Decision Analysis; Ehrgott, M., Figueira, J., Greco, S., Eds.; Springer: Boston, MA, USA, 2010; pp. 369–395. [Google Scholar]
  39. Henderi, H.; Wahyuningsih, T.; Rahwanto, E. Comparison of Min-Max normalization and Z-Score Normalization in the K-nearest neighbor (kNN) Algorithm to Test the Accuracy of Types of Breast Cancer. Int. J. Inform. Inf. Syst. 2021, 4, 13–20. [Google Scholar] [CrossRef]
  40. Soleymani, F.; Sharifi, M.; Shateyi, S.; Khaksar Haghani, F. An algorithm for computing geometric mean of two Hermitian positive definite matrices via matrix sign. Abstr. Appl. Anal. 2014, 2014, 978629. [Google Scholar] [CrossRef]
  41. Mushtaha, E.; Alsyouf, I.; Al Labadi, L. Application of AHP and a mathematical index to estimate livability in tourist districts: The case of Al Qasba in Sharjah. Front. Archit. Res. 2020, 9, 872–889. [Google Scholar] [CrossRef]
  42. Thomas, M.R. A GIS-based decision support system for brownfield redevelopment. Landsc. Urban Plan. 2002, 58, 7–23. [Google Scholar] [CrossRef]
  43. Yin, Z.; Wu, Y.; Jin, Z.; Zhang, X. Research on livable community evaluation based on GIS. Proc. IOP Conf. Ser. Earth Environ. Sci. 2018, 108, 042075. [Google Scholar] [CrossRef] [Green Version]
  44. Vitianingsih, A.; Choiron, A.; Cahyono, D.; Suyanto, S. Weighted Sum Model for Spatial Analysis in Classification of Areas Prone to Diphtheria Tetanus. In Proceedings of the 1st Asian Conference on Humanities, Industry, and Technology for Society, Surabaya, Indonesia, 30–31 July 2019. [Google Scholar]
  45. Saaty, T.L.; Vatgas, L.G. Methods, Models, Concepts & Applications of the Analytic Hierarchy Process; Springer Science and Business Media: New York, NY, USA, 2012. [Google Scholar] [CrossRef]
  46. Basu, T.; Das, A.; Pereira, P. Urban livability index assessment based on land-use changes in an Indian medium-sized city (Raiganj). Geocarto Int. 2021, 1–25. [Google Scholar] [CrossRef]
  47. Al-Hanbali, A.; Alsaaideh, B.; Kondoh, A. Using GIS-based weighted linear combination analysis and remote sensing techniques to select optimum solid waste disposal sites within Mafraq city, Jordan. J. Geogr. Inf. Syst. 2011, 3, 267–278. [Google Scholar] [CrossRef] [Green Version]
  48. Badland, H.; Whitzman, C.; Lowe, M.; Davern, M.; Aye, L.; Butterworth, I.; Hes, D.; Giles-Corti, B. Urban liveability: Emerging lessons from Australia for exploring the potential for indicators to measure the social determinants of health. Soc. Sci. Med. 2014, 111, 64–73. [Google Scholar] [CrossRef] [PubMed]
  49. Marshall, W.E. An evaluation of livability in creating transit-enriched communities for improved regional benefits. Res. Transp. Bus. Manag. 2013, 7, 54–68. [Google Scholar] [CrossRef]
  50. Fotheringham, A.S.; Brunsdon, C.; Charlton, M. Geographically Weighted Regression and Associated Techniques; Wiley: Chichester, UK, 2002; pp. 1–288. [Google Scholar]
  51. Leach, J.M.; Lee, S.E.; Hunt, D.V.; Rogers, C.D. Improving city-scale measures of livable sustainability: A study of urban measurement and assessment through application to the city of Birmingham, UK. Cities 2017, 71, 80–87. [Google Scholar] [CrossRef]
  52. Fu, B.; Yu, D.; Zhang, Y. The livable urban landscape: GIS and remote sensing extracted land use assessment for urban livability in Changchun proper, China. Land Use Policy 2019, 87, 104048. [Google Scholar] [CrossRef]
  53. Liu, J.; Nijkamp, P.; Huang, X.; Lin, D. Urban livability and tourism development in China: Analysis of sustainable development by means of spatial panel data. Habitat Int. 2017, 68, 99–107. [Google Scholar] [CrossRef]
  54. Onnom, W.; Tripathi, N.; Nitivattananon, V.; Ninsawat, S. Development of a liveable city index (LCI) using multi criteria geospatial modelling for medium class cities in developing countries. Sustainability 2018, 10, 520. [Google Scholar] [CrossRef] [Green Version]
Figure 1. (a) Map of Punjab, Pakistan showing the eight selected cities for this study. (b) Eight cities with areas in square kilometer.
Sustainability 14 08755 g001
Figure 2. A comprehensive evaluation framework for livability.
Sustainability 14 08755 g002
Figure 3. Percentages of responses for all indicators.
Sustainability 14 08755 g003
Figure 4. Consistency matrix for all dimensions.
Sustainability 14 08755 g004
Figure 5. Weights as per AHP.
Sustainability 14 08755 g005
Figure 6. Dimension-based results extracted by AHP and weighted sum technique.
Sustainability 14 08755 g006
Table 1. Citation of dimensions in research publications.
IndicatorRelevant References
Spatial Characteristics[19,20,21,22,23,24,25]
Individual Wellbeing[26,27]
Urban Economy[28]
Connectivity and Infrastructure[29,30]
Quality of life[31]
Urban Environment[27,32,33,34]
Table 2. Millennial questionnaire form.
Dimensions of Livability of CitiesPreferred Indicator
(A or B)
Scoring of Preferred Indicator
ABLess ImportantMore Important
Spatial Growth and DevelopmentIndividual Wellbeing Sustainability 14 08755 i001
Spatial Growth and DevelopmentUrban Economy Sustainability 14 08755 i001
Spatial Growth and DevelopmentConnectivity and Infrastructure Sustainability 14 08755 i001
Spatial Growth and DevelopmentQuality of Life Sustainability 14 08755 i001
Spatial Growth and DevelopmentUrban Environment Sustainability 14 08755 i001
Individual WellbeingUrban Economy Sustainability 14 08755 i001
Individual WellbeingConnectivity and Infrastructure Sustainability 14 08755 i001
Individual WellbeingQuality of1 Life Sustainability 14 08755 i001
Individual WellbeingUrban Environment Sustainability 14 08755 i001
Urban EconomyConnectivity and Infrastructure Sustainability 14 08755 i001
Urban EconomyQuality of Life Sustainability 14 08755 i001
Urban EconomyUrban Environment Sustainability 14 08755 i001
Connectivity and InfrastructureQuality of Life Sustainability 14 08755 i001
Connectivity and InfrastructureUrban Environment Sustainability 14 08755 i001
Quality of LifeUrban environment Sustainability 14 08755 i001
Table 3. Final Eigenvalue and consistency ratio of respondents through AHP.
n =6Number of Criteria (2 to 10) Scale:1 AHP 1-9
n =20Number of Participants (1 to 20)α:0.1 Consensus: 48.0%
p =0Selected Participant (0 = consol.)27 Consolidated
Date Thresh:1 × 10⁻⁸ Iterations:5 EVM check:1.4 × 10⁻⁹
Criterion Weights+/−
1Spatial Gr & DevSpatial Growth and Development10.9%1.9%###
2Individual WellbeingIndividual Wellbeing16.7%4.5%###
3Urban EconomyUrban Economy12.3%2.5%###
4Connectivity & InfConnectivity & Infrastructure14.5%5.2%###
5Quality of LifeQuality of Life30.1%9.9%###
6Urban Env Urban Environment15.3%3.2%###
Result Eigenvalue Lambda:6.177 MRE:26.5%
Consistency Ratio0.37GCI:0.11Psi:26.7%CR:2.8% MRE est26.6%
Table 4. Responses and consistency ratio values.
Participant 1
α: 0.1CR: 25%
NameWeightDate Consistency Ratio
CriteriaMore Important?Scale
iiA BA or B(1–9)
12Spatial Gr & Dev Sustainability 14 08755 i002Individual WellbeingB7
13Urban EconomyB9
14Connectivity & InfB53
15Quality of LifeB7
16Urban EnvA71
17 B7
18 A7
23Individual Wellbeing Sustainability 14 08755 i003Urban EconomyB7
24Connectivity & InfA72
25Quality of LifeB4
26Urban EnvA5
27
28
34Urban Economy Sustainability 14 08755 i004Connectivity & InfA5
35Quality of LifeA5
36Urban EnvA9
37
38
45Connectivity & Inf Sustainability 14 08755 i005Quality of LifeB7
46Urban EnvA7
47
48
56Quality of Life Sustainability 14 08755 i006Urban EnvA4
57
58
Table 5. Final composite score.
CitySpatial Characteristics and DemographicsWeightages 10.9%Individual Well Being-Weightages 16.7%Urban EconomyWeightages 12.3%Connectivity and Infrastructure Weightages 14.5%Quality of Life Weightages 30.1%Urban EnvironmentWeightages 15.3%Final Livability Score
Bahawalpur0.010.110.498.110.000.000.375.300.000.000.040.5414.06
Faisalabad0.677.3 40.6811.410.435.261.0014.500.6820.580.000.0059.08
Gujranwala0.515.610.000.000.030.430.284.111.0030.100.649.7550.00
Lahore1.0010.930.386.331.0012.300.202.860.9528.591.0015.3076.31
Multan0.010.090.233.890.394.770.486.980.3610.860.030.4227.01
Rawalpindi0.202.180.9616.080.566.890.375.340.9628.800.7211.0970.39
Sargodha0.070.731.0016.700.010.140.000.000.5014.960.020.3832.90
Sialkot0.040.400.071.230.000.060.223.220.278.220.314.7717.90
Publisher’s Note: MDPI stays neutral with regard to jurisdictional claims in published maps and institutional affiliations.

