Heterogeneity in the Causal Link between FDI, Globalization and Human Capital: New Empirical Evidence Using Threshold Regressions
Abstract
:1. Introduction
2. Literature Review
3. The Data and Statistical Sources
4. The Model
5. Results and Discussion
6. Conclusions
7. Policy Implications
Author Contributions
Funding
Institutional Review Board Statement
Informed Consent Statement
Data Availability Statement
Conflicts of Interest
References
- Naval, J.; Silva, J.I.; Vázquez-Grenno, J. Employment effects of on-the-job human capital acquisition. Labour Econ. 2020, 67, 101937. [Google Scholar] [CrossRef]
- You, S.; Zhou, K.Z.; Jia, L. How does human capital foster product innovation? The contingent roles of industry cluster features. J. Bus. Res. 2021, 130, 335–347. [Google Scholar] [CrossRef]
- Bosi, S.; Lloyd-Braga, T.; Nishimura, K. Externalities of human capital. Math. Soc. Sci. 2021, 112, 145–158. [Google Scholar] [CrossRef]
- Yu, M.; Deng, X. The Inheritance of Marketization Level and Regional Human Capital Accumulation: Evidence from China. Finance Res. Lett. 2021, 43, 102268. [Google Scholar] [CrossRef]
- Balmaceda, F. A failure of the market for college education and on-the-job human capital. Econ. Educ. Rev. 2021, 84, 102165. [Google Scholar] [CrossRef]
- World Bank. The World Bank Annual Report Washington, DC: World Bank. © World Bank. License: CC BY-NC-ND 3.0 IGO. Available online: https://openknowledge.worldbank.org/handle/10986/30326 (accessed on 31 May 2022).
- World Bank. Learning to Realize Education´s Promise. International Bank for Reconstruction and Development. The World Bank 1818 H Street NW, Washington, DC 20433. Available online: www.worldbank.org (accessed on 31 May 2022).
- Backer, B.; Ghazanchyan, M.; Ho, A.; Nanda, V. La Falta de Capital Humano Está Frenando el Crecimiento Económico de América Latina; IMF Western Hemisphere Department: Washington, DC, USA, 2020. [Google Scholar]
- Ascani, A.; Balland, P.-A.; Morrison, A. Heterogeneous foreign direct investment and local innovation in Italian Provinces. Struct. Chang. Econ. Dyn. 2019, 53, 388–401. [Google Scholar] [CrossRef]
- Dong, Z.; Miao, Z.; Zhang, Y. The impact of China’s outward foreign direct investment on domestic innovation. J. Asian Econ. 2021, 75, 101307. [Google Scholar] [CrossRef]
- Ibarra-Olivo, J.E. Foreign direct investment and youth educational outcomes in Mexican municipalities. Econ. Educ. Rev. 2021, 82, 102123. [Google Scholar] [CrossRef]
- Li, J.; Lu, Y.; Song, H.; Xie, H. Long-term impact of trade liberalization on human capital formation. J. Comp. Econ. 2019, 47, 946–961. [Google Scholar] [CrossRef]
- Wang, W.; Thangavelu, S.; Lin, F. Global value chains, firms, and wage inequality: Evidence from China. China Econ. Rev. 2021, 66, 101585. [Google Scholar] [CrossRef]
- Liu, A.; Gu, X. Environmental Regulation, Technological Progress and Corporate Profit: Empirical Research Based on the Threshold Panel Regression. Sustainability 2020, 12, 1416. [Google Scholar] [CrossRef] [Green Version]
- Dutta, N.; Kar, S.; Saha, S. Human capital and FDI: How does corruption affect the relationship? Econ. Anal. Policy 2017, 56, 126–134. [Google Scholar] [CrossRef]
- Blanchard, E.J.; Olney, W.W. Globalization and human capital investment: Export composition drives educational attainment. J. Int. Econ. 2017, 106, 165–183. [Google Scholar] [CrossRef]
- Shastry, G.K. Human capital response to globalization education and information technology in India. J. Hum. Resour. 2012, 47, 287–330. [Google Scholar] [CrossRef]
- Hall, C.; Lundin, M.; Sibbmark, K. A laptop for every child? The impact of technology on human capital formation. Labour Econ. 2020, 69, 101957. [Google Scholar] [CrossRef]
- Konara, P.; Wei, Y. The complementarity of human capital and language capital in foreign direct investment. Int. Bus. Rev. 2018, 28, 391–404. [Google Scholar] [CrossRef]
- Ead, H.A. Globalization in higher education in Egypt in a historical context. Res. Glob. 2019, 1, 100003. [Google Scholar] [CrossRef]
- Lin, F.; Long, C.X. The impact of globalization on youth education: Empirical evidence from China’s WTO accession. J. Econ. Behav. Organ. 2020, 178, 820–839. [Google Scholar] [CrossRef]
- Jackson, L. Globalisation and education. In Questioning Allegiance, 1st ed.; Routledge: New York, NY, USA, 2019; ISBN 9780429435492. [Google Scholar]
- Hansen, B.E. Threshold Effects in Non-dynamic Panels: Estimation, Testing, and Inference. J. Econom. 1999, 93, 345–368. [Google Scholar] [CrossRef] [Green Version]
- Mendoza, O.M.V.; Borsi, M.T.; Comim, F. Human capital dynamics in China: Evidence from a club convergence approach. J. Asian Econ. 2022, 79, 101441. [Google Scholar] [CrossRef]
- Van Hoorn, A. Cultural determinants of human capital accumulation: Evidence from the European Social Survey. J. Comp. Econ. 2019, 47, 429–440. [Google Scholar] [CrossRef]
- Sultana, N.; Turkina, E. Foreign direct investment, technological advancement, and absorptive capacity: A network analysis. Int. Bus. Rev. 2020, 29, 101668. [Google Scholar] [CrossRef]
- Prettner, K.; Strulik, H. Innovation, automation, and inequality: Policy challenges in the race against the machine. J. Monetary Econ. 2019, 116, 249–265. [Google Scholar] [CrossRef]
- Hartmann, D.; Bezerra-Hartmann, M.; Lodolo, B.; Pinheiro, F.L. International trade, development traps, and the core-periphery structure of income inequality. EconomiA 2019, 21, 255–278. [Google Scholar] [CrossRef]
- Osabutey, E.L.; Jackson, T. The impact on development of technology and knowledge transfer in Chinese MNEs in sub-Saharan Africa: The Ghanaian case. Technol. Forecast. Soc. Chang. 2019, 148, 119725. [Google Scholar] [CrossRef]
- Ma, S.; Dai, J.; Wen, H. The influence of trade openness on the level of human capital in China: On the basis of environmental regulation. J. Clean. Prod. 2019, 225, 340–349. [Google Scholar] [CrossRef]
- Dahlum, S.; Knutsen, C.H. Do Democracies Provide Better Education? Revisiting the Democracy–Human Capital Link. World Dev. 2017, 94, 186–199. [Google Scholar] [CrossRef] [Green Version]
- Zuazu-Bermejo, I. The growth effect of democracy and technology: An industry disaggregated approach. Eur. J. Politi-Econ. 2018, 56, 115–131. [Google Scholar] [CrossRef]
- Wang, Q.-J.; Feng, G.-F.; Wang, H.-J.; Chang, C.-P. The impacts of democracy on innovation: Revisited evidence. Technovation 2021, 108, 102333. [Google Scholar] [CrossRef]
- Tran, Q.T. Democracy and corporate R&D investment. Borsa Istanb. Rev. 2021, 22, 465–476. [Google Scholar] [CrossRef]
- Ouedraogo, I.; Tabi, H.N.; Ondoa, H.A.; Jiya, A.N. Institutional quality and human capital development in Africa. Econ. Syst. 2021, 46, 100937. [Google Scholar] [CrossRef]
- Dias, J. Human capital demand in Brazil: The effects of adjustment cost, economic growth, exports and imports. EconomiA 2015, 16, 76–92. [Google Scholar] [CrossRef] [Green Version]
- Kim, D.-H.; Lin, S.-C. Human capital and natural resource dependence. Struct. Chang. Econ. Dyn. 2017, 40, 92–102. [Google Scholar] [CrossRef]
- Wu, J.; Ma, Z.; Zhuo, S. Enhancing national innovative capacity: The impact of high-tech international trade and inward foreign direct investment. Int. Bus. Rev. 2017, 26, 502–514. [Google Scholar] [CrossRef]
- Ballestar, M.T.; Díaz-Chao, Á.; Sainz, J.; Torrent-Sellens, J. Knowledge, robots and productivity in SMEs: Explaining the second digital wave. J. Bus. Res. 2019, 108, 119–131. [Google Scholar] [CrossRef]
- Fontes, L.F.; Granitoff, I.; Tai, S.H.T. Export wage premium for south Brazilian firms: Interaction between export, human capital, and export destination. EconomiA 2020, 21, 365–376. [Google Scholar] [CrossRef]
- Wang, M.; Xu, M.; Ma, S. The effect of the spatial heterogeneity of human capital structure on regional green total factor productivity. Struct. Change Econ. Dyn. 2021, 59, 427–441. [Google Scholar] [CrossRef]
- Parman, J. Good schools make good neighbors: Human capital spillovers in early 20th century agriculture. Explor. Econ. Hist. 2012, 49, 316–334. [Google Scholar] [CrossRef]
- Pindado, E.; Sánchez, M.; Verstegen, J.A.; Lans, T. Searching for the entrepreneurs among new entrants in European Agriculture: The role of human and social capital. Land Use Policy 2018, 77, 19–30. [Google Scholar] [CrossRef]
- Albertus, M.; Espinoza, M.; Fort, R. Land reform and human capital development: Evidence from Peru. J. Dev. Econ. 2020, 147, 102540. [Google Scholar] [CrossRef]
- Gillman, M. Steps in industrial development through human capital deepening. Econ. Model. 2021, 99, 105470. [Google Scholar] [CrossRef]
- Zivin, J.G.; Liu, T.; Song, Y.; Tang, Q.; Zhang, P. The unintended impacts of agricultural fires: Human capital in China. J. Dev. Econ. 2020, 147, 102560. [Google Scholar] [CrossRef]
- Kingsbury, I. Making sense of low private returns in MENA: A human capital approach. Int. J. Educ. Dev. 2018, 61, 173–183. [Google Scholar] [CrossRef]
- Aljarallah, R.A. Natural resource dependency, institutional quality and human capital development in Gulf Countries. Heliyon 2020, 6, e04290. [Google Scholar] [CrossRef] [PubMed]
- Agüero, J.M.; Balcázar, C.F.; Maldonado, S.; Ñopo, H. The value of redistribution: Natural resources and the formation of human capital under weak institutions. J. Dev. Econ. 2020, 148, 102581. [Google Scholar] [CrossRef]
- Rahim, S.; Murshed, M.; Umarbeyli, S.; Kirikkaleli, D.; Ahmad, M.; Tufail, M.; Wahab, S. Do natural resources abundance and human capital development promote economic growth? A study on the resource curse hypothesis in Next Eleven countries. Resour. Environ. Sustain. 2021, 4, 100018. [Google Scholar] [CrossRef]
- Mosquera, R. The long-term effect of resource booms on human capital. Labour Econ. 2021, 74, 102090. [Google Scholar] [CrossRef]
- Azarnert, L.V. Immigration, fertility, and human capital: A model of economic decline of the West. Eur. J. Politi-Econ. 2010, 26, 431–440. [Google Scholar] [CrossRef] [Green Version]
- Boikos, S.; Bucci, A.; Stengos, T. Non-monotonicity of fertility in human capital accumulation and economic growth. J. Macroecon. 2013, 38, 44–59. [Google Scholar] [CrossRef]
- Hippe, R.; Perrin, F. Gender equality in human capital and fertility in the European regions in the past. Investig. Hist. Económica 2017, 13, 166–179. [Google Scholar] [CrossRef]
- Samari, G. Education and fertility in Egypt: Mediation by women’s empowerment. SSM-Popul. Health 2019, 9, 100488. [Google Scholar] [CrossRef] [PubMed]
- Kountouris, Y. Higher education and fertility: Evidence from reforms in Greece. Econ. Educ. Rev. 2020, 79, 102059. [Google Scholar] [CrossRef]
- Gershoni, N.; Low, C. The power of time: The impact of free IVF on Women’s human capital investments. Eur. Econ. Rev. 2021, 133, 103645. [Google Scholar] [CrossRef]
- Greene, W. Econometric Analysis; Pearson Hall: Hoboken, NJ, USA, 2010. [Google Scholar]
- Wang, Q. Fixed-Effect Panel Threshold Model using Stata. Stata J. Promot. Commun. Stat. Stata 2015, 15, 121–134. [Google Scholar] [CrossRef] [Green Version]
- Alvarado, R.; Tillaguango, B.; López-Sánchez, M.; Ponce, P.; Işık, C. Heterogeneous impact of natural resources on income inequality: The role of the shadow economy and human capital index. Econ. Anal. Policy 2021, 69, 690–704. [Google Scholar] [CrossRef]
- Wang, Q.; Wang, L. The nonlinear effects of population aging, industrial structure, and urbanization on carbon emissions: A panel threshold regression analysis of 137 countries. J. Clean. Prod. 2020, 287, 125381. [Google Scholar] [CrossRef]
- Abdulqadir, I.A.; Chua, S.Y. Asymmetric impact of exchange rate pass-through into employees’ wages in sub-Saharan Africa: Panel non-linear threshold estimation. J. Econ. Stud. 2020, 47, 1629–1647. [Google Scholar] [CrossRef]
- Nizam, R.; Karim, Z.A.; Sarmidi, T.; Rahman, A.A. Financial Inclusion and Firms Growth in Manufacturing Sector: A Threshold Regression Analysis in Selected Asean Countries. Economies 2020, 8, 80. [Google Scholar] [CrossRef]
- Tsaurai, K. Analysis of the influence of human capital development on foreign investment in BRICS countries using a static panel threshold regression model. Int. J. Bus. Glob. 2018, 21, 261–270. [Google Scholar] [CrossRef]
- Ahsan, H.; Haque, M.E. Threshold effects of human capital: Schooling and economic growth. Econ. Lett. 2017, 156, 48–52. [Google Scholar] [CrossRef] [Green Version]
- Pesaran, M.H. General diagnostic tests for cross-sectional dependence in panels. Empir. Econ. 2021, 60, 13–50. [Google Scholar] [CrossRef]
- Breitung, J.; Das, S. Panel unit root tests under cross-sectional dependence. Stat. Neerlandica 2005, 59, 414–433. [Google Scholar] [CrossRef]
- Westerlund, J. Testing for Error Correction in Panel Data. Oxf. Bull. Econ. Stat. 2007, 69, 709–748. [Google Scholar] [CrossRef] [Green Version]
- Dumitrescu, E.-I.; Hurlin, C. Testing for Granger non-causality in heterogeneous panels. Econ. Model. 2012, 29, 1450–1460. [Google Scholar] [CrossRef] [Green Version]
- Granger, C.W.J. Investigating Causal Relations by Econometric Models and Cross-spectral Methods. Econometrica 1969, 37, 424–438. [Google Scholar] [CrossRef]



| Variable | Symbol | Definition | Measure | Data Source |
|---|---|---|---|---|
| Human capital index | It is a measure based on years of schooling and returns to education. | Index | Pen World Tables | |
| Foreign direct investment | Foreign direct investment are the net inflows of investment to acquire a lasting management interest (10 percent or more of voting stock) in an enterprise operating in an economy other than that of the investor. It is the sum of equity capital, reinvestment of earnings, other long-term capital, and short-term capital as shown in the balance of payments. | Constant 2010 US$ | World Bank | |
| Globalization index | It measures the economic, social, and political dimensions of globalization. | Index | KOF Swiss Economic Institute | |
| Electoral democracy index | The electoral principle of democracy seeks to embody the core value of making rulers responsive to citizens, achieved through electoral competition for the electorate’s approval under circumstances when suffrage is extensive; political and civil society organizations can operate freely; elections are clean and not marred by fraud or systematic irregularities; and elections affect the composition of the chief executive of the country. | Index | V-Dem | |
| Employment in agriculture | Employment is defined as persons of working age who were engaged in any activity to produce goods or provide services for pay or profit, whether at work during the reference period or not at work due to temporary absence from a job, or to working-time arrangement. The agriculture sector consists of activities in agriculture, hunting, forestry, and fishing. | % of total employment | World Bank | |
| Natural resources rents | Total natural resources rents are the sum of oil rents, natural gas rents, coal rents (hard and soft), mineral rents, and forest rents. | % GDP | World Bank | |
| Export diversification index | Export diversification can occur across either products or trading partners. Product diversification occurs through introducing new product lines (the extensive margin) or through exporting a more balanced mix of existing products (the intensive margin). | Index | International Monetary Fund | |
| Fertility rate | Total fertility rate represents the number of children that would be born to a woman if she were to live to the end of her childbearing years and bear children in accordance with age-specific fertility rates. | births per woman | World Bank |
| Mean | 2.39 | 3.87 | 59.57 | 0.55 | 30.30 | 7.17 | 3.27 | 3.42 |
| Std. Dev. (Overall) | 0.71 | 10.62 | 16.17 | 0.26 | 24.90 | 9.90 | 1.21 | 3.11 |
| Std. Dev. (Between) | 0.68 | 5.84 | 14.52 | 0.25 | 24.56 | 8.98 | 1.15 | 2.96 |
| Std. Dev. (Within) | 0.18 | 8.89 | 7.27 | 0.08 | 4.72 | 4.25 | 0.41 | 0.98 |
| Min. | 1.03 | −40.41 | 21.96 | 0.02 | 0.06 | −0.16 | 1.13 | 0.03 |
| Max. | 4.29 | 280.13 | 91.32 | 0.92 | 92.56 | 61.94 | 7.19 | 45.77 |
| Observations | 3277 | 3277 | 3277 | 3277 | 3277 | 3277 | 3277 | 3277 |
| Countries (N) | 113 | 113 | 113 | 113 | 113 | 113 | 113 | 113 |
| Time (T) | 29 | 29 | 29 | 29 | 29 | 29 | 29 | 29 |
| Human capital index | 1.00 | |||||||
| - | ||||||||
| Foreign direct investment | 0.09 * | 1.00 | ||||||
| (0.00) | - | |||||||
| Globalization index | 0.80 * | 0.16 * | 1.00 | |||||
| (0.00) | (0.00) | - | ||||||
| Electoral democracy index | 0.55 * | 0.07 * | 0.61 * | 1.00 | ||||
| (0.00) | (0.00) | (0.00) | - | |||||
| Employment in agriculture | −075 * | −0.10 * | −0.78 * | −0.53 * | 1.00 | |||
| (0.00) | (0.00) | (0.00) | (0.00) | - | ||||
| Natural resources rents | −0.34 * | −0.02 | −0.31 * | −0.46 * | 0.23 * | 1.00 | ||
| (0.00) | (1.00) | (0.00) | (0.00) | (0.00) | - | |||
| Export diversification index | −0.58 * | −0.07* | −0.61 * | −0.56 * | 0.48 * | 0.63 * | 1.00 | |
| (0.00) | (0.00) | (0.00) | (0.00) | (0.00) | (0.00) | - | ||
| Fertility rate | −0.46 * | −0.05 | −0.45 * | −0.35 * | 0.47 * | 0.20 * | 0.47 * | 1.00 |
| (0.00) | (0.07) | (0.00) | (0.00) | (0.00) | (0.00) | (0.00) | - |
| Variable | VIF | SQRT VIF | Tolerance | Squared |
|---|---|---|---|---|
| Foreign direct investment | 1.08 | 1.04 | 0.93 | 0.07 |
| Globalization index | 3.41 | 1.85 | 0.29 | 0.71 |
| Electoral democracy index | 1.88 | 1.37 | 0.53 | 0.47 |
| Employment in agriculture | 2.71 | 1.65 | 0.36 | 0.63 |
| Natural resources rents | 1.82 | 1.35 | 0.55 | 0.45 |
| Export diversification index | 2.68 | 1.64 | 0.37 | 0.63 |
| Fertility rate | 1.46 | 1.21 | 0.69 | 0.31 |
| GLOBAL | HIC | MHIC | MLIC | LIC | |
|---|---|---|---|---|---|
| Foreign direct investment | −0.00003 | −0.00004 | 0.0002 | −0.00004 | 0.00001 |
| (−0.66) | (−1.35) | (1.04) | (−0.47) | (0.23) | |
| Globalization index | 0.005 *** | 0.01 *** | 0.01 *** | 0.01 *** | 0.00003 |
| (18.97) | (14.71) | (15.46) | (12.53) | (0.62) | |
| Electoral democracy index | 0.04 *** | −0.04 | −0.01 | 0.04 * | 0.01 |
| (3.78) | (−1.29) | (−0.54) | (2.05) | (0.98) | |
| Employment in agriculture | −0.01 *** | −0.01 *** | −0.01 *** | −0.01 *** | −0.001 |
| (−46.75) | (−10.61) | (−9.52) | (−9.74) | (−1.60) | |
| Natural resources rents | −0.0002 | −0.0004 | −0.001 | 0.0001 | 0.00002 |
| (−0.93) | (−1.47) | (−1.74) | (0.77) | (0.15) | |
| Export diversification index | −0.01 ** | 0.01** | 0.000001 | −0.005 | −0.0004 |
| (−3.19) | (2.60) | (0.00) | (−1.05) | (−0.33) | |
| Fertility rate | −0.004 *** | −0.10 *** | −0.0003 | −0.02 *** | −0.16 *** |
| (−4.14) | (−10.00) | (−0.29) | (−6.16) | (−39.81) | |
| Constant | 2.57 *** | 2.90 *** | 2.15 *** | 2.08 *** | 2.35 *** |
| (105.97) | (53.18) | (43.38) | (41.40) | (85.43) | |
| Observations | 3277 | 1015 | 783 | 899 | 580 |
| Hausman test (p-value) | 0.00 | 0.00 | 0.00 | 0.03 | 0.54 |
| Autocorrelation test p-value | 0.97 | 0.99 | 0.96 | 0.99 | 0.91 |
| Fixed effects (time) | No | No | No | No | No |
| Fixed effects (country) | No | No | No | No | No |
| Countries (N) | 113 | 35 | 27 | 31 | 20 |
| Chi-squared | 4338.1 | 623.4 | 458.8 | 444.5 | 1976.5 |
| 113 Countries | East Asia and Pacific | Europa And Central Asia | Latin America | Middle East and North Africa | North America | South Asia | Africa Sub-Saharan | |
|---|---|---|---|---|---|---|---|---|
| Foreign direct investment | −0.00003 | 0.00001 | −0.0001 | 0.00001 | −0.0001 | −0.003 | 0.0001 | −0.00002 |
| (−0.66) | (0.08) | (−1.02) | (0.05) | (−0.94) | (−0.46) | (0.38) | (−0.28) | |
| Globalization Index | 0.005 *** | 0.01 *** | 0.01 *** | 0.002 *** | 0.01 *** | 0.01 *** | 0.004 * | 0.0003 * |
| (18.97) | (9.58) | (18.84) | (3.54) | (5.38) | (3.65) | (2.19) | (2.34) | |
| Electoral democracy index | 0.04 *** | 0.08 *** | −0.21 *** | 0.001 | 0.02 | 0.25 | 0.02 | 0.03 |
| (3.78) | (3.47) | (−6.61) | (0.06) | (0.33) | (1.52) | (0.45) | (1.65) | |
| Employment in agriculture | −0.01 *** | −0.02 *** | −0.003 *** | −0.003 *** | −0.01 *** | −0.05 ** | −0.01 *** | −0.01 *** |
| (−46.75) | (−20.93) | (−4.61) | (−4.32) | (−4.67) | (−2.79) | (−6.39) | (−17.09) | |
| Natural resources rents | −0.0002 | −0.002 ** | 0.001 | −0.0001 | −0.0003 | 0.01 | −0.002 | 0.0003 |
| (−0.93) | (−2.72) | (1.39) | (−0.25) | (−0.92) | (1.06) | (−0.67) | (1.81) | |
| Export diversification index | −0.01 ** | 0.01 | 0.04 *** | 0.005 | −0.01 | 0.24 *** | 0.01 | −0.003 |
| (−3.19) | (0.80) | (5.53) | (1.14) | (−0.87) | (4.79) | (0.61) | (−1.19) | |
| Fertility rate | −0.004 *** | −0.0004 | 0.05 *** | −0.27 *** | −0.13 *** | 0.01 | −0.15 *** | −0.002 |
| (−4.14) | (−0.16) | (3.90) | (−21.09) | (−10.17) | (0.22) | (−8.62) | (−1.83) | |
| Constant | 2.57 *** | 2.62 *** | 2.34 *** | 3.14 *** | 2.43 *** | 1.90 *** | 2.58 *** | 2.09 *** |
| (105.97) | (34.48) | (40.50) | (53.49) | (22.39) | (4.52) | (12.66) | (55.62) | |
| Observations | 3277 | 406 | 841 | 638 | 319 | 58 | 145 | 870 |
| Hausman test (p-value) | 0.00 | 0.00 | 0.40 | 0.00 | 0.00 | 0.00 | 0.00 | 0.21 |
| Autocorrelation test p-value | 0.97 | 0.94 | 0.90 | 0.97 | 0.96 | 0.13 | 0.90 | 0.96 |
| Fixed effects (time) | No | No | No | No | No | No | No | No |
| Fixed effects (country) | No | No | No | No | No | No | No | No |
| Adjusted R2 | 0.94 | |||||||
| Countries (N) | 113 | 14 | 29 | 22 | 11 | 2 | 5 | 30 |
| R2 (within) | 0.95 | |||||||
| R2 (between) | 1 | |||||||
| R2 (overall) | 0.36 | |||||||
| Chi-squared | 4338.1 | 1556.2 | 683.2 | 977.5 | 326.3 | 372.0 | 333.7 |
| Threshold Variable | Threshold Effect | F | p-Value | Critical Value of F | ||
|---|---|---|---|---|---|---|
| 1% | 5% | 10% | ||||
| Electoral democracy index | Single | 80.88 | 0.03 | 161.09 | 74.89 | 62.53 |
| Double | 50.25 | 0.14 | 116.20 | 69.99 | 55.23 | |
| Foreign direct investment | Single | 87.08 | 0.00 | 59.20 | 43.33 | 39.10 |
| Double | 27.48 | 0.19 | 52.52 | 42.24 | 32.97 | |
| Threshold Variable | Model | Threshold Estimation Value | Interval | |
|---|---|---|---|---|
| Lower | Upper | |||
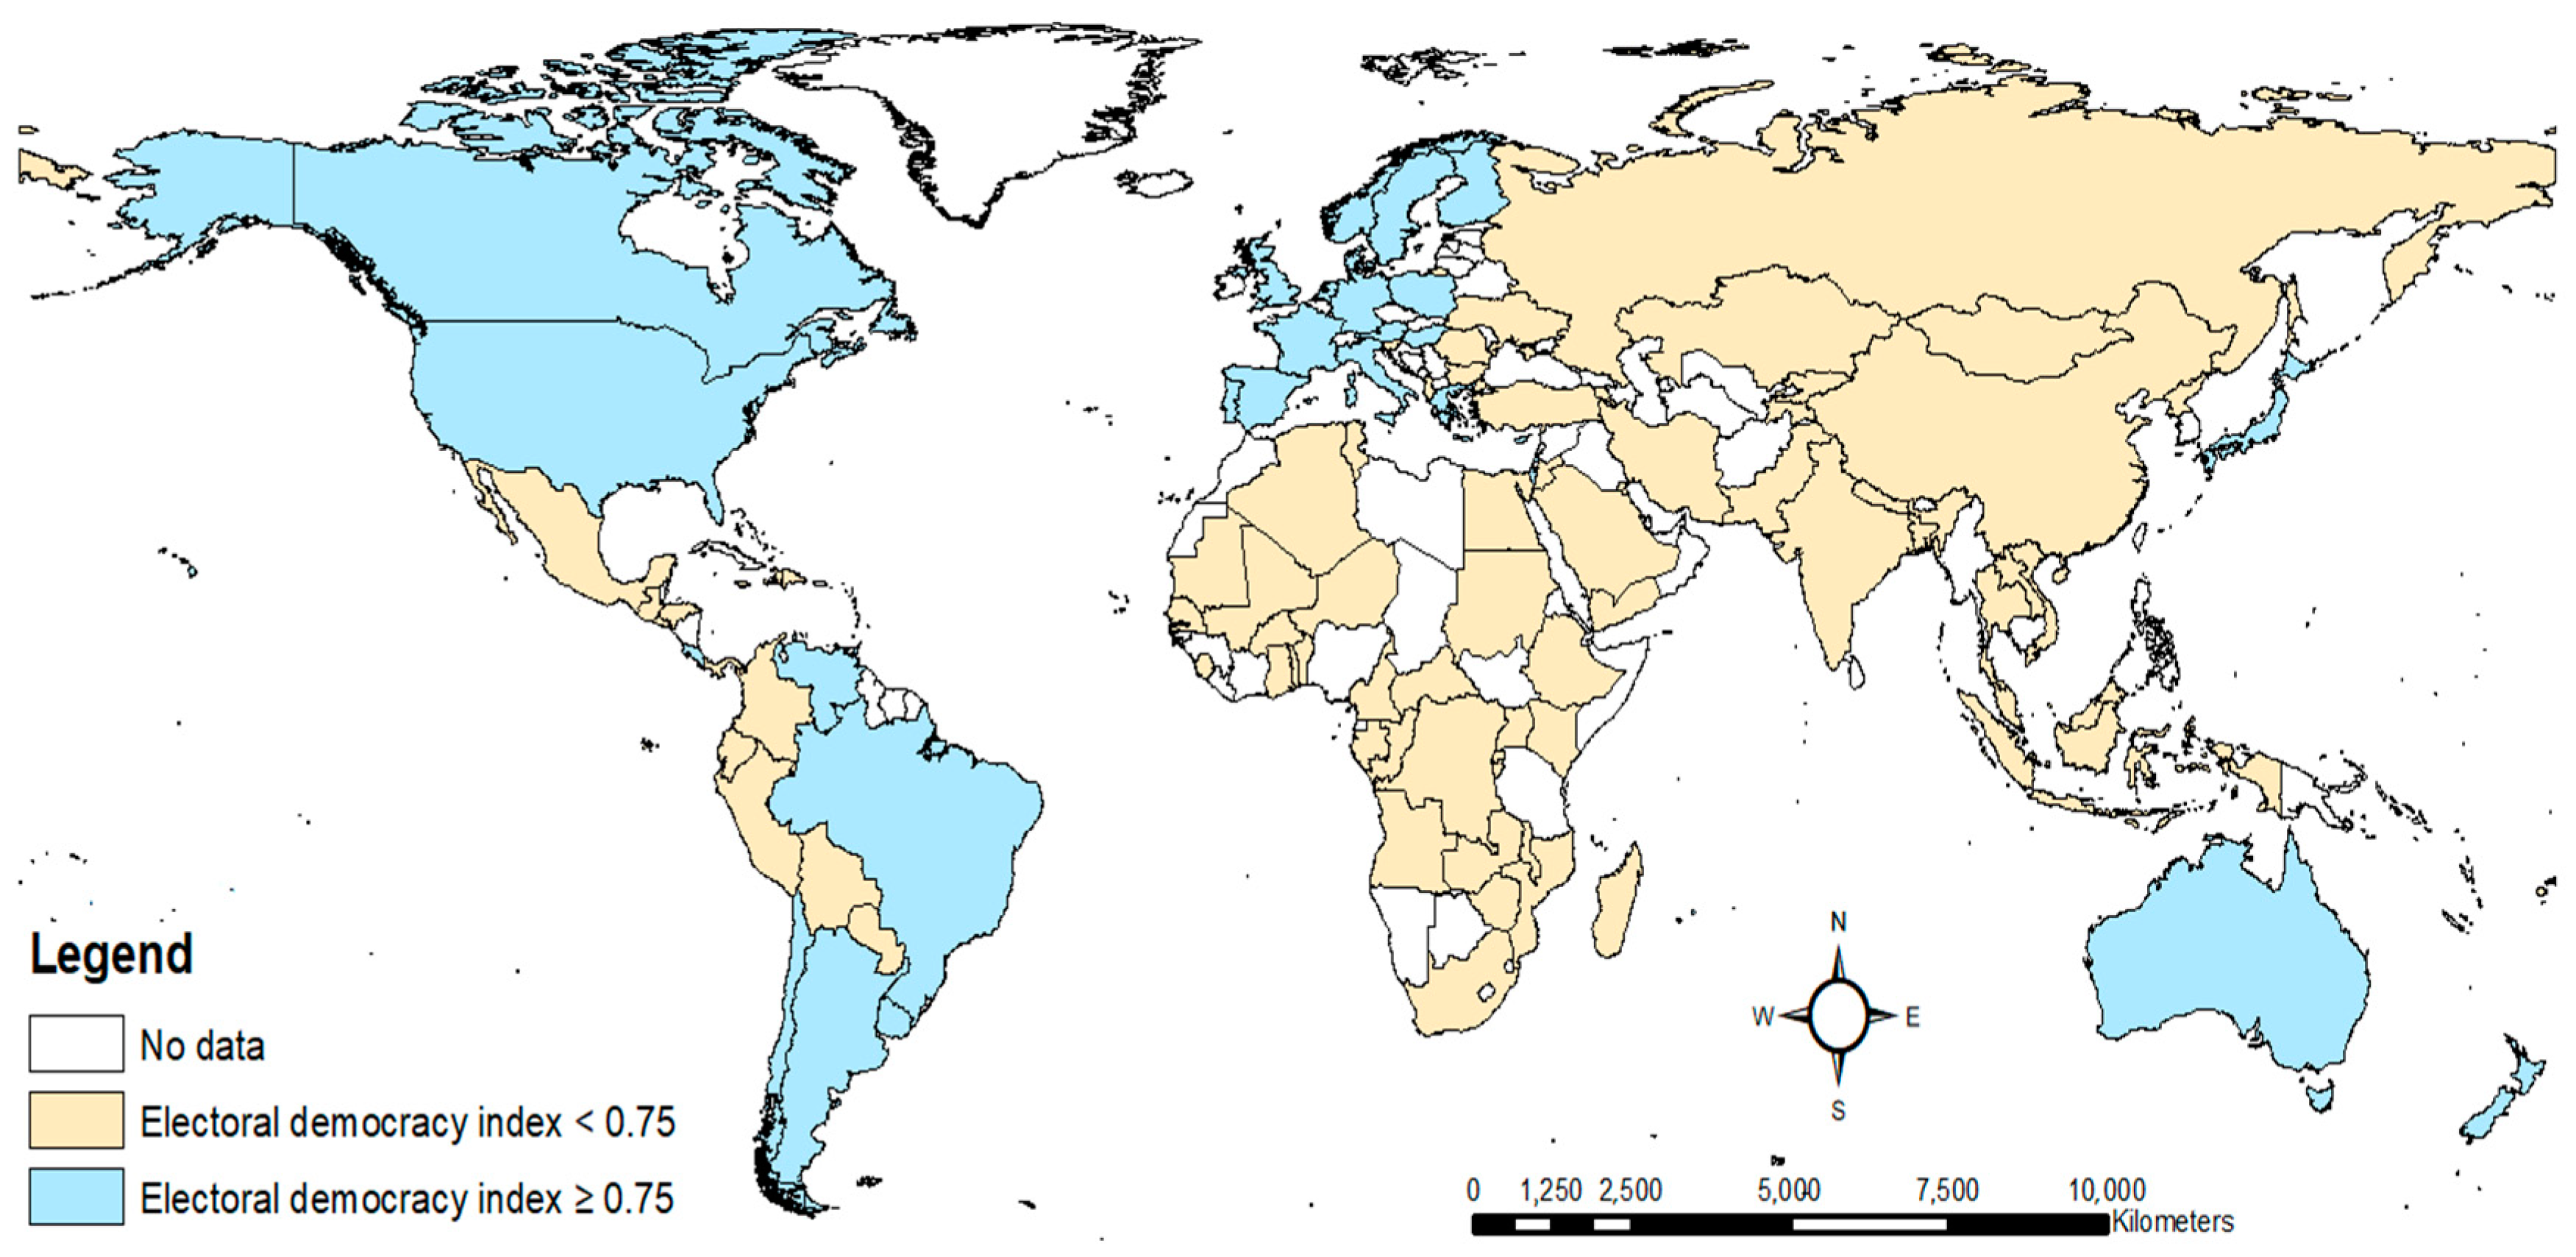
| Electoral democracy index | Th-1 | 0.75 | 0.74 | 0.75 |
| Th-21 | 0.75 | 0.74 | 0.75 | |
| Th-22 | 0.38 | 0.37 | 0.38 | |
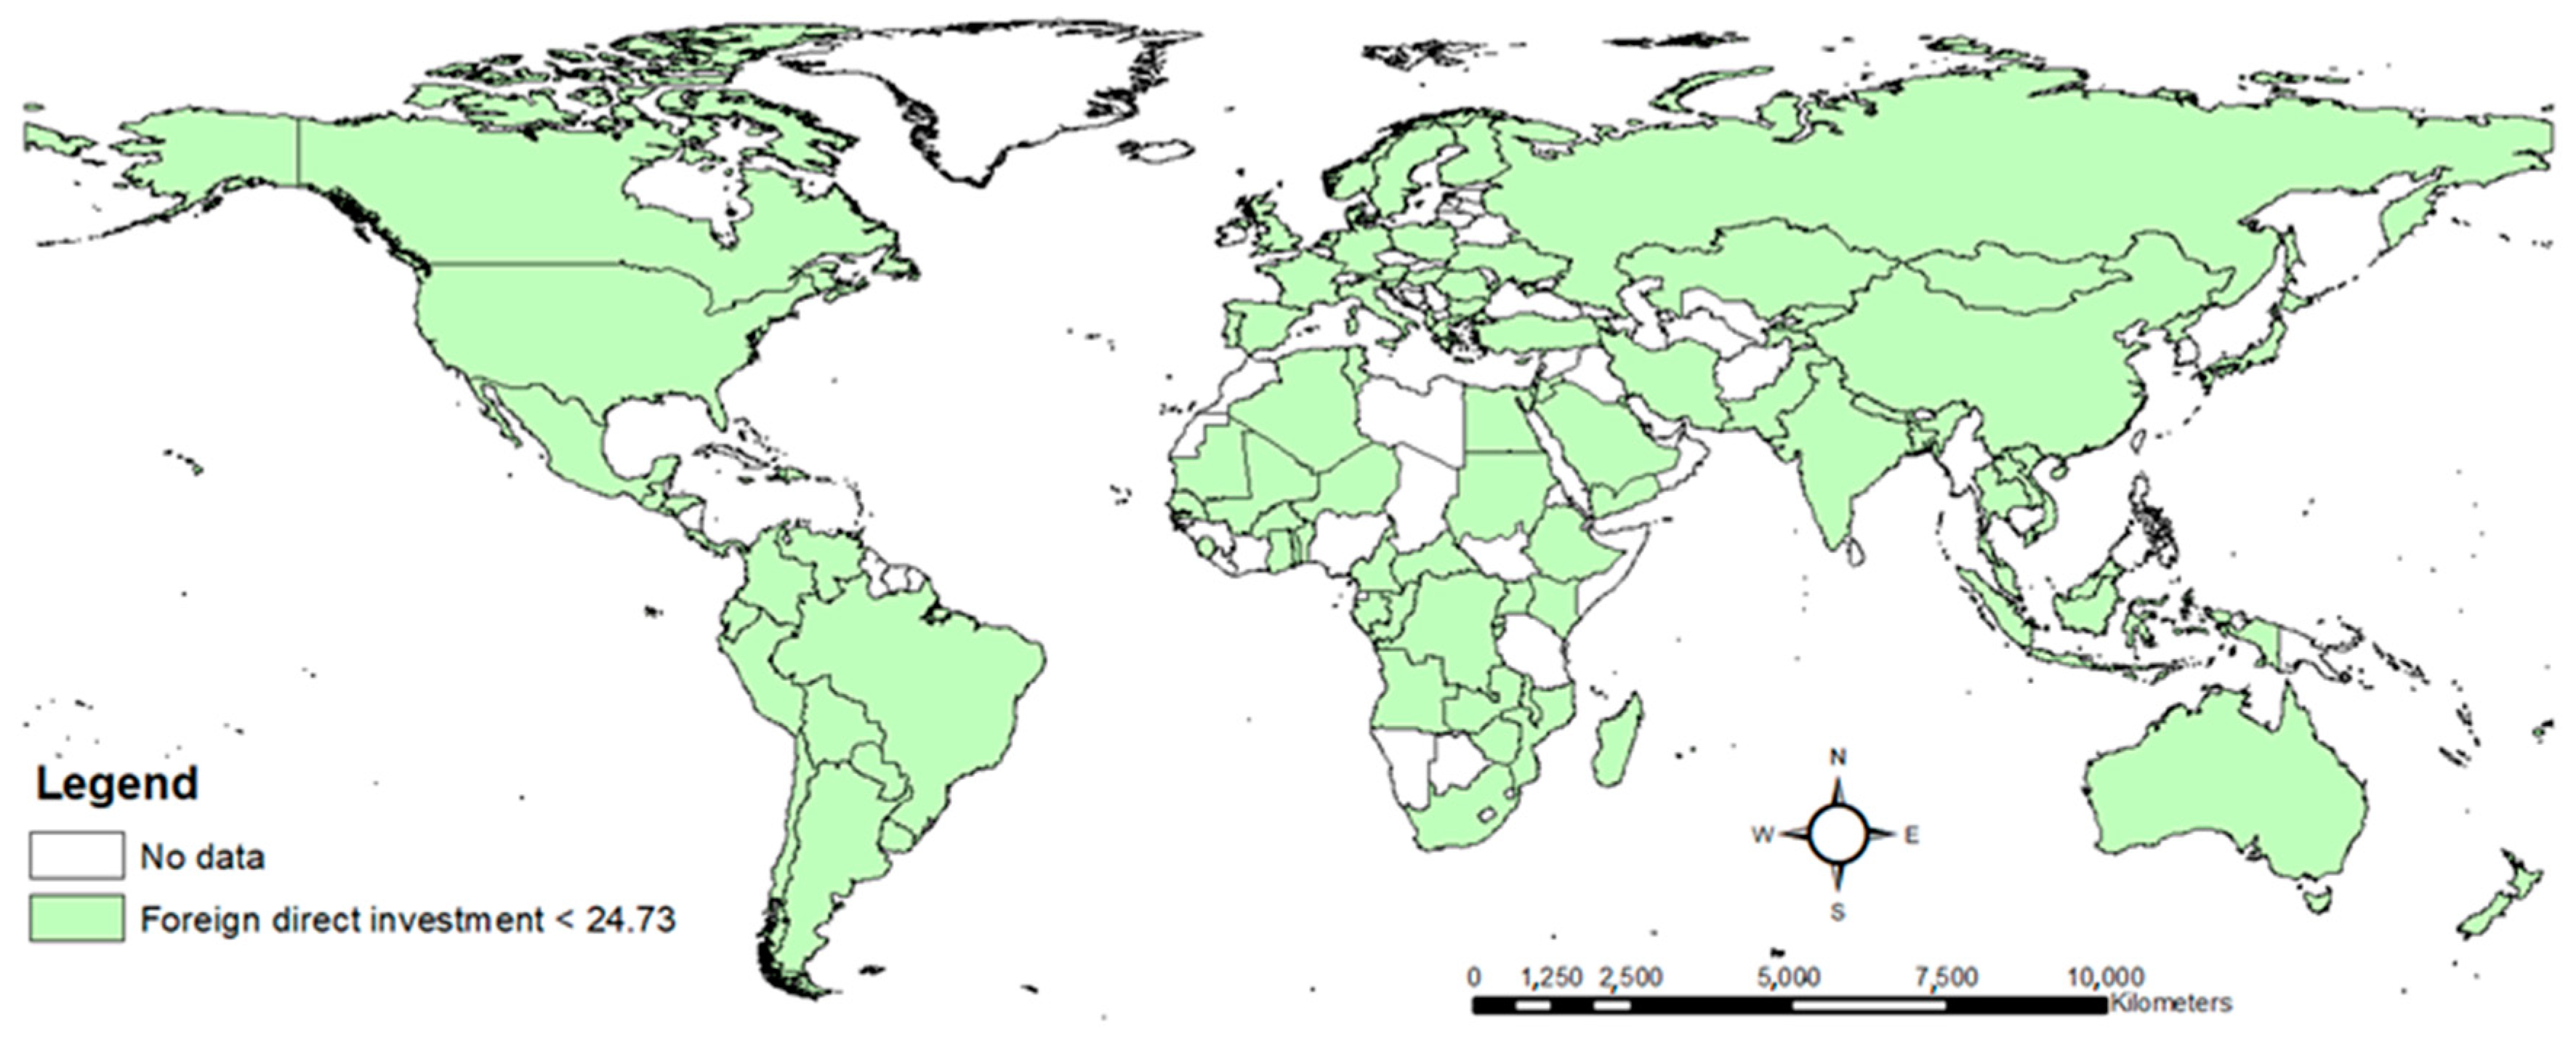
| Foreign direct investment | Th-1 | 24.73 | 24.63 | 24.83 |
| Th-21 | 24.73 | 24.73 | 24.83 | |
| Th-22 | −20.67 | −21.04 | −20.15 | |
| Model 1 | Model 2 | ||
|---|---|---|---|
| Single Threshold Model | Single Threshold Model | ||
| Electoral democracy index < 0.75 | −0.32 *** | Foreign direct investment < 24.73 | −0.004 *** |
| (−5.80) | (−5.00) | ||
| Electoral democracy index ≥ 0.75 | −0.09 ** | Foreign direct investment ≥ 24.73 | 0.001 ** |
| (−2.95) | (3.04) | ||
| Foreign direct investment | 0.0001 | Foreign direct investment | |
| (0.43) | |||
| Globalization Index | 0.02 *** | Globalization Index | 0.02 *** |
| (42.42) | (40.61) | ||
| Electoral democracy index | Electoral democracy index | −0.06 * | |
| (−2.43) | |||
| Employment in agriculture | −0.01 *** | Employment in agriculture | −0.01 *** |
| (−12.53) | (−12.43) | ||
| Natural resources rents | −0.004 *** | Natural resources rents | −0.004 *** |
| (−7.08) | (−7.24) | ||
| Export Diversification Index | 0.04 *** | Export Diversification Index | 0.04 *** |
| (7.51) | (7.65) | ||
| Fertility rate | −0.01 *** | Fertility rate | −0.02 *** |
| (−6.59) | (−7.29) | ||
| Constant | 1.70 *** | Constant | 1.64 *** |
| (39.20) | (39.02) | ||
| Observations | 3277 | Observations | 3277 |
| Adjusted R2 | 0.60 | Adjusted R2 | 0.59 |
| Countries | 113 | Countries | 113 |
| R2 (within) | 0.61 | R2 (within) | 0.61 |
| R2 (between) | 0.66 | R2 (between) | 0.68 |
| R2 (overall) | 0.64 | R2 (overall) | 0.67 |
| Threshold Variable | Threshold Effect | F | p-Value | Critical Value of F | |||
|---|---|---|---|---|---|---|---|
| 1% | 5% | 10% | |||||
| Electoral democracy index | High income countries | Single | 577.21 | 0.00 | 74.72 | 55.96 | 39.44 |
| Double | −127.40 | 1.00 | 611.72 | 363.29 | 111.18 | ||
| Middle-high income countries | Single | 69.71 | 0.05 | 108.94 | 67.89 | 52.42 | |
| Double | 26.19 | 0.51 | 145.12 | 77.71 | 55.81 | ||
| Foreign direct investment | High income countries | Single | 55.67 | 0.03 | 76.91 | 45.41 | 37.93 |
| Double | 6.13 | 0.93 | 49.24 | 37.49 | 31.14 | ||
| Threshold Variable | Model | Threshold Estimation Value | Interval | ||
|---|---|---|---|---|---|
| Lower | Upper | ||||
| Electoral democracy index | High income countries | Th-1 | 0.39 | 0.38 | 0.40 |
| Th-21 | 0.38 | 0.37 | 0.41 | ||
| Th-22 | 0.43 | 0.41 | 0.59 | ||
| Middle-high income countries | Th-1 | 0.85 | 0.84 | 0.86 | |
| Th-21 | 0.85 | 0.84 | 0.86 | ||
| Th-22 | 0.28 | 0.28 | 0.29 | ||
| Foreign direct investment | High income countries | Th-1 | 24.75 | 24.72 | 24.79 |
| Th-21 | 24.75 | 24.72 | 24.79 | ||
| Th-22 | −21.53 | −21.75 | −21.23 | ||
| Model 1 | Model 2 | ||||
|---|---|---|---|---|---|
| High Income Countries | Middle-High Income Countries | High Income Countries | |||
| Single Threshold Model | Single Threshold Model | Single Threshold Model | |||
| < 0.39 | −0.53 * | < 0.85 | −0.92 *** | < 24.75 | −0.003 ** |
| (−2.42) | (−7.66) | (−3.06) | |||
| 0.38 | 1.25 *** | 0.85 | −0.49 *** | 24.75 | 0.00002 |
| (5.49) | (−9.12) | (0.04) | |||
| Foreign direct investment | −0.001 | 0.004 *** | Foreign direct investment | ||
| (−1.83) | (5.80) | ||||
| Globalization Index | 0.01*** | 0.02 *** | Globalization Index | 0.02 *** | |
| (14.79) | (21.34) | (14.12) | |||
| Electoral democracy index | Electoral democracy index | −0.48 *** | |||
| (−4.37) | |||||
| Employment in agriculture | −0.02 *** | −0.01 *** | Employment in agriculture | −0.02 *** | |
| (−7.95) | (−6.62) | (−5.10) | |||
| Natural resources rents | −0.003 ** | −0.004 *** | Natural resources rents | −0.004 ** | |
| (−2.62) | (−3.71) | (−2.85) | |||
| Export diversification index | 0.04 *** | 0.10 *** | Export Diversification Index | 0.05 *** | |
| (3.89) | (8.28) | (4.15) | |||
| Fertility rate | −0.08 *** | −0.01 ** | Fertility rate | −0.09 *** | |
| (−5.84) | (−3.10) | (−6.32) | |||
| Constant | 2.56 *** | 1.60 *** | Constant | 2.37 *** | |
| (21.45) | (19.44) | (18.02) | |||
| Observations | 1015 | 783 | Observations | 1015 | |
| Adjusted R2 | 0.69 | 0.75 | Adjusted R2 | 0.60 | |
| Countries | 35 | 27 | Countries | 35 | |
| R2 (within) | 0.70 | 0.76 | R2 (within) | 0.62 | |
| R2 (between) | 0.001 | 0.06 | R2 (between) | 0.04 | |
| R2 (overall) | 0.04 | 0.243 | R2 (overall) | 0.115 | |
| Threshold Variable | Threshold Effect | F | p-Value | Critical Value of F | |||
|---|---|---|---|---|---|---|---|
| 1% | 5% | 10% | |||||
| Electoral democracy index | East Asia and Pacific | Single | 213.91 | 0.00 | 169.53 | 95.04 | 72.12 |
| Double | 0.14 | 1.00 | 386.04 | 118.64 | 72.41 | ||
| Middle East and North Africa | Single | 63.51 | 0.02 | 88.31 | 59.23 | 49.89 | |
| Double | 41.65 | 0.18 | 11256 | 81.71 | 52.31 | ||
| Foreign direct investment | East Asia and Pacific | Single | 218.10 | 0.00 | 138.20 | 80.69 | 62.14 |
| Double | 32.27 | 0.20 | 142.52 | 86.61 | 59.91 | ||
| Latin America | Single | 71.68 | 0.00 | 50.72 | 37.96 | 50.72 | |
| Double | 10.04 | 0.63 | 185.38 | 66.15 | 185.38 | ||
| Threshold Variable | Model | Threshold Estimation Value | Interval | ||
|---|---|---|---|---|---|
| Lower | Upper | ||||
| Electoral democracy index | East Asia and Pacific | Th-1 | 0.39 | 0.39 | 0.40 |
| Th-21 | 0.39 | 0.38 | 0.40 | ||
| Th-22 | 0.41 | 0.40 | 0.41 | ||
| Middle East and North Africa | Th-1 | 0.05 | 0.05 | 0.22 | |
| Th-21 | 0.25 | 0.25 | 0.25 | ||
| Th-22 | 0.37 | 0.36 | 0.66 | ||
| Foreign direct investment | East Asia and Pacific | Th-1 | 24.94 | 24.81 | 24.94 |
| Th-21 | 24.83 | 24.83 | 25.15 | ||
| Th-22 | 25.25 | 25.25 | 25.28 | ||
| Latin America | Th-1 | 24.72 | 24.57 | 24.86 | |
| Th-21 | 24.72 | 24.57 | 24.86 | ||
| Th-22 | 24.08 | 23.88 | 24.11 | ||
| Model 1 | Model 2 | ||||||
|---|---|---|---|---|---|---|---|
| East Asia and Pacific | Middle East and North Africa | East Asia and Pacific | Latin America | ||||
| Single Threshold Model | Single Threshold Model | Single Threshold Model | Single Threshold Model | ||||
| < 0.39 | −1.311 *** | < 0.05 | −1.70 *** | < 24.94 | 0.001 | < 24.72 | −0.0001 |
| (−5.73) | (−8.28) | (1.05) | (−0.28) | ||||
| 0.39 | 0.416 | ≥ 0.25 | −0.94 *** | 24.83 | 0.03 *** | 24.72 | 0.003 ** |
| (1.96) | (−5.83) | (15.84) | (2.62) | ||||
| Foreign direct investment | 0.0004 | −0.0001 | Foreign direct investment | ||||
| (0.61) | (−0.26) | ||||||
| Globalization Index | 0.02 *** | 0.03 *** | Globalization Index | 0.02 *** | 0.01 *** | ||
| (14.46) | (19.28) | (14.64) | (8.03) | ||||
| Electoral democracy index | Electoral democracy index | −0.02 | −0.54 *** | ||||
| (−0.26) | (−12.28) | ||||||
| Employment in agriculture | −0.003 | −0.003 | Employment in agriculture | −0.004 * | −0.0237 *** | ||
| (−1.60) | (−1.51) | (−2.14) | (−14.33) | ||||
| Natural resources rents | −0.01 *** | −0.01 *** | Natural resources rents | −0.001 *** | 0.001 | ||
| (−4.34) | (−5.11) | (−4.69) | (0.49) | ||||
| Export diversification index | −0.07 ** | −0.02 | Export diversification index | −0.03 | 0.0583 *** | ||
| (−2.89) | (−1.02) | (−1.38) | (6.91) | ||||
| Fertility rate | −0.01 | −0.01 | Fertility rate | −0.003 | −0.08 *** | ||
| (−1.33) | (−0.64) | (−0.41) | (−5.66) | ||||
| Constant | 1.79 *** | 0.89 *** | Constant | 1.42 *** | 2.78 *** | ||
| (11.03) | (5.85) | (9.64) | (26.49) | ||||
| Observations | 406 | 319 | Observations | 406 | 638 | ||
| Adjusted R2 | 0.73 | 0.81 | Adjusted R2 | 0.76 | 0.82 | ||
| Countries | 14 | 11 | Countries | 14 | 22 | ||
| R2 (within) | 0.75 | 0.82 | R2 (within) | 0.77 | 0.83 | ||
| R2 (between) | 0.55 | 0.82 | R2 (between) | 0.50 | 0.47 | ||
| R2 (overall) | 0.61 | 0.82 | R2 (overall) | 0.55 | 0.54 | ||
Publisher’s Note: MDPI stays neutral with regard to jurisdictional claims in published maps and institutional affiliations. |
© 2022 by the authors. Licensee MDPI, Basel, Switzerland. This article is an open access article distributed under the terms and conditions of the Creative Commons Attribution (CC BY) license (https://creativecommons.org/licenses/by/4.0/).
Share and Cite
Tang, T.; Tillaguango, B.; Alvarado, R.; Songor-Jaramillo, X.; Méndez, P.; Pinzón, S. Heterogeneity in the Causal Link between FDI, Globalization and Human Capital: New Empirical Evidence Using Threshold Regressions. Sustainability 2022, 14, 8740. https://doi.org/10.3390/su14148740
Tang T, Tillaguango B, Alvarado R, Songor-Jaramillo X, Méndez P, Pinzón S. Heterogeneity in the Causal Link between FDI, Globalization and Human Capital: New Empirical Evidence Using Threshold Regressions. Sustainability. 2022; 14(14):8740. https://doi.org/10.3390/su14148740
Chicago/Turabian StyleTang, Tao, Brayan Tillaguango, Rafael Alvarado, Ximena Songor-Jaramillo, Priscila Méndez, and Stefania Pinzón. 2022. "Heterogeneity in the Causal Link between FDI, Globalization and Human Capital: New Empirical Evidence Using Threshold Regressions" Sustainability 14, no. 14: 8740. https://doi.org/10.3390/su14148740
APA StyleTang, T., Tillaguango, B., Alvarado, R., Songor-Jaramillo, X., Méndez, P., & Pinzón, S. (2022). Heterogeneity in the Causal Link between FDI, Globalization and Human Capital: New Empirical Evidence Using Threshold Regressions. Sustainability, 14(14), 8740. https://doi.org/10.3390/su14148740


