Brief Report

Online Platform Customer Shopping Repurchase Behavior Analysis

1
College of Economics and Management, Shanghai University of Electric Power, Shanghai 200090, China
2
College of Science, Shenyang Ligong University, Shenyang 110159, China
*
Author to whom correspondence should be addressed.
Sustainability 2022, 14(14), 8714; https://doi.org/10.3390/su14148714
Submission received: 19 June 2022 / Revised: 13 July 2022 / Accepted: 14 July 2022 / Published: 16 July 2022
(This article belongs to the Special Issue Sustainable Marketing Strategy and Brand Management)

Abstract

:
With the rapid development of the world economy and the progress of modern science and technology, e-commerce has gradually spread to the public. For the online shopping platform, the number of online stores has increased rapidly, especially so in recent years. Mastering the rules of customers’ shopping behavior will help the stores to stand out amidst such a fiercely competitive environment. Taking the cosmetics industry in online shopping as an example, this paper studies the purchase behavior of online platform customers. Through the analysis of order data, it is found that the number of customers’ repurchase times and the corresponding number of people conform to the law of power-law distribution. On this basis, the customer attributes of repurchase behavior are analyzed and demonstrated, and the influences of different factors, such as region, postage, and usage of clients, on the customer repurchase rate and the relationship between the number of orders and the number of days between repurchase are revealed. The analysis results can provide better sustainable operation decision support for online platform operators and improve the overall repurchase rate and benefits of stores.

1. Introduction

With the rapid development of China’s economy and internet technology in recent years, online shopping has become a common thing in life [1]. Online shopping can save customers’ time and how much they consume without space and time constraints [2]. Therefore, online shopping has become an indispensable consumption channel for Chinese residents [3]. In particular, after the impact of the COVID-19 epidemic on the real industry, and the support of government departments and the poverty alleviation project team for e-commerce platforms, online shopping has been further developed, and online shopping has gradually replaced the traditional offline shopping mode [4,5,6]. According to iiMedia Research, the sales volume of online shopping transactions in China increased from $422 billion to $1637 billion from 2014 to 2021. According to the data of iiMedia Research, cosmetics are the most traded products among online platforms of Chinese internet users. Therefore, as the scale of online shopping platform continues to expand, so will the e-commerce of beauty and care products. According to statistics, in the five years from 2014 to 2021, the annual sales of China’s cosmetics industry increased from $27 billion to $61 billion, most of which were completed on online platforms. From 2014 to 2021, the proportion of online sales of cosmetics products has increased from 53.4% to 79.8% [7]. Therefore, it can be seen that with the increasingly mature development of China’s e-commerce environment, online shopping will continue to become the most important channel for Chinese customers to buy cosmetics, and the scale of the cosmetics online shopping market will continue to grow. As a seller, it is necessary to face the flexible changes of the market with sufficient operational strategies, stabilize the old customers while developing new customers, constantly tap the law of customer consumption behavior, and improve the frequency of customer repeat purchase [8].
Researchers believe that customers’ loyalty to merchants is to conduct transactions in the same store for many times [9,10,11]. However, the loyalty of customers in online shopping will be greatly influenced by the environment of the online platform and the sales methods of stores. Those features are different from the regular characteristics of the physical sales industry [12,13]: for example, online platform stores can’t really get in touch with customers and understand their needs; online shopping pricing is transparent, and customers are very sensitive to price comparison; customers can’t access physical goods online, so how to promote online goods is also very important. For those reasons, the customer’s loyalty to the store is completely different from the offline expression. Therefore, the analysis of customers’ shopping behavior on the network platform can’t use the same method as the physical sales industry [14]. E-loyalty refers to the loyalty of online customers to stores or brands. According to statistics, the cost of acquiring new customers on the online platform is five times that of retaining customers, so it is very important for online retailers to maintain e-loyalty [15]. Chen, Y and other scholars have proven that improving e-loyalty will have a positive impact on online sales of online stores [16,17]. Li, Z. and other scholars have proven that e-loyalty is positively correlated with repurchase intention [18]. Therefore, increasing customers’ repurchase behavior can improve customers’ e-loyalty and the benefits of online stores. At present, the rapid development of the Internet and the diversification of shopping ideas and motives on online platforms have a great impact on the changes of online trading rules [19,20]. In the research of online shopping repurchase behavior, some scholars have confirmed that it presents the characteristics of power-law distribution, and the distribution of customers’ purchase times has a long tail [21]. Most customers still belong to the category with less purchase times, and only a few customers have a high number of repeat purchases. As to what factors can affect the repurchase rate of online customers, some studies have pointed out that customer service after-sales service, advertising promotion, preferential efforts, etc. have a positive impact on consumer satisfaction and repurchase behavior, which will encourage consumers to make future purchase choices [22,23,24,25].
However, with the increasing number of communication platforms on the Internet, the content of the Internet is becoming more and more fragmented, which makes customers’ attention more and more dispersed, and it is difficult to maintain their loyalty. The network platform stores will also waste unnecessary resources in their marketing strategies. The proposal of sustainable marketing points out that the sustainability of marketing strategy will be an important trend of internet marketing in the future [26,27]. Both traditional brands and internet brands need to shape the sustainability of marketing strategy.
To sum up, in the current research of online platform customer consumption behavior, most studies only analyze the influence of the store’s factors on customer loyalty and repurchase rate, and rarely fully tap the influence of customer’s consumption attributes on store sales, which is obviously not conducive to enterprises to formulate targeted sustainable marketing strategies and sales decisions for consumers. Therefore, it is necessary to fully tap the customer’s behavior characteristics through the analysis of historical order data to improve the sustainable sales of online platform sellers. In this paper, the linear regression method is used to analyze the influence of customer’s regional attribute, ordering method and satisfaction of goods package on the repurchase rate of online stores, and the daily ordering time is counted, and the time sequence law of customers’ repurchase is obtained by curve fitting. The following analysis can provide decision support for the sustainable operation and management of sellers in online stores. At the same time, China’s online shopping industry is ahead of the European Union and the United States and other countries [28]. Analyzing the behavior of online shopping consumers in China can provide some reference strategies for the slow development of e-commerce in the European Union and the United States.

2. Summary of Relevant Principles

2.1. Power-Law Distribution

Power-law distribution refers to a variable with distribution properties, and its distribution density function is a power function. The power-law distribution is represented as a straight line with a negative slope of the power exponent. This linear relationship is the basis for judging whether the random variable in a given example satisfies the power-law. Statistical physicists are used to calling the phenomenon of obeying power-law distribution scale-free phenomenon; the scale of individuals in the system is quite different and lacks an optimal scale. It can be said that where there is life, there is evolution, and where there is competition, there will be scale-free phenomena in varying degrees [29,30]. There are various power-law distribution phenomena with different properties in nature and social life, so the research on them is of wide and far-reaching significance. When the sample data is large, the probability density function of variable x:
f(x)~x^(−a − 1)
Under the double logarithmic coordinates, the power-law distribution is represented as a straight line with a negative slope of power exponent. This linear relationship is the basis for judging whether the random variable meets the power-law in a given example. Judging whether two random variables satisfy the linear relation, the correlation coefficient between them can be solved. By using the linear regression model of one variable and the least square method, the empirical linear regression equation of lny to lnx can be obtained, and the power-law relationship between Y and X can be obtained. For the graph in double logarithmic coordinates, due to the influence of some factors, the linear characteristic of the first half part is not very strong, while that of the second half part is almost a straight line, and the negative number of its slope is a power index.

2.2. Ordinary Least Squares

In this paper, the least square method is used for linear regression analysis. Ordinary Least Square (OLS) is one of the most widely used parameter estimation methods [31,32], and is also the basis of other estimation methods starting from the principle of least squares. Given a set of sample observations { ( X i , Y i ) :   i = 1 , 2 , n } , the standard of judgment given by the ordinary least squares method is to minimize the sum of squares of the differences between the estimated values of the explained variables and the actual observations:
Q = i = 1 n e 2 = i = 1 n ( Y i Y ^ i ) 2 = i = 1 n ( Y i ( β ^ 0 + β ^ 1 X i ) ) 2
That is, given the sample observations, β ^ 0 and β ^ 1 are chosen to minimize the sum of squares of the differences between Y i and Y ^ i ( Y i and Y ^ i are the actual and estimated values of the sample, respectively).
According to calculus, when the first order partial derivative of Q to β ^ 0 , β ^ 1 is 0, Q reaches the minimum, that is:
{ Q β ^ 0 = 0 Q β ^ 1 = 0
The following equations for estimating β ^ 0 , β ^ 1 can be derived:
{ ( Y i β ^ 0 β ^ 1 X i ) = 0 ( Y i β ^ 0 β ^ 1 X i ) X i = 0
Resolved:
{ β ^ 0 = X i 2 Y i X i Y i X i n X i 2 ( X i ) 2 β ^ 1 = n Y i X i Y i X i n X i 2 ( X i ) 2
Equation (3) is called normal equations, note:
x i 2 = ( X i X ¯ ) 2 = X i 2 1 n ( X i ) 2
x i y i = ( X i X ¯ ) ( Y i Y ¯ ) = X i Y i 1 n X i Y i
The parameter estimation of formula (4) can be written as follows:
{ β ^ 1 = x i y i x i 2   β ^ 0 = Y ¯ β ^ 1 X ¯
A deviation form is called an ordinary least squares estimator. β   ^ 0 , β   ^ 1 is called ordinary least squares estimator.

2.3. Statistical Test of Linear Regression Model

Given a set of sample observations ( X i , Y i )   ( i = 1 , 2 , n ) , the following sample regression line is obtained: Y i = β ^ 0 + β ^ 1 X i
(1) The goodness of the fit test is used to test the fitting degree of the model to the sample observation value. By constructing an index that can express the fitting degree, which is called statistics, the value of the statistics is calculated from the test object and compared with a standard to draw the conclusion of the statistical test. The statistics used for the goodness of the fit test in this paper are the residual sum of the squares and the determinable coefficients. The sum of the squares of residuals reflects the deviation between the observed value and the estimated value of the sample, as follows:
R S S = e i 2 = ( Y i Y ^ i ) 2
The coefficient of determination R2 is a comprehensive measure of the goodness of the model fit. The larger the coefficient of determination, the larger the proportion of the total variation of Y explained by the model, and the higher the goodness of the fit of the model. The specific expression is:
R 2 = ESS TSS = 1 RSS TSS
ESS is the explained sum of squares, and TSS is the total sum of squares.
(2) Significance test of variables. In this paper, only the t-test is used for the significance test, and only the t-test is briefly described here. In this article, the t-test is used to test whether the explanatory variables of the regression model have a significant effect on the explained variables. Construct t-test statistics:
t = β ^ 1 β 1 σ ^ 2 x i 2 = β ^ 1 β 1 S β ^ 1
First assume that event H0: variable X is not significant, β1 = 0. Given the significance level α, a critical value t α 2 ( n 2 ) will be obtained, and then |t|> t α 2 ( n 2 ) is a small probability event of the original Hypothesis H0. Then we obtain the value of t, if |t|> t α 2 ( n 2 ) occurs, then the original Hypothesis H0 is rejected at the level of α-significance, that is, the variable is significant and passed the significance test [33,34].

3. Data Source and Description

The data analyzed in this paper comes from the orders of famous cosmetics stores in Taobao platform. This paper collected 3,963,509 cosmetics order data from this online store from 2016 to 2020, but the collected data included “618”, “double 11” and “Double 12”, three online shopping preferential festivals in China. The amount of order data during this period was larger than usual, and customers’ purchase time was too concentrated in the early morning, which did not conform to people’s daily online shopping rules. Hence the order data of these three days was not representative [35]. Therefore, it is necessary to preprocess the order data of cosmetics, delete all the order data in these three days, and process the remaining order data, deleting blank data, abnormal data, duplicate data, etc., and finally there are 777,250 valid order data. The order attributes and explanations used in this paper are shown in Table 1.

4. Data Research and Analysis

4.1. The Relationship between the Number of Customer Repurchases and the Corresponding Number of People

First of all, it explains the customer’s repurchase behavior, and defines it as the repeat purchase of customers in the same store for more than two times in the adjacent time. After analyzing the processed data, it is found that the overall repurchase rate of the store data in this study is 27.68%, including 147,968 customers with repurchase behavior and 386,517 customers without repurchase behavior. It can be seen that the repurchase rate of the store is low, so it is necessary to adjust the strategies in time to improve the repurchase rate of the store and increase the turnover. Establish a coordinate system so that the x-axis is the number of people and the y-axis is the number of customers’ purchases, and mark the number of customers’ repeat purchases and the corresponding number of people in the coordinate system in turn. As shown in Figure 1, it can be seen that each point on the diagram conforms to the distribution trend of the power-law function.
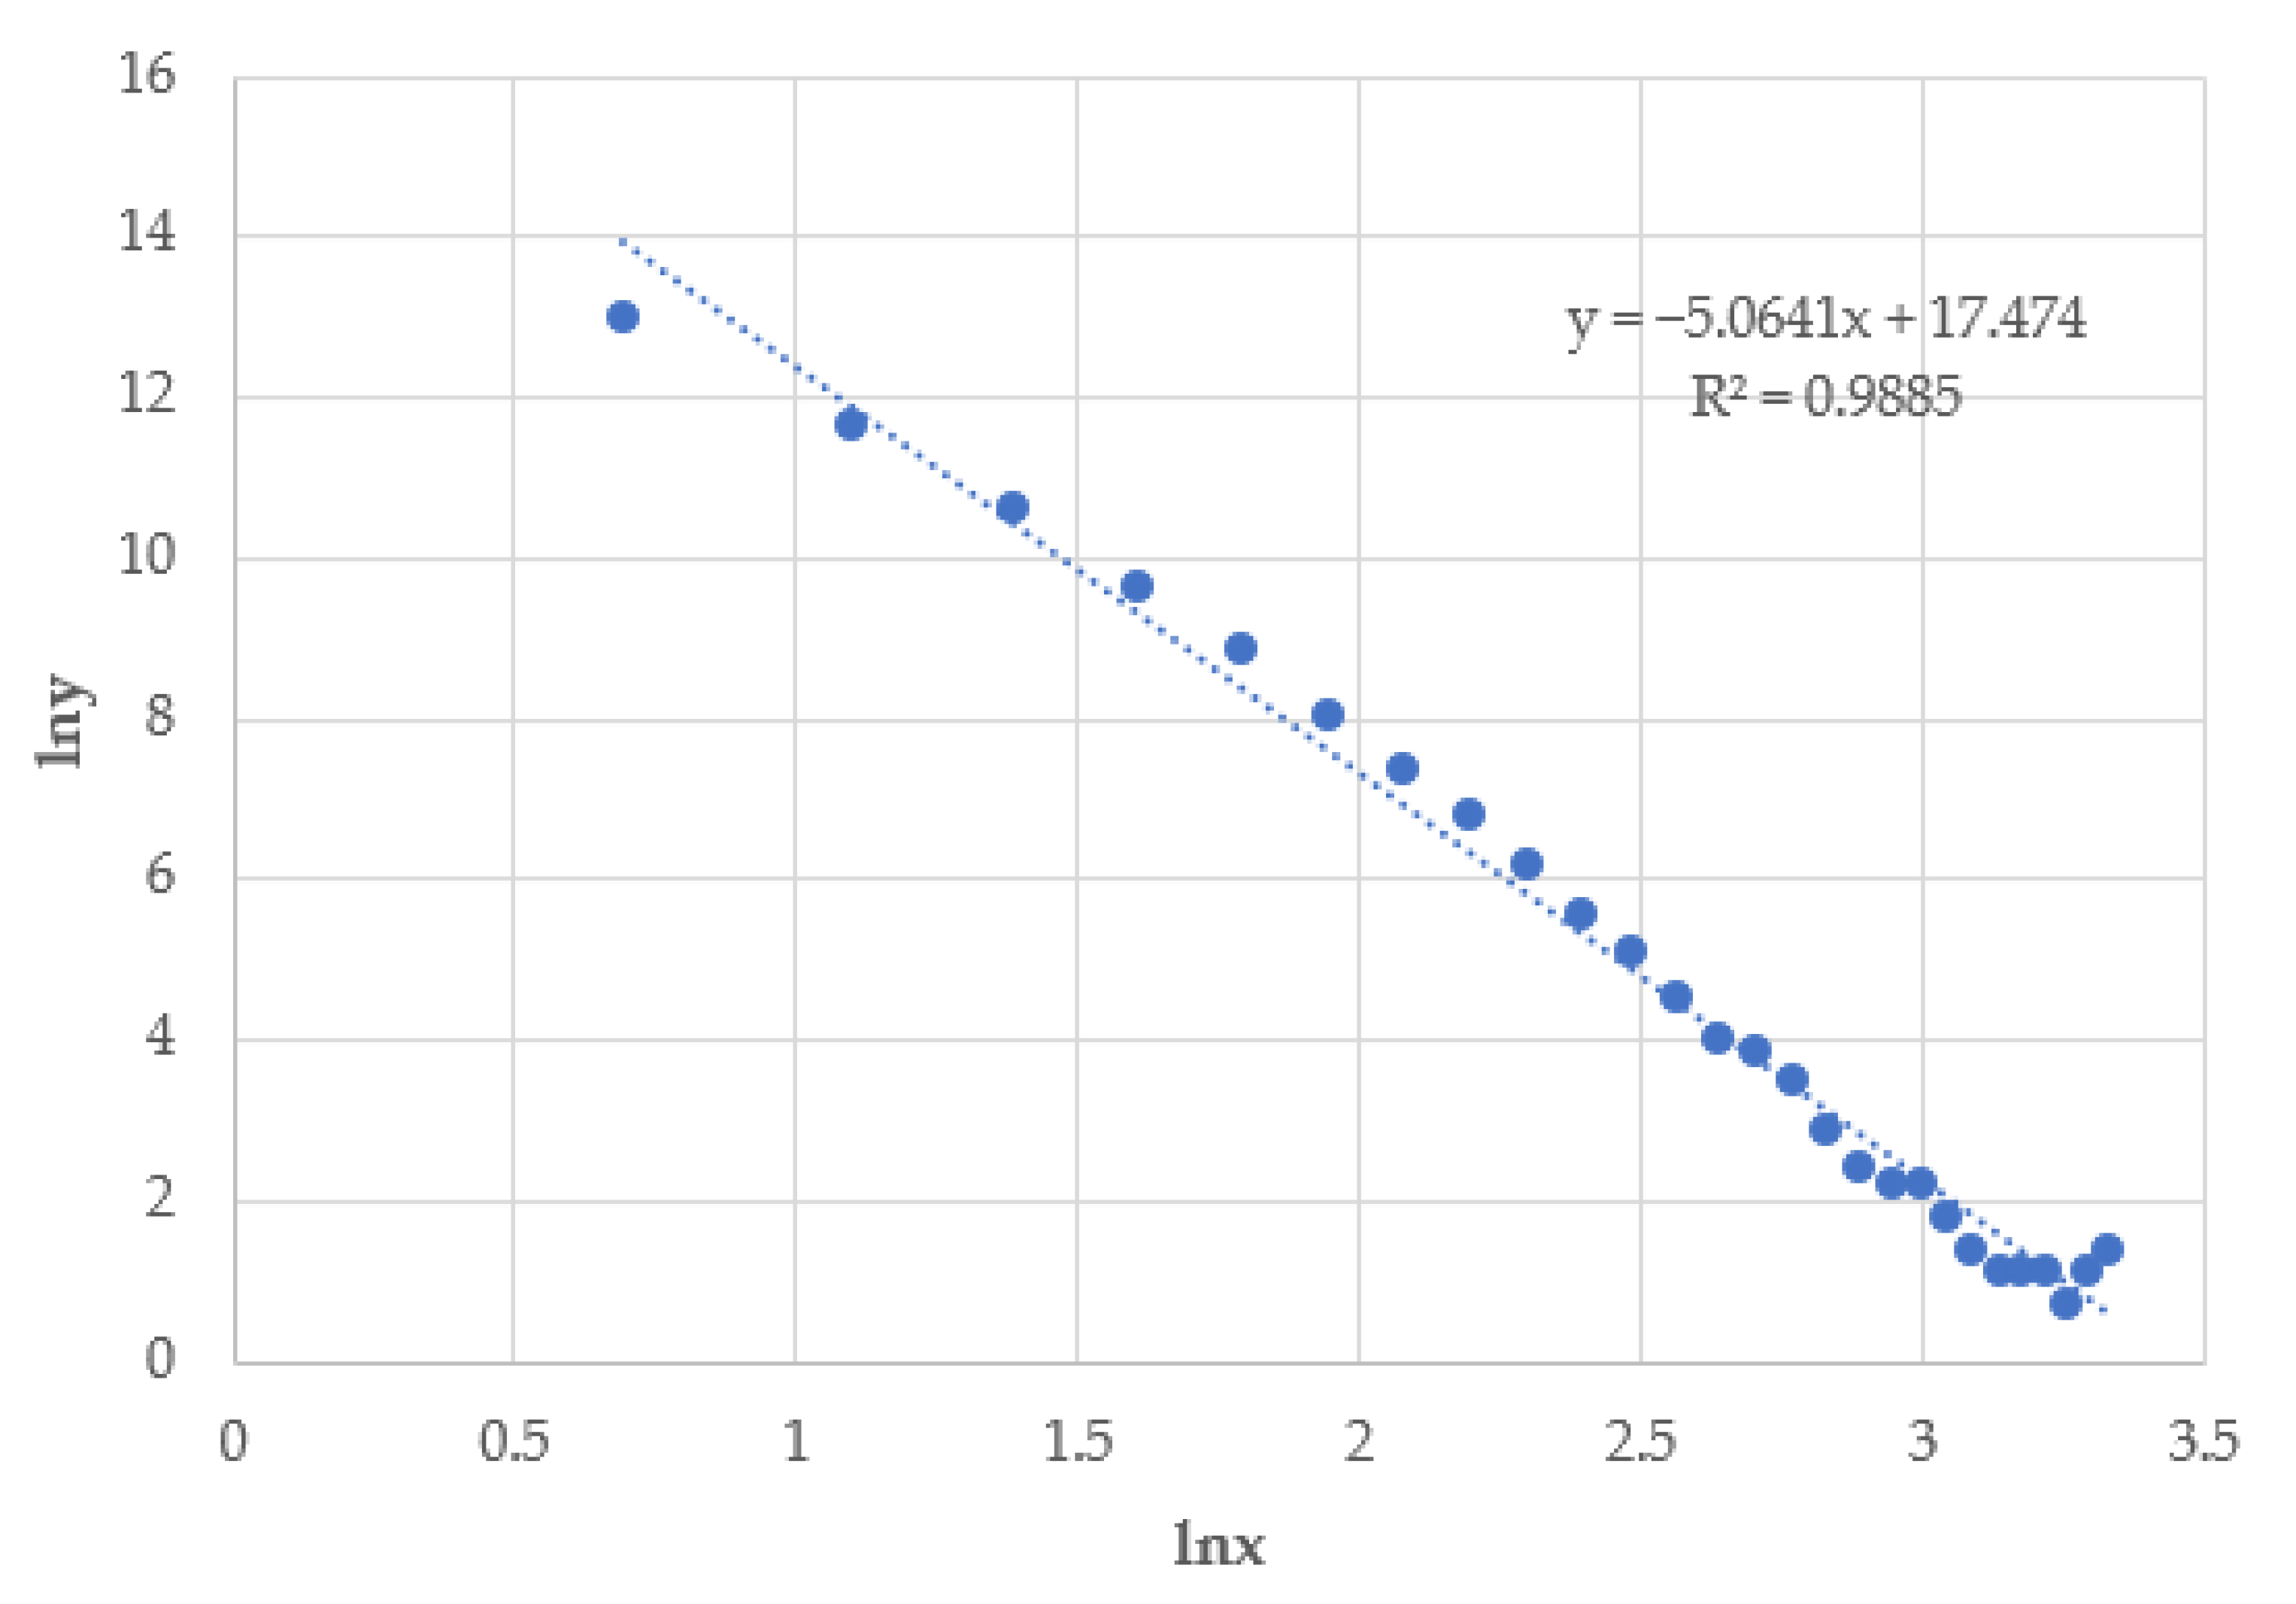
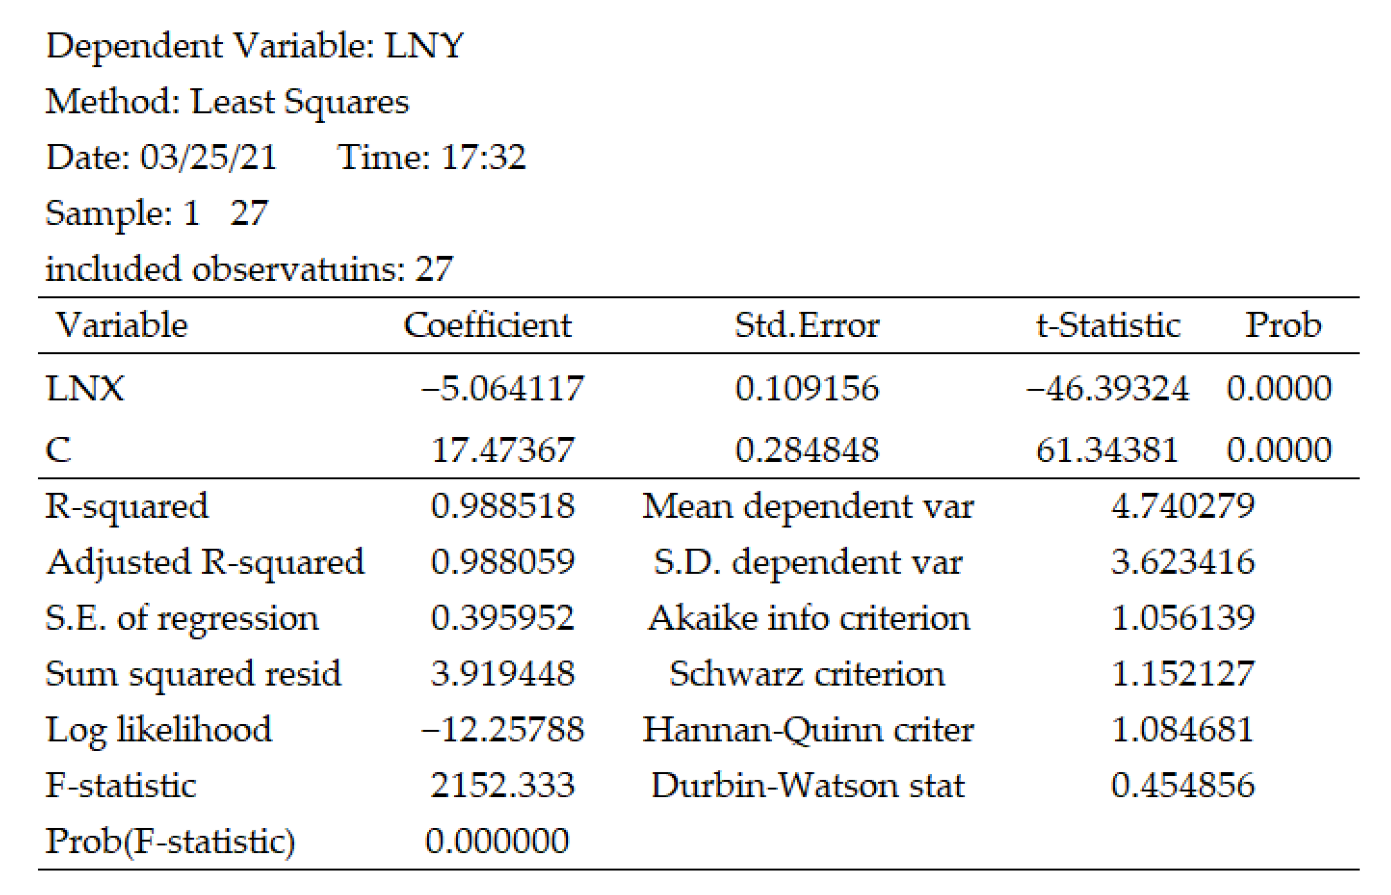
After that, the logarithmic regression analysis and statistical test are performed on whether the conclusion of Figure 1 conforms to the power-law distribution. First, x and y are respectively taken in logarithmic form, and then marked on the coordinate axis, and OLS linear regression analysis is performed to obtain the fitting equation. It is lny = −5.0641lnx + 17.474, as shown in Figure 2. Afterwards, it is statistically tested, as shown in Figure 3.
In the fitting test, the coefficient of determination R2 = 0.9885, the residual sum of squares is 3.919448, and the deviation of the sample observation value from the estimated value is small. It can be seen that the above-mentioned power-law distribution logarithmic regression model fits very well. In the t-test, assuming the significance level α = 0.05, assuming that there is no relationship between the two variable sets, looking up the table can get t0.025(25) = 2.060 (The number of samples in this paper is 27, and the degree of freedom is n − 27 = 25), calculated by the Eviews software as shown in Figure 3, the t value is −46.39324, and its absolute value is much greater than t0.025(25). It shows that the explanatory variable lnx is at the 5% significance level, rejecting the null hypothesis and passing the significance test. It can be seen that this shows that lny and lnx are in a linear relationship, that is, it can be concluded that the distribution of the number of purchases of the seller’s customers and the corresponding number of people is similar to a power-law distribution, which is expressed as a straight line with a power exponent −5.0641 as the slope. It conforms to the characteristics of power-law distribution.

4.2. Repurchase Situation of Free Shipping Products

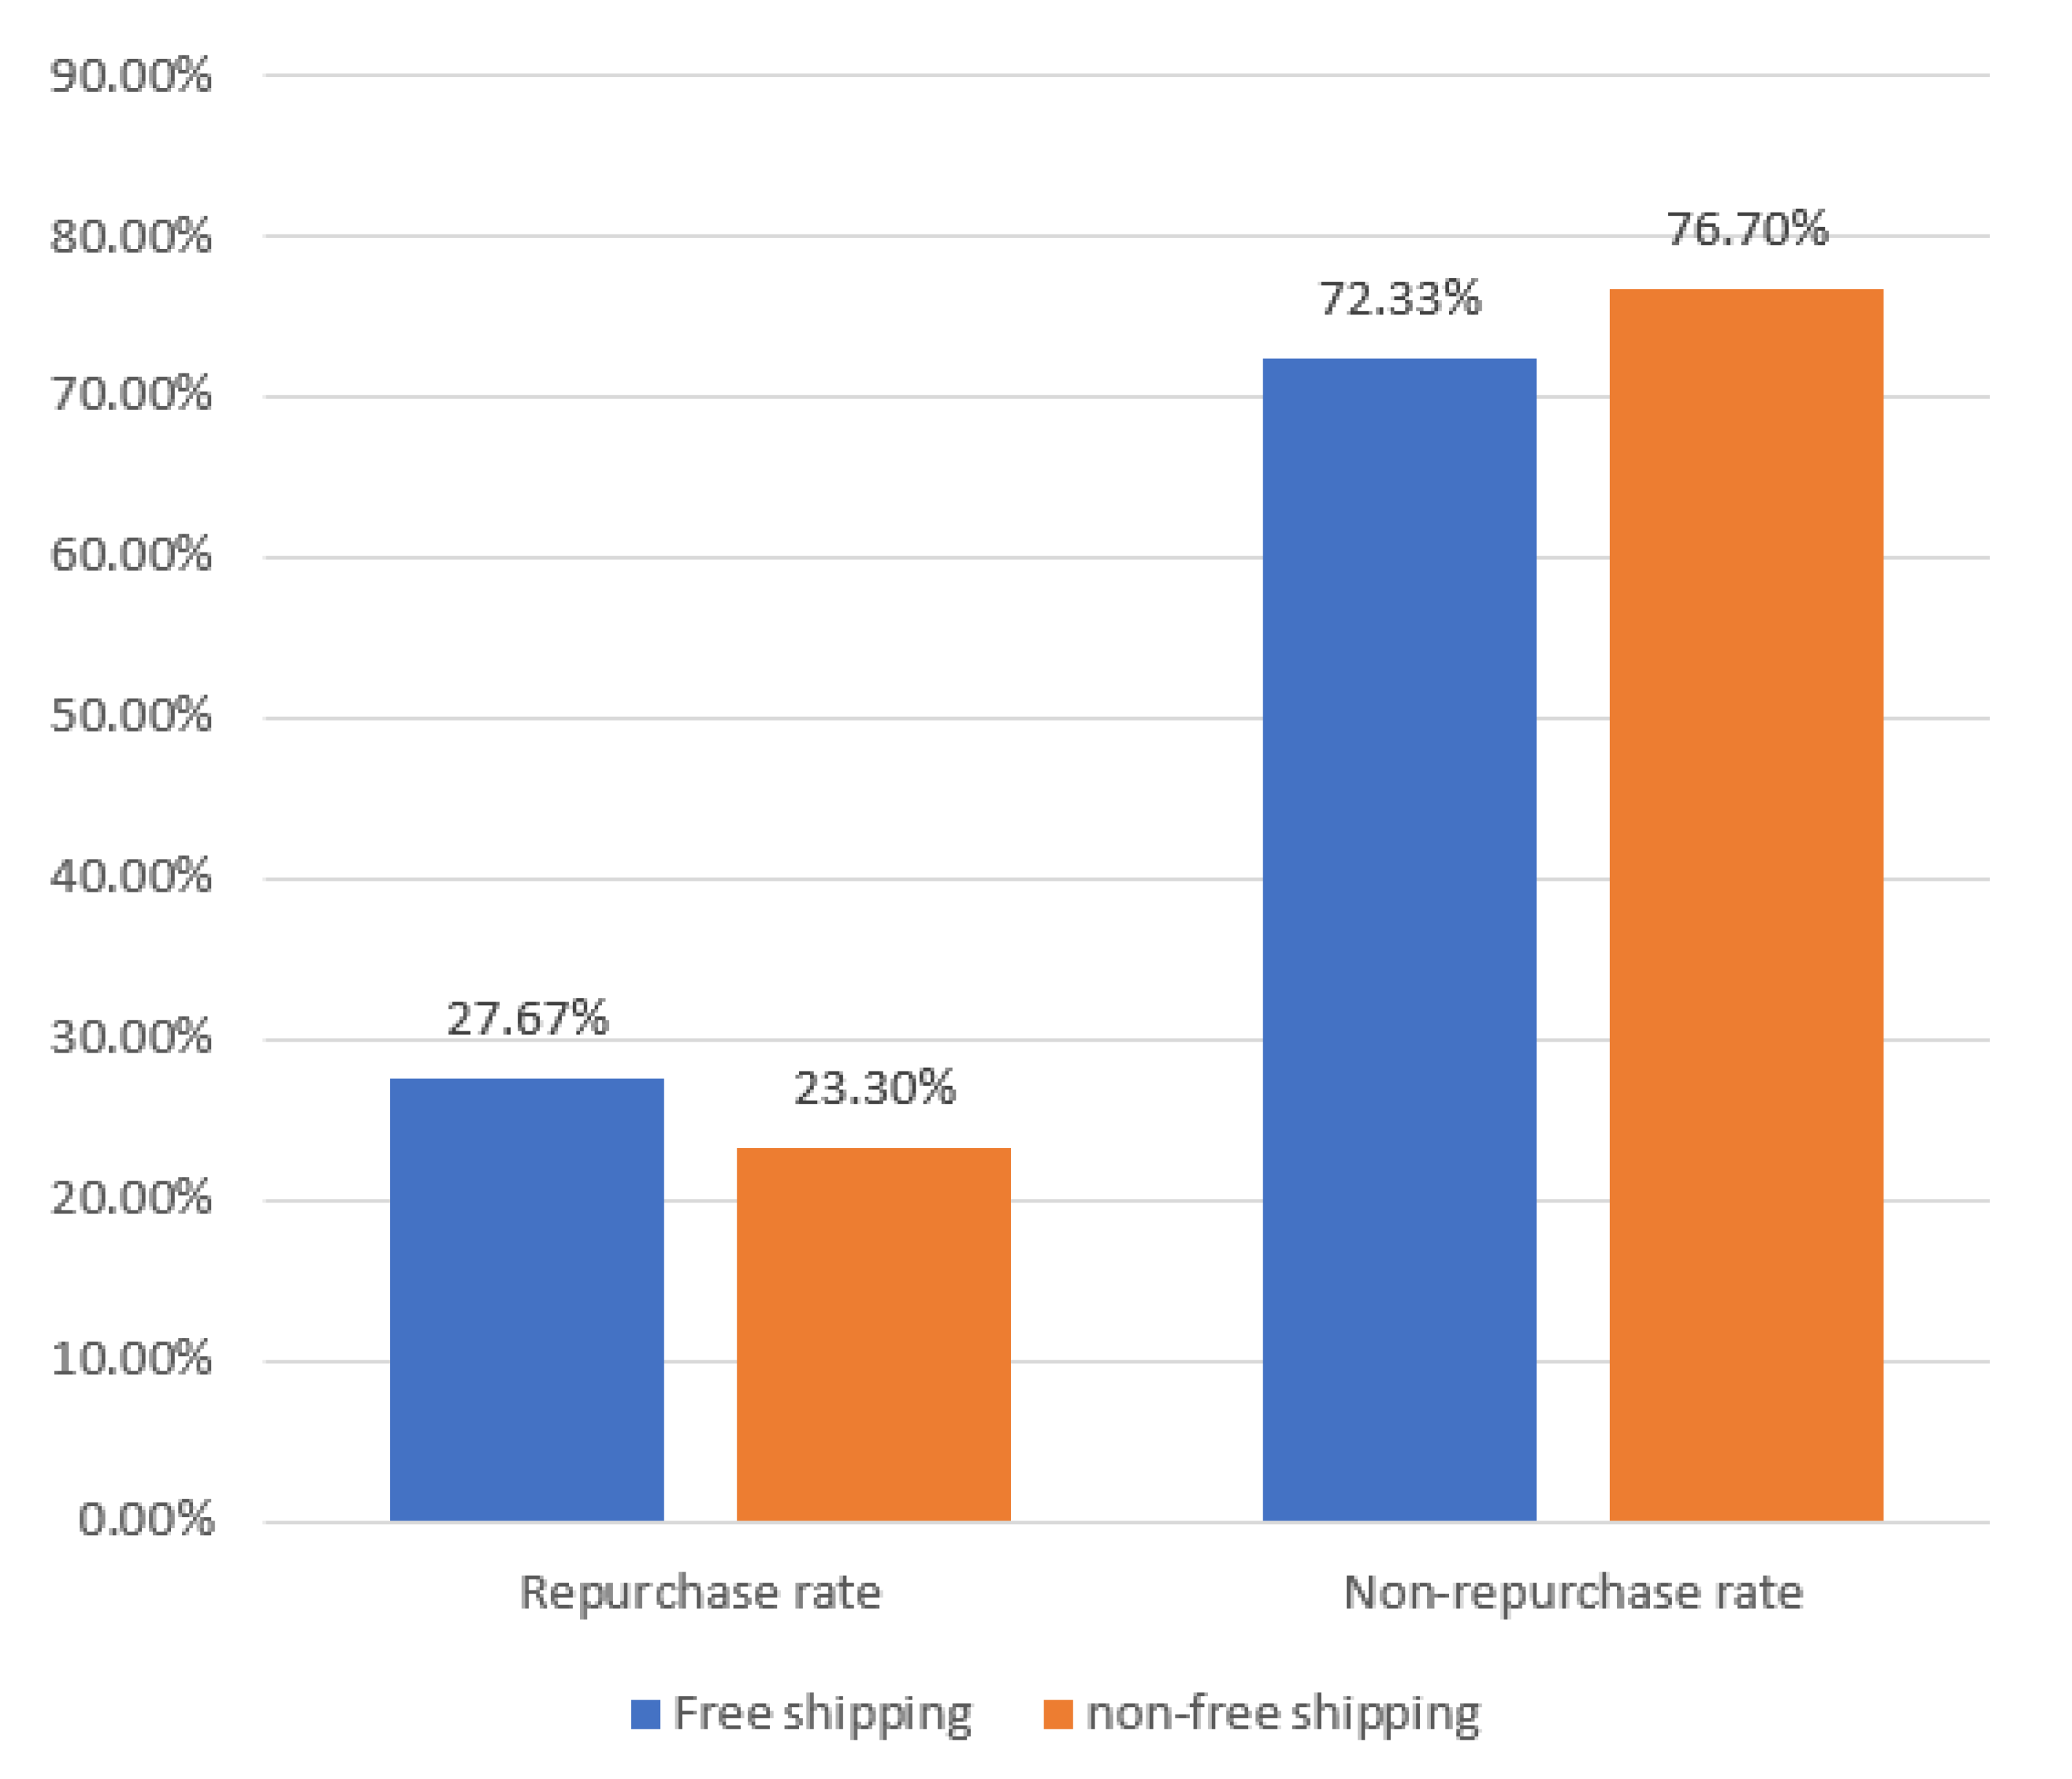
Free shipping means that the customer does not need to pay postage when purchasing the product. For the case of free shipping or not, this paper finds that it can affect the repurchase rate of the product. First, we analyzed the free shipping situation purchased by customers, and took the two cases of purchasing items with free shipping and without shipping as the abscissa, and the corresponding repurchase rate on the ordinate, as displayed in Figure 4. From the data in the figure, we can see that for free shipping products, compared with non-free shipping products, customers with free shipping products repurchase 27.67%, and the repurchase rate of products without shipping is 23.30%, which is much higher than that of non-free shipping products. It can be seen that most customers prefer it. Products with free shipping are more loyal to them, so that repeated purchases occur. At the same time, according to the results of this survey, the results of the 1000 online survey questionnaires show that under the condition of a certain total price, 856 people are more inclined to choose free shipping products, which are more popular with customers.

4.3. Repurchase Situation of Different Ordering Methods

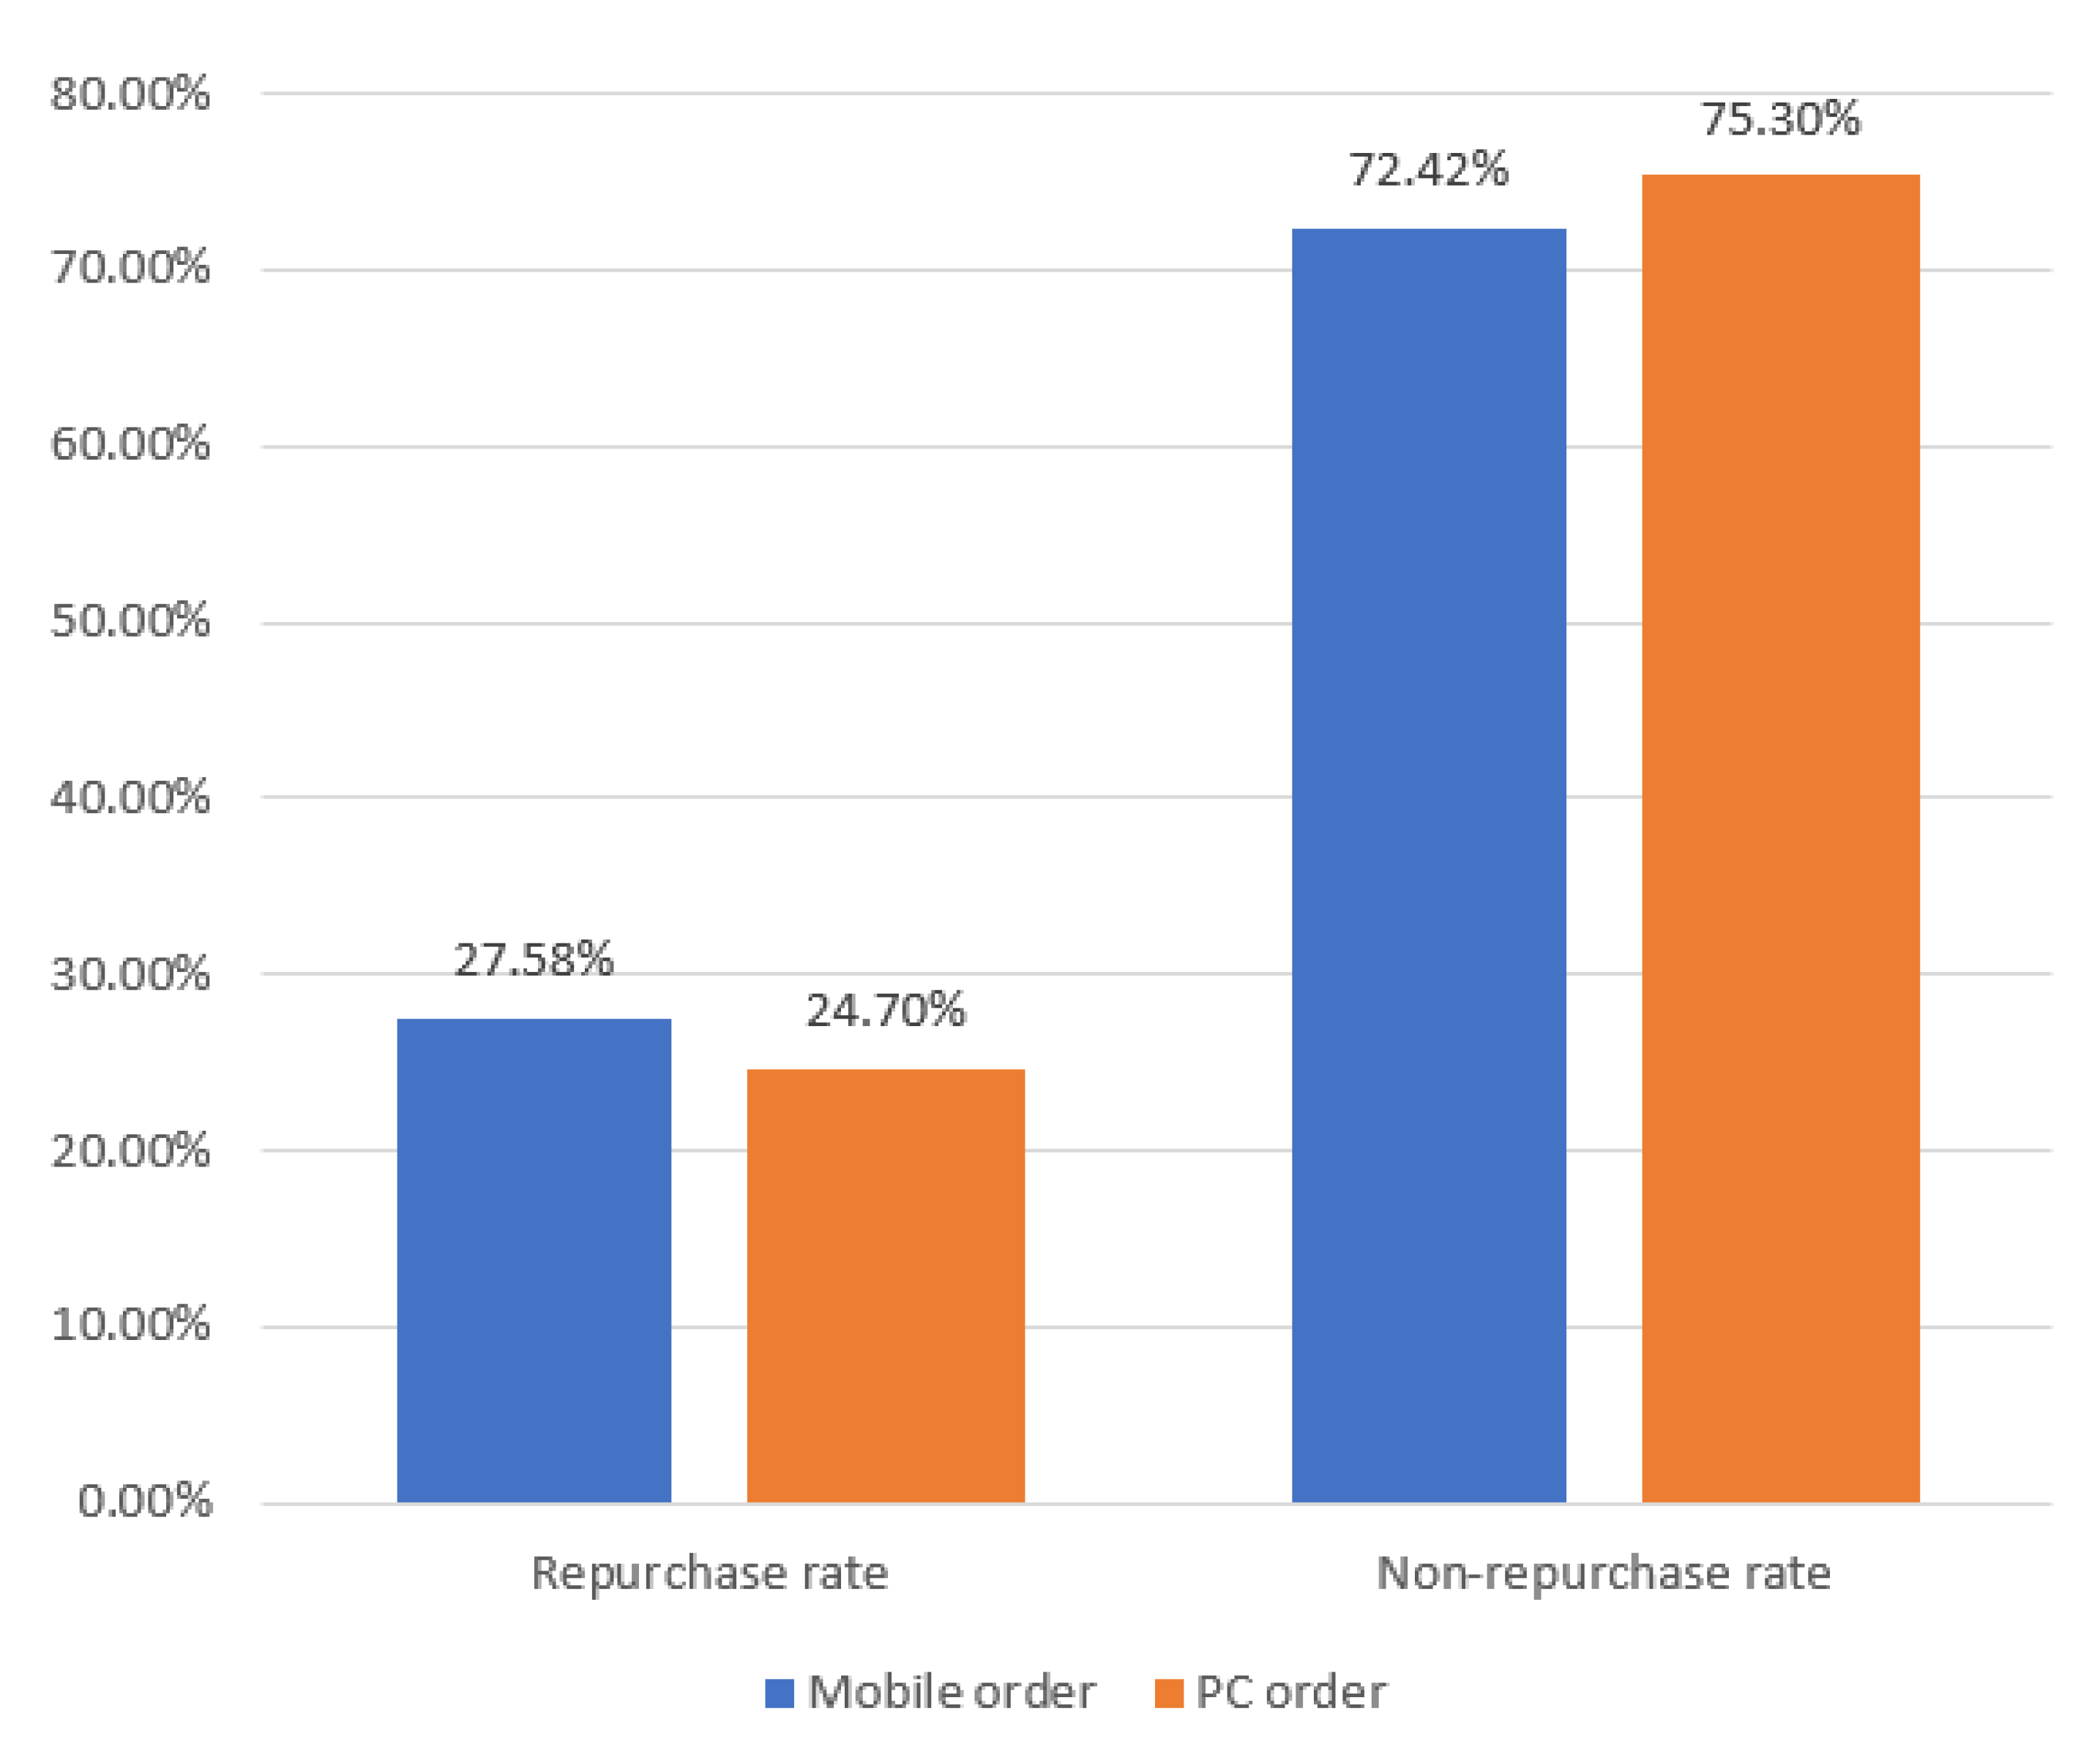
Different ordering methods mainly refer to the tools that customers use when shopping online, such as mobile terminals (mobile phones) or PC terminals (computers). For users who place orders on different clients, it can be seen from Figure 5 that the repurchase rate of users who place orders on the mobile client is slightly higher than that of users who place orders on the PC side. Nowadays, the development of social technology is faster and faster, compared to using computers, which are inconvenient to carry and cannot be browsed at any time. Because of the gradual popularization of mobile phones and other electronic products in daily life in today’s society, everyone is inseparable from mobile phones and other electronic products every day. Accordingly, people choose to use mobile phones for online shopping. Therefore, sellers can target the main mobile phone customers while maintaining PC users. For example, sellers can provide customers with a more convenient purchase interface and can increase preferential activities for mobile phones to attract more customers to browse. Through the analysis of big data, sellers can also recommend to customers their favorite items to increase the possibility of their purchase behavior.

4.4. Repurchase Situation in Each Province

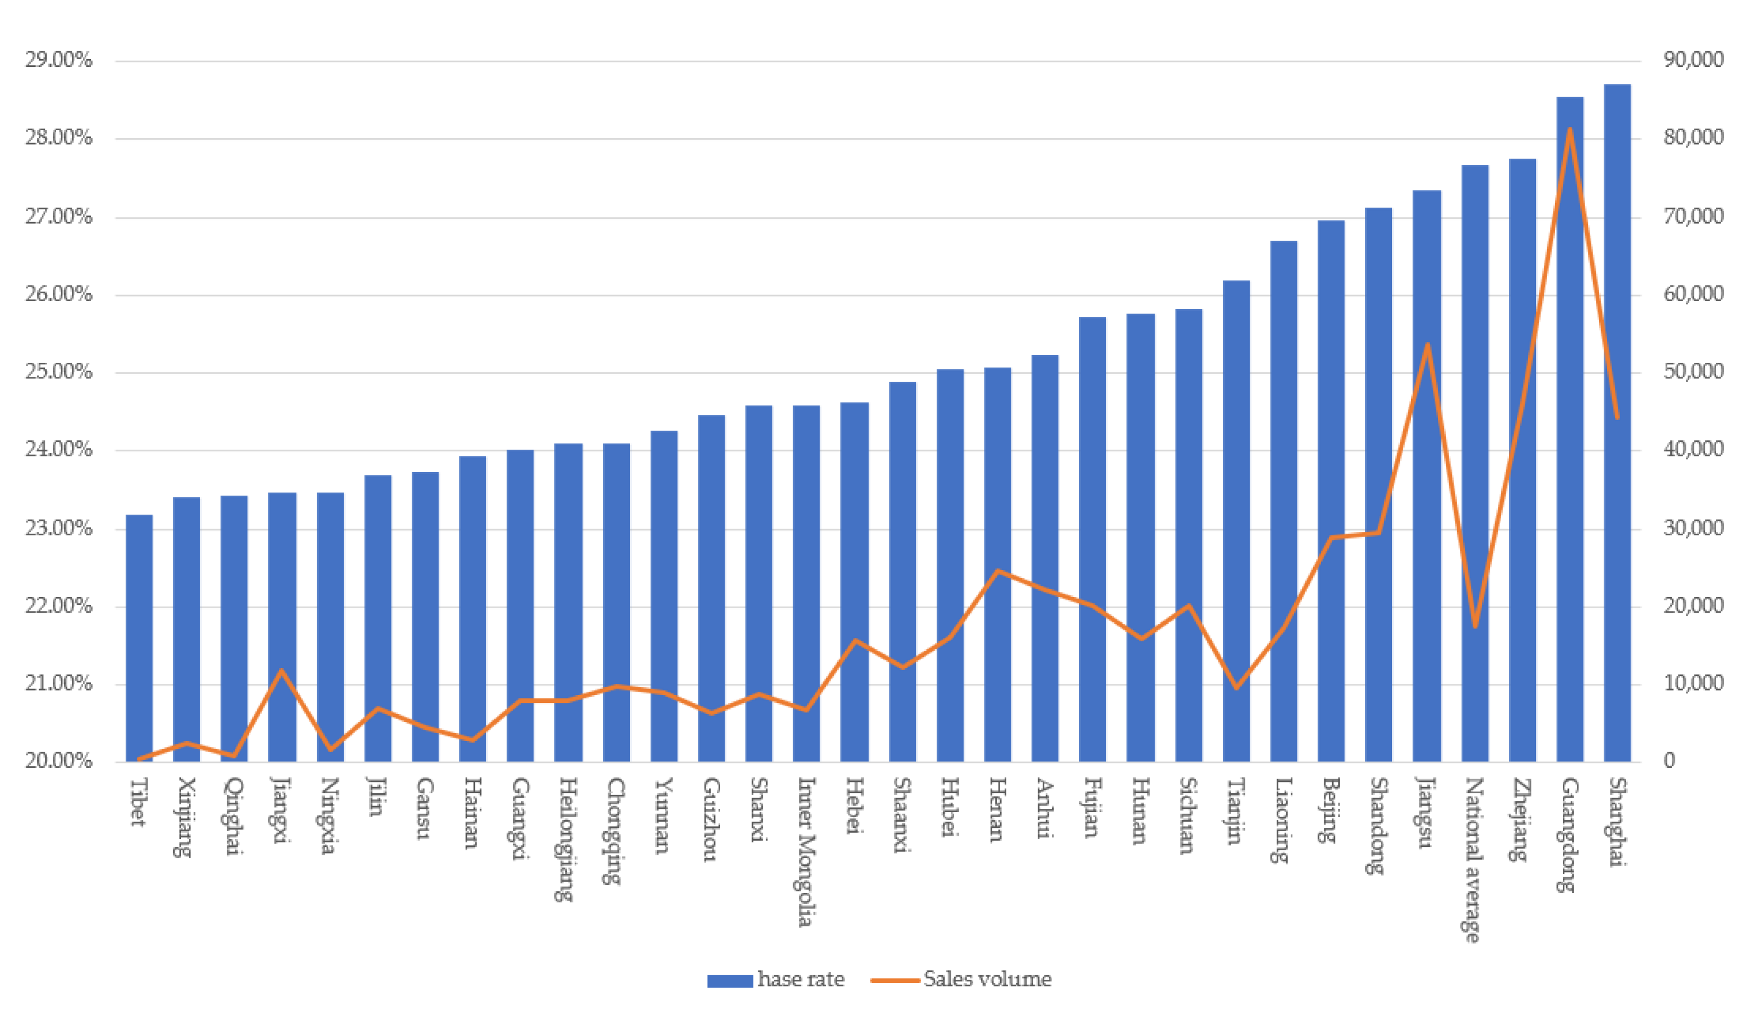
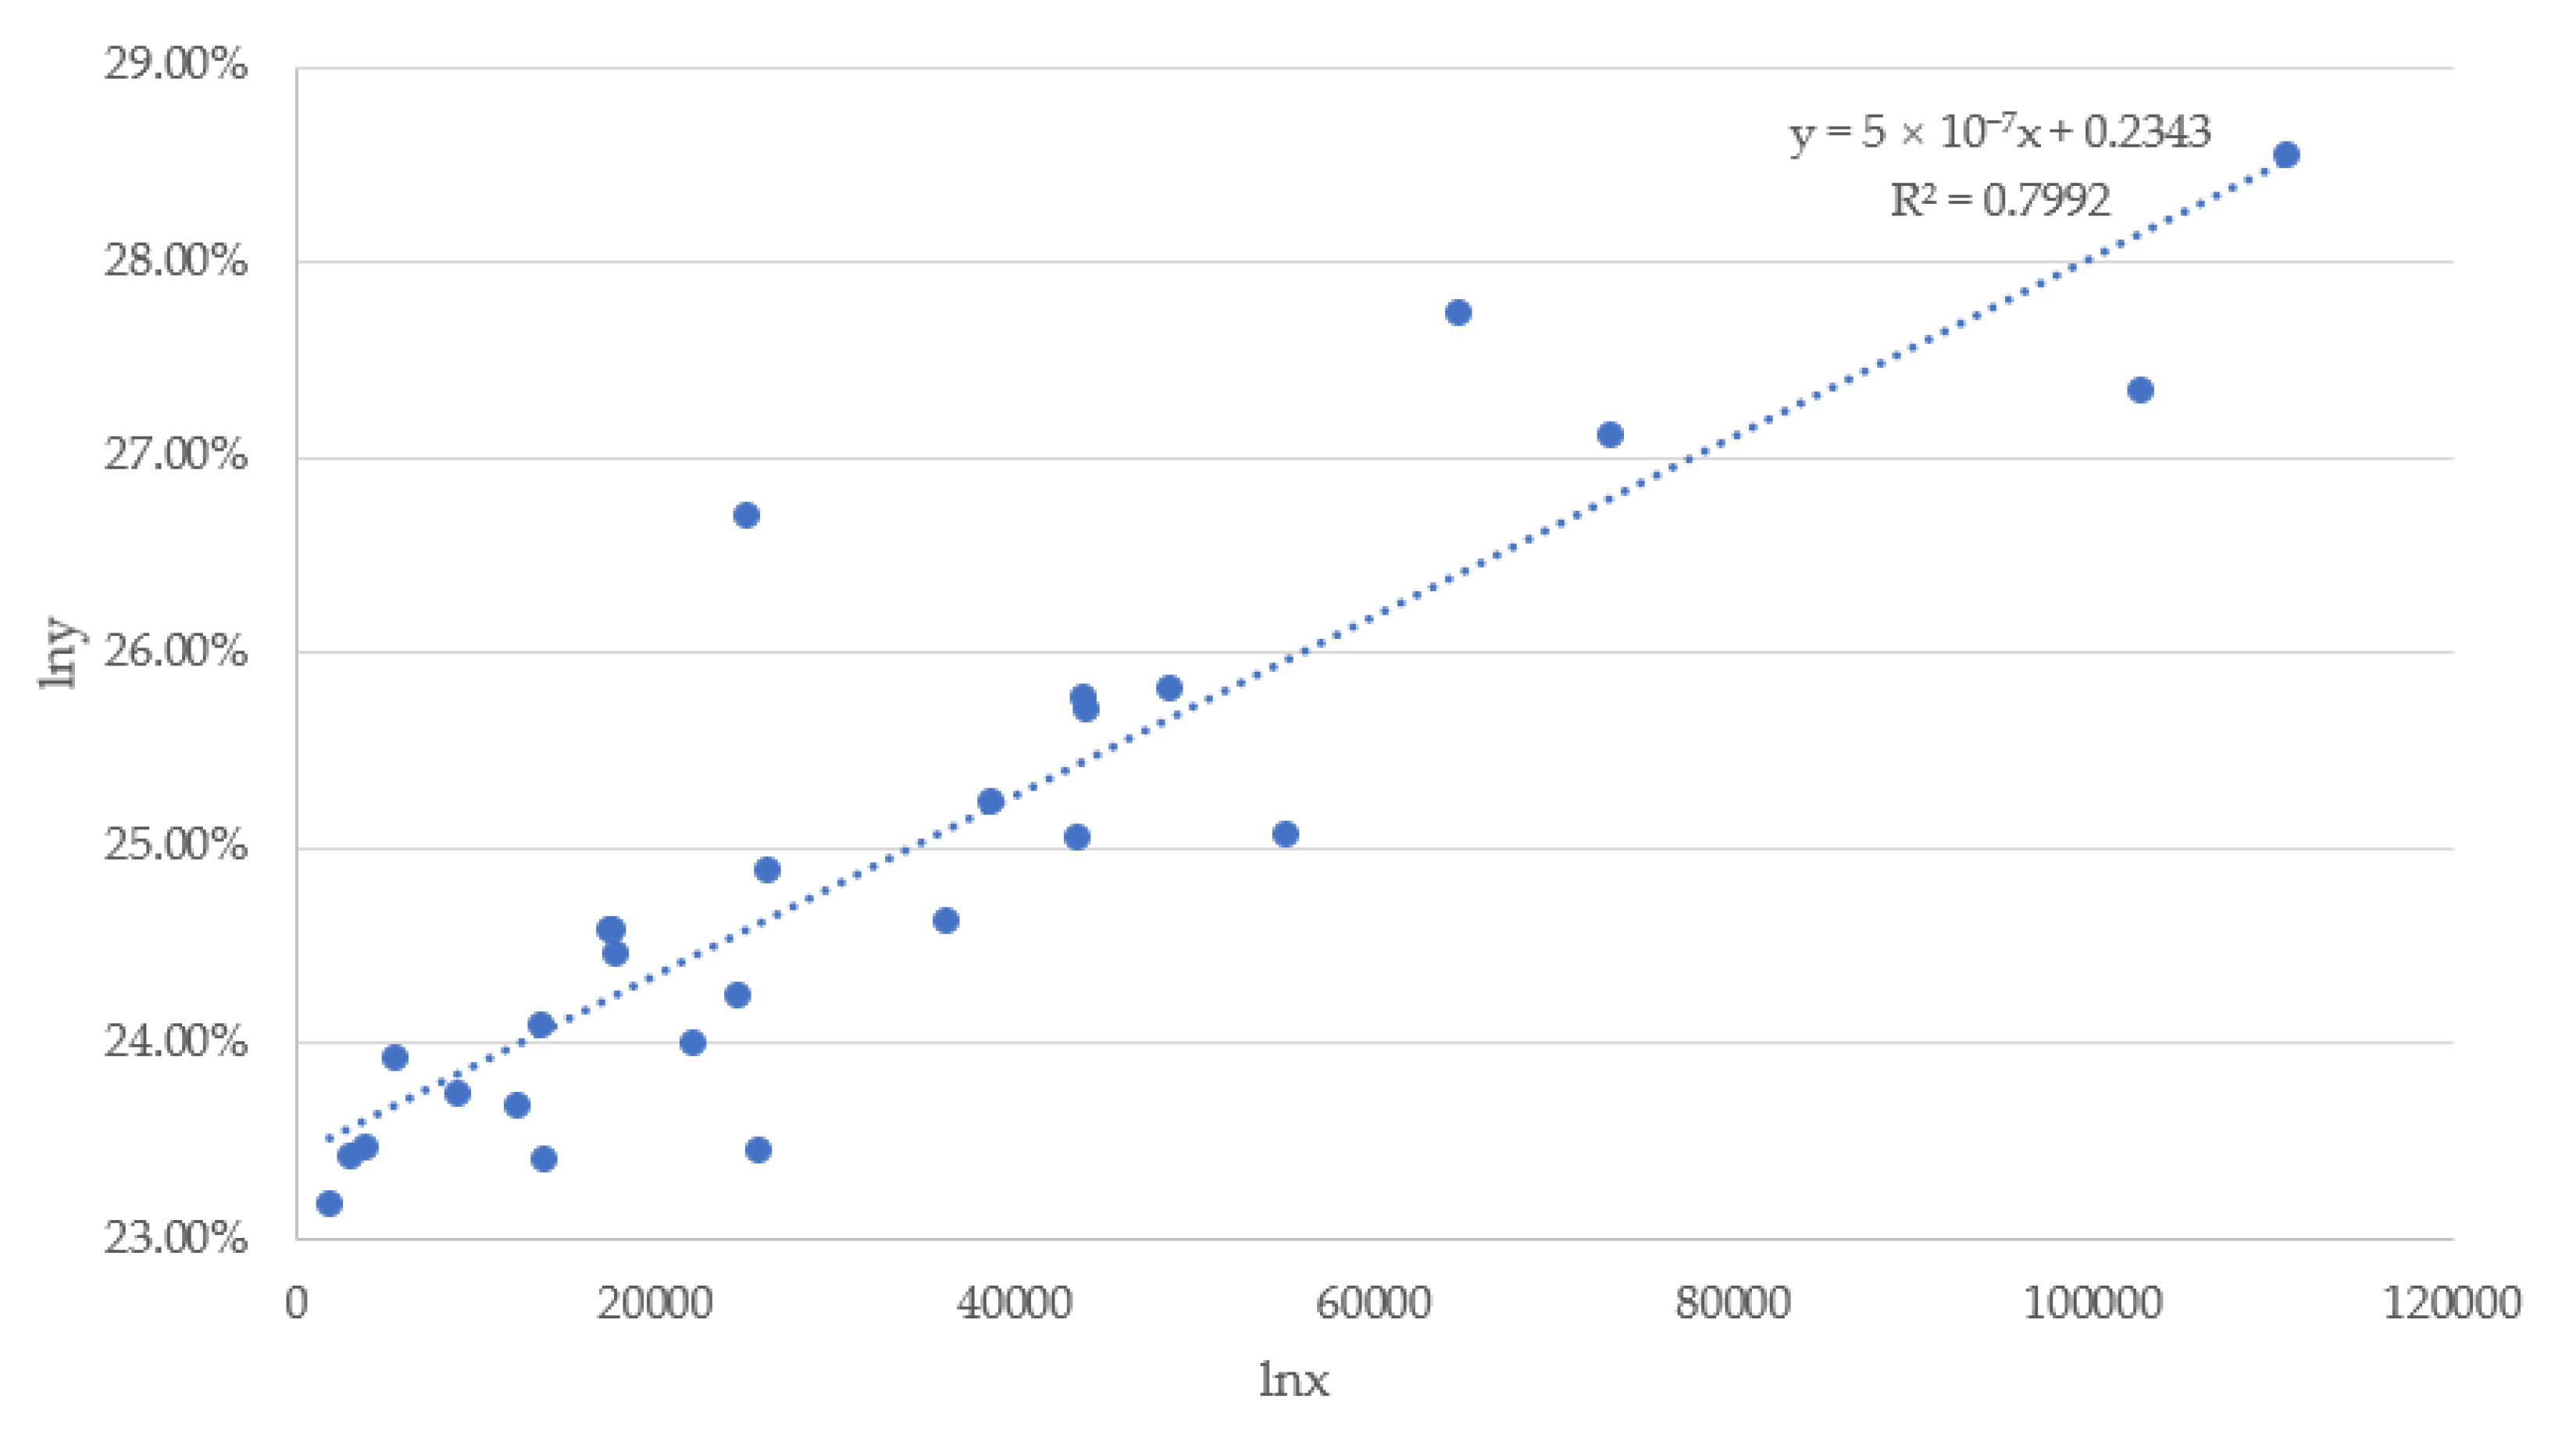
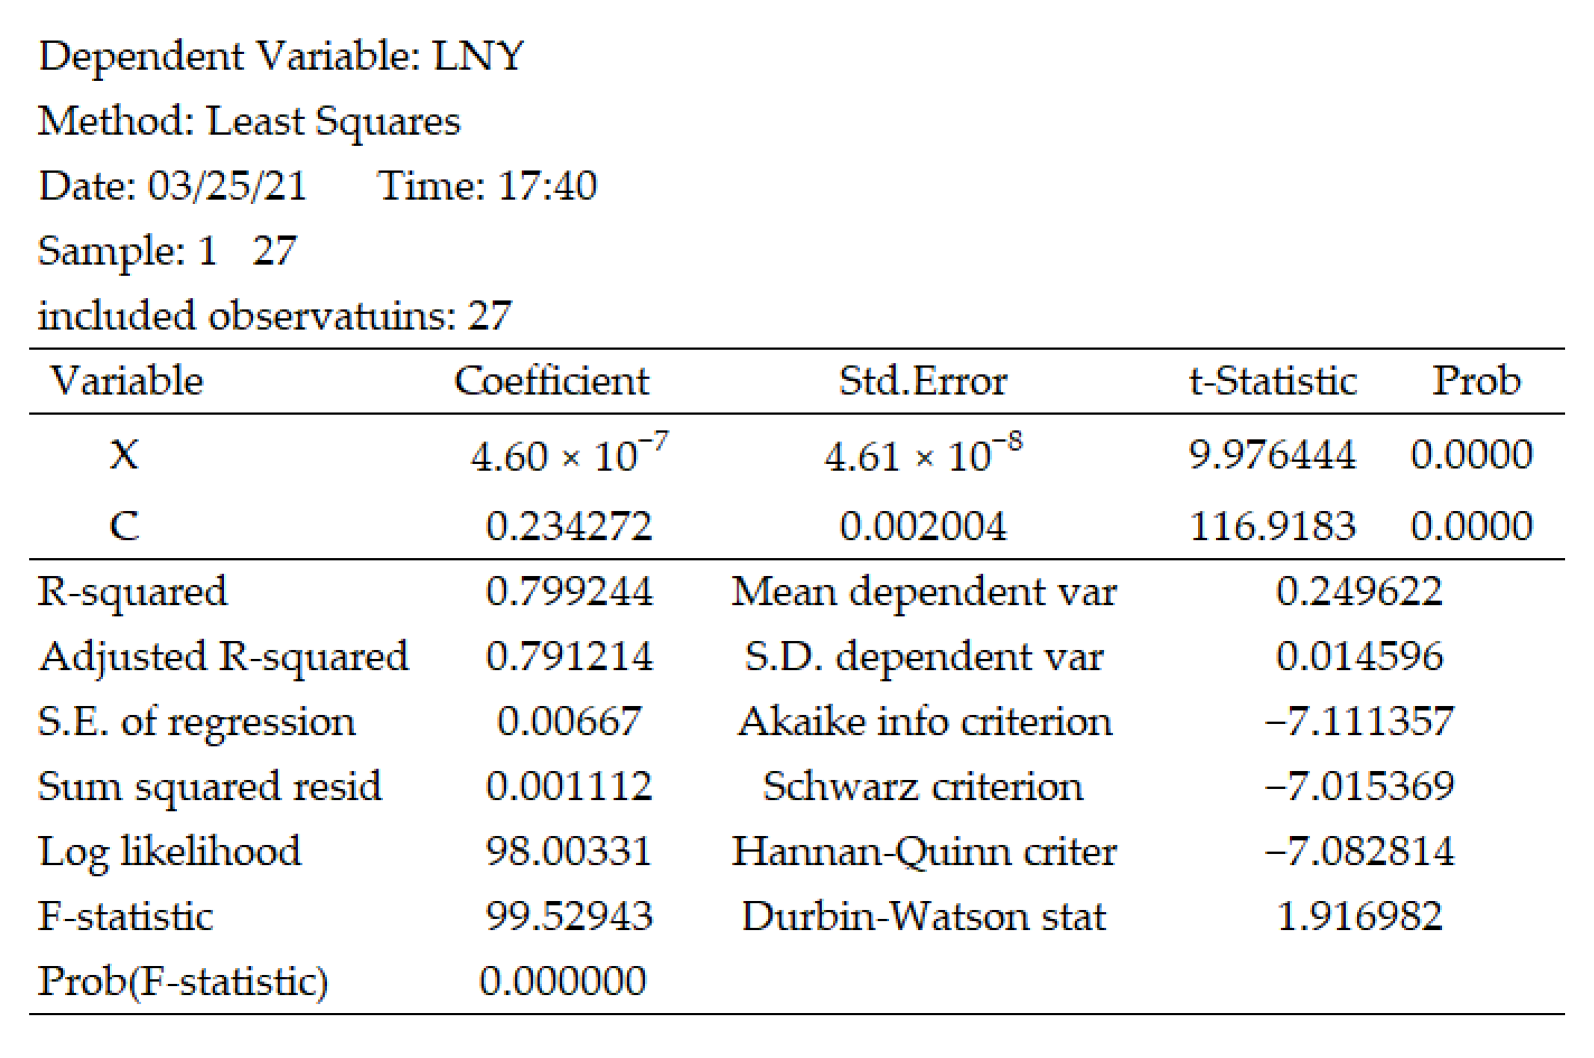
The data is classified by province, and the repurchase rate of customers in each province is calculated, as shown in Figure 6. Through comparison, it is found that only the repurchase rate of customers in Shanghai, Guangdong and Zhejiang is higher than the national average, and the rest of the provinces are slightly lower. When the national average is compared with the top ten provinces with higher repurchase rates, most of them are coastal provinces and economically developed regions in China. This shows that we assume that the repurchase rate is directly related to the local economic level. That is, the more developed the economy is, the higher the customer’s repurchase rate will be. In order to verify this conclusion, we used the 2020 GDP and the repurchase rate of each province to perform OLS linear regression analysis. Since China has four municipalities directly under the central government and the province’s GDP cannot be compared with the same standard, we first excluded the influence of the four municipalities—Beijing, Shanghai, Tianjin and Chongqing—directly under the central government. After that, linear regression is performed on the repurchase rate of the remaining provinces and the corresponding total GDP in 2020, as shown in Figure 7. The regression equation of GDP and repurchase rate is y = 5 × 10⁻⁷x + 0.2343, and the linear fit is 0.7998, the residual sum of squares is 0.001112, the degree of fitting is relatively high, and the deviation between the sample observation value and the estimated value is small, indicating that there is a correlation between the regional economy and the repurchase rate, that is, the repurchase rate is higher in economically developed regions than in economically backward regions. The t-test is performed on the regression equation between the total GDP of each province and the repurchase rate. Under the condition of the significance level α = 0.05, assuming that there is no difference between the two variable sets, look up the table to get t0.025(25) = 2.060 (the number of samples in this example is 27. That is, the degree of freedom is n − 2 = 25), calculated by the Eviews software as shown in Figure 8, the t value is 9.976444, and its absolute value is much greater than t0.025(25). It shows that the GDP of the explanatory variable area is at a significance level of 5%, rejecting the null hypothesis and passing the significance test. It can be seen that this shows that y and x are in a linear relationship, that is, the regional GDP has a strong correlation with the repurchase rate. The line chart in Figure 6 also shows the sales of each province from 16 to 20 years. It can be seen that all developed coastal cities occupy the top position in the sales volume ranking and have a large gap in sales volume from the subsequent provinces. It is inferred that the sales volume in economically developed regions also far exceeds the sales volume in other regions. (The verification here is the same as the verification of the GDP and repurchase rate mentioned above, no detailed explanation will be given here).

4.5. Analysis of Sales per Hour in a Single Day

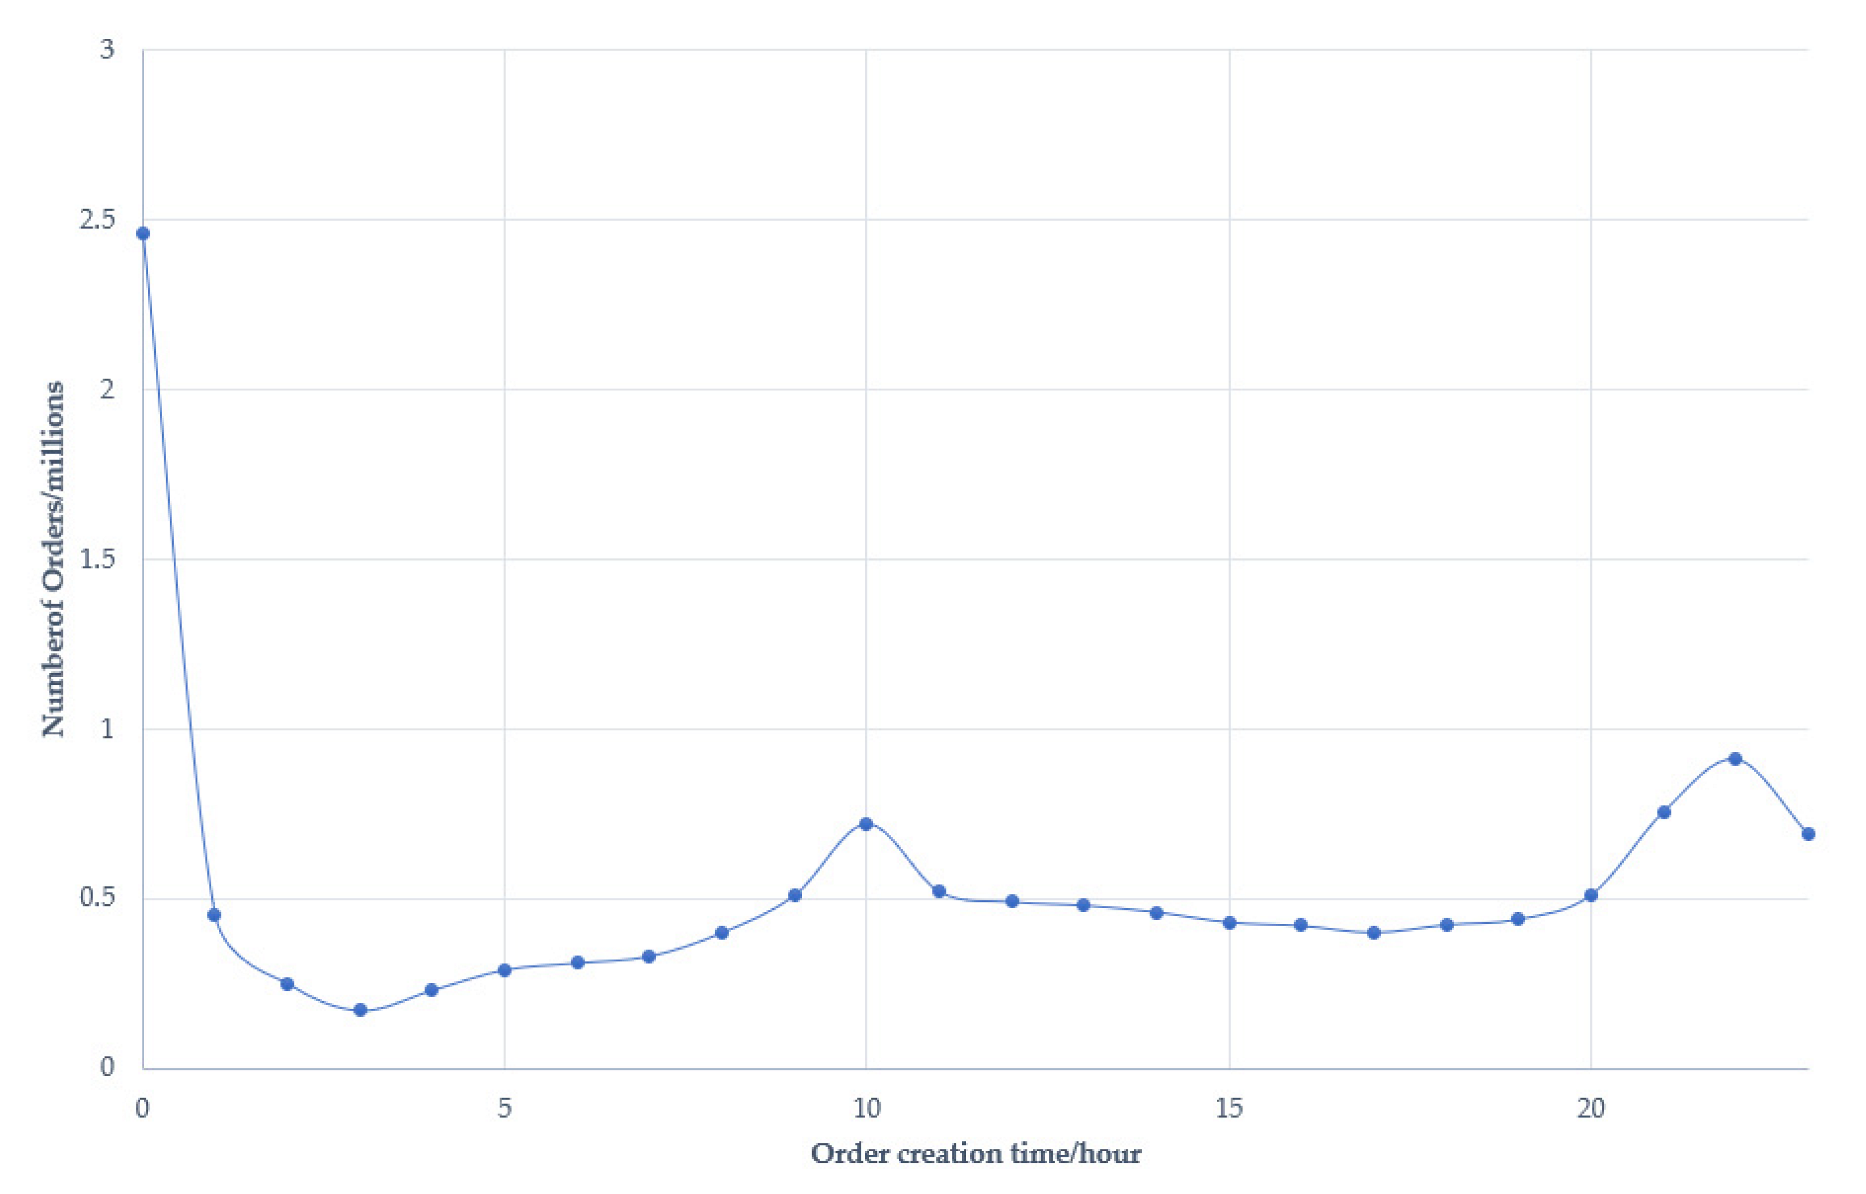
First, we calculated the average sales volume of the store in each hour of the day. Through Figure 9, we can see that the number of sales during the time period from 0 to 2 o’clock each day will usher in the first peak period, and the number is far away. It is much higher than the data on the time side afterwards, and the number of items began to slowly fall. The number of orders here is mainly because of the store’s preferential activities. At present, most stores will place orders at 0 in the morning and have huge discounts for customers. Many customers are also waiting to place orders in the early morning to get more discounts for themselves, so users are most active at this time in the early morning hours of each day, and the number of orders is the most. This is followed by the time period from 10 o’clock to 12 o’clock and 20 o’clock to 22 o’clock, followed by the second batch and the third batch of small shopping peak periods. In daily life, people usually close for lunch break from 10 a.m. to 12 a.m., and they just start to work at 13:00. During these hours, people can use their relatively free time to browse shopping websites and place orders. At the same time, it continues until 20 o’clock in the evening. From 20:00 p.m. to 22:00 p.m., users also make use of this time, and the proportion of browsing web pages and various network services is relatively high, so it is also one of the small peaks of users’ online shopping.

4.6. Time Sequence Analysis of Repurchase

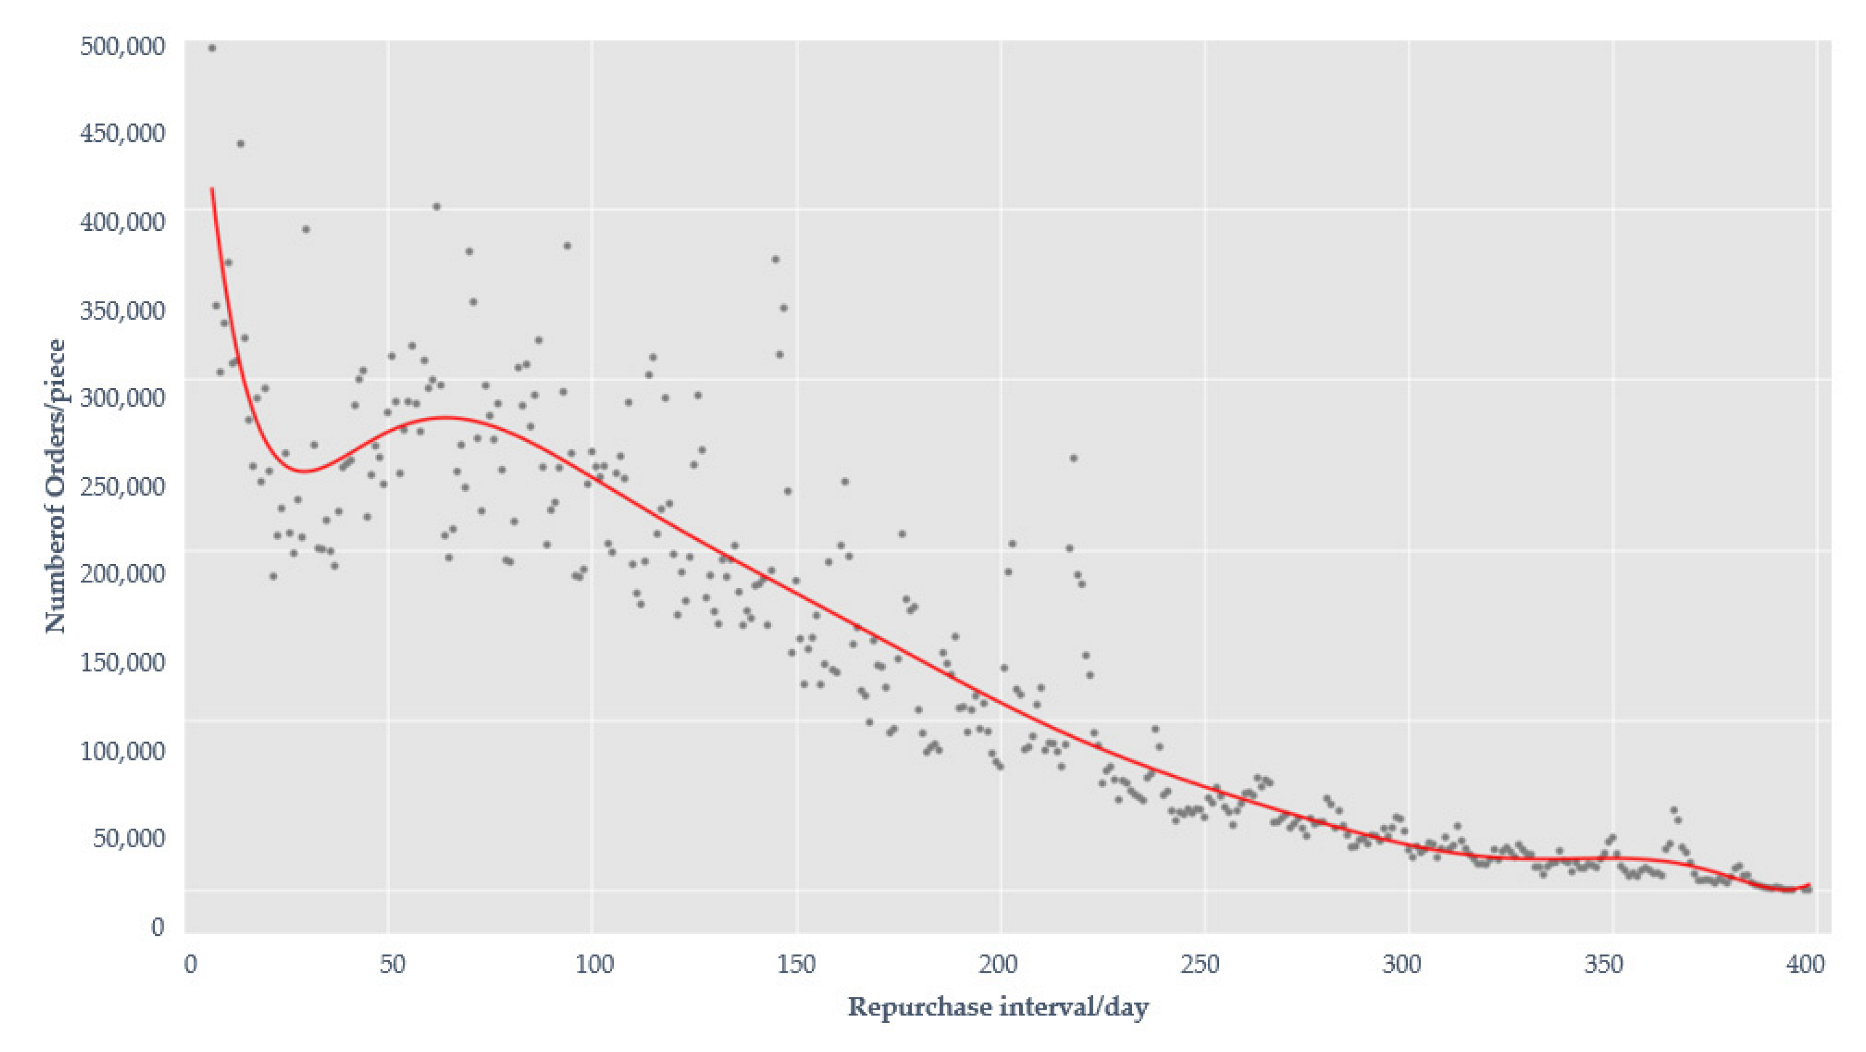
The repeat purchase sequence is the time interval between purchases by the same buyer in the same store within the adjacent time. In order to study the behavior law of customer’s repurchase sequence, the order data of each customer in the data set is sorted in order of the order creation time, and the repurchase interval between adjacent customers is calculated, so as to obtain the number of orders in each repurchase interval. Taking the number of repurchase days as the abscissa and the corresponding order quantity as the ordinate, the coordinate axis is established and the data points are filled in the graph, and then the data points are curve-fitted, and the repurchase sequence law of customers is obtained, as shown in Figure 10. It can be concluded that the proportion of customers’ repurchase interval is the highest when it is 5–7 days, that is, it is the most likely that customers will make repeat purchases after the first purchase, and then the probability of repeat purchases will gradually decrease. However, about 30 days after the purchase of goods, customers’ repurchase behavior may show a short-term upward trend, and this period is a good time to guide customers to buy back again. After this period of time, from 60 days after the purchase, the number of customers’ repurchase began to decrease gradually until it dropped to 0. Therefore, it is very important for the seller to implement the reminding strategy of commodity marketing for the 30–60 days when the customer buys the product, so that the repeat purchase of the customer will become more and more difficult as time goes by. If the effective marketing strategy is not adopted to save the customer, it will eventually lead to a serious loss of loyal customers and a serious impact on the turnover of the store.

5. Conclusions

Through data research, it is found that the number of repeated purchases and the number of customers conform to the power-law distribution, and through the research of this paper, it is found that the region where the customer is located, the use of the client and the shipping cost will affect the repurchase of the store to a certain extent. From the analysis of the time difference for repeated purchases, it can be seen that customers are most likely to repurchase within 30 days. Based on the above research and analysis, this paper can provide some suggestions for sellers to help them increase and maintain the sustainable consumption of loyal customers and improve the revenue of the store.
(1)
Compared with the products that are not delivered, the repurchase rate of free shipping products is obviously much higher. Most sellers of the same product try to provide customers with free shipping discounts, so as to enhance the goodwill of customers and keep customers making repeated purchases. Through the analysis of the ordering method, it can be seen that the customer repurchase rate on mobile phones is much higher than that on PCs. Therefore, some preferential activities can be added to the orders on mobile phones, and the layout of the homepage interface of the mobile phone store should be optimized to make the user’s operation convenient and fast, attracting more mobile phone users to join the store and make purchases to increase the repurchase rate.
(2)
The repurchase rate and sales volume vary from province to province. Through the analysis of 4.4, it can be seen that the repurchase rate and sales volume are higher in economically developed areas. Therefore, stores can build warehouses and deliver goods in some economically developed coastal areas, speed up the receiving speed of more customers as much as possible, and bring them a good experience. At the same time, they can reduce their own operating costs and unnecessary operating waste, so as to achieve the sustainable operation of the store economically.
(3)
Within 30 days of the customer’s repurchase, the customer’s message push must be targeted and timely, and the store’s after-sales service after the customer purchases the item must be attentive, so that the customer has a more comfortable experience in the process of purchasing the product.
(4)
According to the analysis of the average hourly sales number of stores every day, it can be seen that the order quantity in the early morning is the highest because of the existence of the store’s preferential activities. However, noon and evening are the most potential time for the order quantity to rise. First of all, there are few preferential activities in these two time periods, but there are peaks and valleys in the hourly sales number, indicating that users in this time period have a lot of free time and can concentrate on deciding their shopping goals. Therefore, it is recommended that the store can appropriately add some preferential activities in these two time periods.
In this paper, the customer’s behavior of online shopping cosmetics is studied, and the factors that affect the shop’s repurchase behavior are obtained. Especially after the COVID-19 epidemic, the convenience of online shopping has been reflected, and the sales volume of online shopping has increased by a large margin. Therefore, it is necessary to fully explore the customer behavior of online shopping for the formulation of sustainable marketing strategies of online platforms. At the same time, countries such as the European Union and the United States started far earlier than China in using the Internet, but they lagged far behind China in online payment and e-commerce development. Therefore, the research in this paper can provide some reference for the future e-commerce development of the European Union and the United States.
Finally, it should be pointed out that this paper uses the data of the cosmetics industry for research and analysis, which may not conform to the laws of all markets. Whether the conclusion is universal needs to be further confirmed. Secondly, the factors that affect customer repurchase are far more than that, and scholars need to further explore them in future research. Finally, the accurate prediction of the customer’s next repurchase time can be further studied in the future research.

Author Contributions

Conceptualization, W.Z. and C.J.; methodology, P.Y.; software, H.W.; validation, H.W., W.Z. and C.J.; formal analysis, C.J.; investigation, H.W.; resources, P.Y.; data curation, P.Y.; writing—original draft preparation, C.J.; writing—review and editing, W.Z.; visualization, P.Y.; supervision, H.W.; project administration, C.J.; funding acquisition, W.Z. All authors have read and agreed to the published version of the manuscript.

Funding

This research was funded by the National Natural Science Foundation of China, the Ministry of Education of the Humanities and Social Science project and the Scientific Research Project of Liaoning Provincial Department of Education, grant numbers 20BJL036, 18YJAZH138, and LG201912.

Institutional Review Board Statement

Not applicable.

Informed Consent Statement

Not applicable.

Data Availability Statement

Not applicable.

Conflicts of Interest

The authors declare no conflict of interest.

References

  1. Jiang, Q.; Sun, J.; Yang, C.; Gu, C. The Impact of Perceived Interactivity and Intrinsic Value on Users’ Continuance Intention in Using Mobile Augmented Reality Virtual Shoe-Try-On Function. Systems 2022, 10, 3. [Google Scholar] [CrossRef]
  2. Szymkowiak, A.; Gaczek, P.; Jeganathan, K.; Kulawik, P. The impact of emotions on shopping behavior during epidemic. What a business can do to protect customers. J. Consum. Behav. 2021, 20, 48–60. [Google Scholar] [CrossRef]
  3. Gong, W.; Stump, R.L.; Maddox, L.M. Factors influencing consumers’ online shopping in China. J. Asia Bus. Stud. 2013, 7, 214–230. [Google Scholar] [CrossRef]
  4. Le, T.N.; Pham, V.K.; Le Nguyen, T. Risks perception toward online shopping in vietnam during the COVID-19 outbreak. Crit. Rev. 2020, 7, 1257–1269. [Google Scholar]
  5. Zhao, B.; Cao, J. Data analysis of online shopping platform during the COVID-19 epidemic of Coronavirus disease. Arch. Community Med. Public Health 2021, 7, 023–032. [Google Scholar]
  6. Ruma, A. Assessment of the Bottlenecks and Potential Challenges of Online Shopping during COVID-19. J. Commer. Manag. Thought 2021, 12, 46–52. [Google Scholar] [CrossRef]
  7. Fang, Y.-S.; Fang, L.-C. A Review of Chinese E-Commerce Research: 2001–2020. IEEE Access 2022, 10, 49015–49027. [Google Scholar] [CrossRef]
  8. He, J. Sustainable Seafood Consumption in Action: Reinvigorating Consumers’ Right to Information in a Borderless Digital World. J. Int. Econ. Law 2022, 1, 171–190. [Google Scholar] [CrossRef]
  9. Mu, A.; Sj, B.; Tr, C.; Tb, B.; Js, D. From ambivalence to trust: Using blockchain in customer loyalty programs. Int. J. Inf. Manag. 2022, 107, 2411–2502. [Google Scholar]
  10. Ozkan, M.; Cek, K.; Eyupoglu, S.Z. Sustainable Development and Customer Satisfaction and Loyalty in North Cyprus: The Mediating Effect of Customer Identification. Sustainability 2022, 14, 5196. [Google Scholar] [CrossRef]
  11. Vieira, V.A.; Agnihotri, R.; Almeida, M.D.; Lopes, E.L. How cashback strategies yield financial benefits for retailers: The mediating role of consumers’ program loyalty. J. Bus. Res. 2022, 141. [Google Scholar]
  12. Wu, X.; Liao, H. Modeling personalized cognition of customers in online shopping. Omega 2021, 104, 102471. [Google Scholar] [CrossRef]
  13. Brüggemann, P.; Pauwels, K. Consumers’ Attitudes and Purchases in Online Versus Offline Grocery Shopping. In Advances in National Brand and Private Label Marketing; Springer: Berlin/Heidelberg, Germany, 2022; pp. 39–46. [Google Scholar]
  14. Jansi, R.K.; Catherine, R.; Saillaja, V. A Study on Problems Faced by the Customers in Online Shopping. J. Adv. Res. Dyn. Control. Syst. 2019, 11, 112–116. [Google Scholar]
  15. Yi, Y.; Liu, Z.-y.; Xiong, Y.-z. Evaluate E-loyalty of sales website: A Fuzzy mathematics method. In Proceedings of the Integration and Innovation Orient to E-Society; Springer: Boston, MA, USA, 2007; Volume 2, pp. 582–589. [Google Scholar]
  16. Chen, Y.; Wang, H.; Wang, L.; Ding, J. Consumer Identity and Loyalty in Electronic Product Offline Brand Operation: The Moderator Effect of Fanship. Information 2021, 12, 282. [Google Scholar] [CrossRef]
  17. Amornkitvikai, Y.; Tham, S.Y.; Harvie, C.; Buachoom, W.W. Barriers and Factors Affecting the E-Commerce Sustainability of Thai Micro-, Small- and Medium-Sized Enterprises (MSMEs). Sustainability 2022, 14, 8476. [Google Scholar] [CrossRef]
  18. Li, Z.; Zeng, Q.; Cheng, X. Mechanism Study of Repurchase Intention in Cross-Border E-Commerce. In Proceedings of the Twelfth International Conference on Management Science and Engineering Management, Melbourne, Australia, 1–4 August 2018; Springer: Cham, Switzerland, 2019; pp. 1465–1475. [Google Scholar]
  19. Rahehagh, A.; Ameli, A.; Saeednia, H.; Darvishi, Z.A. Educating the concepts of a grounded theory with the case of brand attachment in online shopping behavior. Rev. Conrado 2020, 16, 149–156. [Google Scholar]
  20. Xiao, L.; Guo, F.; Yu, F.; Liu, S. The Effects of Online Shopping Context Cues on Consumers’ Purchase Intention for Cross-Border E-Commerce Sustainability. Sustainability 2019, 11, 2777. [Google Scholar] [CrossRef] [Green Version]
  21. Brynjolfsson, E.; Yu, J.H.; Simester, D. Goodbye Pareto Principle, Hello Long Tail: The Effect of Search Costs on the Concentration of Product Sales. Manag. Sci. 2011, 57, 1373–1386. [Google Scholar] [CrossRef] [Green Version]
  22. Pushpakumara, J.; Wanninayake, W. The Impact of After Sales Service Quality on Customer Brand Loyalty: With Special Reference to Construction Machinery Industry in Sri Lanka; University of Kelaniya: Colombo, Sri Lanka, 2019. [Google Scholar]
  23. Saidin, Z.H.; Wan, A.; Noraini, N.; Saad, R.; Mokhtar, S. The Impact of Industry-Specific After-Sales Service Quality towards the Enhancement of Customer Loyalty: A Case of Malaysian National Carmakers. Product. Manag. 2021, 26, 174–198. [Google Scholar]
  24. Wang, T.; He, T.; Cheng, Y. Customer satisfaction-oriented after-sales service node analysis for home appliance enterprise. Int. J. Serv. Technol. Manag. 2019, 25, 556–584. [Google Scholar] [CrossRef]
  25. Murillo-Zegarra, M.; Ruiz-Mafe, C.; Sanz-Blas, S. The Effects of Mobile Advertising Alerts and Perceived Value on Continuance Intention for Branded Mobile Apps. Sustainability 2020, 12, 6753. [Google Scholar] [CrossRef]
  26. Scozzafava, G.; Mauracher, C.; Gerini, F. Sustainable Marketing and Consumers’ Food Preference. Sustainability 2022, 14, 8360. [Google Scholar] [CrossRef]
  27. Diez-Martin, F.; Blanco-Gonzalez, A.; Prado-Roman, C. Research Challenges in Digital Marketing: Sustainability. Sustainability 2019, 11, 2839. [Google Scholar] [CrossRef] [Green Version]
  28. Reardon, T.; Belton, B.; Liverpool Tasie, L.S.O.; Lu, L.; Nuthalapati, C.S.; Tasie, O.; Zilberman, D. E-commerce’s fast-tracking diffusion and adaptation in developing countries. Appl. Econ. Perspect. Policy 2021, 43, 1243–1259. [Google Scholar] [CrossRef]
  29. Goldstein, M.L.; Morris, S.A.; Yen, G.G. Problems with Fitting to the Power-Law Distribution. Phys. Condens. Matter 2004, 41, 255–258. [Google Scholar] [CrossRef] [Green Version]
  30. Zhang, L.; Li, Y.; Wu, X.; Feng, Q. Research on Fractal Portfolio Model Under Power-Law Distribution of Return Rate. Econ. Comput. Econ. Cybern. Stud. Res. 2021, 55, 219–232. [Google Scholar]
  31. Dismuke, C.; Lindrooth, R. Ordinary Least Squares. Betascript Publ. 2010, 93, 93–104. [Google Scholar]
  32. Tian, Y.; Wiens, D.P. On equality and proportionality of ordinary least squares, weighted least squares and best linear unbiased estimators in the general linear model. Stat. Probab. Lett. 2006, 76, 1265–1272. [Google Scholar] [CrossRef]
  33. Cai, T.T.; Yuan, M. Discussion: “A significance test for the lasso”. Ann. Stat. 2014, 42, 478–482. [Google Scholar] [CrossRef] [Green Version]
  34. Morrison, D.E.; Henkel, R.E. The Significance Test Controversy: A Reader; Transaction Publishers: Piscataway, NJ, USA, 1970; Volume 23. [Google Scholar]
  35. Xu, X.; Zeng, Z. Did Alibaba Fake the Tmall “Double Eleven” Data? Evidence from Benford’s Law. In Proceedings of the International Conference on Management Science and Engineering Management, Chisinau, Moldova, 30 July–2 August 2020; pp. 511–524. [Google Scholar]
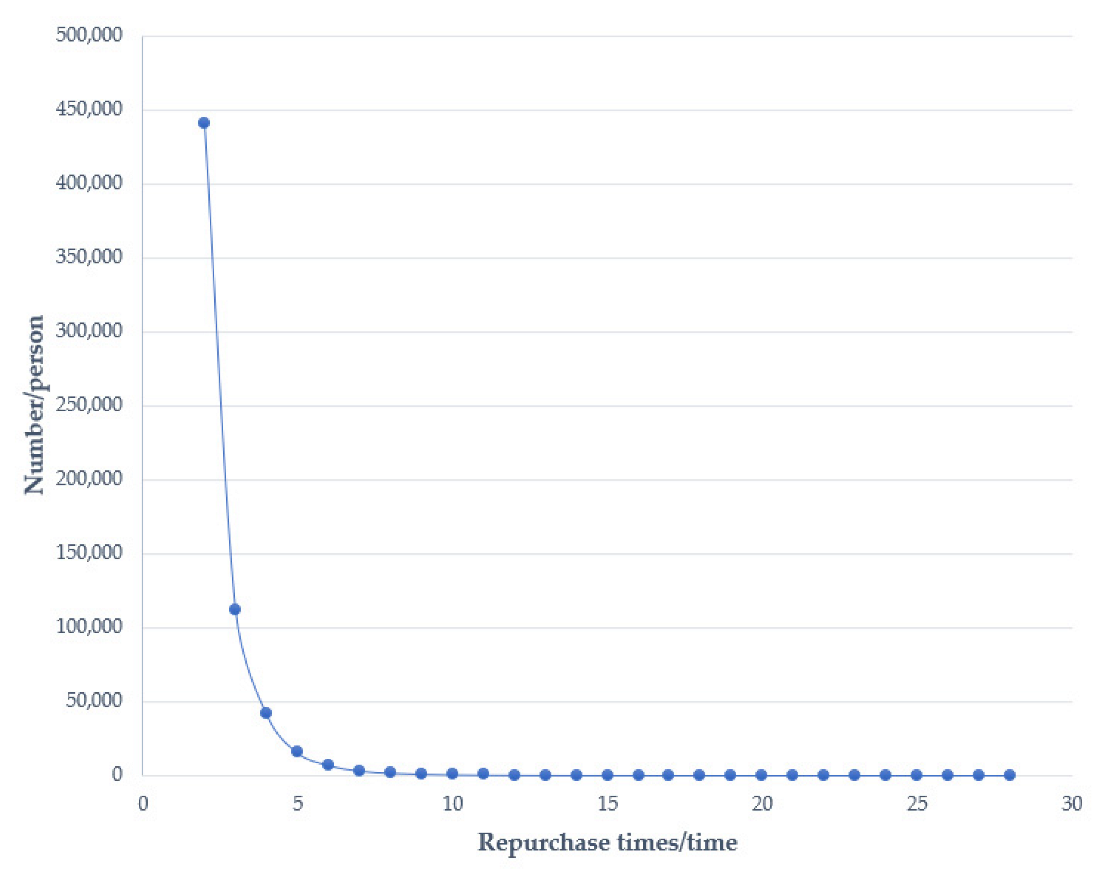
Figure 1. Distribution of customer repurchase times and the corresponding number of people.
Sustainability 14 08714 g001
Figure 2. Fitting image of the number of purchases and the cumulative number of customers.
Sustainability 14 08714 g002
Figure 3. Statistical test of power-law distribution.
Sustainability 14 08714 g003
Figure 4. The impact of free shipping or non-free shipping products on the repurchase rate.
Sustainability 14 08714 g004
Figure 5. The impact of different ordering methods on the repurchase rate.
Sustainability 14 08714 g005
Figure 6. Repurchase rate and sales volume in each province.
Sustainability 14 08714 g006
Figure 7. The regression equation of GDP and repurchase rate.
Sustainability 14 08714 g007
Figure 8. Statistical test of GDP and repurchase rate.
Sustainability 14 08714 g008
Figure 9. Average number of sales per hour.
Sustainability 14 08714 g009
Figure 10. Customer repurchase days/number of orders ratio.
Sustainability 14 08714 g010
Table 1. Order data index set.
Orders AttributeAttribute Description
Main order numberMain keys for associating commodity tables and evaluation information
Customer member nameUsed for the linked order table
Unique identification idConsumer’s unique identification
Customer payable postageThe amount of postage paid by the consumer
Sub-order numberPrimary key used to associate with the order table
Total amount of sub-ordersOrder payment amount before discount
Actual payment amount of sub-orderOrder payment amount before discount
Sub-order order statusSuccessful transaction/closed transaction
Customer MessageCustomer’s message when placing an order
Consignee nameConsumer’s recipient name
recipient addressCustomer’s address
contact numberConsumer contact information
Order creation timeThe time when the consumer’s purchase behavior occurred
Order payment timeConsumer payment completion time
Baby titleproduct name
Logistics companyZhongtong/Postal/Shunfeng etc.
Total number of babiesTotal number of products purchased by consumers
Whether mobile phone orderYes/No is a mobile phone order
Confirm receipt timeTime when the consumer receives the item
Publisher’s Note: MDPI stays neutral with regard to jurisdictional claims in published maps and institutional affiliations.