Article

Knowledge Level and Consumption Behavior of Native Plants, Meats, and Drinking Waters with High Fluoride Concentrations about the Relation to the Potential Health Risk of Fluoride in Lamphun Province Thailand: A Case Study

1
Informatics Innovation Center of Excellence, Walailak University, Nakhon Si Thammarat 80160, Thailand
2
Emergency Room Department, Dok Kham Tai Hospital, Phayao 56120, Thailand
3
Faculty of Science and Technology, International University, Phnom Penh 12101, Cambodia
4
Department of Chemistry, School of Science, University of Phayao, Phayao 56000, Thailand
5
School of Public Health, Walailak University, Nakhon Si Thammarat 8016, Thailand
*
Author to whom correspondence should be addressed.
Sustainability 2022, 14(14), 8701; https://doi.org/10.3390/su14148701
Submission received: 4 June 2022 / Revised: 4 July 2022 / Accepted: 11 July 2022 / Published: 15 July 2022

Abstract

:
Fluoride exposure from natural, agricultural, and industrial sources has harmed people living in fluoride-affected areas. Fluoride accumulates in the human body after being exposed to it through the food chain. The population consisted of 371 community health volunteers who were surveyed and chosen based on personal fluoride information. Only 39 residents were chosen to be interviewed and take part in the trial, which involved drinking fluoride-containing groundwater (>1.5 part per million: ppm) and urine testing that revealed urine fluoride level (>0.7 ppm). In addition, 47 biological samples and eight commercially bottled water specimens were examined. The information was gathered in four ways: (1) a questionnaire-based survey of fluoride knowledge, (2) food consumption behavior with locally grown vegetables, fruits, poultry, and meat, and commercially bottled water produced by groundwater in fluoride-affected areas, (3) a semi-food frequency questionnaire, and (4) fluoride content measurements using an ion-selective electrode. According to the analyses, the participants ranged in age from 51 to 60 years, with approximately 60.38% of them female and born and raised in polluted areas. The majority of subjects had a low level of fluoride knowledge (65.23%). The respondents’ primary source of drinking water (100.00%) was commercially bottled water; they chewed camellia sinensis 11.56% of the time (1 to 5 years) and they drank tea 9.16% of the time (during 1 to 5 years). Sus scrofa domesticus was responsible for the intake of vegetables and fruits, whereas Brassica chinensis, Jusl var para-chinensis (Bailey), and Tsen and Lee were responsible for the intake of poultry and animal flesh. They were all purchased at a local farm. The hazard quotient was greater than one, and the fluoride concentration (ppm) ranged between 75.00% (0.29–5.20), 57.14% (0.01–0.46), 88.89% (0.07–0.91), 100.00% (0.43–3.07), 100.00% (0.58–0.77), 42.86% (0.12–0.62 ppm.), 60.00% (0.11–1.44), and 33.33% (0.10–0.80) in drinking water, fruit, young and mature plants. Fluoride ingestion may pose a health concern. Under the 95th percentile condition, 74.47% consumed water with a high fluoride level, vegetables and fruits, and poultry and meats.

1. Introduction

Fluorine, the thirteenth most prevalent element, is often found in the earth’s crust at a concentration of roughly 0.3 g/kg [1,2,3,4]. Fluorine is obtained geologically from fluorine-bearing minerals such as fluorite (CaF2) (48.9% fluorine content), cryolite (Na3AlF6), topaz [Al2SiO4(F,OH2)], apatite [Ca5(PO4)3(Cl,F,OH)], micas [AB2–3(X, Si)4O10(O,F,OH)2] and sellaite (MgF2), fluorapatite (Ca5FO12P3), and biotite K(Mg,Fe)3(AlSi3O10)(F,OH)2 [5,6,7,8]. Fluoride is present in the environment in a number of countries, including China, India, Iran, Mexico, Turkey, Sri Lanka, Pakistan, Kenya, Ethiopia, and Thailand [9,10,11,12].
Because of its location in the Chiang Mai Basin, which comprises the provinces of Chiang Mai, Lamphun, and Mae Hong Son, the Ma Khuea Chae subdistrict in Thailand, which is located between 18.573821° latitude and 99.134547° longitude, has a population that is exposed to fluoride [13,14,15,16]. For many years, this population has suffered from fluorosis caused by drinking fluoride-contaminated groundwater. Athikhomrungsarit (2002) revealed that fluoride was detected in drinking water drawn from groundwater in San Pa Tieng communities, with the maximum concentration being 17 ppm. Dean’s community fluorosis index revealed fluoride concentrations ranging from 0.2 to 18.9 mg/L, 0.1 to 2.3 mg/L, and 0.25 mg/L, respectively [17].
These communities are exposed to fluoride by natural and human-caused processes [15,18,19,20]. Several natural elements, including rock type, weathering, leaching, soil, tec-tonics, hydrogeology, geothermal, and topographical climate, contribute significantly to increased fluoride levels in drinking water [21,22,23]. Fluoride concentrations vary according to geography. Fawell’s prior research indicated that fluoride is found in soil at concentrations ranging from 10 to 1000 ppm, and in water at concentrations ranging from 0.5 to 2000 ppm [22].
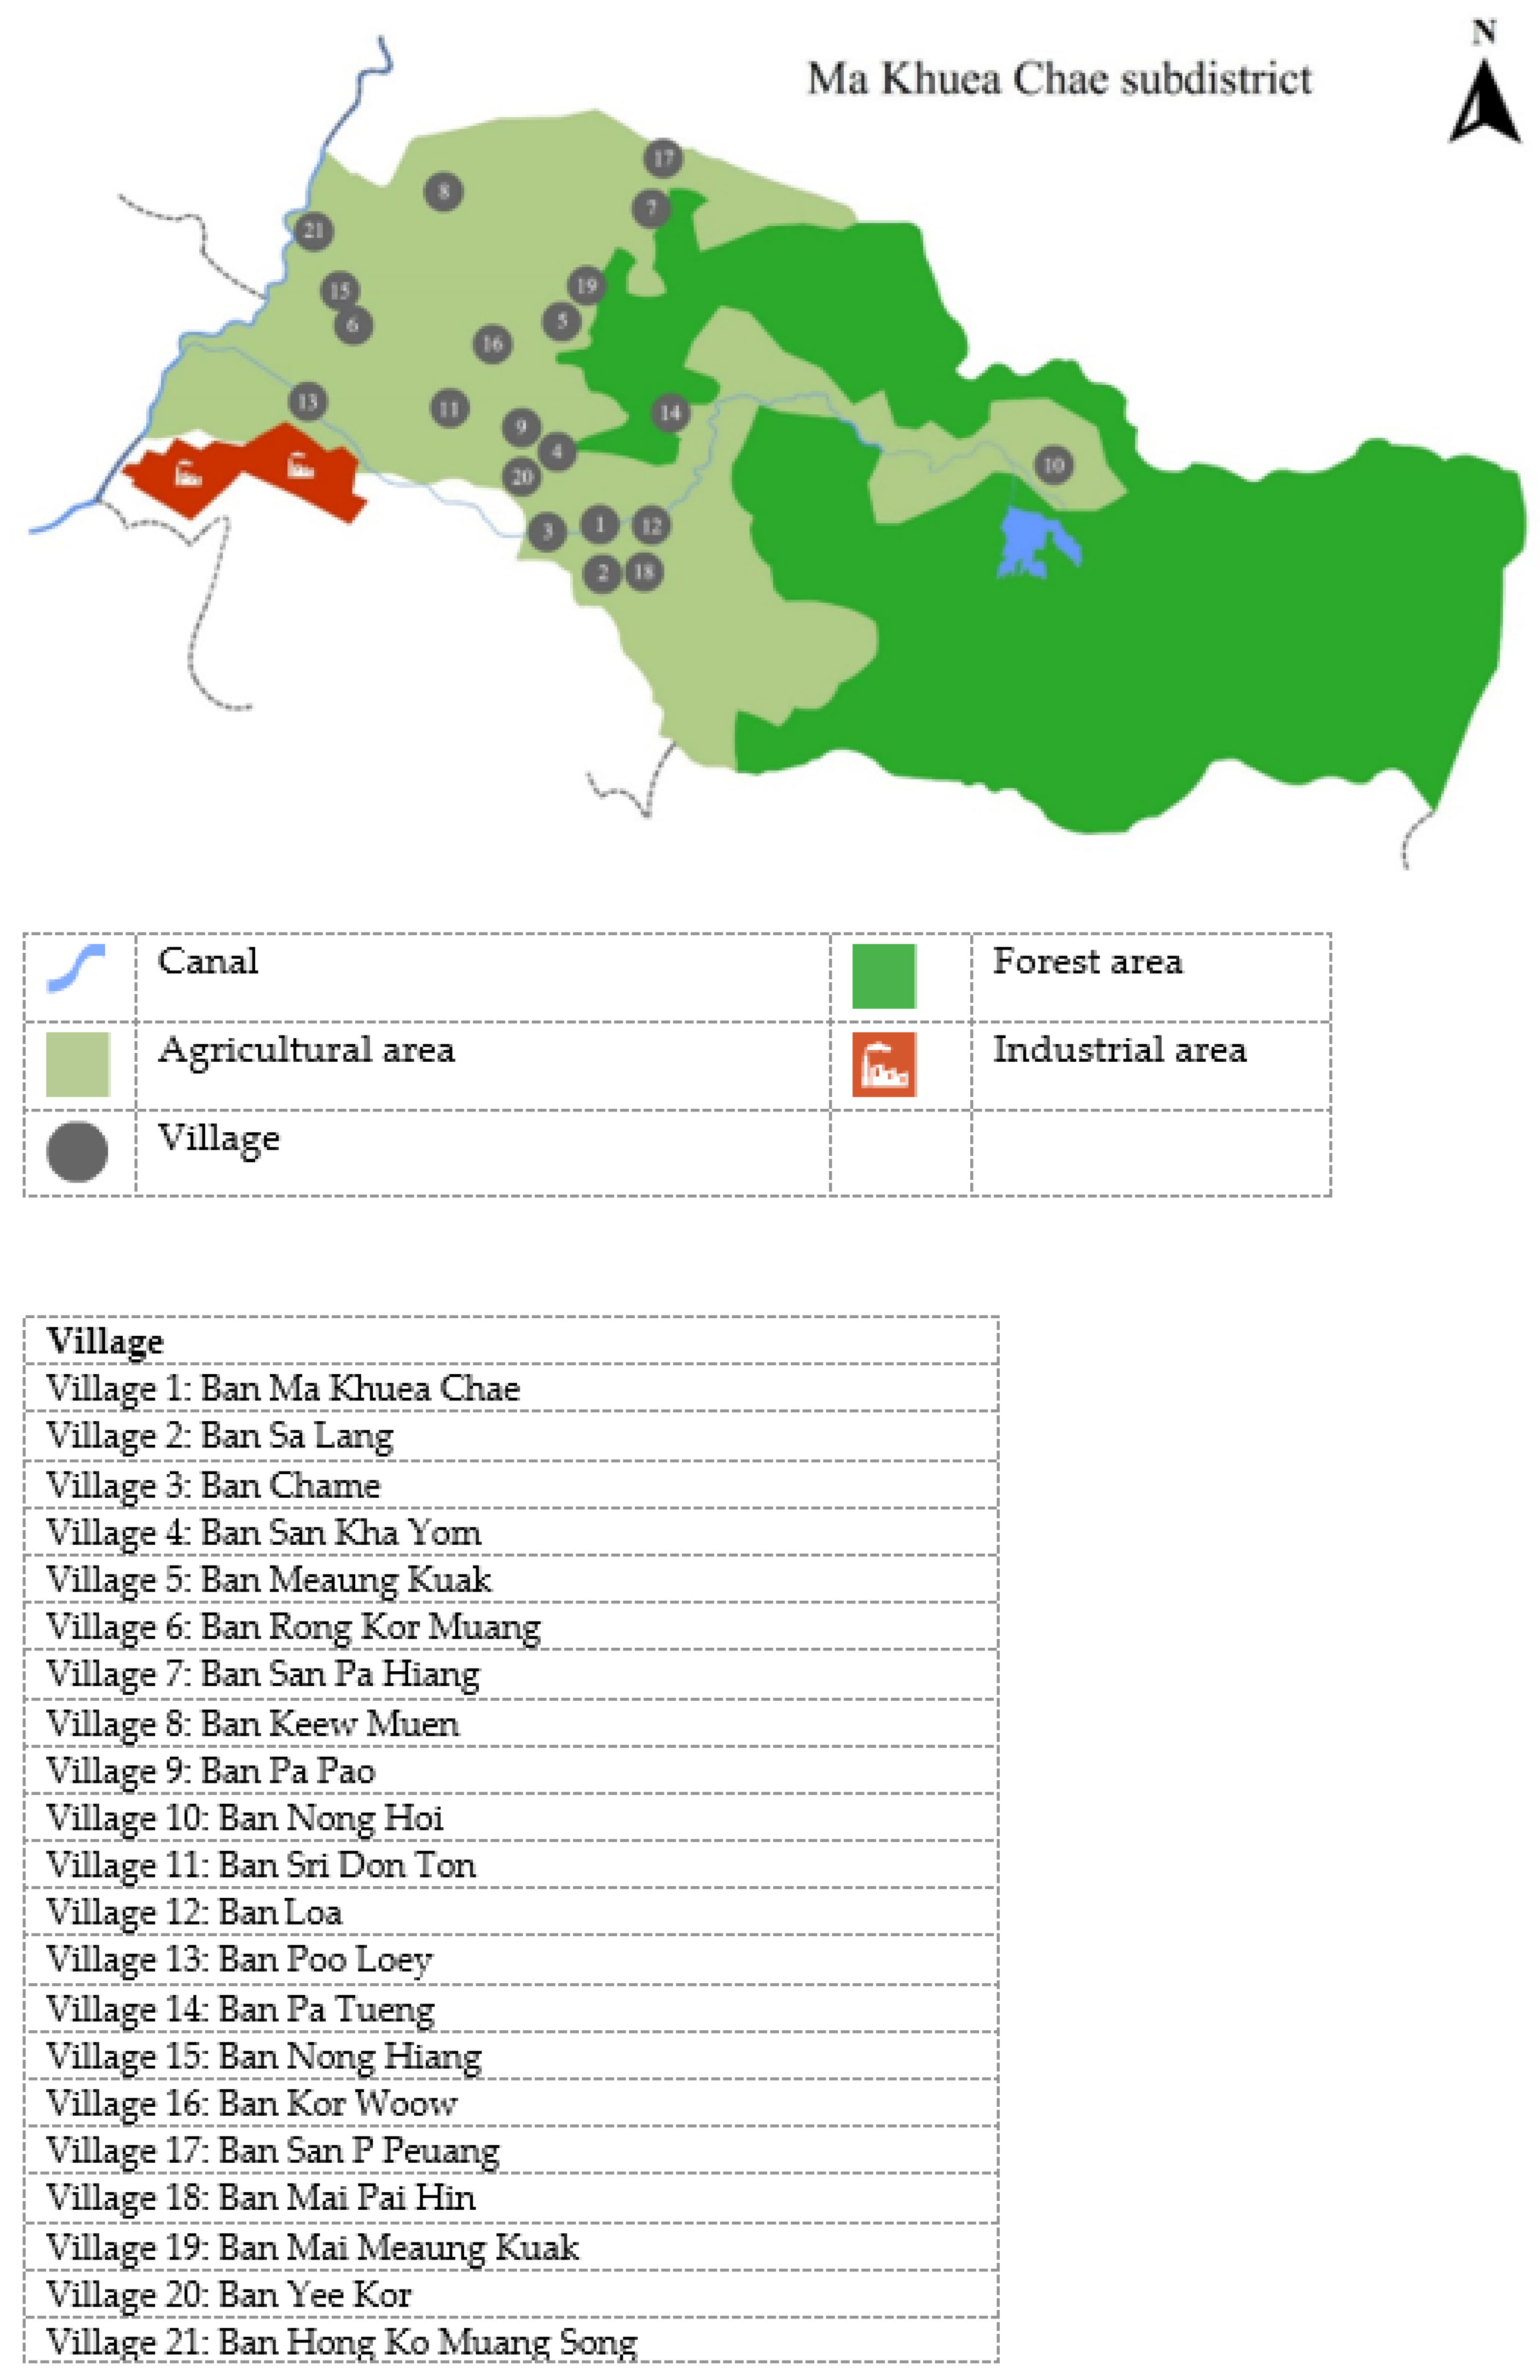
Fluoride pollution might arise as a result of human, agricultural, and industrial activity. Typically, a place is exposed to fluoride as a result of its vicinity to paddy fields or an industrial zone (as Figure 1 and Figure 2). The findings indicated that fluoride-affected regions contaminate the surrounding area. Inappropriate phosphorus fertilizer application contributes to fluoride pollution of paddy fields. Fluoride levels in the soil are reported to be 0.34 mg/L due to the usage of phosphate fertilizers in rice fields [24]. Gray (2018) found that total fluoride concentrations increased from 251 mg/kg to 349 and 430 mg/kg in topsoil (0–7.5 cm) that received 188 kg/ha and 376 kg/ha fertilizer, respectively [23]. Further, the long-term application was to establish a relationship between higher fluoride concentrations in soil and subsequent fluoride transfer to vegetables and livestock. Momdal and Gupta (2015) showed that irrigated water had been contaminated with fluoride accumulated in soil, crops, and vegetables [20].
Additionally, industrial sources emit fluoride. Aluminum smelting, glass processing, phosphate fertilizer production, commercial brick production, industrial pesticide pro-duction, fluorine-containing product (PTFE) mining and manufacturing, and coal-fired power plants all add fluoride to the environment [2,25]. Numerous parts of the world, particularly those adjacent to industrial zones, are commonly contaminated with fluoride (35). Fluoride enters the food chain after it is released into the environment, via soil to plants and animals, as well as from plants and animals to humans [26,27]. Populations living in contaminated areas have been affected and are at risk of developing fluorosis. Populations living in fluoride-affected areas have consumed fluoride-infected food, vegetables, and fruits, as well as contaminated drinking water [28]. The high-fluoride waters in the Chiang Mai basin originate from a nearby geothermal field. Furthermore, 35% of deep wells had fluoride at a concentration of at least 1.5 mg/L, compared to only 7% of shallow wells [16]. Numerous investigations indicate that the distribution of fluoride in food roots, such as Triticum aestivum, Oryza sativa, Cajanus cajan, and Capsicum annuum, that grow in fluoride-contaminated areas corresponds to the area’s fluoride distribution [26,27]. Our previous research also examined the urinary fluoride levels of village health volunteers (VHVs), who represent the public health ministry, with a particular emphasis on residents of 21 villages in the Ma Khuea Chae subdistricts (Figure 3). There, 51.3% of urine samples had fluoride concentrations greater than the threshold (0.2–3.2 ppm). These values were greater than the industry guideline (3.20 mg/L) [24]. Chaiwong et al. (2020) demonstrated biological monitoring in these locations through plant, animal, and commercial bottled water production. According to the study, the average fluoride concentration of fruit plants, young plants, whole plants, and poultry was 560.00, 510.00, 610.00, and 336.67 mg/kg dry weight, respectively [24]. The values are much greater than the EPA and WHO’s maximum contaminant levels for food (4.00 mg/kg) and a dose capable of causing sickness (0.30 mg/kg). As a result, this study focused on analyzing the health risk assessment (HRA) of participants ingesting locally grown vegetables and fruits, as well as poultry and meat, in locations and groundwater contaminated with fluoride. Fluoride is a “double-edged sword”: insufficient consumption results in mottling teeth, softening of bones and skeletons, neurological damage, dental and skeletal fluorosis, soft tissues, and reduced thyroid function [18,22,29].

2. Materials and Methods

A cross-sectional study was conducted on 371 village health volunteers (VHVS), who were nominated by the health ministry in 21 villages in the Lamphun province’s Ma Khuea Chae subdistrict Meaung district. To ascertain the fluoride content of the first urinary void in the morning, urine was collected.
The University of Phayao institutional review board approved the study protocol, and all participants provided written informed consent.

2.1. Survey

The survey of fluoride knowledge and consumption behaviors of local plants, poultry, and animal meat, as well as drinking water, was divided into three sections as follows:
Part 1: Demographic data were collected using a questionnaire after each woman signed an informed consent document, as well as sociodemographic and obstetric history (age, gestational age, weight, height, number of pregnancies, education, location, and family members with thyroid disease).
Part 2: Fluoride knowledge. The subjects were questioned about their knowledge of fluoride, including fluoride in nature, the necessity of fluoride for humans, the health consequences of fluoride deficiency and overload, and so on. The questionnaire contained 14 closed-ended questions, as well as items assessing negative and positive knowledge on a Likert scale. The correct response was 1, while the incorrect response was 0 as Table 1.
The evaluation criteria were classified into three categories as follows. Excellent knowledge included or exceeded 11 items. Between seven and 10 items were considered to be of moderate understanding. Inadequate knowledge was or was less than six items.
Part 3: Patterns of water, vegetable, and fruit consumption, as well as poultry and animal meat consumption. The questionnaire inquired about favored vegetables, fruits, poultry, and animal meat, as well as the improvement and ingestion of drinking water. Closed questions are typically multiple-choice with a single-word response, such as ‘yes’ or ‘no,’ and some can be responded to with another question.

2.2. Biological Sample Investigation

The assessment of the health risk of local plants, poultry and animal meat, and drinking water has consisted of three steps as follows.

2.2.1. Data Collection and Examination of Urinary Fluoride

Fluoride was evaluated in urine samples using an ion-selective electrode (Fluoride in urine method 8308). After buffering the specimen with an equal volume of TISAB II, standards were produced by serial dilution of a sodium fluoride stock solution at 100 ppm. (Orion Research Inc., Beverly, MA, USA). The correlation coefficient for the standard curve was 0.98. The mean reproducibility of the readings was 96% when duplicate samples were used. Fluoride standards (0.009, 0.019, 0.095, and 0.190 g fluoride) were generated in triplicate by stepwise dilution of a 0.1 M fluoride stock solution (Orion Research Inc., 940906, Beverly, MA, USA) and diffused similarly to the samples.

2.2.2. Consumptive Behavior Survey, Biological Investigation, and Semi-Frequent Food QuesTionnaire (SFFQ) Analysis

In addition to biological investigation, a survey of consumer behavior and a semi-frequent food questionnaire (SFFQ) were conducted. Only 39 inhabitants were chosen based on criteria that included urine and groundwater with fluoride concentrations great-er than 0.7 and 1.5 ppm., respectively. The inhabitants were then interviewed about their personal characteristics, such as age, gender, and location, as well as their preferred consumption of fruits, vegetables, poultry, and meats grown in these areas, as well as commercial bottled water produced using water grown in fluoride-contaminated areas. To explore fluoride accumulation, the top 1–5 ranking of each form of preferred consumption was surveyed and gathered. Following that, a semi-frequent food questionnaire (SFFQ) study was conducted. SFFQ was used to record 72-h consumption, which consisted of four components, including 1) sources of vegetables, fruits, and meats; 2) frequency food in-take: daily (3, 2, and 1 times/day), per week (12–11, 10–9, 8–7, 6–5, 4–3, and 2–1 time/week), and per month (3–2 and 1 times/month) was recorded; 3) portion size (8 pieces/60 g) for poultry and meat.
  • Extraction and analysis of vegetables and fruits, as well as poultry and animal meat
A total of 47 samples of eight commercially bottled waters were gathered in Ma Khuea Chae subdistrict Meaung district in Lamphun to be analyzed for fluoride concentration. Samples included three different kinds of whole plants, nine different kinds of young plants, five different kinds of mature plants, seven different kinds of food crops, five different kinds of cooked plants, and three different kinds of poultry and meats. All biological samples were also cultivated in well-regulated settings. Freshly gathered fruits, vegetables, meat, and poultry were diced into small pieces, dried at room temperature, then ground into powder using a mortar and pestle. To the samples, 2.5–5.00 mL of 8 M NaOH were added (Merck, Germany: analytical reagent grade). The incinerate temperature of the muffle furnace was first set at 200 °C for 1 h, and then increased to 525 °C for 3 h. Then, distilled water was added. The pH of the sample solutions was set to 7.20–7.50 using strong hydrochloric acid (HCl) (Merck, Germany: grade of analytical reagent). The solutions were kept in an airtight Polyethylene (PE) tube with a volume of 50.00 mL until analysis [30]. To examine sample solutions, a fluoride ion-selective electrode was employed (4-star bench-top Orion USA).
  • The fluoride content of commercially bottled water was determined
The fluoride concentration in commercial bottled water was determined using an ion-selective electrode (ISE) analyzer coupled to a fluoride-specific electrode (fluoride in urine method 8308; 4-star benchtop Orion USA). Calibration of the equipment was per-formed in triplicate to minimize er-ror, taking into account expected values for samples with standards ranging from 0.1 to 2.0 mgF/L. We used dilutions of a standard fluoride solution of 100.0 mg/L (Orion Research Inc., 940906, Beverly, MA, USA) for this purpose. A volume of 1.0 mL was collected from each of these standards after the addition of 1.0 mL of TISAB (Orion Research Inc., 940906, Beverly, MA, USA); a pH adjustment buffer with ionic and non-complex strength that is widely used in the analysis of fluoride.
  • Quality assurance was a concern
For every 20 samples, blank and concentration solutions were analyzed for accuracy by known concentration and were investigated (100% − Error Rate (Observed Value − Actual Value/Actual Value × 100)). The accuracy range was not >15%, and the precision y of the sample was repeatedly investigated, which is expressed as the relative standard deviation (% RSD). The obtained accuracy ranged between 95% and 115%.
  • Reagent
    • Distilled or deionized water.
    • Sodium citrate (Na3C6H3O7.2H2O).
    • Acetic acid (CH3COOH).
    • Sodium hydroxide (NaOH).
    • Sodium fluoride (NaF).
    • Calibration stock solution (100 µg F/mL.)
    • Total ionic strength activity buffer (TISAB), pH 5
  • Equipment:
    • Polyethylene tube (e.g., 5, 10, 125 mL).
    • Fluoride ion-specific electrode (ISE) with a reference electrode.
    • pH/millivolt meter (reading to +0.5 mV.)
    • Stirrer, magnetic.
    • Stirring bars, PTFE-coated.
    • Beakers plastic, 50-mL.
    • pH electrode.
    • Pipets, appropriate sizes for standards.
    • Volumetric flasks for standards.
    • Waterbath.

2.3. Health Risk Assessment (HRA)

Health risk assessment is the process of determining the likelihood of adverse health effects occurring and their likely magnitude over time of exposure to a hazard [31]. The magnitude, frequency, and duration of human exposure to fluoride in the environment are typically expressed in terms of chronic daily consumption (CDI) [32,33] as shown in Equation (1):
CDI = (C × CF × IR × EF × ED)/(BW × AT)
  • CDI is the exposure duration (mg/kg per day).
  • C = concentration (mg/L)
  • CF = conversion factors
  • IR = intake rate (l/day)
  • EF = exposure frequency (day/year)
  • ED = exposure duration (year)
  • BW = body weight (kg)
  • AT = average time (day)
The third phase is risk characterization, which is based on the calculation of CDI estimations and defined toxicity values for fluoride intake (the non-carcinogen risk) as the hazard quotient (HQ) [31,33].
HQ = CDI mg/kg-day/RfD mg/kg-day
HQ > 1 is an unacceptable risk of adverse non-carcinogenic effects on health, but HQ < 1 is an acceptable level [34,35,36].
The calculation of HQ in this study requires CDI data, which are laboratory data, and a cohort survey of consumption behaviors contains data for C, CF, IR, EF, ED, BW, and AT at the 95th percentile, as shown in Table 2.

2.4. Health Risk Assessment (HRA)

The data were analyzed in two ways, using SPSS 12.0 for computations.
  • Descriptive statistics were employed, such as frequency, percentage, and mean. The tested’s reference intervals were discovered to be in the 2.5th–97.5th empirical percen-tiles.
  • Analytical statistics were utilized to analyze independent t-tests at level 0.05.

3. Results

The data are presented in the form of personal dates of village health volunteers in Table 3. The information was sorted into groups. The volunteers’ ages varied from 51 to 60 years old, with 48.25% between those ages. The majority were female, accounting for 60.38%, with married status accounting for 79.51%. About 44.20% of people weigh between 51 and 60 kg, while 47.71% of people are between 151 and 160 cm tall. Primary school education was around 67.65%, employment was around 59.03%, and income was around 34.77% in the range of 151–300 EUR. Housing ownership was around 87.33%, while living in the same house since birth was around 78.44%, and residing in the same house for more than five years was around 68.75%. Furthermore, commercially bottled water was the primary source of drinking water for 65.14% of the time and drinking water quality was enhanced by 87.06% by filtering 60.37% of the time. About 65.14% of the cooked water came from commercially bottled water, and 61.32% of the cooked water was enhanced by filtration. The never-tested group had a 100% history of fluoride investigation in urine, while the never-tested group had a 100% history of fluoride in water. Apparent Camellia sinensis chewing was reported at 88.44% in the group of no chewing and 40.90% in the group of chewing during one to five years. Tea drinking behavior was identified in 90.84% of those who did not drink, and in 64.72% of those who drank during one to five years. In fluoride-contaminated areas, the consumption of vegetables, fruits, poultry, and animal meats was studied. Brassica chinensis Jusl var. parachinensis (Bailey) and Tsen and Lee ranked first among the vegetables consumed by VHHs, with 29.43% purchased from the village farm and 44.20% purchased from the market. Furthermore, the top ranking of poultry and animal foods was Sus scrofa domesticus, which accounted for 38.02% of the total purchased from the village’s farm, which accounted for 73.09%.
In Table 4, it is reported that fluoride increased the incidence of village health volunteers (VHVs). The findings were divided into three categories once the level was evaluated. The results show a 0.00% score from 11 to 14, which was interpreted very broadly. Furthermore, 34.77% of the 7–10 score range and 65.23% of the 1–6 score range were interpreted at a medium and low level, respectively.
The fluoride concentration and hazard quotient (HQ) of commercial ground water bottles consumed in different areas (N = 8) are shown in Table 5. The highest fluoride concentration was detected in Village 20: Ban Yee Kor in the type of water supply brand F at a concentration of 15.20 mg/L with HQ 1.10, while the lowest fluoride concentration was detected in Village 1: Ban Ma Khuea Chae in the type of bottle water brand A at a concentration of 0.29 mg/L with HQ 0.84. The average fluoride concentration and HQ were found to be 3.51 mg/L.
The fluoride level and hazard quotient (HQ) of the various varieties of fruits grown in the Ma Khuea Chae subdistrict (N = 7) were also determined and are reported in Table 6. The maximum concentration of fluoride was identified in the fruit of Mangidera indica at 0.46 mg/g with HQ 1.78, while the lowest concentration was found in Musa acuminata Colla at 0.01 mg/g with HQ 0.03. The concentrations of fluoride in Psidium guajava and Carica papaya L. were found to be similar at 0.38 and 0.35 mg/g, respectively. Additionally, an average fluoride content of 0.26 mg/g was determined.
The fluoride concentration and hazard quotient (HQ) of several types of young plants in Ma Khuea Chae subdistrict (N = 9) were determined, and the results are presented in Table 7. Fluoride concentrations ranged between 0.07 and 0.91 mg/g. Momordica charantia L. had the highest fluoride concentration of 0.91 mg/g with HQ 3.53, and Cucurbita moschata Decne had the lowest fluoride concentration of 0.07 mg/g with HQ 0.25. Fluoride concentrations in young plants were found to be on average 0.44 mg/g.
The fluoride concentration and hazard quotient (HQ) of various mature plants grown in the Ma Khuea Chae subdistrict (N = 5) are shown in Table 8. Fluoride levels in these mature plants ranged between 0.43 and 3.07 mg/g. Brassica juncea (L.) Czern. and Coss. had the highest fluoride concentration at 3.07 mg/g with HQ 11.92, while Ocimum sanctum had the lowest at 0.43 mg/g with HQ 1.67. Fluoride concentrations in mature Ocimum sanctum, Brassica pekinensis, Brassica chinensis L. var. parachinesis Tsen and Lee, and Piper sarmentosum plants were 0.43, 0.46, 0.44, and 0.49 mg/g, respectively. Fluoride concentrations averaged 0.98 mg/g.
The fluoride concentration and hazard quotient (HQ) of various types of whole plants were determined in the Ma Khuea Chae subdistrict (N = 3), and the results are summarized in Table 9. Fluoride concentrations in Ipomoea aquatica, Gymnema inodorum, and Neptunia oleracea were 0.76, 0.58, and 0.77 mg/g, respectively. The results indicate that Neptunia oleracea contains the most fluoride at HQ 2.99 and Gymnema inodorum contains the least fluoride at HQ 2.25. The average fluoride concentration in whole plants was 0.70 mg/g.
The fluoride concentrations and hazard quotient (HQ) of several food crops grown in the Ma Khuea Chae subdistrict (N = 7) are shown in Table 10. Fluoride concentrations ranged between 0.12 and 0.62 mg/g. The highest concentration of fluoride was found in the Lablab purpureus plant at 0.62 mg/g with HQ 2.40, while the lowest concentration was found in the Solanum melongena plant at 0.12 mg/g. Fluoride concentrations in food crops were on average 0.29 mg/g.
The fluoride concentration and hazard quotient (HQ) of various types of cooked plants grown in the Ma Khuea Chae subdistrict (N = 5) were determined, and the results are shown in Table 11. Fluoride concentrations in these cooked plants ranged from 0.11 to 1.44 mg/g. The highest fluoride concentration, 1.44 mg/g, was found in Citrus hystrix with HQ 5.59, while the lowest fluoride concentration, 0.11 mg/g with HQ 0.42, was found in Capsicum annuum ‘Bird’s Eye’. Fluoride concentrations in cooked plants were on average 0.49 mg/g.
The fluoride concentration and hazard quotient (HQ) in various poultry and meat farmed in the Ma Khuea Chae subdistrict (N = 3) were determined, and the results are illustrated in Table 12. The fluoride concentration range found in between 0.10 and 0.81 mg/g. The highest fluoride concentration at 0.81 mg/g was found in Bos Taurus with HQ 3.14, and the fluoride concentration found in Gallus gallus and Oreochromis niloticus were at the same levels at 0.10 mg/g with HQ 0.38. Additionally, the result shows the average fluoride concentration at 0.34 mg/g.
The amount of fluoride detected in the urine of village health volunteers (VHVs) in the 21 villages of the Ma Khuea Chae subdistrict is shown in Figure 4. The over-60 age group (mean = 3.96 ± 2.82 mg/L), the 35–39 age group (mean = 3.89 ± 2.71 mg/L), and the 45–50 age group (mean = 3.81 ± 2.32 mg/L) have the highest urinary fluoride concentrations. Fluoride levels in the urine were 3.54 ± 2.16 mg/L on average. Except for the 35-year-old age group, all age groups have urinary fluoride levels greater than the standard recommendation (3.20 mg/L).
The fluoride assays performed on the urine of village health volunteers (VHVs) in the Ma Khuea Chae subdistrict’s 21 villages are shown in Figure 5. Ban Kor Woow (N = 7) village (mean = 6.57 ± 2.13 mg/L), Ban Nong Hiang (N = 22) village (mean = 5.79 ± 2.20 mg/L), and Ban Yee Kor village (mean = 5.64 ± 3.24 mg/L). Urinary fluoride concentrations were 3.55 ± 2.16 mg/L on average (N = 401). The amount of fluoride detected in the urine of village health volunteers (VHVs) in the 21 villages of the Ma Khuea Chae subdistrict is shown in Figure 4. Males had a mean fluoride level of 3.66 mg/L (SD. = 2.71, min–max = 1.13–13.60 mg/L) and females had a mean fluoride level of 3.47 mg/L (SD = 2.18, min–max = 0.71–12.50 mg/L). Male and female concentrations were not significantly different (p > 0.05). Notably, nine villages had males with a higher average than females. According to Figure 3 and Figure 4, 11 villages (52.38%) had a fluoride level in urine greater than the standard recommendation (3.20 mg/L).

4. Discussion

The conclusion indicated that most village health volunteers had a limited understanding of fluoride and were unable to assess the health hazards associated with food consumption by sampling vegetables, fruits, poultry, and animal meats consumed by village residents. Commercially bottled water received 87.59% of the total consumption of popular and commercially bottled water sourced from groundwater, followed by several fruits at 51.14%, young plants at 88.89%, mature plants at 100.00%, whole plants at 100.00%, food crops at 42.86%, cooked plants at 60%, and meat from poultry and animals at 33.33%. The Ma khuea Chae subdistrict has been found to contain fluoride. Fluoride levels were determined in shallow unconfined groundwater used for drinking across the plain. The results indicated that concentrations in the plain’s center ranged from less than 0.5 to 10 ppm. Numerous minerals, including apatite, fluorite, biotite, and hornblende, contain fluoride. Fluoride concentrations in groundwater are increased due to weathering and infiltration of rainfall through these rocks. The central section of the basin is composed of Holocene alluvial deposits, whereas the flood plain is composed of well-sorted sand and gravel covered by a few meters of clay. The formation is composed of thick beds of fine sediments, including kaolinite, interspersed with lenses of sand and gravel [16,37]. These thin layers of fine material act as aquitards, preventing water from flowing between aquifers and mixing. The majority of groundwaters east and north of Lamphun are Na-HCO3, Ca-Na-HCO3, or Ca-HCO3 in composition [38]. It has been established that waters containing sodium hydroxide conform [37]. The region’s redominance of sodium is due to cation exchange. Additionally, geothermal water is the primary source of high fluoride concentrations in the water, as demonstrated by a test of 70 hot springs known to contain high fluoride levels [16,39]. Kim et al. (2005) identified two environmental processes in Korea that contribute to the occurrence of high fluoride levels: weathering of fluoride-bearing rocks in faults and upward flow of deep fluoride-enriched groundwater along fault zones [40]. This process appears to occur at the Lamphun site, which has an intrusion of fluoride-bearing biotite and granite in Palaeozoic rock. Fluoride concentrations in water are high because the calcium (Ca2+) ion is removed from groundwater and replaced by the sodium ion (Na+) found in clay minerals. This material has a high capacity for cation exchange, preventing the precipitation of highly insoluble calcium fluoride (CaF2), resulting in fluoride accumulation in groundwater [16,37]. The HQ values in Table 2 represent the effects of oral ingestion (of fluoride-related adverse effects at HQ > 1). One brand in village 6, Ban Rong Kor Muang, had more than ten headquarters. The greater the value, the more intolerable the risk of non-carcinogenic adverse health effects. The Ma khuea Chae subdistrict is located in Lamphun [31,41,42]. It is a zone with elevated fluoride levels near the prominent Mae Tha fault and is most likely associated with groundwater resources. The fluoride concentration of the urine and consumption patterns of each participant was used to generate the calculated HQ values. The amount of food ingested during a specified period of time (l/day), the frequency of exposure (days/year), the duration of exposure, your body weight (BW), and the average time (AT) that it will be in the area––these considerations play a significant role in determining whether or not the area’s residents will inevitably acquire fluoride via the food chain. In India, Pakistan, West Africa, Thailand, China, Sri Lanka, and Southern Africa, elevated groundwater fluoride concentrations have been associated with igneous and metamorphic rocks such as granites and gneisses. Fluoride levels in drinking water exceeded 10 mg/L in the Ma Khuea Chae subdistrict, in Thailand’s north region. Around 1% of the area’s natural water sources are estimated to contain fluoride concentrations greater than 2 mg/L. [43]. Fluoride levels may be elevated in northern Thailand due to geothermal water sources [44]. Fluoride concentrations in groundwater sources reached a maximum of 0.92 mg/L. [45]. For the majority of people, the primary sources of fluoride in their diet are drinking water, food, and beverages [46]. The presence of fluoride in drinking water is widely regarded as one of the most significant health risks [30,47].
Ma Khuea Chae is located on the Chiang Mai–Lampang highway, near the northern region industrial estate. The modern production and use of chemicals such as hydrogen fluoride (HF), calcium fluoride (CaF2), sodium fluoride (NaF), fluorosilicic corrosive (H2SiF6), sodium hexafluorosilicate (Na2SiF6), sulphur hexafluoride (SF6), and phosphate manures are all anthropogenic sources of fluoride in the earth. Composts made of phosphoric acid are a significant source of fluoride contamination in agricultural soils [48,49]. The proximity of the smelter increased the mean fluoride concentration in vegetables grown in the area, which ranged from 0.36–0.69 to 0.71–0.90 ppm. The location closest to the smelter had the highest mean concentration (0.00 km). These values exceed the 1.00 mg/kg3 cutoff. Mezghani et al. (2005) confirmed that vegetation in close proximity to the factory accumulates significant amounts of fluoride with variable specific symptoms of toxicity, and that, as expected, fluoride concentrations decreased as the distance from the pollution source increased [42]. According to Brougham et al. (2013), fluoride concentrations in vegetation and soils near an aluminum smelter decrease after 36 weeks of the smelter’s shutdown. The current study indicates that fluoride pollution of soil is inversely proportional to its distance from the source of pollution [50]. In terms of soil layers, it was observed that the mean fluoride concentration was significantly higher in areas closer to the smelter in the upper and deeper soil layers. Additionally, at all distances, the upper soil layer had a significantly higher mean fluoride concentration than the deeper soil layers. Okibe et al. (2010) and Yadhav et al. (2012) demonstrate that irrigating water affects the fluoride content of vegetables and soil. They discovered that applying fertilizer can also have an effect on the fluoride concentration in the soil and, consequently, on the vegetables. Water and fertilizer samples were collected from various distances and fluoride concentrations [8,51]. Fluoride concentrations in fertilizer and water samples collected at various distances were between 1.4–1.5 ppm and 1.8–1.9 ppm, respectively. Notably, fluoride concentrations were found to be higher in areas adjacent to the zinc smelter and lower in areas distant from the zinc smelter. Fluorosis is associated with fluoride-rich alkaline groundwaters (pH range 7.0 to 8.5 in India and Sri Lanka [25,47,52]). Fluoride is released into the environment through natural sources as well as the aluminum and coal industries, fertilizer use, and manufacturing processes [47]. Bartram and Balance (1996); Haidouti (1995) demonstrated that total soil fluoride collected at depths of 0–5, 5–15, and 15–30 cm near an alumina production plant decreased with distance from the emission source and reached background levels at approximately 20 km2. Additionally, the total soil fluoride content decreased with depth in high-impact areas and increased with depth in low-impact areas [53,54]. This high fluoride content in soil may leach into groundwater via the unsaturated zone during precipitation, increasing fluoride levels. Agricultural fertilizers and coal combustion are anthropogenic sources of fluoride, whereas phosphate fertilizers contribute to fluoride enrichment in irrigation lands [55].
Fluoride bioaccumulation in various plant parts varies according to the mechanisms by which it is transported from soil solution to roots and then translocated from root to shoot. Fluoride is more soluble in acid soils and primarily accumulates in the leaf [56,57]. According to a related study conducted by Edmunds and Smedley (2013), the fluoride content of the leafy part of vegetables grown in this area is significantly higher than the fluoride content of the fruits and tubers [58]. Seeds accumulate very little fluoride in comparison to other parts of the plant. To minimize the risk of human exposure to fluoride, it is critical to minimize the use of fluoride-contaminated irrigation water, which is especially detrimental for crops that accumulate fluoride. The majority of fluoride occurs naturally in the environment as a result of various sources, including rock (100–1300 mg/kg) and soil (20–50 mg/kg). Fluoride is more soluble in acid soils, and its uptake by plants is enhanced in these soils. It is primarily found in the leaf. Fluoride accumulation in excess in vegetables results in visible leaf injury and fruit damage [8,56]. Fluoride enters plants via soil and water and then through passive diffusion to the plant roots. Fluoride is then transported into the shoot via the xylem via the apoplastic and symplastic pathways in a unidirectional distal movement. Fluoride’s bioavailability to plants is primarily determined by the pH of the solution and the presence of other metal ions such as calcium, aluminum, and phosphorous, as well as the soil type. Additionally, abiotic factors such as light, humidity, other pollutants, mineral nutrition, and temperature influence the uptake or movement of fluoride in plants and may influence the plant’s response to fluoride.
The residents of the Ma Kheau Chae subdistrict have been exposed via three routes: (1) ingested via drinking water (>1.5 mg F-/L) and fruits, vegetables, edible poultry, and animals produced in exposed areas, (2) inhalation routes, and (3) dermal routes. The food chain is the primary source of fluoride in the human body. Around 90% of fluoride consumed in water is absorbed in the gastrointestinal tract, compared to only 30–60% of fluoride consumed in food [22,47]. Fluoride is converted to hydrogen fluoride (HF) in an acidic stomach environment, and up to 40% of ingested fluoride is absorbed from the stomach as HF. By decreasing the quantity of HF absorbed by the stomach, a high stomach pH decreases gastric absorption. Fluoride that does not pass through the stomach is absorbed through the intestine, where it is unaffected by pH. Concentrations of cations (e.g., calcium, magnesium, and aluminum) that form insoluble complexes with fluoride can significantly reduce gastrointestinal fluoride absorption [59]. Fluoride is easily absorbed by the body, with roughly 99% remaining in calcium-rich regions such as bone and teeth (dentine and enamel), where it is incorporated into the crystal lattice. In infants, 80 to 90% of absorbed fluoride is maintained, but this percentage drops to 60% in adults, damaging the following generation via placental transfer. Fluoride crosses and is present in modest concentrations in mother’s milk, similar to those observed in the blood [60,61,62]. Dental fluorosis is a condition marked by hypomineralization of tooth enamel produced by excessive fluoride intake during enamel creation. It is caused by excessive fluoride intake during tooth formation. Because enamel and primary dentin fluorosis can occur only during tooth formation, fluoride exposure occurs throughout childhood (83). The prediction of dental fluorosis in schoolchildren revealed a favorable and statistically significant association between fluoride in well water and the level of dental fluorosis (r = 0.61; p <0.01). Mandinic et al. (2010) established an association between the health risk of children exposed to high fluoride levels in endemic areas and dental fluorosis using an odds ratio (OR). The danger increases as fluoride content in drinking water increases [63].
Fluoride concentrations were determined in the plasma of 50 pregnant women, 44 amniotic fluid samples, and 29 fetal cord blood samples from normal pregnancies. The results indicated that the fluoride concentrations in maternal and fetal plasma did not differ significantly. Opydo-Szymaczek (2007) evaluated placental fluoride transfer in 30 pregnant women in Poznan, Poland, at the time of delivery, where the fluoride concentration in the drinking water ranges between 0.4 and 0.8 mg/L. The mean fluoride concentration in maternal plasma was significantly greater than that in venous cord plasma (3.54 mol/L vs. 2.89 mol/L, respectively), and both values were comparable to those previously reported in pregnant women receiving prenatal fluoride supplements [64]. The findings confirm that fluoride easily crosses the placenta, and that prenatal fluoride supplementation is not recommended in this population [65]. In comparison, Gurumurthy et al., (2011a) collected drinking water, ground water, maternal blood, cord blood, and placenta and divided them into three sections––maternal, fetal, and peripheral. The average fluoride concentration in drinking water was 1.64–0.49, 10.94–2.09, 1.62–0.78, 2.50–41.54, and 1.41–0.78 ppm, respectively. The difference in fluoride levels between maternal and cord blood was significant. The association between maternal fluoride accumulation and adverse fetal outcomes is discussed [65]. Gurumurthy et al. (2011b) demonstrated that 1 ppm of fluoride in maternal serum could result in fetal health risks such as low birth weight, preterm delivery, and a low APGAR score [66]. Trivedi et al. (2007) established that fluoride can cross the placenta and reach the fetus, and that continued exposure to fluoride during childhood may have negative effects on the developing brain [67]. Seraj et al. (2012) demonstrated that children who live in areas with higher than normal water fluoride levels have impaired intelligence development. Children’s intelligence may be impacted by high water fluoride levels, as mean IQ scores decreased from 97.77–18.91 in the low fluoride group to 89.03–12.99 in the medium fluoride group to 88.58–16.01 in the high fluoride group (p = 0.001) [68].
In my study, the age group > 60 years old had the highest fluoride urine content in the population compared to the age group of 35 years old. None were statistically significant when p > 0.05 cutoff was used. The higher fluoride levels associated with aging support this idea. Fluoridated water and food can convert the hydroxyl group in hydroxyapatite crystals (Ca5(PO4)3(OH), the primary component of dental enamel and bone minerals, to fluorapatite (Ca10(PO4)6(F2), which affects the strength of such fluoride-containing bone. Thus, fluoride is added to drinking water and medical products such as toothpaste to prevent tooth decay, as fluoride is incorporated into the formation of apatite crystals [69]. Fluoride accumulation in agricultural plants and its subsequent entry into the food chain pose a potential threat to human health. Dental fluorosis, mottling of teeth, skeletal fluorosis, and bone deformation are significant health problems associated with excessive fluoride in all age groups [56,70].
Regarding gender, males are, on average, larger than females, although the difference is not statistically significant (p > 0.05). Fluoride is more concentrated in the skeleton than in the teeth, where it combines with calcium. Fluoride accumulation in the male body has an effect on body size. Fluoride’s effect on the structure and shape of apatite. Calcium and magnesium are the primary minerals in the bone that mix and precipitate as fluorapatite. Additionally, males have a quicker rate of skeletal growth than females, which may be combined and stored in bone alongside fluoride. Carbonate and fluoride have opposite effects on crystallinity and solubility in bioapatite: carbonate decreases crystallinity and enhances solubility, whereas fluoride does the opposite [71,72]. Finally, more fluoride stores in the bone can be absorbed by the body and excreted in the urine. Levy (2009) investigated the connection and comparison of longitudinal fluoride intake in drinking water at 0.68 mg/day from birth to 11 years of age using dual-energy X-ray absorption (DXA) content bone mineral content (BMC) and bone mineral density (BMD) results indicated a negative correlation between female bone outcome and fluoride intake. Still, male bone outcomes were all good and did not differ by gender [73].
To mitigate health hazards in the areas covered by the Health Ministry and other relevant authorities, it is essential to develop guidelines for operation in the following categories:
  • Capacity training to enhance personal competencies of public health volunteers and residents of areas at risk of fluoride contamination in Thailand’s upper north, including raising awareness of fluorides through a comprehensive health belief program comprised of four processes: perceived susceptibility, perceived severity, perceived benefit, and perceived barrier, which encompasses more than fluoride contamination [74]. The government should have a strategy establishing an integrated body of knowledge on unique pollutant contamination, such as fluoride contamination, in eight provinces in Thailand’s upper north [24]; arsenic in the Nakhon Si Thammarat province [75], lead mining is located in the Kanchanaburi Province [76], and zinc mining material was sent to village health volunteers in the Tak Province to communicate information to those living in the affected areas [77]. Volunteers who represent the Ministry of Public Health by assisting with the care of people’s health in various settings are referred to as “Village Health Volunteers”. As a result, to assist the Ministry of Public Health in creating a body of fluoride knowledge among the general people, it is required and desirable for the general public to participate in the process, particularly village health volunteers, to take complete care of the neighborhood’s residents. The study by Xiang et al. (2020) revealed that individuals with higher perceived susceptibility, indicated stronger perceived susceptibility, greater severity of oral diseases, less performing of oral health behaviors, and a higher score of decayed missing filled teeth (DMFT) were directly related to increased dental anxiety levels. Other HBM variables, such as perceived susceptibility, self-efficacy beliefs, cues to action, and perceived barriers, may all have an effect on dental anxiety via oral health behaviors and caries status [78].
  • It is feasible to limit the risk of long-term exposure to fluoride in the environment by analyzing urine. According to the study’s findings, 100% of the VHV had never had their urine tested for fluoride levels. The presence of fluoride in urine is a biological indicator of fluoride exposure that has an influence on the kidneys’ ability to function properly. Researchers revealed that fluoride concentrations in the urine could be used to forecast a person’s risk of developing kidney illness, and residents will be screened for dental and skeletal fluorosis [79,80], and chronic kidney disease (CKDu) [81,82].
  • A health information system is a huge computer database management system that manages a large amount of information. It will include people living in fluoride-contaminated areas who will be given fluoride-related information, the development of an information center will aid in the collection, storage, and management of data. Medical and public health professionals can use this system to access patient information in planning applications. The assessment of patient care according to the clinical information system discovered that there are no sources or information systems that can provide knowledge to people who have been exposed to fluoride and other pollutants in the contaminated areas [83,84].
  • Humans are exposed to environmental fluoride through birth (78.44%) and through drinking groundwater from specific contaminated locations and commercially bottled water. This is because the Lamphun area is located inside the Chiang Mai-Basin basin, well-known for its mineral fluoride concentrations, and commercially bottled water consumption remains a concern in Thailand, although the legal demands that it be supplied at a total concentration of no more than 0.7 mg/L [85]. We discovered that commercially available bottled drinking water in Bangkok, Thailand, contained varying levels of fluoride, with some having extremely high levels. When prescribing fluoride supplements, health professionals must be aware of the varying fluoride content of bottled drinking water and educate parents of infants and small children. It should be considered to include the fluoride content on the label of bottled water, particularly those with a fluoride content greater than 0.3 mg F/l (4). As a result of the findings (Table 5), it was determined that the HQ value required to influence health must be more than 1 (HQ > 1). Fluoride concentrations in commercially bottled water were connected with 0.45 mg/L (taking into intake rate (l/day), exposure frequency (days/year), duration of exposure, body weight (BW), and average time (AT). The fluoride concentration in bottled water should be reduced from 0.70 to 0.34 mg/L (HQ = 0.99 mg/L), according to the Food and Drug Administration Ministry of Health Thailand, to decrease the hazard associated with the consumption of bottled water.
  • Health literacy is defined by the U.S. Department of Health and Human Services (HHS) as “the degree to which persons have the capacity to receive, process, and understand fundamental health information and services required to make informed health decisions” (HHS, 2010). People who reside in more affluent areas should be proficient in self-defense, including fluoride awareness. The ideal fluoride dosage has been found to improve dental health in small doses. Conversely, excessive chronic use may have unfavorable effects, such as the onset of dental fluorosis. Fluoride awareness, toothpaste, and a proper intake (0.05 mg/day/kg body weight) are all important factors in preventing dental caries [86,87]. Health literacy and educational attainment both correlated with support for community water fluoridation (CWF), demonstrating the value of both broad and specialized knowledge in voters’ decision-making. Although educational level and other demographic factors are more indicative of participation, health literacy helps to explain fluoride support in a CWF referendum more clearly. Additional sociodemographic factors helped to explain turnout, but these same traits also explain voting behavior more generally [88].
  • According to the study’s findings, 51.14% of fruits, 88.89% of young plants, 100.00% of mature plants, 100.00% of whole plants, 42.86% of food crops, 60.00% of cooked plants, and 33.33% of poultry and animal meat had HQ values greater than 1, implying that those who consume them suffer health risks. The primary source of contamination in soil, vegetables, and meat is the food chain (soil fluoride: plants: animal: humans). Fluoride contamination of the surrounding ecology is a product of various constraints, including spatial factors. This is because the Ma Khuea Chae subdistrict is located within the Lamphun Industrial Estate, which contains numerous industrial plants that produce fluoride and emit it into the atmosphere, including a portion of the agricultural region. Chemical fertilizers are also known to contain fluoride, which contributes to the increase in soil fluoride caused by agriculture and when chemical fertilizers are applied over an extended period. As a result, the soil becomes acidic, allowing fluoride to be dissolved into the surrounding environment as ions enter the roots of plants, where they accumulate in various areas of the plant. The precipitate-flotation of fluoride-containing effluent from a semiconductor factory was investigated. The procedure begins with the formation of calcium chloride to form a precipitate, followed by the removal of calcium fluoride (CaF2). Then fluoride is accumulated at the soil surface, predominantly contaminated in the 0–40 cm layer, which can be addressed by topsoiling [89,90].

5. Conclusions

The use of drinking water, indigenous plants, vegetables, poultry, and animal meat produced in the hamlet is a significant source of fluoride accumulation via the food chain. Additionally, participants’ low degree of fluoride knowledge may be insufficient to pre-vent fluoride’s harm. Prior fluoride consumption was determined using hazard coefficients (HQ) values at the highest level of exposure covered by the 95th percentile of representative subjects, particularly when IR = 177 g/day, EF = 181.85 days/year, ED = 57.45, and BW = 55.71 kgs. The health risk assessment (HRA) was reported by HQ (>1) in relation to consumed fluoride from locally grown vegetables, fruits, poultry, and meat, as well as in groundwater containing fluoride grown and consumed in enclosed areas. The findings indicated that the percentage of samples with HQ > 1 was 75.00% for groundwater, 57.14% for local fruits, 88.89% for young plants, 100.00% for mature plants, 100.00% for full plants, and 100.00% for local fruits.

Author Contributions

W.T.: Conceptualization, Methodology, Software. T.C.: Data curation, Writing—Original draft preparation. C.L.: Visualization, Investigation. K.P.: Supervision. S.C.: Validation, Writing—Reviewing and Editing. All authors have read and agreed to the published version of the manuscript.

Funding

This research was funded by Walailak University research grant (WU62217). This project was also partially funded by National Research Council of Thailand.

Institutional Review Board Statement

Not applicable.

Informed Consent Statement

Not applicable.

Data Availability Statement

Not applicable.

Acknowledgments

Authors are grateful to Director, Intercountry Centre for Oral Health, Chaing Mai province for helping and encouragement rendered by the lab-colleagues of Intercountry Centre for Oral Health, ICOH is thankfully acknowledged, and this research was financially supported by the new strategies research project (P2P) Walailak University, Thailand.

Conflicts of Interest

The authors declare no conflict of interest.

References

  1. Jadhav, M.S.; Laxmeshwar, L.S.; Akki, J.F.; Raikar, P.U.; Kumar, J.; Prakash, O.; Raikar, U.S. Fluoride Contamination Sensor Based on Optical Fiber Grating Technology. Opt. Fiber Technol. 2017, 38, 136–141. [Google Scholar] [CrossRef]
  2. Hong, B.; Joo, R.; Lee, K.; Lee, D.; Rhie, J.; Min, S. Fluoride in Soil and Plant. Korean J. Agric. Sci. 2016, 43, 522–536. [Google Scholar] [CrossRef] [Green Version]
  3. Ali, S.; Thakur, S.K.; Sarkar, A.; Shekhar, S. Worldwide Contamination of Water by Fluoride. Environ. Chem. Lett. 2016, 14, 291–315. [Google Scholar] [CrossRef]
  4. Malde, M.K.; Scheidegger, R.; Julshamn, K.; Bader, H.P. Substance Flow Analysis: A Case Study of Fluoride Exposure through Food and Beverages in Young Children Living in Ethiopia. Environ. Health Perspect. 2011, 119, 579–584. [Google Scholar] [CrossRef] [PubMed]
  5. Khatri, N.; Tyagi, S. Influences of Natural and Anthropogenic Factors on Surface and Groundwater Quality in Rural and Urban Areas. Front. Life Sci. 2015, 8, 23–39. [Google Scholar] [CrossRef]
  6. Ortiz- Pérez, D.; Rodrguez-Martínez, M.; Martínez, F.; Borja-Aburto, V.H.; Castelo, J.; Grimaldo, J.I.; De la Cruz, E.; Carrizales, L.; Díaz-Barriga, F. Fluoride-Induced Disruption of Reproductive Hormones in Men. Environ. Res. 2003, 93, 20–30. [Google Scholar] [CrossRef]
  7. Datta, A.S.; Chakrabortty, A.; De Dalal, S.S.; Lahiri, S.C. Fluoride Contamination of Underground Water in West Bengal, India. Fluoride 2014, 47, 241–248. [Google Scholar]
  8. Jadhav, S.V.; Bringas, E.; Yadav, G.D.; Rathod, V.K.; Ortiz, I.; Marathe, K.V. Arsenic and Fluoride Contaminated Groundwaters: A Review of Current Technologies for Contaminants Removal. J. Environ. Manag. 2015, 162, 306–325. [Google Scholar] [CrossRef]
  9. Wood, S.H.; Singharajwarapan, F.S. Geothermal Systems of Northern Thailand and Their Association with Faults Active during the Quaternary. Trans.-Geotherm. Resour. Counc. 2014, 38, 607–615. [Google Scholar]
  10. Dehbandi, R.; Moore, F.; Keshavarzi, B. Geochemical Sources, Hydrogeochemical Behavior, and Health Risk Assessment of Fluoride in an Endemic Fluorosis Area, Central Iran. Chemosphere 2018, 193, 763–776. [Google Scholar] [CrossRef]
  11. Khan, A.A.; Whelton, H.; O’Mullane, D. Determining the Optimal Concentration of Fluoride in Drinking Water in Pakistan. Community Dent. Oral Epidemiol. 2004, 32, 166–172. [Google Scholar] [CrossRef] [PubMed]
  12. Oruc, N. Occurrence and Problems of High Fluoride Waters in Turkey: An Overview. Environ. Geochem. Health 2008, 30, 315–323. [Google Scholar] [CrossRef]
  13. Sawangjang, B.; Hashimoto, T.; Wongrueng, A.; Wattanachira, S.; Takizawa, S. Assessment of Fluoride Intake from Groundwater and Intake Reduction from Delivering Bottled Water in Chiang Mai Province, Thailand. Heliyon 2019, 5, e02391. [Google Scholar] [CrossRef] [PubMed] [Green Version]
  14. Matsui, Y.; Takeda, T.; Takizawa, S.; Wongrueng, A.; Wattanachira, S. Application of Nanofiltration Processes to Fluoride Removal from Groundwaters in the Chiang Mai Basin. In Proceedings of the Sustainable Development of Water Resources, Water Supply and Environmental Sanitation: 32nd WEDC International Conference, Colombo, Sri Lanka, 13–17 November 2007; pp. 459–466. [Google Scholar] [CrossRef] [Green Version]
  15. Chang, C.H.; Yeh, Y.C.; Caffrey, J.L.; Shih, S.R.; Chuang, L.M.; Tu, Y.K. Metabolic Syndrome Is Associated with an Increased Incidence of Subclinical Hypothyroidism-A Cohort Study. Sci. Rep. 2017, 7, 1–8. [Google Scholar] [CrossRef] [PubMed] [Green Version]
  16. Chuah, C.J.; Lye, H.R.; Ziegler, A.D.; Wood, S.H.; Kongpun, C.; Rajchagool, S. Fluoride: A Naturally-Occurring Health Hazard in Drinking-Water Resources of Northern Thailand. Sci. Total Environ. 2016, 545–546, 266–279. [Google Scholar] [CrossRef]
  17. Athikhomrungsarit, S. Appropriate Use of Fluoride in Thailand. In Proceedings of the Faculty of Dentistry, Thammasat University’s 21st Anniversary Symposium, Bangkok, Thailand, 11–12 December 2017; pp. 139–154. [Google Scholar]
  18. Ozsvath, D.L. Fluoride and Environmental Health: A Review. Rev. Environ. Sci. Biotechnol. 2009, 8, 59–79. [Google Scholar] [CrossRef]
  19. Chowdhury, S.; Chakraborty, P. Universal Health Coverage-There Is More to It than Meets the Eye. J. Fam. Med. Prim. Care 2017, 6, 169–170. [Google Scholar] [CrossRef]
  20. Mondal, D.; Gupta, S. Influence of Fluoride Contaminated Irrigation Water on Biochemical Constituents of Different Crops and Vegetables with an Implication to Human Risk through Diet. J. Mater. Environ. Sci. 2015, 6, 3134–3142. [Google Scholar]
  21. Chowdhury, A.; Adak, M.K.; Mukherjee, A.; Dhak, P.; Khatun, J.; Dhak, D. A Critical Review on Geochemical and Geological Aspects of Fluoride Belts, Fluorosis and Natural Materials and Other Sources for Alternatives to Fluoride Exposure. J. Hydrol. 2019, 574, 333–359. [Google Scholar] [CrossRef]
  22. Fawell, J.; Bailey, K.; Chilton, J.; Dahi, E.; Fewtrell, L.; Magara, Y. Flouride in Drinking-Water; IWA Publishers: London, UK, 2006. [Google Scholar]
  23. Gray, C.W. Fluorine in Soils under Pasture Following Long-Term Application of Phosphate Fertiliser in New Zealand. Geoderma Reg. 2018, 14, e00183. [Google Scholar] [CrossRef]
  24. Chaiwong, S.; Chaiwong, T.; Umponstira, C. Contaminated Fluoride in Biological Samples from Mountainous Areas in Thailand. Environ. Eng. Manag. J. 2020, 19, 1245–1253. [Google Scholar]
  25. Keesari, T.; Sinha, U.K.; Deodhar, A.; Krishna, S.H.; Ansari, A.; Mohokar, H.; Dash, A. High Fluoride in Groundwater of an Industrialized Area of Eastern India (Odisha): Inferences from Geochemical and Isotopic Investigation. Environ. Earth Sci. 2016, 75, 1–17. [Google Scholar] [CrossRef]
  26. Ranjan, S.; Yasmin, S. Assessment of Fluoride Intake through Food Chain and Mapping of Endemic Areas of Gaya District, Bihar, India. Bull. Environ. Contam. Toxicol. 2015, 94, 220–224. [Google Scholar] [CrossRef]
  27. Battaleb-Looie, S.; Moore, F.; Malde, M.K.; Jacks, G. Fluoride in Groundwater, Dates and Wheat: Estimated Exposure Dose in the Population of Bushehr, Iran. J. Food Compos. Anal. 2013, 29, 94–99. [Google Scholar] [CrossRef]
  28. Samal, A.C.; Bhattacharya, P.; Mallick, A.; Ali, M.M.; Pyne, J.; Santra, S.C. A Study to Investigate Fluoride Contamination and Fluoride Exposure Dose Assessment in Lateritic Zones of West Bengal, India. Environ. Sci. Pollut. Res. 2015, 22, 6220–6229. [Google Scholar] [CrossRef] [PubMed]
  29. Chatterjee, A.; Roy, R.K.; Ghosh, U.C.; Pramanik, T.; Kabi, S.P.; Biswas, K. Fluoride in Water in Parts of Raniganj Coalfield, West Bengal. Curr. Sci. 2008, 94, 309–311. [Google Scholar]
  30. Vrana, K.; Rapant, S.; Bodiš, D.; Marsina, K.; Maňkovská, B.; Čurlík, J.; Šefčík, P.; Daniel, J.; Lučivjanský, L.; Lexa, J.; et al. Geochemical Atlas of the Slovak Republic at a Scale of 1:1,000,000. J. Geochem. Explor. 1997, 60, 7–37. [Google Scholar] [CrossRef]
  31. Wongsasuluk, P.; Chotpantarat, S.; Siriwong, W.; Robson, M. Heavy Metal Contamination and Human Health Risk Assessment in Drinking Water from Shallow Groundwater Wells in an Agricultural Area in Ubon Ratchathani Province, Thailand. Environ. Geochem. Health 2014, 36, 169–182. [Google Scholar] [CrossRef]
  32. Nogawa, K.; Suwazono, Y.; Kido, T. Long-Term Follow-Up Study of Residents Exposed to Cadmium in Kakehashi River Basin, Ishikawa, Japan. In Cadmium Toxicity; Springer: Singapore, 2019; pp. 51–61. [Google Scholar] [CrossRef]
  33. Adamu, C.I.; Nganje, T.N.; Edet, A. Heavy Metal Contamination and Health Risk Assessment Associated with Abandoned Barite Mines in Cross River State, Southeastern Nigeria. Environ. Nanotechnol. Monit. Manag. 2015, 3, 10–21. [Google Scholar] [CrossRef] [Green Version]
  34. Ahada, C.P.S.; Suthar, S. Assessment of Human Health Risk Associated with High Groundwater Fluoride Intake in Southern Districts of Punjab, India. Expo. Health 2019, 11, 267–275. [Google Scholar] [CrossRef]
  35. Samiee, F.; Vahidinia, A.; Taravati Javad, M.; Leili, M. Exposure to Heavy Metals Released to the Environment through Breastfeeding: A Probabilistic Risk Estimation. Sci. Total Environ. 2019, 650, 3075–3083. [Google Scholar] [CrossRef] [PubMed]
  36. Alimohammadi, M.; Nabizadeh, R.; Yaghmaeian, K.; Mahvi, A.H.; Foroohar, P.; Hemmati, S.; Heidarinejad, Z. Data on Assessing Fluoride Risk in Bottled Waters in Iran. Data Brief 2018, 20, 825–830. [Google Scholar] [CrossRef] [PubMed]
  37. Asnachinda, P. Hydrogeochemistry of the Chiang Mai Basin, Northern Thailand. J. Asian Earth Sci. 1997, 15, 317–326. [Google Scholar] [CrossRef]
  38. Choi, A.L.; Sun, G.; Zhang, Y.; Grandjean, P. Developmental Fluoride Neurotoxicity: A Systematic Review and Meta-Analysis. Environ. Health Perspect. 2012, 120, 1362–1368. [Google Scholar] [CrossRef] [Green Version]
  39. Singharajwarapan, F.S.; Wood, S.H.; Prommakorn, N.; Owens, L. Northern Thailand Geothermal Resources and Development-A Review and 2012 Update. Trans.-Geotherm. Resour. Counc. 2012, 36, 787–791. [Google Scholar]
  40. Kim, K.; Jeong, G.Y. Factors Influencing Natural Occurrence of Fluoride-Rich Groundwaters: A Case Study in the Southeastern Part of the Korean Peninsula. Chemosphere 2005, 58, 1399–1408. [Google Scholar] [CrossRef]
  41. ATSDR. Public Health Statement: Toxicological Profile for Fluorides, Hydrogen Fluoride, and Fluorine; Centers for Disease Control and Prevention: Atlanta, GA, USA, 2003; pp. 1–356. [Google Scholar]
  42. Mezghani, I.; Elloumi, N.; Abdallah, F.B.; Chaieb, M.; Boukhris, M. Fluoride Accumulation by Vegetation in the Vicinity of a Phosphate Fertilizer Plant in Tunisia. Fluoride 2005, 38, 69–75. [Google Scholar]
  43. Clark, M.B.; Keels, M.A.; Slayton, R.L. Fluoride Use in Caries Prevention in the Primary Care Setting. Pediatrics 2020, 146, 1–11. [Google Scholar] [CrossRef]
  44. Theerawasttanasiri, N.; Taneepanichskul, S.; Pingchai, W.; Nimchareon, Y.; Sriwichai, S. Implementing a Geographical Information System to Assess Endemic Fluoride Areas in Lamphun, Thailand. Risk Manag. Healthc. Policy 2018, 11, 15–24. [Google Scholar] [CrossRef] [Green Version]
  45. Chuckpaiwong, S.; Nakornchai, S.; Surarit, R.; Soo-ampon, S.; Kasetsuwan, R. Fluoride in Water Consumed by Children in Remote Areas of Thailand. Southeast Asian J. Trop. Med. Public Health 2000, 31, 319–324. [Google Scholar]
  46. Kabir, H.; Gupta, A.K.; Tripathy, S. Fluoride and Human Health: Systematic Appraisal of Sources, Exposures, Metabolism, and Toxicity. Crit. Rev. Environ. Sci. Technol. 2020, 50, 1116–1193. [Google Scholar] [CrossRef]
  47. Fordyce, F.M.; Vrana, K.; Zhovinsky, E.; Povoroznuk, V.; Toth, G.; Hope, B.C.; Iljinsky, U.; Baker, J. A Health Risk Assessment for Fluoride in Central Europe. Environ. Geochem. Health 2007, 29, 83–102. [Google Scholar] [CrossRef] [PubMed] [Green Version]
  48. Bharti, V. Fluoride Sources, Toxicity and Its Amelioration: A Review. Peertechz J. Environ. Sci. Toxicol. 2017, 2, 021–032. [Google Scholar] [CrossRef]
  49. Bhat, N.; Jain, S.; Asawa, K.; Tak, M.; Shinde, K.; Singh, A.; Gandhi, N.; Gupta, V.V. Assessment of Fluoride Concentration of Soil and Vegetables in Vicinity of Zinc Smelter, Debari, Udaipur, Rajasthan. J. Clin. Diagn. Res. 2015, 9, ZC63–ZC66. [Google Scholar] [CrossRef] [PubMed]
  50. Brougham, K.M.; Roberts, S.R.; Davison, A.W.; Port, G.R. The Impact of Aluminium Smelter Shut-down on the Concentration of Fluoride in Vegetation and Soils. Environ. Pollut. 2013, 178, 89–96. [Google Scholar] [CrossRef] [PubMed]
  51. Okibe, F.G.; Ekanem, E.J.; Paul, E.D.; Shallangwa, G.A.; Ekwumemgbo, P.A.; Sallau, M.S.; Abanka, O.C. Fluoride Content of Soil and Vegetables from Irrigation Farms on the Bank of River Galma, Zaria, Nigeria. Aust. J. Basic Appl. Sci. 2010, 4, 779–784. [Google Scholar]
  52. Chae, G.T.; Yun, S.T.; Kwon, M.J.; Kim, Y.S.; Mayer, B. Batch Dissolution of Granite and Biotite in Water: Implication for Fluorine Geochemistry in Groundwater. Geochem. J. 2006, 40, 95–102. [Google Scholar] [CrossRef] [Green Version]
  53. Bartram, J.; Ballance, R. Water Quality Monitoring: A Practical Guide to the Design and Implementation of Freshwater Quality Studies and Monitoring Programs; Taylor & Francis: London, UK, 1996; pp. 1–383. [Google Scholar]
  54. Haidouti, C. Effects of Fluoride Pollution on the Mobilization and Leaching of Aluminum in Soils. Sci. Total Environ. 1995, 166, 157–160. [Google Scholar] [CrossRef]
  55. Brindha, K.; Elango, L. Fluoride in Groundwater: Causes, Implications and Mitigation Measures. Fluoride Prop. Appl. Environ. Manag. 2011, 1, 113–136. [Google Scholar]
  56. Nagaraju, A.; Thejaswi, A.; Aitkenhead-Peterson, J.A. Fluoride and Heavy Metal Accumulation by Vegetation in the Fluoride Affected Area of Talupula, Anantapur District, Andhra Pradesh. J. Geol. Soc. India 2017, 89, 27–32. [Google Scholar] [CrossRef]
  57. Shashi, A.; Singla, S. Clinical and Biochemical Profile of Deiodinase Enzymes and Thyroid Function Hormones in Patients of Fluorosis. Aust. J. Basic Appl. Sci. 2013, 7, 100–107. [Google Scholar]
  58. Edmunds, W.M.; Smedley, P.L. Fluoride in Natural Waters. In Essentials of Medical Geology; Springer: Dordrecht, The Netherlands, 2013; pp. 311–336. [Google Scholar] [CrossRef]
  59. Barbier, O.; Arreola-Mendoza, L.; Del Razo, L.M. Molecular Mechanisms of Fluoride Toxicity. Chem. Biol. Interact. 2010, 188, 319–333. [Google Scholar] [CrossRef] [PubMed]
  60. Poureslami, H.; Khazaeli, P.; Mahvi, A.H.; Poureslami, K.; Poureslami, P.; Haghani, J.; Aghaei, M. Fluoride Level in the Breast Milk in Koohbanan, a City with Endemic Dental Fluorosis. Fluoride 2016, 49, 485–494. [Google Scholar]
  61. Kanduti, D.; Sterbenk, P.; Artnik, B. Fluoride: A Review of Use and Effects on Health. Mater. Socio Med. 2016, 28, 133. [Google Scholar] [CrossRef] [Green Version]
  62. Denbesten, P.; Li, W. Chronic Fluoride Toxicity: Dental Fluorosis. Monogr. Oral Sci. 2011, 22, 81–96. [Google Scholar] [CrossRef] [Green Version]
  63. Mandinic, Z.; Curcic, M.; Antonijevic, B.; Carevic, M.; Mandic, J.; Djukic-Cosic, D.; Lekic, C.P. Fluoride in Drinking Water and Dental Fluorosis. Sci. Total Environ. 2010, 408, 3507–3512. [Google Scholar] [CrossRef]
  64. Opydo-Symaczek, J.; Borysewicz-Lewicka, M. Transplacental Passage of Fluoride in Pregnant Polish. Fluoride 2007, 40, 46–50. [Google Scholar]
  65. Gurumurthy, S.M.; Shruti, M.; Aparna, V.B.; Mishra, A.K.; Pragna, R. Association of Higher Maternal Serum Fluoride with Adverse Fetal Outcomes. Int. J. Med. Public Health 2011, 1, 13–17. [Google Scholar] [CrossRef] [Green Version]
  66. Sastry, M.G.; Mohanty, S.; Vyakaranam, S.; Aparna, V.B.; Pragna, R. Transplacental Transport of Fluoride, Calcium and Magnesium. Natl. J. Integr. Res. Med. 2011, 2, 51–55. [Google Scholar]
  67. Trivedi, M.H.; Verma, R.J.; Chinoy, N.J.; Patel, R.S.; Sathawara, N.G. Effect of High Fluoride Concentration in Drinking Water on Children’s Intelligence. J. Dent. Med. 2006, 19, 80–86. [Google Scholar]
  68. Seraj, B.; Shahrabi, M.; Shadfar, M.; Ahmadi, R.; Fallahzadeh, M.; Eslamlu, H.F.; Kharazifard, M.J. Effect of High Water Fluoride Concentration on the Intellectual Development of Children in Makoo/Iran. J. Dent. 2012, 9, 221–229. [Google Scholar]
  69. Rošin -Grget, K.; Peroš, K.; Sutej, I.; Bašić, K. The Cariostatic Mechanisms of Fluoride. Acta Med. Acad. 2013, 42, 179–188. [Google Scholar] [CrossRef] [PubMed] [Green Version]
  70. Susheela, A.K.; Bhatnagar, M.; Vig, K.; Mondal, N.K. Excess Fluoride Ingestion and Thyroid Hormone Derangements in Children Living in Delhi, India. Fluoride 2005, 38, 98–108. [Google Scholar]
  71. Baig, A.A.; Fox, J.L.; Young, R.A.; Wang, Z.; Hsu, J.; Higuchi, W.I.; Chhettry, A.; Zhuang, H.; Otsuka, M. Relationships among Carbonated Apatite Solubility, Crystallite Size, and Microstrain Parameters. Calcif. Tissue Int. 1999, 64, 437–449. [Google Scholar] [CrossRef]
  72. Aoba, T. The Effect of Fluoride on Apatite Structure and Growth. Crit. Rev. Oral Biol. Med. 1997, 8, 136–153. [Google Scholar] [CrossRef] [Green Version]
  73. Levy, S.M.; Eichenberger-Gilmore, J.; Warren, J.J.; Letuchy, E.; Broffitt, B.; Marshall, T.A.; Burns, T.; Willing, M.; Janz, K.; Torner, J.C. Associations of Fluoride Intake with Children’s Bone Measures at Age 11. Community Dent. Oral Epidemiol. 2009, 37, 416–426. [Google Scholar] [CrossRef] [Green Version]
  74. Rahmati-Najarkolaei, F.; Rahnama, P.; Fesharaki, M.G.; Behnood, V. Predictors of Oral Health Behaviors in Female Students: An Application of the Health Belief Model. Iran. Red Crescent Med. J. 2016, 18, 1–7. [Google Scholar] [CrossRef] [Green Version]
  75. Jawjit, S.; Jaijaeng, P.; Chanakun, J.; Suwannahong, K. Health Risk Assessment of Arsenic in Groundwater from Tin Mining Area in Southern Thailand. Int. J. Pharm. Res. 2021, 13, 5581–5587. [Google Scholar] [CrossRef]
  76. Phenrat, T.; Otwong, A.; Chantharit, A.; Lowry, G.V. Review Ten-Year Monitored Natural Recovery of Lead-Contaminated Mine Tailing. Environ. Health Perspect. 2016, 124, 1511–1520. [Google Scholar] [CrossRef] [Green Version]
  77. Chaiwong, S.; Chanthanao, W.; Loeskhampom, P.; Wiwatanadate, P.; Sthiannopkao, S. The Comparison of Urinary Cadmium (Ucd) and Urinary Lead (Upb) between 2007 and 2015 in a Population Living in a Zinc Contaminated Area. Environ. Nat. Resour. J. 2019, 17, 54–61. [Google Scholar] [CrossRef]
  78. Xiang, B.; Wong, H.M.; Perfecto, A.P.; McGrath, C.P.J. Modelling Health Belief Predictors of Oral Health and Dental Anxiety among Adolescents Based on the Health Belief Model: A Cross-Sectional Study. BMC Public Health 2020, 20, 1–12. [Google Scholar] [CrossRef] [PubMed]
  79. Srivastava, S.; Flora, S.J.S. Fluoride in Drinking Water and Skeletal Fluorosis: A Review of the Global Impact. Curr. Environ. Health Rep. 2020, 7, 140–146. [Google Scholar] [CrossRef] [PubMed]
  80. Patil, M.M.; Lakhkar, B.B.; Patil, S.S. Curse of Fluorosis. Indian J. Pediatr. 2018, 85, 375–383. [Google Scholar] [CrossRef] [PubMed]
  81. Fernando, W.B.N.T.; Nanayakkara, N.; Gunarathne, L.; Chandrajith, R. Serum and Urine Fluoride Levels in Populations of High Environmental Fluoride Exposure with Endemic CKDu: A Case–Control Study from Sri Lanka. Environ. Geochem. Health 2020, 42, 1497–1504. [Google Scholar] [CrossRef]
  82. Jiménez-Córdova, I.M.; Cárdenas-González, M.; Aguilar-Madrid, G.; Sanchez-Peña, L.C.; Barrera-Hernández, Á.; Domínguez-Guerreroc, I.A.; González-Hortac, C.; Barbier, O.C.; Del Razo, L.M. Evaluation of Kidney Injury Biomarkers in an Adult Mexican Population Environmentally Exposed to Fluoride and Low Arsenic Levels. Toxicol. Appl. Pharmacol. 2018, 352, 97–106. [Google Scholar] [CrossRef]
  83. Negash, S.; Musa, P.; Vogel, D.; Sahay, S. Healthcare Information Technology for Development: Improvements in People’s Lives through Innovations in the Uses of Technologies. Inf. Technol. Dev. 2018, 24, 189–197. [Google Scholar] [CrossRef] [Green Version]
  84. Wicks, P.; Stamford, J.; Grootenhuis, M.A.; Haverman, L.; Ahmed, S. Innovations in E-Health. Qual. Life Res. 2014, 23, 195–203. [Google Scholar] [CrossRef] [Green Version]
  85. Rirattanapong, P.; Rirattanapong, O. Fluoride Content of Commercially Available Ready-to-Drink Tea in Bangkok, Thailand. Southeast Asian J. Trop. Med. Public Health 2017, 48, 690–693. [Google Scholar]
  86. Štepec, D.; Ponikvar-Svet, M. Fluoride in Human Health and Nutrition. Acta Chim. Slov. 2019, 66, 255–275. [Google Scholar] [CrossRef] [Green Version]
  87. Cantoral, A.; Muñoz -Rocha, T.V.; Luna-Villa, L.; Mantilla-Rodriguez, A.; Urea-Cirett, J.L.; Castiblanco, G.A.; Solano, M.; Hu, H.; Peterson, K.E.; Téllez -Rojo, M.M.; et al. Association of Dietary Fluoride Intake and Diet Variables with Dental Caries in Adolescents from the ELEMENT Cohort Study. Caries Res. 2021, 55, 88–98. [Google Scholar] [CrossRef]
  88. Curiel, J.A.; Slade, G.D.; Christian, T.M.L.; Lafferty-Hess, S.; Carsey, T.M.; Sanders, A.E. Referendum Opposition to Fluoridation and Health Literacy: A Cross-Sectional Analysis Conducted in Three Large US Cities. BMJ Open 2019, 9, 1–8. [Google Scholar] [CrossRef] [PubMed] [Green Version]
  89. Luo, Q.; Cui, H.; Deng, H.; Kuang, P.; Liu, H.; Lu, Y.; Fang, J.; Zuo, Z.; Deng, J.; Li, Y.; et al. Histopathological Findings of Renal Tissue Induced by Oxidative Stress Due to Different Concentrations of Fluoride. Oncotarget 2017, 8, 50430–50446. [Google Scholar] [CrossRef] [PubMed] [Green Version]
  90. Wang, M.; Zhang, L.; Liu, Y.; Chen, D.; Liu, L.; Li, C.; Kang, K.J.; Wang, L.; He, Z.; Yang, X. Spatial Variation and Fractionation of Fluoride in Tobacco-Planted Soils and Leaf Fluoride Concentration in Tobacco in Bijie City, Southwest China. Environ. Sci. Pollut. Res. 2021, 28, 26112–26123. [Google Scholar] [CrossRef] [PubMed]
Figure 1. Overview of study design and population of the study.
Sustainability 14 08701 g001
Figure 2. Map of Chiang Mai Basin (covered Chiang Mai and Lamphun province) and Ma Khuea Chae subdistrict.
Sustainability 14 08701 g002
Figure 3. Map of Ma Khuea Chae subdistrict Meaung district in the Lamphun province.
Sustainability 14 08701 g003
Figure 4. Fluoride levels in the urine of village health volunteers (VHVs) from the Ma Khuea Chae subdistrict’s villages (N = 371) by age group.
Sustainability 14 08701 g004
Figure 5. Fluoride levels in the urine of village health volunteers (VHVs) from the Ma Khuea Chae subdistrict’s 21 villages, stratified by gender (N = 371).
Sustainability 14 08701 g005
Table 1. The answer score given in terms of positive and negative knowledge.
AnswerScore for Positive KnowledgeScore for Negative Knowledge
Correct10
Incorrect01
Table 2. Reasonable Maximum Exposure (RME) for calculating Health Risk Assessment intake from vegetables, fruits, poultry, and meat, as well as groundwater consumption.
VariableQuantity for Calculations
Fluoride levels in vegetables, fruits, poultry, and meats, as well as groundwater (mg/L)Depending on the sort of vegetables, fruits, poultry, and animal meats consumed, as well as the quality of the drinking water
Conversion factor (80–100%)0.80
Ingestion rate: IR g/day (95th %)177
Exposure frequency: EF (days/year; 365 days (95th %) for drinking water and 350 days (95th %) for vegetables, fruits, poultry, and meats)181.85
Exposure duration in contaminated areas:
(ED for 70 years)
57.45
BW (body weight: BW for 60 kgs at 95%)55.71
Average time = (age × 365 days)20,805
Reference dose of fluoride: RfD (mg/kg/day) (36)0.06
Table 3. Information about the personal information of village health volunteers (VHVs) (N = 371).
ItemN%
1Age (year)
1.1Less than 30 years30.81
1.2Between 31 and 40 years256.74
1.3Between 41 and 50 years9726.14
1.4Between 51 and 60 years17948.24
1.5More than 61 years6718.05
2Gender
2.1Male14739.62
2.2Female22460.38
3Marriage status
3.1Single71.89
3.2Married29579.51
3.3Widow4812.94
3.4Divorce/separated215.66
4Weight (kg)
4.1Less than 50 Kg9024.26
4.2Between 51 and 60 Kg16444.21
4.3Between 61 and 70 Kg8021.56
4.4Between 71 and 80 Kg256.74
4.5More than 81 Kg123.23
5Height (cm)
5.1Less than 150.0 cm7720.75
5.2Between 151 and 160 cm17747.71
5.3Between 161 and 170 cm9826.42
5.4More than 171 cm195.12
6Education
6.1Primary school25167.65
6.2Secondary school (level 1–3)5815.63
6.3Secondary school (level 4–6)4411.86
6.4Diploma82.16
6.5Bachelor82.16
6.6Higher Bachelor20.54
7Careers
7.1Unemployed20.54
7.2Agriculture5514.82
7.3Government officer/state enterprise41.08
7.4Private business9124.53
7.5Employee21959.03
8Income
8.1Less than 90 US8422.64
8.2Between 90 and 150 US7419.95
8.3Between 151 and 300 US12934.77
8.4Between 301 and 600 US4111.05
8.5More than 600 US4311.59
9Housing
9.1Owner32487.33
9.2Living with father and/or mother297.82
9.3Living with father-in-law and/or mother-in-law133.5
9.4Others51.35
10Location
10.1Living in the same location since born 29178.44
10.2Migration (If you were a migrant, please indicate time)8021.56
10.2.1Less than 1 year22.5
10.2.2Between 1 and 3 years1012.5
10.2.3Between 3 and 5 years1316.25
10.2.4More than 5 years5568.75
11Sources of supply water for drinking (answer more than one answer)
11.1Rain30.57
11.2Groundwater326.1
11.3Water supply10319.62
11.4Surface water305.71
11.5Commercial bottled water34265.14
11.6Box water122.29
11.7Others30.57
12The quality of drinking water has improved
12.1No improvement4812.94
12.2Improved32387.06
If there is improvement, what method was used? (Answer more than one answer)
12.2.1Filtrated19760.37
12.2.2Boil7222.29
12.2.3Others5617.34
13Cooked water sources (answer more than one answer)
13.1Rain30.57
13.2Groundwater326.1
13.3Water supply10319.62
13.4Surface water305.71
13.5Commercially bottled water34265.14
13.6Box water122.29
13.7Others30.57
14The quality of water that has been cooked has been improved
14.1There has been no improvement.277.28
14.2Improved34492.72
If there is improvement, what method was used? (Answe more than one answer)
14.2.1Filtrated21461.32
14.2.2Boil7722.06
14.2.3Others5816.62
15The history of the investigation involving urinary fluoride
15.1Ever00
15.2Never371100
16Fluoride is a known contaminant in water (e.g., groundwater, water supply) in these areas
16.1Known00
16.2Unknown 371100
17Camellia sinensis seems to be chewed
17.1No chewing32788.14
17.2Chewing4411.86
If chewing, what is the time of chewing?
17.2.1During 1–5 years1840.9
17.2.2During 6–10 years1329.55
17.2.3More than 11 years1329.55
18Tea drinking behavior
18.1No drinking33790.84
18.2Drinking349.16
Drinking at the appropriate time (if you are drinking)
18.2.1During 1–5 years2264.7
18.2.2During 6–10 years617.65
18.2.3More than 11 years617.65
19The consumption patterns of vegetables, fruits, poultry, and animal meats in fluoride-contaminated areas were observed and documented.
19.1Vegetables
19.1.1A list of the top five vegetables ingested by VHHs in terms of their favorite vegetable consumption.
(1) Brassica chinensis Jusl var parachinensis (Bailey) and Tsen and Lee 21129.43
(2) Brassica oleracea var. capitata16923.57
(3) Brassica pekinensis14420.08
(4) Ipomoea aquatica10915.2
(5) Brassica oleracea Alboglabra Group8411.72
19.1.2Sources of vegetables
Grown7117.53
(1) Purchased from farm in village17944.2
(2) Purchased from other villages10525.92
(3) Purchased from source unknown5012.35
19.2Fruit
19.2.1This list contains the top five fruits that VHHs considered to be their favorite foods to consume.
(1) Dimocarpus longan31540.08
(2) Musa acuminata Colla22728.88
(3) Mangidera indica10313.1
(4) Citrus779.8
(5) Carica papaya L.648.14
19.2.2Sources of fruits
(1) Grown18946.66
(2) Purchased from a farm in the village15538.27
(3) Purchased from other villages409.88
(4) Purchased from an unknown source215.19
19.3Poultry and animal meats
19.3.1The top five ranks of poultry and animal meats that were VHHs’ favorite to consume
(1) Sus scrofa domesticus29538.01
(2) Bos taurus21627.84
(3) Gallus gallus15519.97
(4) Oreochromis niloticus9812.63
(5) Hoplobatrachus rugulosus121.55
19.3.2Sources of poultry and animal meats
(1) Purchased from a farm in the village29673.08
(2) Purchased from other villages5914.57
(3) Purchased from an unknown source5012.35
Table 4. The level of fluoride knowledge in village health volunteers (VHVs).
ScorePercentage (%)Interpretation
11–14 score0.00High
7–10 score34.77Medium
1–6 score65.23Low
Table 5. Fluoride content and hazard quotient (HQ) values derived from commercial groundwater bottle consumption in various places (N = 8).
AddressTypes of WaterFluoride Concentration in Bottled Water Produced from Contaminated Groundwater (mg/L)HQ
Village 1: Ban Ma Khuea ChaeBottle water brand A0.290.84
Village 2: Ban Sa LangBottle water brand B0.451.31
Village 4: Ban San Kha YomBottle water brand C0.340.99
Village 6: Ban Rong Kor MuangBottle water brand D10.530.57
Village 20: Ban Yee Kor Bottle water brand E0.451.31
Village 20: Ban Yee Kor Water supply brand F15.201.10
Village 20: Ban Yee Kor Bottle water brand G0.381.36
Village 20: Ban Yee KorGroundwater filtrated by municipality treatment 0.471.90
Average mean concentration of fluoride = 3.51 ppm. (min–max = 0.29–15.20 ppm).
Table 6. Fluoride content and hazard quotient: HQ of several fruits cultivated in the Ma Khuea Chae subdistrict (N = 7).
ScorePercentage (%)Interpretation
Hylocercus undatus (Haw) Brit. and Rose 0.220.85
Psidium guajava0.381.47
Carica papaya L. 0.351.35
Musa acuminata Colla0.010.03
Mangidera indica0.461.78
Dimocarpus longan0.150.58
Tamarindus indica0.281.08
Average mean concentration of fluoride = 0.26 ppm. (min–max = 0.01–0.46 ppm).
Table 7. Fluoride concentration and hazard quotient: HQ of various young plants grown in the Ma Khuea Chae subdistrict (N = 9).
Type of PlantFluoride Concentration (mg/g)HQ
Cucurbita moschata Decne0.070.25
Acacia Insuavis, Lace0.331.28
Leucaena leucocephala0.813.14
Coccinia grandis0.471.82
Sesbania grandiflora0.431.67
Moringa oleifera Lam.0.371.43
Basella alba0.291.12
Sechium edule0.311.2
Momordica charantia L.0.913.53
Average mean concentration of fluoride = 0.44 ppm. (min–max = 0.07–0.91 ppm).
Table 8. Fluoride concentration and hazard quotient: HQ in mature plants grown in the Ma Khuea Chae subdistrict (N = 5).
Type of PlantFluoride Concentration (mg/g)HQ
Ocimum sanctum0.431.67
Brassica pekinensis0.461.78
Brassica juncea (L.) Czern. and Coss. 3.0711.92
Brassica chinensis L. var. parachinesis Tsen and Lee.0.441.71
Piper sarmentosum0.491.9
Average mean concentration of fluoride = 0.98 ppm (min–max = 0.43–3.07 ppm).
Table 9. Fluoride concentration and hazard quotient: HQ in the different whole plants grown in Ma Khuea Chae subdistrict (N = 3).
Type of PlantFluoride Concentration (mg/g)HQ
Ipomoea aquatica0.762.95
Gymnema inodorum0.582.25
Neptunia oleracea0.772.99
Average mean concentration of fluoride = 0.70 ppm (min–max = 0.58–0.77 ppm).
Table 10. Fluoride concentration and hazard quotient: HQ in different food crops grown in Ma Khuea Chae subdistrict (N = 7).
Type of PlantFluoride Concentration (mg/g)HQ
Solanum virginianum L. 0.190.74
Vigna unguiculata ssp. Sesquipedalis 0.281.09
Solanum melongena0.120.47
Solanum torvum0.411.59
Lablab purpureus0.622.41
Trichosanthes anguina Linn. 0.250.97
Luffa acutangula(Linn.) Roxb. 0.130.51
Average mean concentration of fluoride = 0.29 ppm (min–max = 0.12–0.62 ppm).
Table 11. Fluoride concentration and hazard quotient: HQ in different cooked plants grown in Ma Khuea Chae subdistrict (N = 5).
Type of PlantFluoride Concentration (mg/g)HQ
Citrus aurantifolia (Christm.) Swingle0.140.54
Citrus hystrix1.445.59
Cymbopogon citratus0.271.04
Capsicum annuum0.511.98
Capsicum annuum ‘Bird’s Eye’ 0.110.42
Average mean concentration of fluoride = 0.49 ppm. (min–max = 0.11–1.44 ppm).
Table 12. Fluoride concentration and hazard quotient: HQ in different poultry and meat farmed in Ma Khuea Chae subdistrict (N = 3).
Type of PlantFluoride Concentration (mg/g)HQ
Bos taurus0.813.14
Gallus gallus0.10.38
Oreochromis niloticus0.10.38
Average mean = 0.34 ppm. (min–max = 0.10–0.81 ppm).
Publisher’s Note: MDPI stays neutral with regard to jurisdictional claims in published maps and institutional affiliations.

