
Research on Industrial Ecological Efficiency Evaluation and Improvement Countermeasures Based on Data-Driven Evaluations from 30 Provinces and Cities in China


Abstract
:1. Introduction
2. Literature Review
- Owing to the differences in the natural endowments of the study areas, scholars have constructed different evaluation index systems for industrial ecological efficiency. However, regarding industrial technology change and “carbon peak”, it is necessary to consider indicators such as industrial technology research and development and industrial waste emissions when constructing an index system. How to build a more comprehensive evaluation index system for industrial ecological efficiency is a difficult problem and challenge to be solved in this study.
- The evaluation of industrial ecological efficiency involves multiple indicators and multi-source data, such as energy, resource input, and expected and unexpected outputs. The accurate measurement of industrial ecological efficiency is urgently required in order to improve the efficiency of industrial resource utilization.
- Industrial ecological efficiency shows different temporal characteristics and spatial distribution patterns in different periods. Therefore, targeted suggestions on improving regional ecological efficiency are urgently needed to promote the sustainable development of the regional industry. Such suggestions are also significant for achieving “carbon peaking” and “carbon neutralization” goals.
3. Materials and Methods
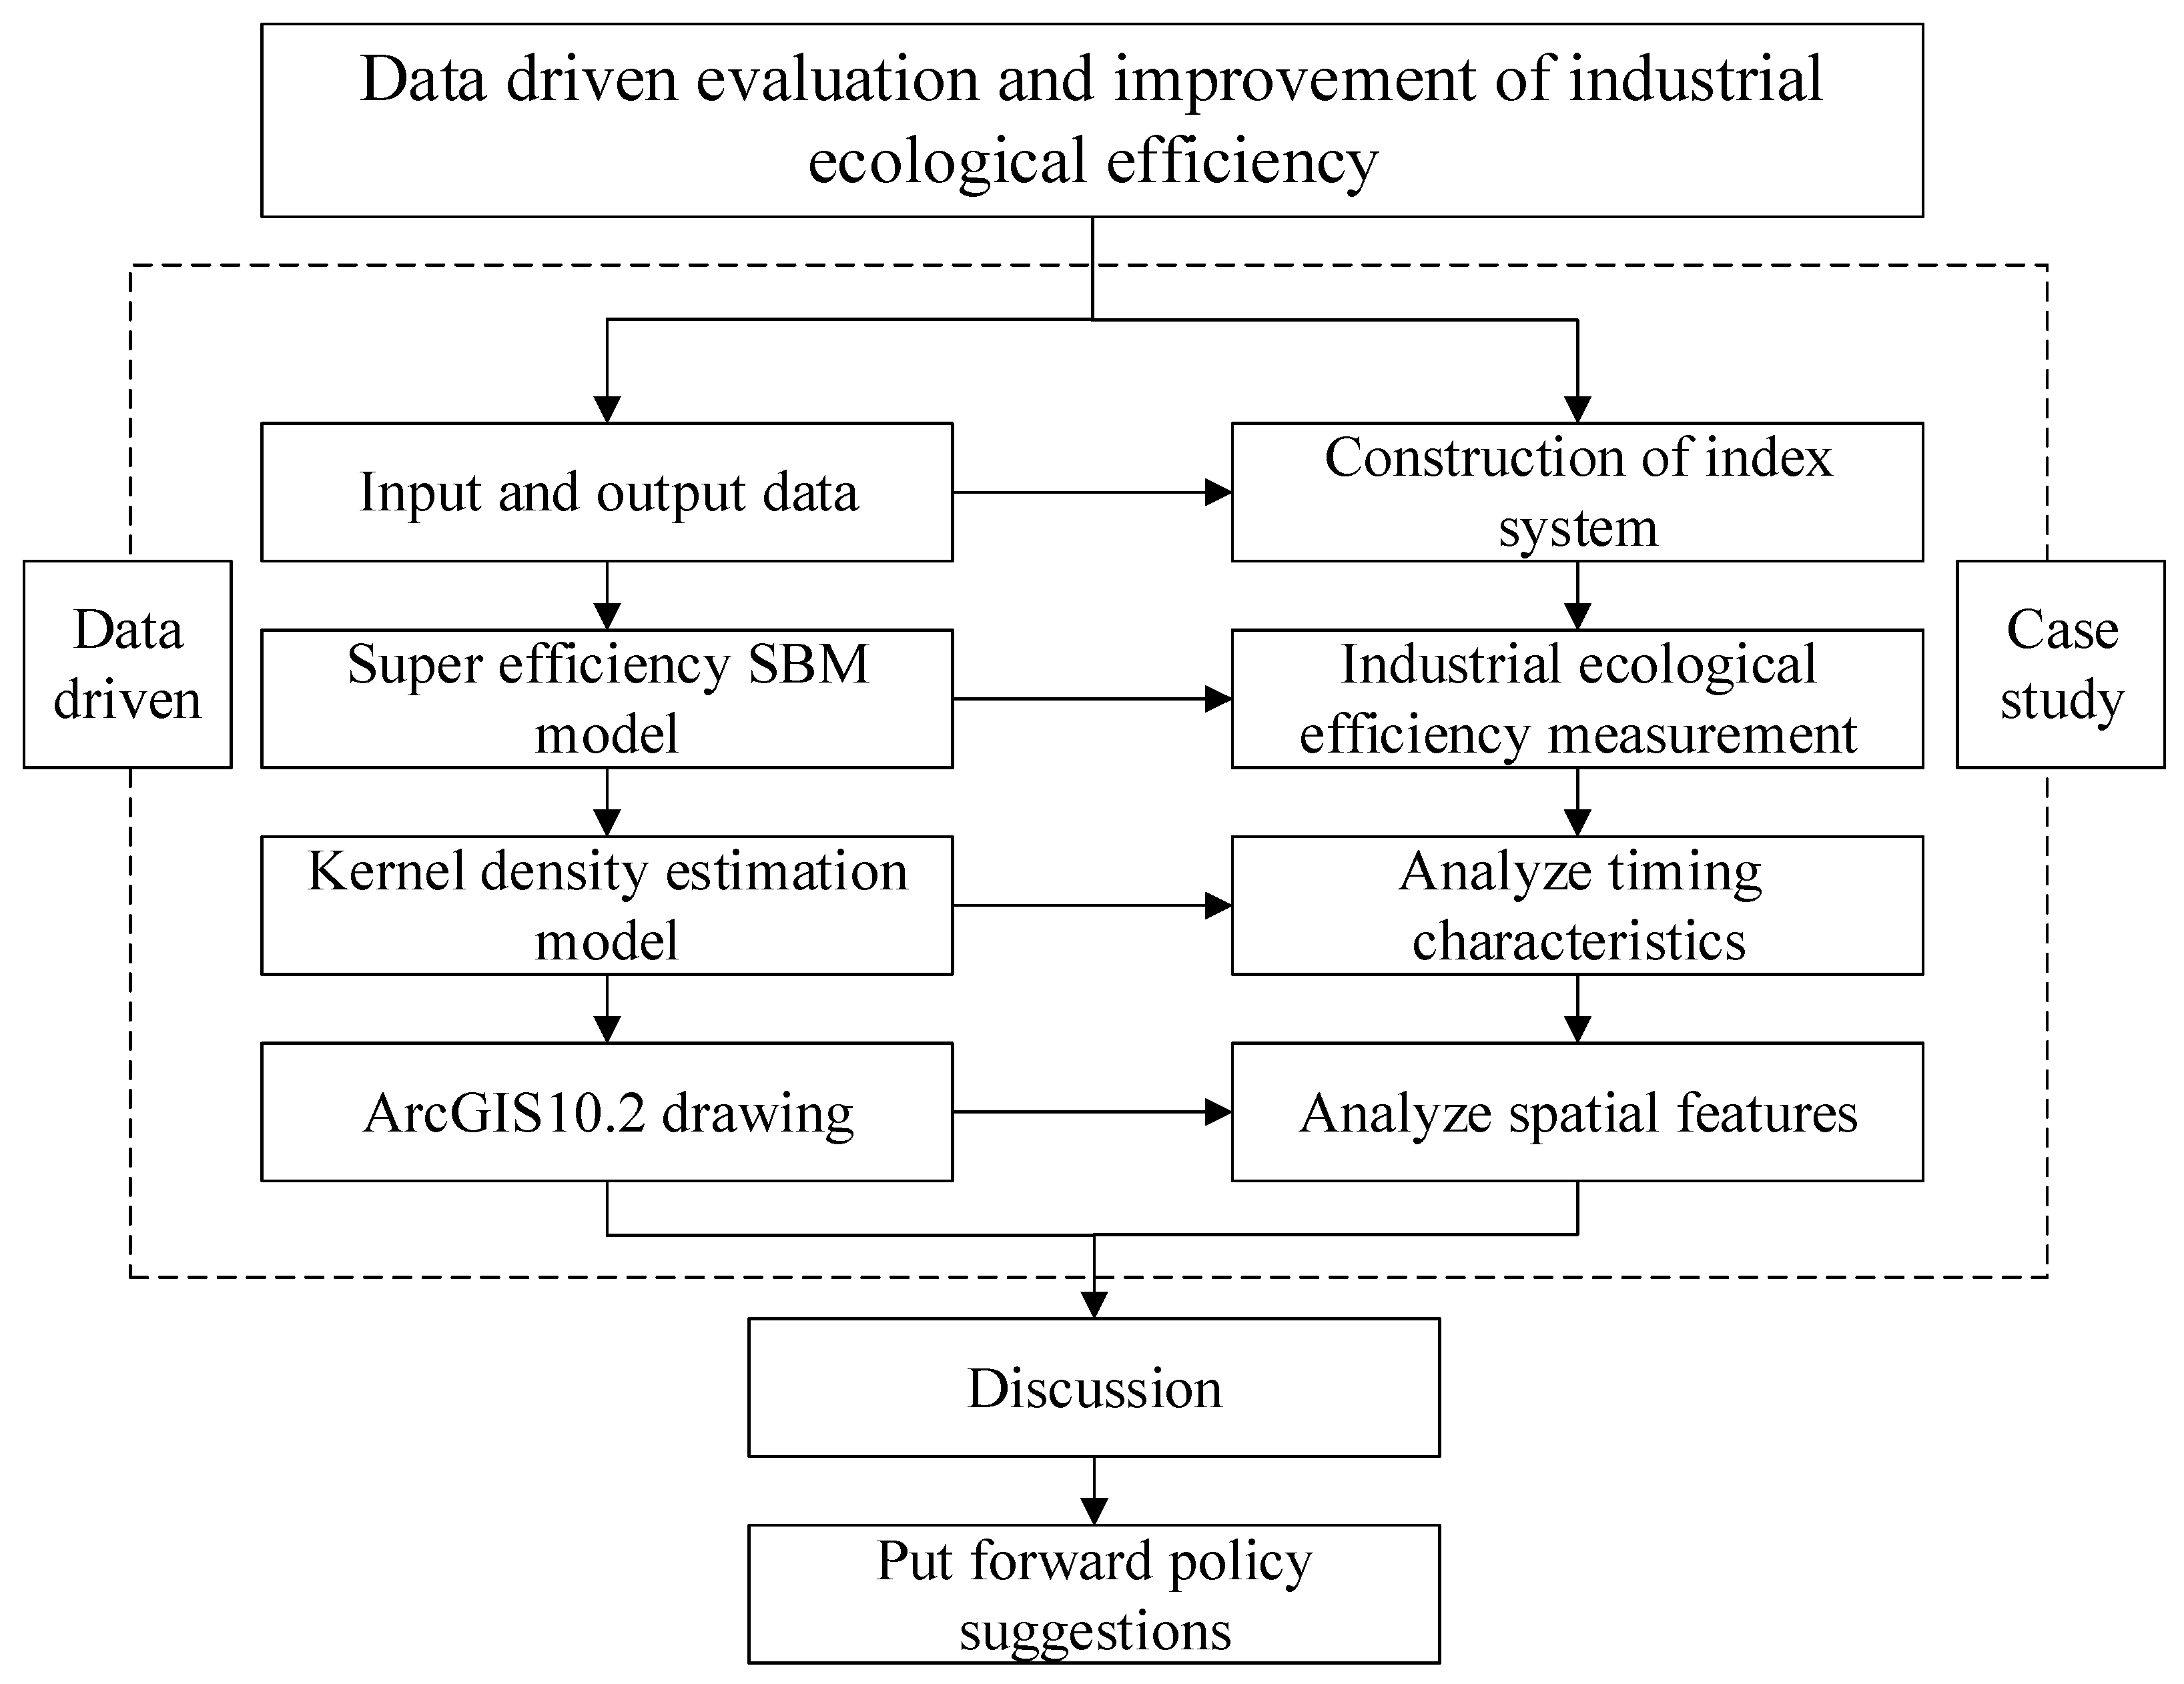
3.1. Method and Process
3.2. Data Collection and Index Construction
3.3. Data Model
3.3.1. Super-Efficiency SBM
3.3.2. Kernel Density Estimation Method
3.4. Data Application
4. Case Study
4.1. Case Study Background
4.2. Results
4.2.1. Measurement Results of Industrial Ecological Efficiency in China
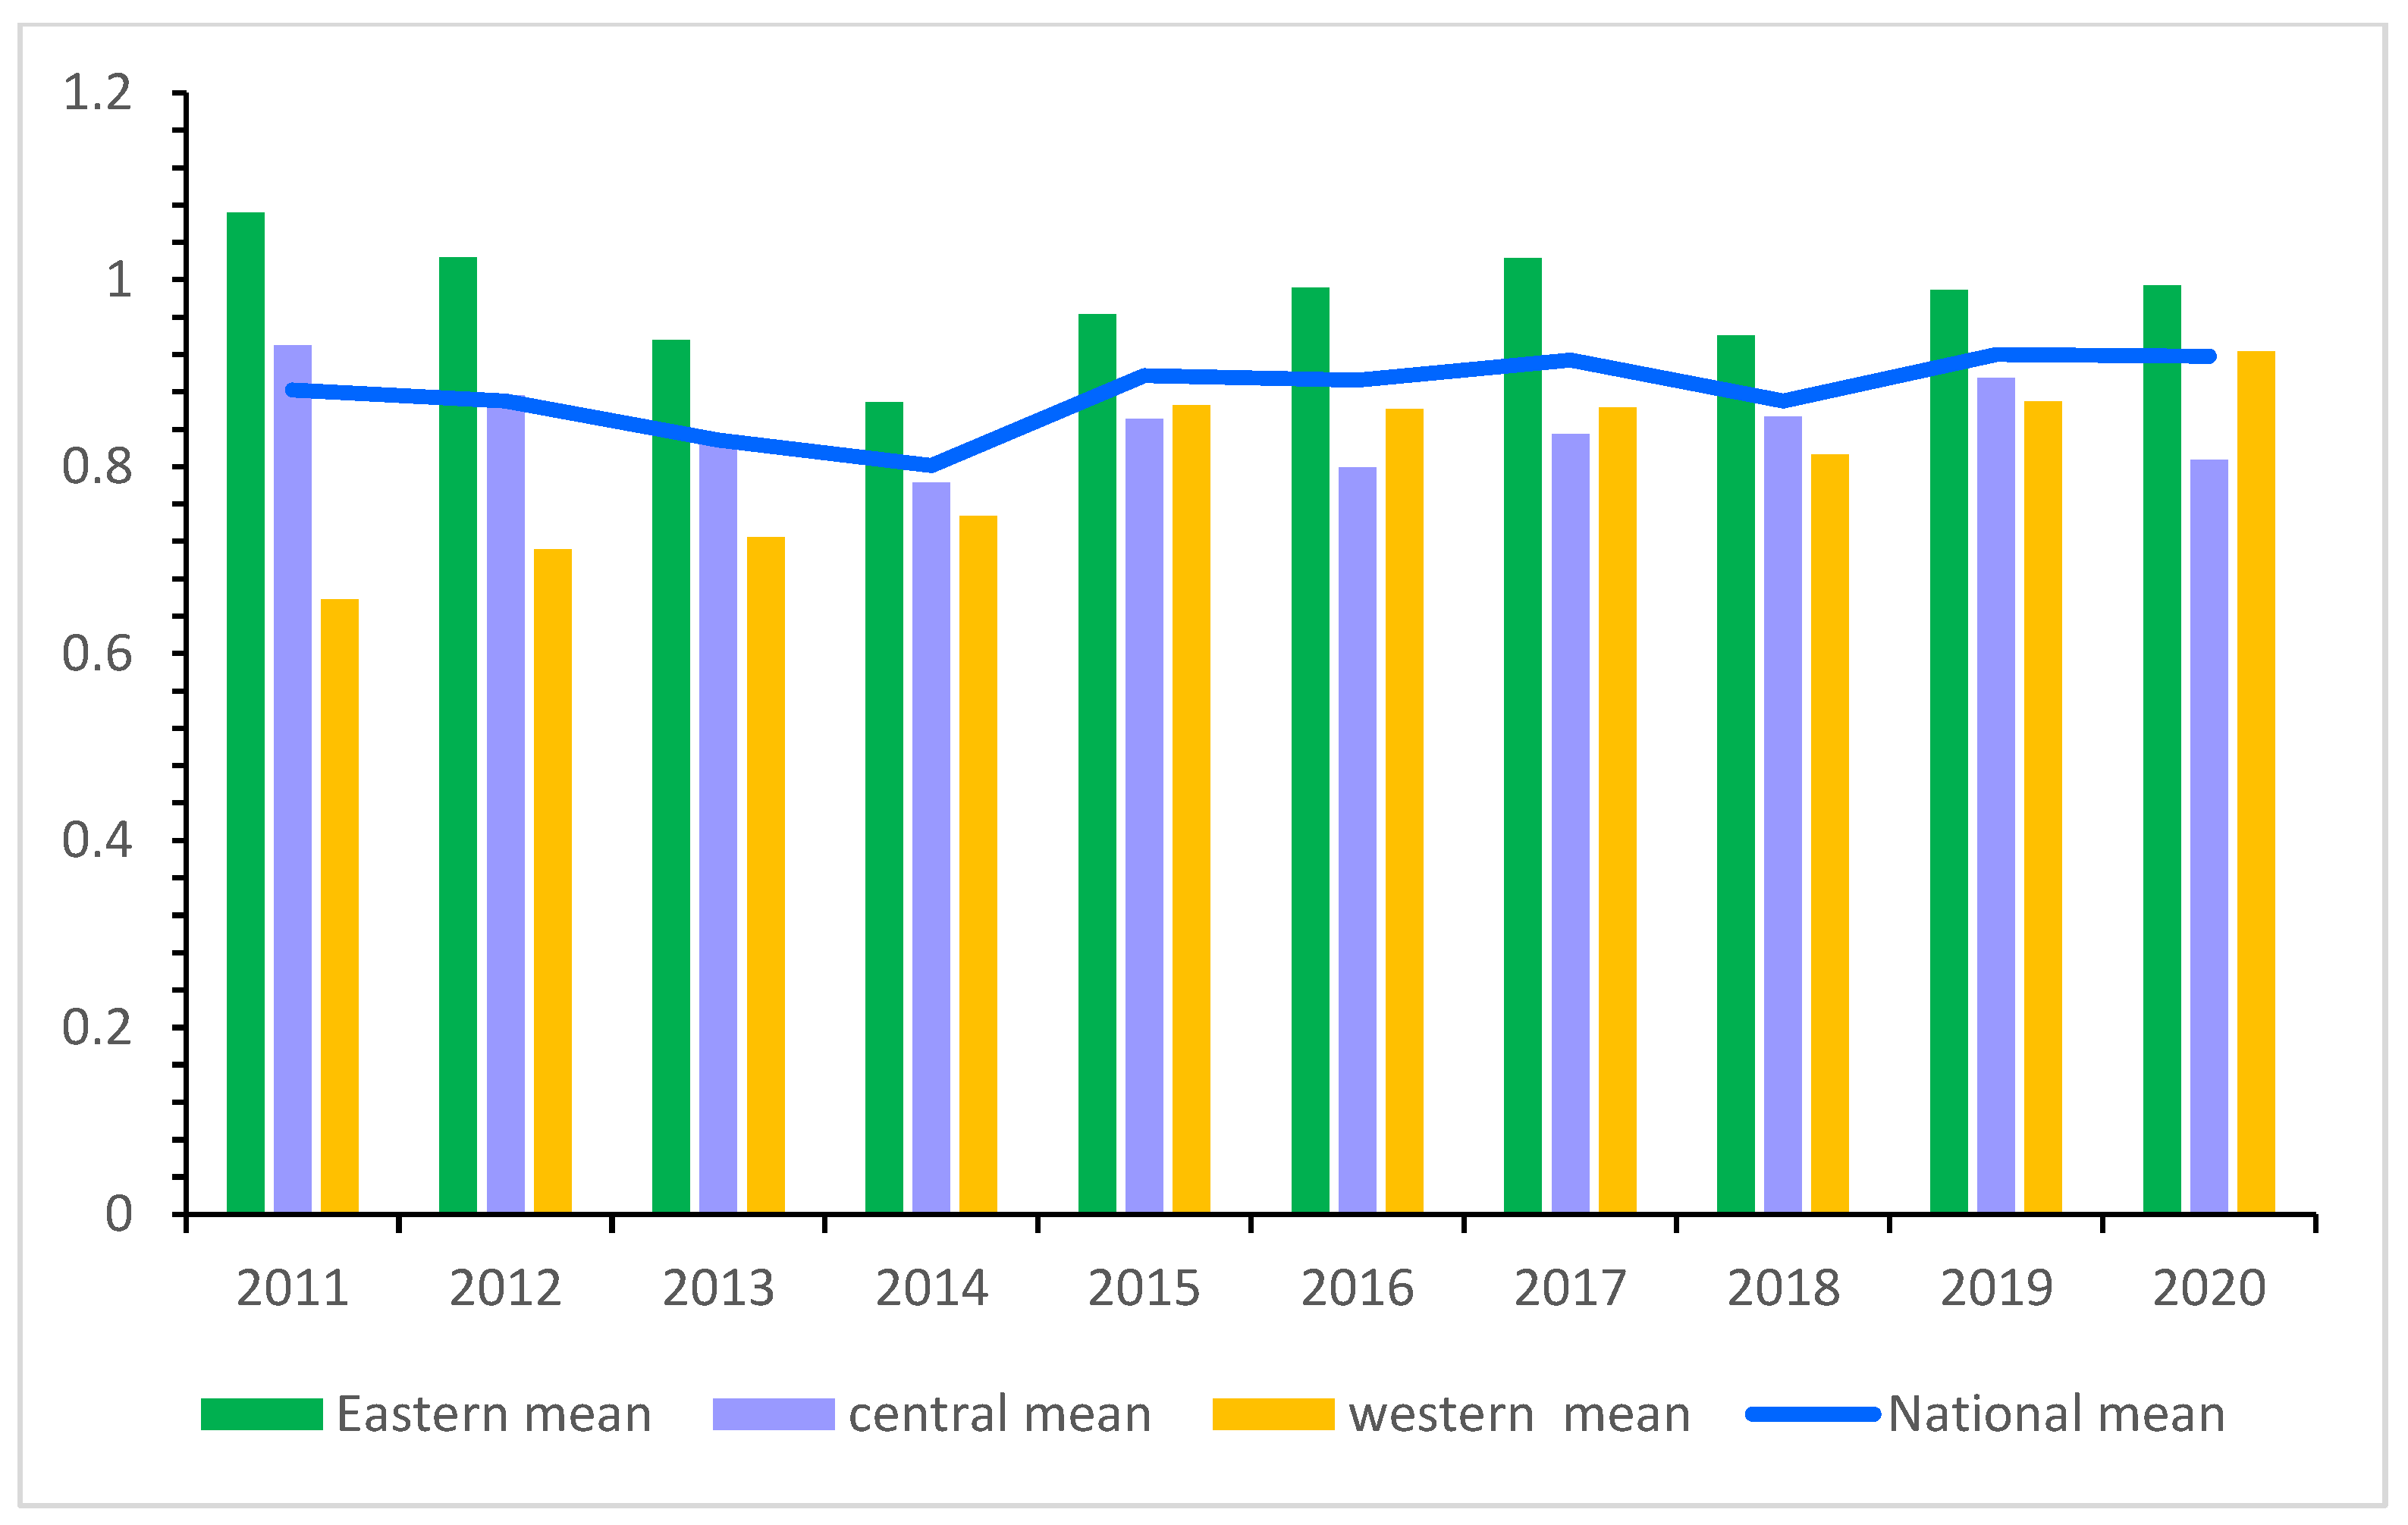
4.2.2. Time-Series Characteristics of Industrial Eco-Efficiency in China
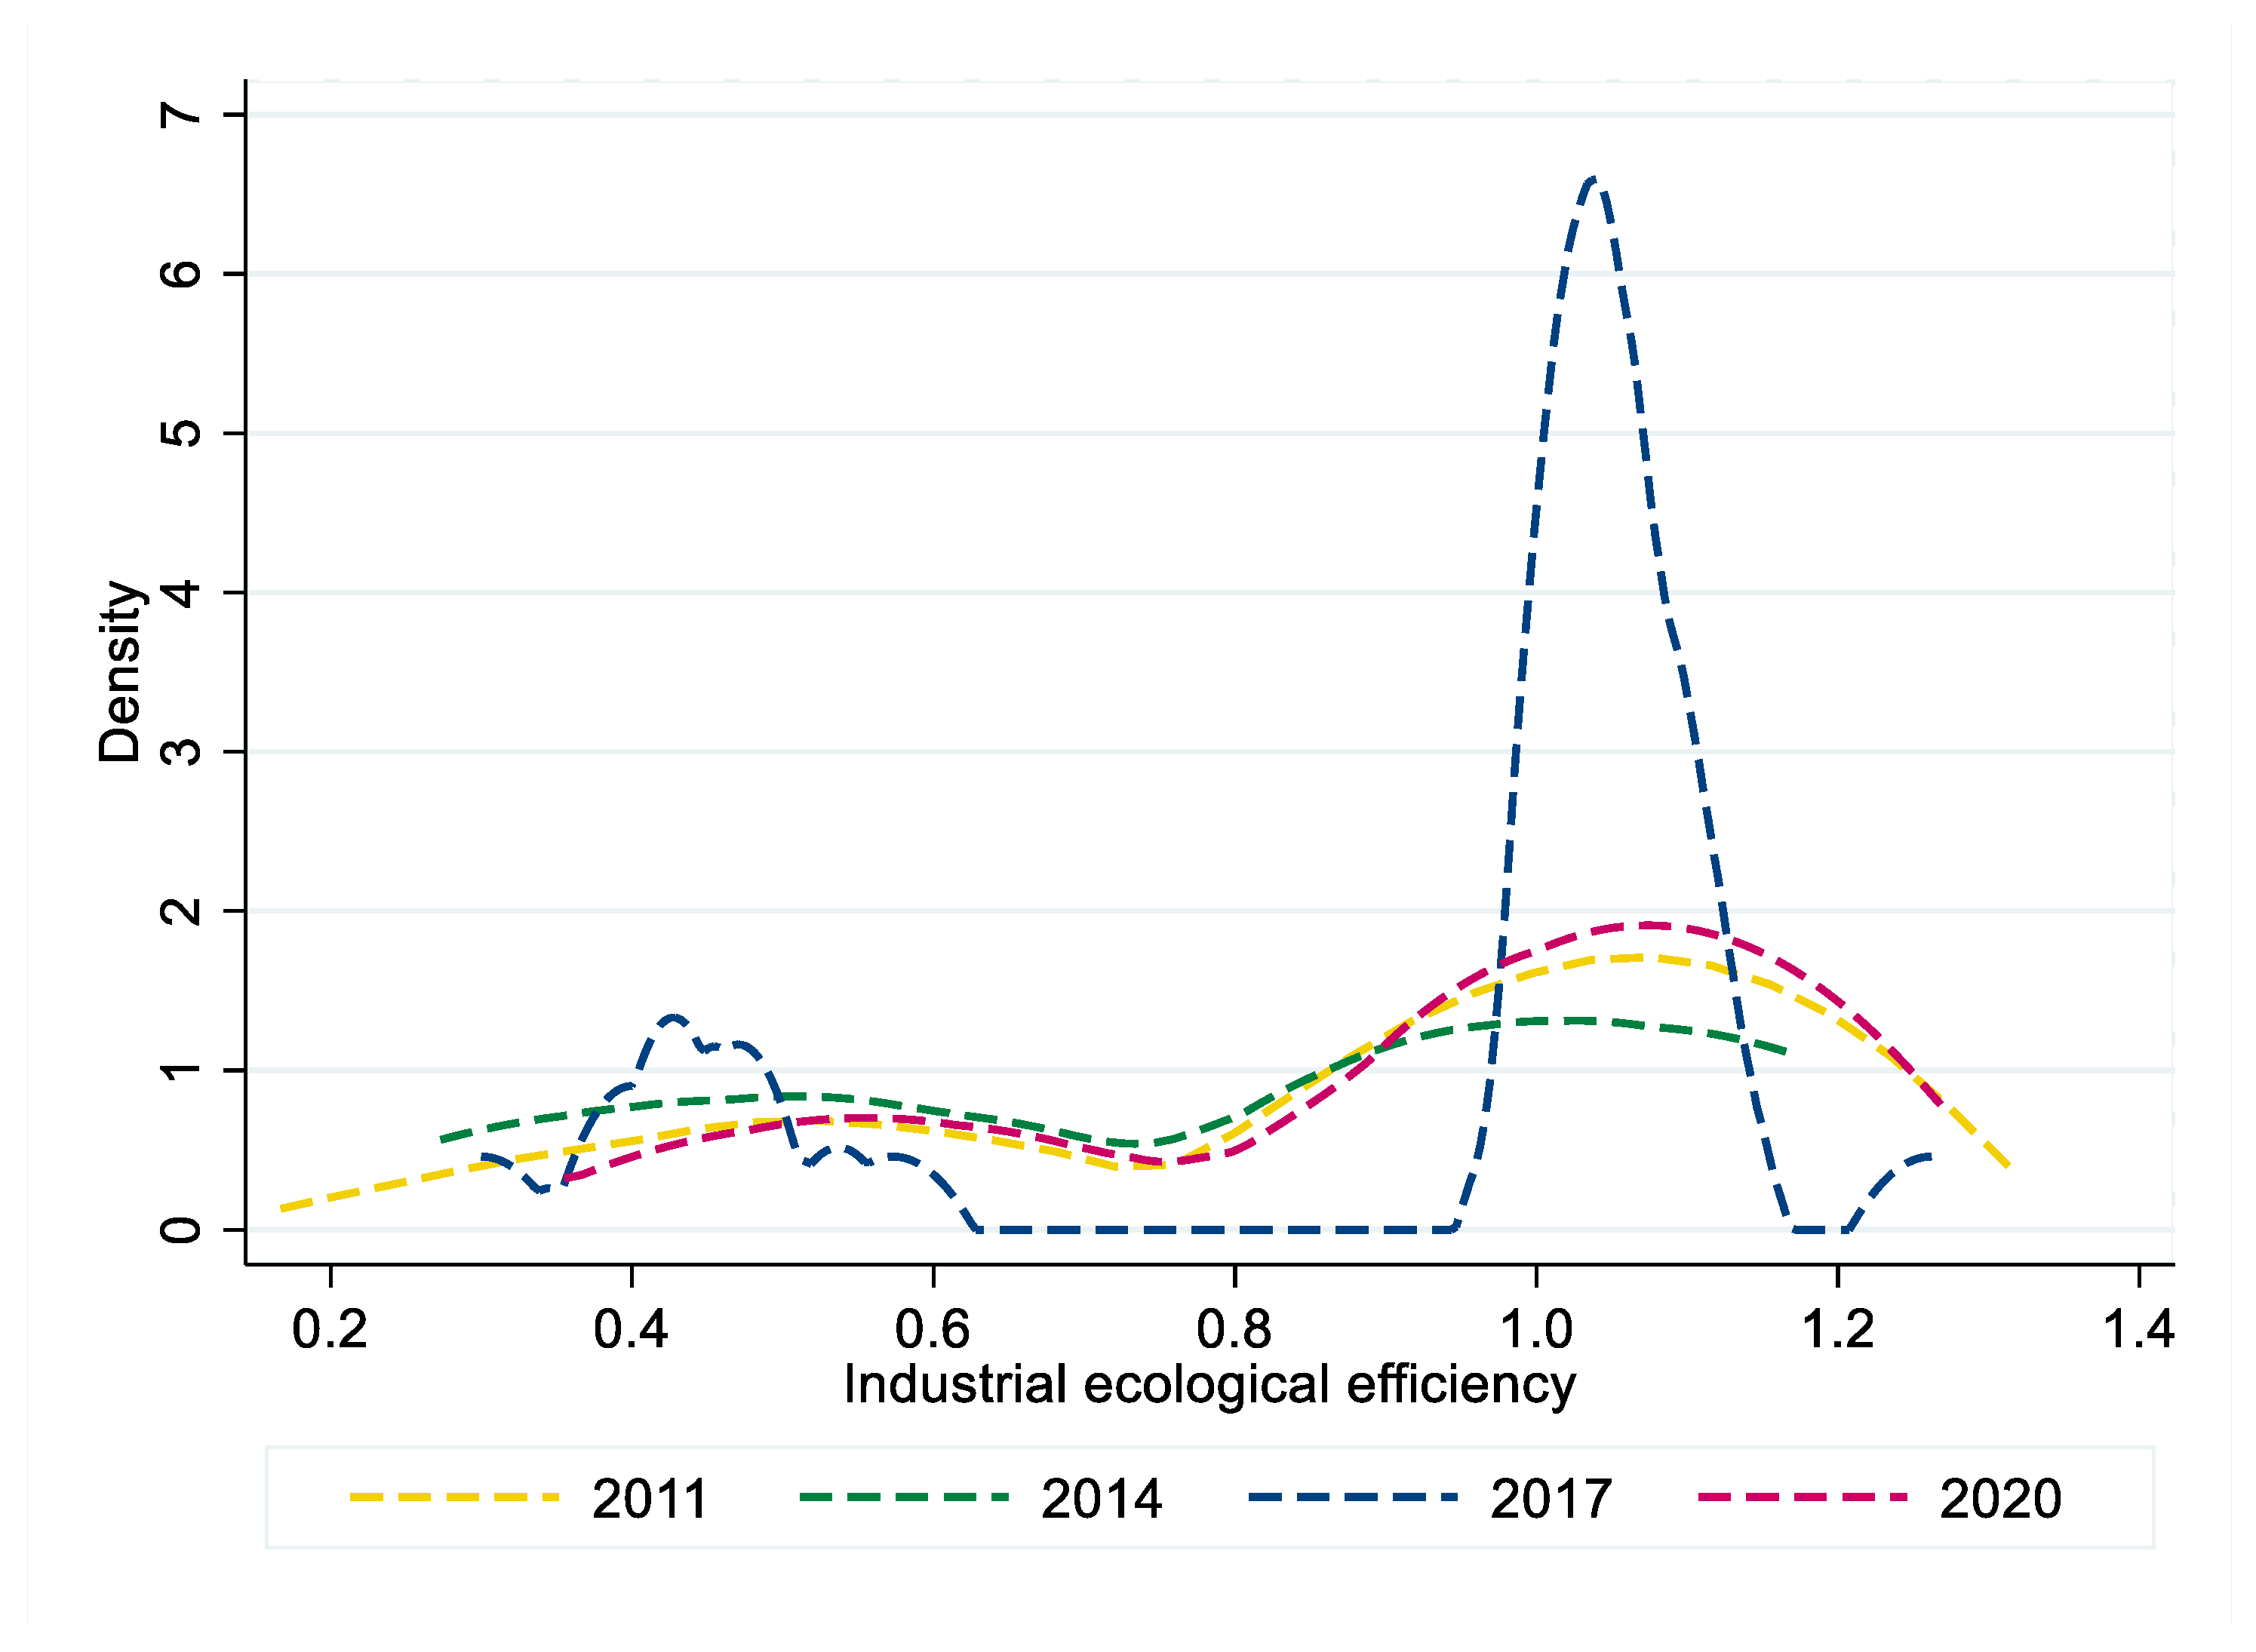
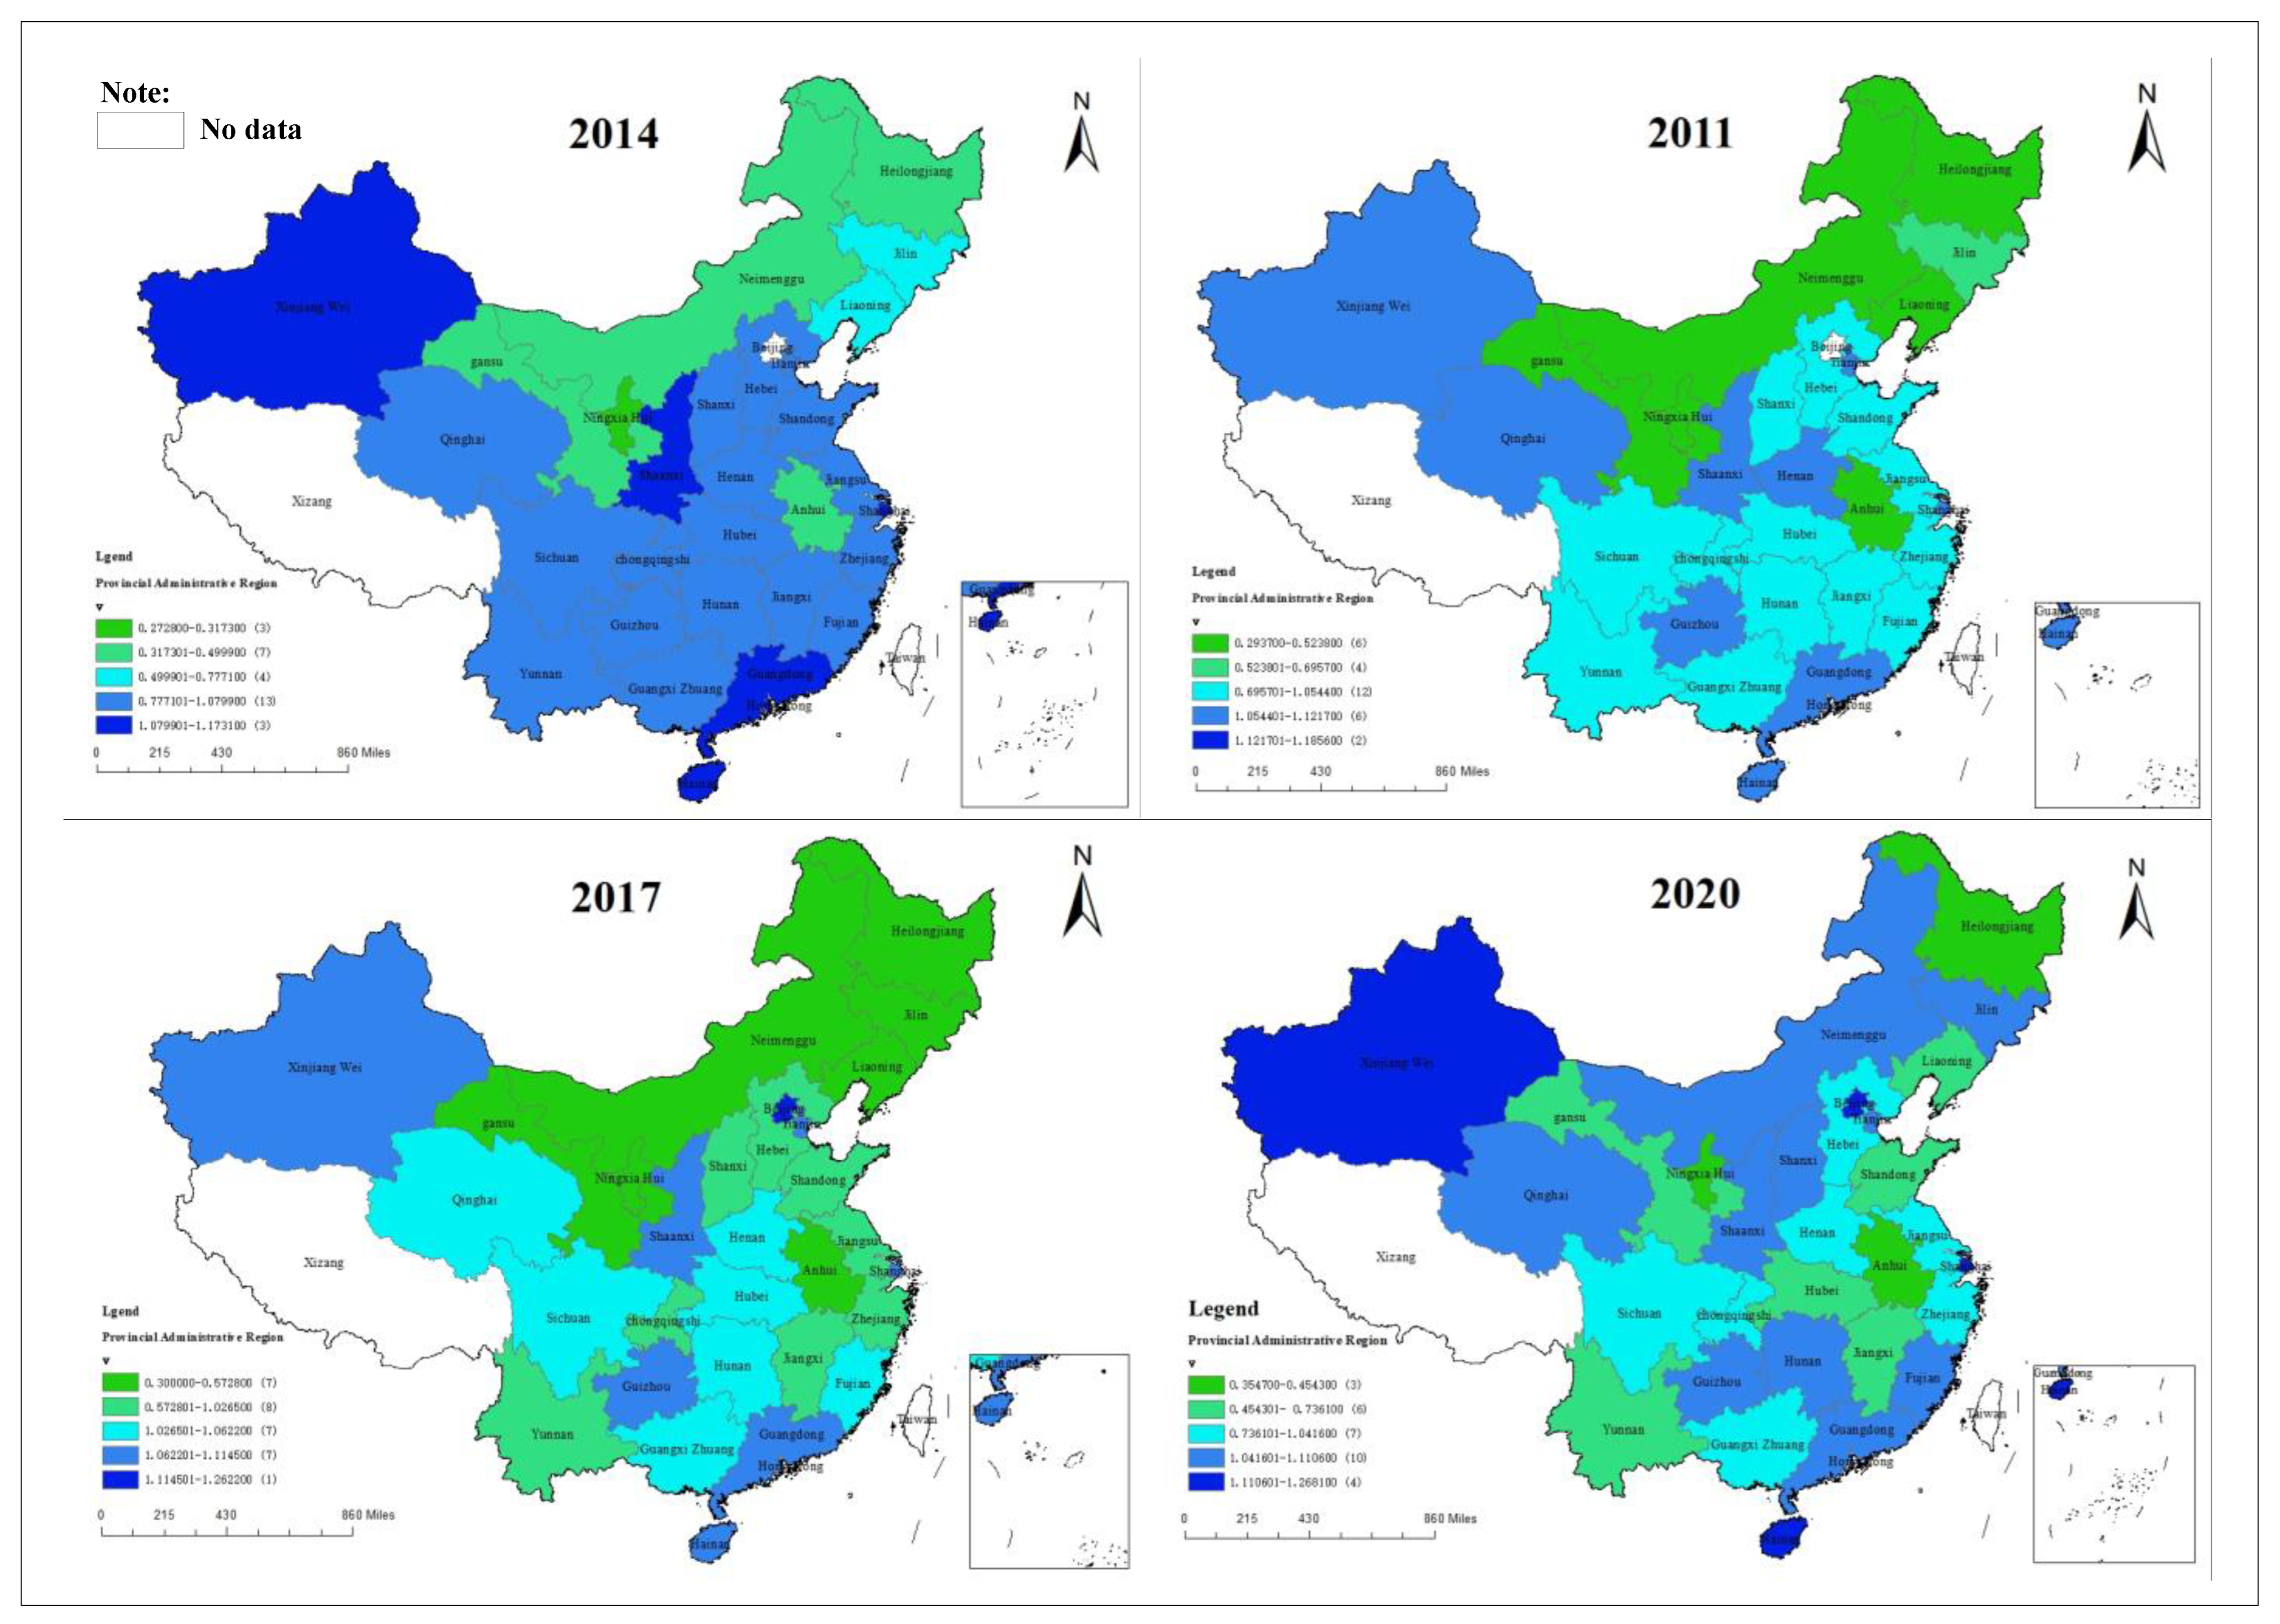
4.2.3. Spatial Characteristics of Industrial Eco-Efficiency in China
5. Discussion and Policy Recommendations
5.1. Discussion
5.2. Policy Recommendations
5.2.1. Improving Industrial Ecological Efficiency in Central China
5.2.2. Narrowing the Gap between Regions
5.2.3. Promote Each Region to Develop Strengths and Mitigate Weaknesses
6. Conclusions
Author Contributions
Funding
Institutional Review Board Statement
Informed Consent Statement
Data Availability Statement
Conflicts of Interest
References
- Velenturf, A.P.M.; Purnell, P. Principles for a Sustainable Circular Economy. Sustain. Prod. Consum. 2021, 27, 1437–1457. [Google Scholar] [CrossRef]
- Mastini, R.; Kallis, G.; Hickel, J. A Green New Deal Without Growth? Ecol. Econ. 2021, 179, 106832. [Google Scholar] [CrossRef]
- Caiado, R.G.G.; de Freitas Dias, R.; Mattos, L.V.; Quelhas, O.L.G.; Filho, W. Towards sustainable development through the perspective of eco-efficiency—A systematic literature review. J. Clean. Prod. 2017, 165, 890–904. [Google Scholar] [CrossRef] [Green Version]
- Xu, L.; Zhao, X.; Chen, J. Exploring the governance dilemma of nuclear wastewater in Fukushima: A tripartite evolutionary game model. Ocean Coast. Manag. 2022, 225, 106220. [Google Scholar] [CrossRef]
- Liu, Z.; Li, W.K.; Tang, J.; Gong, B.G.; Huang, J. Optimal operations of a closed-loop supply chain under a dual regulation. Int. J. Prod. Econ. 2021, 233, 107991. [Google Scholar] [CrossRef]
- Schaltegger, S.; Burritt, R. Contemporary Environmental Accounting: Issues, Concepts and Practice; Greenleaf Publishing: Sheffield, UK, 2000. [Google Scholar]
- Khan, I.S.; Ahmad, M.O.; Majava, J. Industry 4.0 and sustainable development: A systematic mapping of triple bottom line, circular economy and sustainable business models perspectives. J. Clean. Prod. 2021, 297, 126655. [Google Scholar] [CrossRef]
- Nieuwlaar, E.; Warringa, G.; Brink, C.; Vermuelen, W. Supply curves for eco-efficient environmental improvements using different weighting methods. J. Ind. Ecol. 2005, 9, 85–96. [Google Scholar] [CrossRef]
- Zhou, X.D.; Xue, Z.K.; Seydehmet, J. An Empirical study on industrial eco-efficiency in arid resource exploitation region of northwest China. Environ. Sci. Pollut. Res. 2021, 28, 53394–53411. [Google Scholar] [CrossRef]
- Bian, J.; Zhang, Y.; Shuai, C.; Shen, L.; Ren, H.; Wang, Y. Have cities effectively improved ecological well-being performance? Empirical analysis of 278 Chinese cities. J. Clean. Prod. 2020, 245, 118913. [Google Scholar] [CrossRef]
- Robaina-Alves, M.; Moutinho, V.; Macedo, P. A new frontier approach to model the eco-efficiency in European countries. J. Clean. Prod. 2015, 103, 562–573. [Google Scholar] [CrossRef] [Green Version]
- Wang, X.; Ding, H.; Liu, L. Eco-efficiency measurement of industrial sectors in China: A hybrid super-efficiency DEA analysis. J. Clean. Prod. 2019, 229, 53–64. [Google Scholar] [CrossRef]
- Rodriguez, C.M.; Rodas, C.F.R.; Munoz, J.C.C.; Casas, A.F. A multi-criteria approach for comparison of environmental assessment methods in the analysis of the energy efficiency in agricultural production system. J. Clean. Prod. 2019, 228, 1464–1471. [Google Scholar] [CrossRef]
- Zhang, R.-L.; Liu, X.-H. Evaluating ecological efficiency of Chinese industrial enterprise. Renew. Energy 2021, 178, 679–691. [Google Scholar] [CrossRef]
- Huang, M.; Ding, R.J.; Xin, C.H. Impact of technological innovation and industrial-structure upgrades on ecological efficiency in China in terms of spatial spillover and the threshold effect. Integr. Environ. Assess. Manag. 2021, 17, 852–865. [Google Scholar] [CrossRef]
- Zhong, K.Y.; Wang, Y.F.; Pei, J.M.; Tang, S.M.; Han, Z.L. Super efficiency SBM-DEA and neural network for performance evaluation. Inf. Process. Manag. 2021, 58, 102728. [Google Scholar] [CrossRef]
- Ge, X.C.; Xu, J.; Xie, Y.; Guo, X.; Yang, D.Y. Evaluation and dynamic evolution of eco-efficiency of resource-based cities-A case study of typical resource-based cities in China. Sustainability 2021, 13, 6802. [Google Scholar] [CrossRef]
- Zhang, Y.Z.; Zhang, H.; Fu, Y.; Wang, L.W.; Wang, T. Effects of industrial agglomeration and environmental regulation on urban ecological efficiency: Evidence from 269 cities in China. Environ. Sci. Pollut. Res. 2021, 28, 66389–66408. [Google Scholar] [CrossRef]
- Li, Q.C.; Hu, J.; Yu, B.L. Spatiotemporal patterns and influencing mechanism of urban residential energy consumption in China. Energies 2021, 14, 3864. [Google Scholar] [CrossRef]
- Chengyu, L.; Yongmei, Z.; Shiqiang, Z.; Jianmei, W. Applying the super-EBM model and spatial durbin model to examining total-factor ecological efficiency from a multi-dimensional perspective: Evidence from China. Environ. Sci. Pollut. Res. 2022, 29, 2183–2202. [Google Scholar] [CrossRef]
- Zhang, Z. Spatial and temporal evolution characteristics of regional industrial eco efficiency in China in the new era. Inq. Into Econ. Issues 2020, 1, 92–101. [Google Scholar]
- Zheng, W.-L.; Wang, J.-W.; Mao, X.H.; Li, J.-F. Ecological efficiency evaluation and spatiotemporal characteristics analysis of the linkage development of the logistics industry and manufacturing industry. Front. Energy Res. 2022, 9, 709582. [Google Scholar] [CrossRef]
- Jiang, H.L. Spatial-temporal differences of industrial land use efficiency and its influencing factors for China’s central region: Analyzed by SBM Model. Environ. Technol. Innov. 2021, 22, 101489. [Google Scholar] [CrossRef]
- Li, C.Y.; Zhang, S.Q.; Zhang, W. Spatial distribution characteristics and influencing factors of China’s Inter-Provincial industrial eco efficiency. Geogr. Sci. 2018, 38, 1970–1978. [Google Scholar] [CrossRef]
- Dong, F.; Zhang, Y.Q.; Zhang, X.Y. Applying a data envelopment analysis game cross-efficiency model to examining regional ecological efficiency: Evidence from China. J. Clean. Prod. 2020, 267, 122031. [Google Scholar] [CrossRef]
- Chen, C.F.; Sun, Y.W.; Lan, Q.X.; Jiang, F. Impacts of industrial agglomeration on pollution and ecological efficiency-A spatial econometric Aaalysis based on a big panel dataset of China’s 259 Cities. J. Clean. Prod. 2020, 258, 120721. [Google Scholar] [CrossRef]
- Wang, S.J.; Hua, G.H.; Yang, L.Z. Coordinated development of economic growth and ecological efficiency in Jiangsu, China. Environ. Sci. Pollut. Res. 2020, 27, 36664–36676. [Google Scholar] [CrossRef]
- Qin, M.; Sun, M.X.; Li, J. Impact of environmental regulation policy on ecological efficiency in four major urban agglomerations in eastern China. Ecol. Indic. 2021, 130, 108002. [Google Scholar] [CrossRef]
- Li, Q.; Wang, Y.A.; Chen, W.; Li, M.; Fang, X.L. Does improvement of industrial land use efficiency reduce PM2.5 pollution? Evidence from a spatiotemporal analysis of China. Ecol. Indic. 2021, 132, 108333. [Google Scholar] [CrossRef]
- Liu, C.; Gao, M.; Zhu, G.; Zhang, C.; Zhang, P.; Chen, J.; Cai, W. Data driven eco-efficiency evaluation and optimization in industrial production. Energy 2021, 224, 120170. [Google Scholar] [CrossRef]
- Liu, C.; Chen, J.; Cai, W. Data-driven remanufacturability evaluation method of waste parts. IEEE Trans. Industr. Inform. 2021, 18, 4587–4595. [Google Scholar] [CrossRef]
- Liu, C.; Cai, W.; Zhai, M.; Zhu, G.; Zhang, C.; Jiang, Z. Decoupling of wastewater eco-environmental damage and China’s economic development. Sci. Total Environ. 2021, 789, 147980. [Google Scholar] [CrossRef]
- Yang, G.; Fukuyama, H. Measuring the Chinese regional production potential using a generalized capacity utilization indicator. Omega 2018, 76, 112–127. [Google Scholar] [CrossRef]
- Guo, Y.H.; Tong, L.J.; Mei, L. The effect of industrial agglomeration on green development efficiency in Northeast ChinasSince the revitalization. J. Clean. Prod. 2020, 258, 120584. [Google Scholar] [CrossRef]
- Zhu, Q.Y.; Li, X.C.; Li, F.; Wu, J.; Sun, J.S. Analyzing the sustainability of China’s industrial sectors: A data-driven approach with total energy consumption constraint. Ecol. Indic. 2021, 122, 107235. [Google Scholar] [CrossRef]
- Wang, Y.; Hu, H.; Dai, W.J.; Burns, K. Evaluation of industrial green development and industrial green competitiveness: Evidence from Chinese urban agglomerations. Ecol. Indic. 2021, 124, 107371. [Google Scholar] [CrossRef]
- Liu, P.Z.; Zhang, L.Y.; Tarbert, H.; Yan, Z.Y. Analysis on spatio-temporal characteristics and influencing factors of industrial green innovation efficiency-From the perspective of innovation value chain. Sustainability 2022, 14, 342. [Google Scholar] [CrossRef]
- Shao, L.G.; Yu, X.; Feng, C. Evaluating the eco-efficiency of China’s industrial sectors: A two-stage network data envelopment analysis. J. Environ. Manag. 2019, 247, 551–560. [Google Scholar] [CrossRef]
- Li, W.; Xi, Y.Q.; Liu, S.Q.; Li, M.J.; Chen, L.; Wu, X.P.; Zhu, S.P.; Masoud, M. An improved evaluation framework for industrial green development: Considering the underlying conditions. Ecol. Indic. 2020, 112, 106044. [Google Scholar] [CrossRef]
- Han, Y.H.; Zhang, F.; Huang, L.X.; Peng, K.M.; Wang, X.B. Does industrial upgrading promote eco-efficiency? A panel space estimation based on Chinese evidence. Energy Policy 2021, 154, 112286. [Google Scholar] [CrossRef]
- Shi, X.Q.; Wang, X.; Chen, P. A network-based approach for analyzing industrial green transformation: A case study of Beijing, China. J. Clean. Prod. 2021, 317, 128281. [Google Scholar] [CrossRef]
- Yang, Z.; Chen, H.; Du, L.; Lu, W.; Qi, K. Exploring the industrial solid wastes management system: Empirical analysis of forecasting and safeguard mechanisms. J. Environ. Manag. 2021, 279, 111627. [Google Scholar] [CrossRef]
- Guo, Y.H.; Tong, L.J.; Mei, L. Evaluation and influencing factors of industrial pollution in Jilin Restricted Development Zone: A spatial econometric analysis. Sustainability 2021, 13, 4194. [Google Scholar] [CrossRef]
- Wang, X.P.; Song, J.N.; Duan, H.Y.; Wang, X.E. Coupling between energy efficiency and industrial structure: An urban agglomeration case. Energy 2021, 234, 121304. [Google Scholar] [CrossRef]
- Wang, C.N.; Hsu, H.P.; Wang, Y.H.; Nguyen, T.T. Eco-efficiency assessment for some European countries using slacks-based measure data envelopment analysis. Appl. Sci. 2020, 10, 1760. [Google Scholar] [CrossRef] [Green Version]
- Sun, D.L.; Hong, B.T.; Ren, P. Spatiotemporal evolution and driving factors of the rural settlements in the mountain-plain Transitional Zone. Int. J. Agric. Biol. Eng. 2022, 15, 149–155. [Google Scholar] [CrossRef]
- Wang, L.; Cui, Y.F. The spatiotemporal pattern of cultural evolution response to agricultural development and climate change from Yangshao culture to Bronze Age in the Yellow River Basin and surrounding regions, North China. Front. Earth Sci. 2021, 9, 657179. [Google Scholar] [CrossRef]
- Liu, K.; Yang, S.W.; Zhou, Q.; Qiao, Y.R. Spatiotemporal evolution and spatial network analysis of the urban ecological carrying capacity in the Yellow River Basin. Int. J. Environ. Res Public Health 2022, 19, 229. [Google Scholar] [CrossRef]
- Wang, K.Y.; Wu, M.; Sun, Y.; Shi, X.P.; Sun, A.; Zhang, P. Resource abundance, industrial structure, and regional carbon emissions efficiency in China. Resour. Policy. 2019, 60, 203–214. [Google Scholar] [CrossRef]
- Matsumoto, K.; Chen, Y.Y. Industrial eco-efficiency and its determinants in China: A two-stage approach. Ecol. Indic. 2021, 130, 108072. [Google Scholar] [CrossRef]
- Guo, Z.Q.; Tang, S.N.; Wang, D.J.; Zhang, J.Q. Spatial distribution and factors influencing ecological efficiency of the Yellow River Basin in China. Front. Environ. Sci. 2022, 10, 815898. [Google Scholar] [CrossRef]


| Primary | Secondary Index | Tertiary Indicators | Unit | Reference |
|---|---|---|---|---|
| Input | Capital | X1: Total assets of industrial enterprises above the designated size | 10,000 RMB | [34] |
| Labor force | X2: Number of employees in the secondary industry | 10,000 people | [35] | |
| Environment | X3: Completed investment in industrial pollution control | 10,000 RMB | [36] | |
| Research and development | X4: R&D funds for industrial enterprises above the designated size | 10,000 RMB | [37] | |
| Resources | X5: Industrial water | 100 million m3 | [38] | |
| Energy | X6: Total industrial energy consumption | 10,000 tons of standard coal | [39] | |
| Output | Expected output | Y1: Industrial output | 100 million RMB | [40] |
| Unexpected output | Y2: Chemical oxygen demand and discharge of industrial wastewater | Ton | [41] | |
| Y3: Output of general industrial solid waste | 10,000 tons | [42] | ||
| Y4: Industrial sulfur dioxide emissions | Ton | [43] |
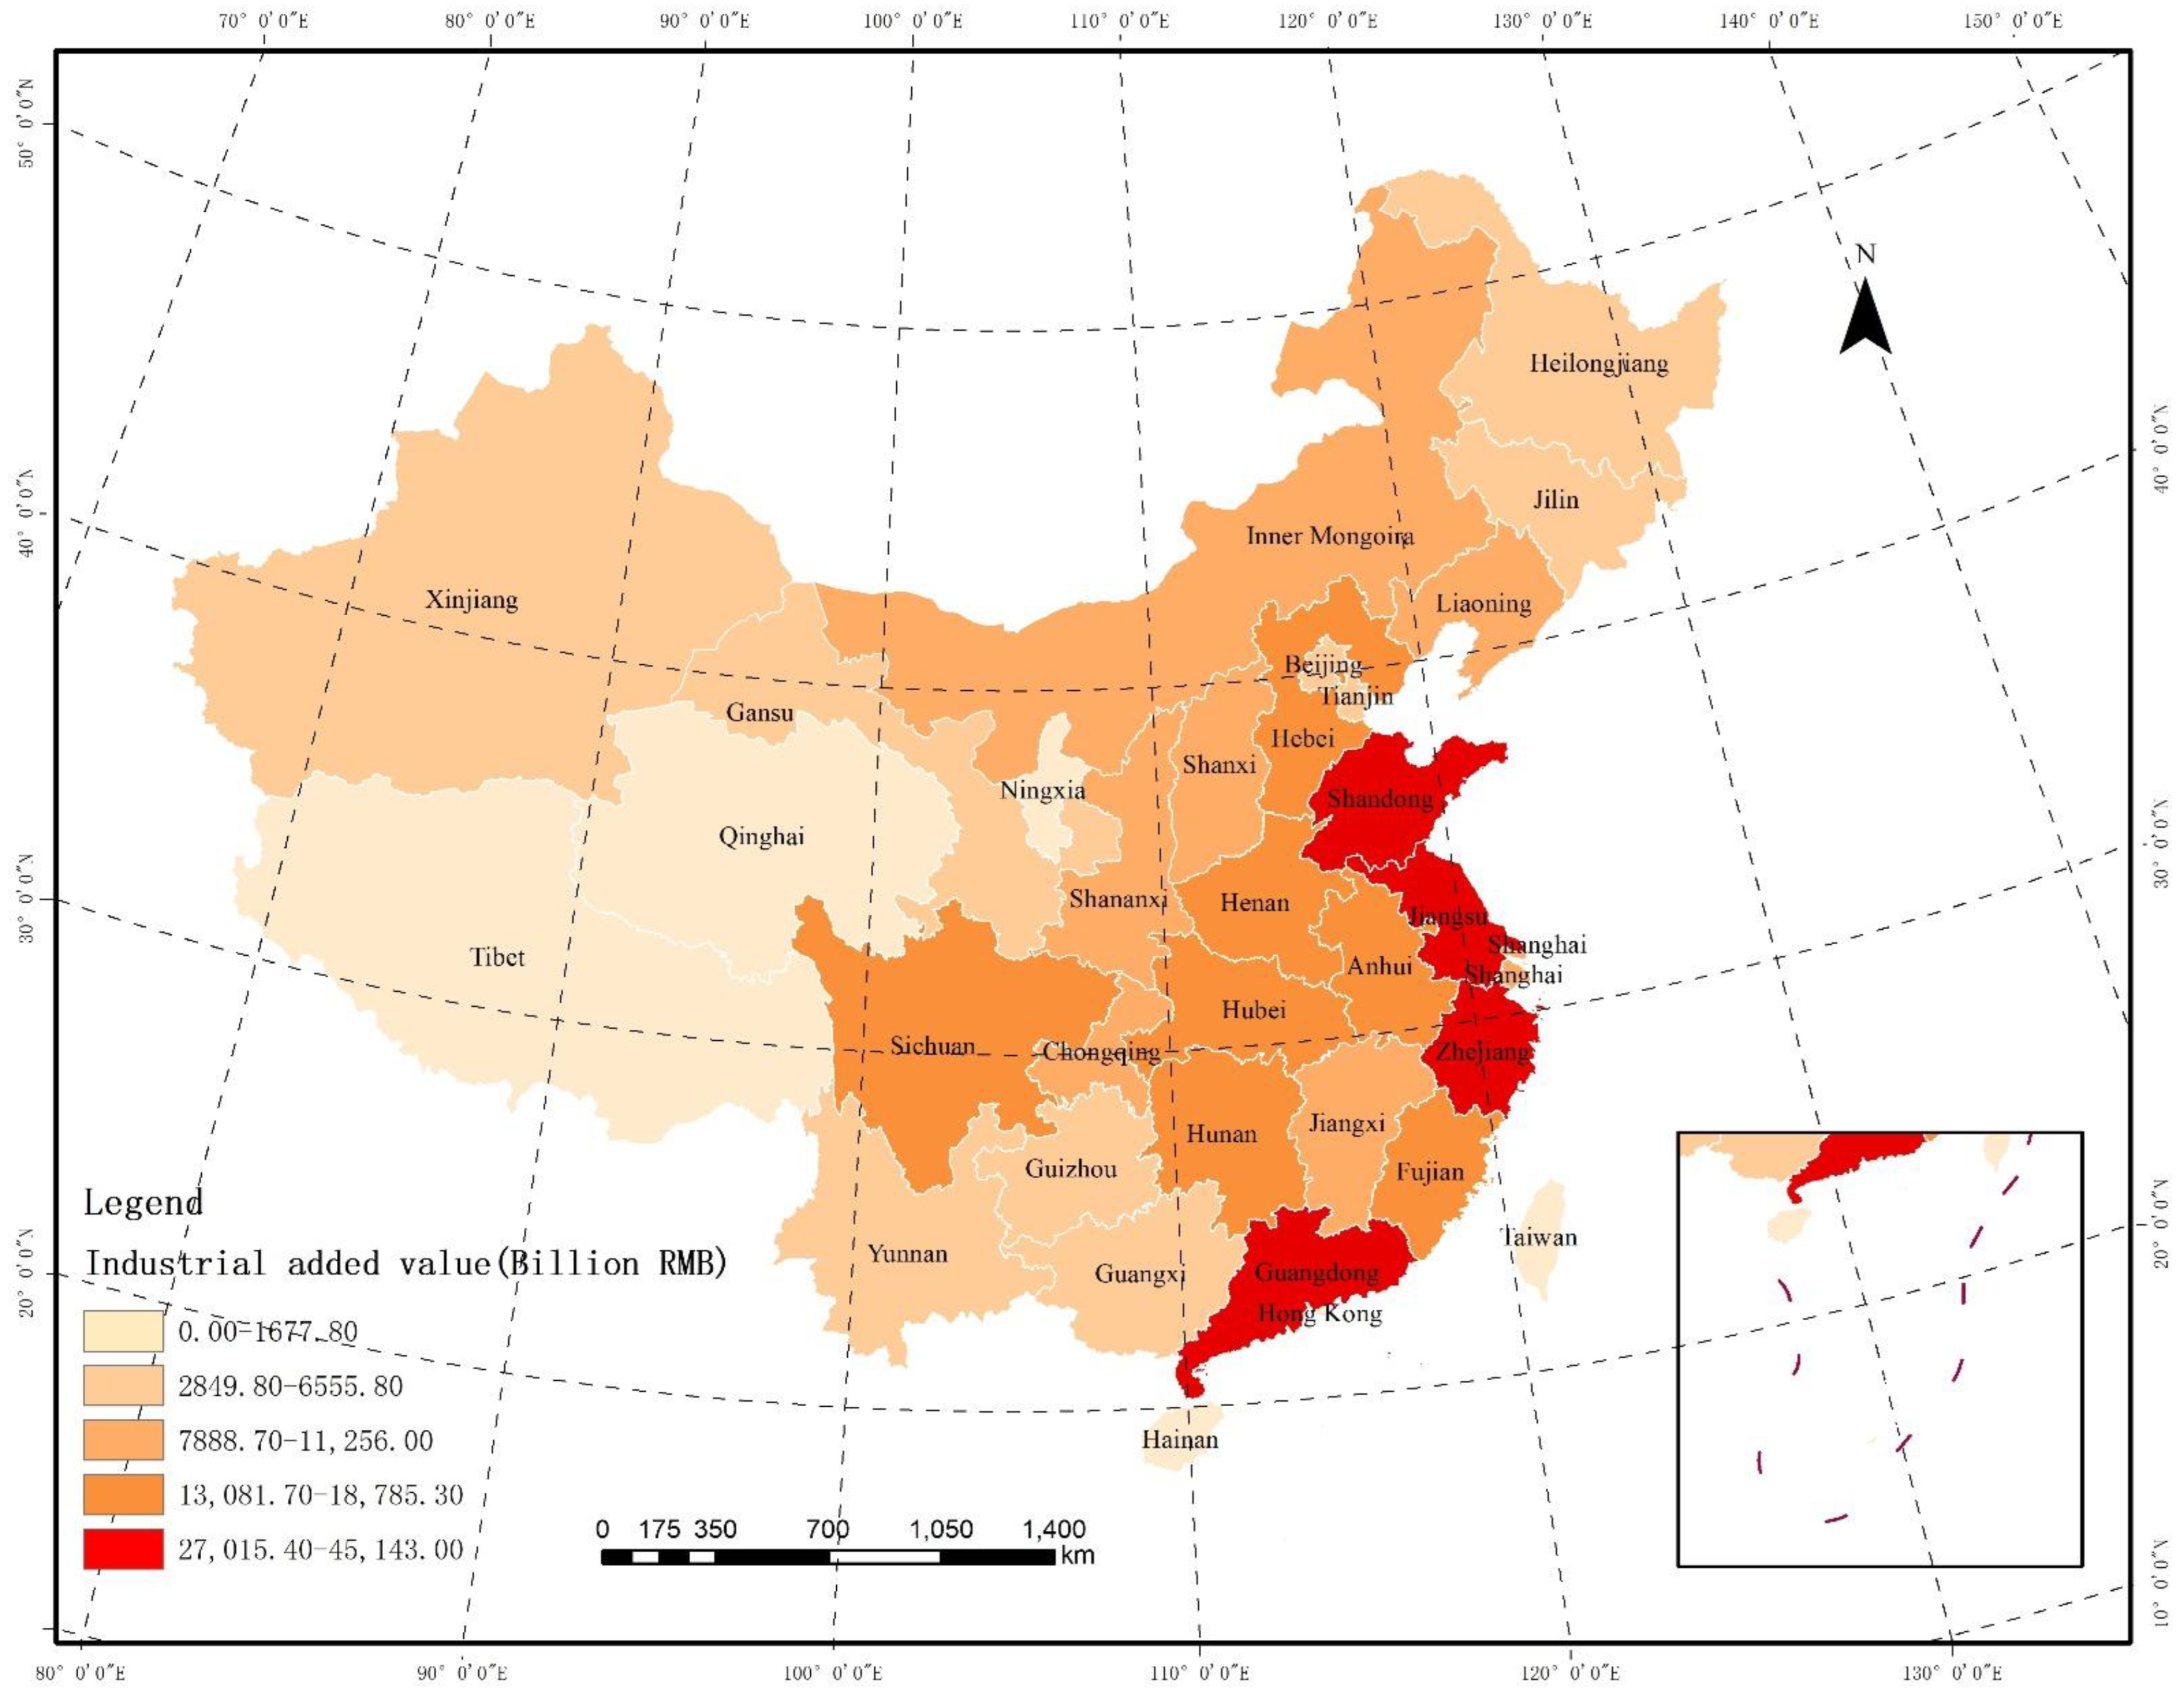
| No. | Region | 2011 | 2012 | 2013 | 2014 | 2015 | 2016 | 2017 | 2018 | 2019 | 2020 | Average | Ranking |
|---|---|---|---|---|---|---|---|---|---|---|---|---|---|
| 1 | Anhui | 0.650 | 0.654 | 0.606 | 0.661 | 0.538 | 0.451 | 0.454 | 0.457 | 0.440 | 0.433 | 0.534 | 27 |
| 2 | Beijing | 1.186 | 1.157 | 1.163 | 1.173 | 1.232 | 1.201 | 1.262 | 1.269 | 1.290 | 1.268 | 1.220 | 1 |
| 3 | Fujian | 1.038 | 1.039 | 1.047 | 1.051 | 1.046 | 1.038 | 1.030 | 1.037 | 1.044 | 1.059 | 1.043 | 8 |
| 4 | Gansu | 0.586 | 0.479 | 0.521 | 0.499 | 0.484 | 0.393 | 0.407 | 0.474 | 0.613 | 0.736 | 0.519 | 28 |
| 5 | Guangdong | 1.122 | 1.085 | 1.097 | 1.107 | 1.132 | 1.129 | 1.092 | 1.076 | 1.079 | 1.075 | 1.099 | 2 |
| 6 | Guangxi | 0.524 | 0.505 | 0.476 | 0.491 | 1.006 | 1.028 | 1.036 | 1.049 | 1.049 | 1.028 | 0.819 | 21 |
| 7 | Guizhou | 0.441 | 0.519 | 0.708 | 1.000 | 1.052 | 1.094 | 1.072 | 1.046 | 1.066 | 1.056 | 0.905 | 16 |
| 8 | Hainan | 1.053 | 1.058 | 1.016 | 0.500 | 1.017 | 1.090 | 1.115 | 1.086 | 1.081 | 1.151 | 1.017 | 11 |
| 9 | Hebei | 1.030 | 1.029 | 0.527 | 0.435 | 0.614 | 1.011 | 1.001 | 0.450 | 0.562 | 1.011 | 0.767 | 23 |
| 10 | Henan | 1.054 | 1.031 | 0.822 | 0.763 | 1.017 | 1.043 | 1.062 | 1.045 | 1.050 | 1.042 | 0.993 | 13 |
| 11 | Heilongjiang | 1.040 | 1.047 | 1.008 | 0.777 | 0.565 | 0.495 | 0.457 | 0.685 | 1.020 | 0.454 | 0.755 | 24 |
| 12 | Hubei | 1.030 | 1.021 | 1.019 | 1.019 | 1.038 | 1.041 | 1.033 | 1.039 | 1.055 | 0.622 | 0.992 | 14 |
| 13 | Hunan | 1.016 | 1.025 | 1.034 | 1.036 | 1.042 | 1.045 | 1.048 | 1.045 | 1.066 | 1.111 | 1.047 | 7 |
| 14 | Jilin | 0.462 | 0.530 | 0.549 | 0.463 | 0.555 | 0.579 | 0.573 | 1.055 | 1.024 | 1.099 | 0.689 | 25 |
| 15 | Jiangsu | 1.023 | 0.709 | 0.669 | 0.708 | 0.766 | 0.743 | 1.015 | 0.613 | 1.005 | 1.000 | 0.825 | 20 |
| 16 | Jiangxi | 1.071 | 1.067 | 1.071 | 1.064 | 1.044 | 1.026 | 1.024 | 0.496 | 0.488 | 0.627 | 0.898 | 17 |
| 17 | Liaoning | 1.021 | 1.021 | 0.564 | 0.453 | 0.602 | 0.494 | 0.501 | 1.017 | 0.571 | 0.544 | 0.679 | 26 |
| 18 | Neimenggu | 0.348 | 0.351 | 0.297 | 0.295 | 0.357 | 0.349 | 0.392 | 0.474 | 0.538 | 1.058 | 0.446 | 29 |
| 19 | Ningxia | 0.446 | 0.343 | 0.300 | 0.273 | 0.339 | 0.282 | 0.300 | 0.269 | 0.317 | 0.355 | 0.322 | 30 |
| 20 | Qinghai | 0.294 | 0.330 | 0.361 | 0.317 | 1.008 | 1.057 | 1.056 | 1.096 | 1.061 | 1.091 | 0.767 | 22 |
| 21 | Shandong | 1.157 | 1.035 | 1.028 | 1.024 | 1.056 | 1.037 | 1.022 | 0.580 | 1.009 | 0.599 | 0.955 | 15 |
| 22 | Shanxi | 1.113 | 0.635 | 0.482 | 0.477 | 1.007 | 0.710 | 1.026 | 1.003 | 1.019 | 1.070 | 0.854 | 19 |
| 23 | Shaanxi | 1.074 | 1.112 | 1.118 | 1.114 | 1.102 | 1.100 | 1.103 | 1.102 | 1.090 | 1.055 | 1.097 | 3 |
| 24 | Shanghai | 1.085 | 1.074 | 1.123 | 1.054 | 1.081 | 1.063 | 1.113 | 1.120 | 1.125 | 1.130 | 1.097 | 4 |
| 25 | Sichuan | 1.033 | 1.055 | 1.072 | 1.053 | 1.076 | 1.057 | 1.032 | 0.805 | 1.037 | 1.007 | 1.023 | 9 |
| 26 | Tianjin | 1.047 | 1.044 | 1.046 | 1.042 | 1.030 | 1.072 | 1.080 | 1.074 | 1.075 | 1.068 | 1.058 | 6 |
| 27 | Xinjiang | 1.099 | 1.084 | 1.054 | 1.066 | 1.056 | 1.055 | 1.084 | 1.075 | 1.098 | 1.131 | 1.080 | 5 |
| 28 | Yunnan | 0.696 | 1.016 | 1.032 | 1.033 | 1.022 | 1.003 | 1.000 | 0.551 | 0.680 | 0.627 | 0.866 | 18 |
| 29 | Zhejiang | 1.025 | 1.013 | 1.014 | 1.011 | 1.018 | 1.030 | 1.021 | 1.023 | 1.033 | 1.023 | 1.021 | 10 |
| 30 | Chongqing | 0.694 | 1.033 | 1.029 | 1.080 | 1.022 | 1.059 | 1.016 | 1.000 | 1.019 | 1.013 | 0.996 | 12 |
| Eastern mean | 1.071 | 1.024 | 0.936 | 0.869 | 0.963 | 0.991 | 1.023 | 0.940 | 0.989 | 0.994 | 0.980 | - | |
| Central mean | 0.930 | 0.876 | 0.824 | 0.783 | 0.851 | 0.799 | 0.835 | 0.853 | 0.895 | 0.807 | 0.845 | - | |
| Western mean | 0.658 | 0.711 | 0.725 | 0.747 | 0.866 | 0.862 | 0.863 | 0.813 | 0.870 | 0.923 | 0.804 | - | |
| National average | 0.882 | 0.870 | 0.828 | 0.801 | 0.897 | 0.893 | 0.914 | 0.870 | 0.920 | 0.918 | 0.879 | - | |
| DMU | Score | X1 | X2 | X3 | X4 | X5 | X6 | Y1 | Y2 | Y3 | Y4 |
|---|---|---|---|---|---|---|---|---|---|---|---|
| 01 | 0.433 | −13,630 | −503 | −117,081 | −1,595,708 | −51 | −3152 | 0 | −2262 | −9664 | −60,544 |
| 04 | 0.736 | −1352 | −95 | 0 | 0 | 0 | −2285 | 0 | 0 | −1190 | −23,144 |
| 11 | 0.454 | −1820 | −76 | −33,616 | −82,324 | −10 | −2097 | 0 | −12,884 | −2600 | −42,990 |
| 12 | 0.622 | −6118 | −208 | −62,046 | 0 | −44 | −1566 | 0 | −6307 | −4377 | −6501 |
| 16 | 0.627 | 0 | −327 | −7500 | 0 | −26 | −402 | 0 | −6766 | −6774 | −30,174 |
| 17 | 0.544 | −13,060 | 0 | −17,100 | 0 | 0 | −9896 | 0 | −5009 | −20,180 | −115,284 |
| 19 | 0.355 | −4800 | −16 | −31,315 | −52,279 | −3 | −6862 | 0 | −1726 | −4880 | −58,297 |
| 21 | 0.599 | 0 | −419 | −176,929 | −2,774,281 | 0 | −6704 | 0 | −28,569 | −10,341 | −84,207 |
| 28 | 0.627 | 0 | −162 | −69,250 | 0 | −2 | −3554 | 0 | 0 | −9686 | −62,148 |
Publisher’s Note: MDPI stays neutral with regard to jurisdictional claims in published maps and institutional affiliations. |
© 2022 by the authors. Licensee MDPI, Basel, Switzerland. This article is an open access article distributed under the terms and conditions of the Creative Commons Attribution (CC BY) license (https://creativecommons.org/licenses/by/4.0/).
Share and Cite
Liu, F.; Zhou, S.; Yang, Y.; Liu, C. Research on Industrial Ecological Efficiency Evaluation and Improvement Countermeasures Based on Data-Driven Evaluations from 30 Provinces and Cities in China. Sustainability 2022, 14, 8665. https://doi.org/10.3390/su14148665
Liu F, Zhou S, Yang Y, Liu C. Research on Industrial Ecological Efficiency Evaluation and Improvement Countermeasures Based on Data-Driven Evaluations from 30 Provinces and Cities in China. Sustainability. 2022; 14(14):8665. https://doi.org/10.3390/su14148665
Chicago/Turabian StyleLiu, Fan, Shuling Zhou, Yaliu Yang, and Conghu Liu. 2022. "Research on Industrial Ecological Efficiency Evaluation and Improvement Countermeasures Based on Data-Driven Evaluations from 30 Provinces and Cities in China" Sustainability 14, no. 14: 8665. https://doi.org/10.3390/su14148665
APA StyleLiu, F., Zhou, S., Yang, Y., & Liu, C. (2022). Research on Industrial Ecological Efficiency Evaluation and Improvement Countermeasures Based on Data-Driven Evaluations from 30 Provinces and Cities in China. Sustainability, 14(14), 8665. https://doi.org/10.3390/su14148665