Article

Dynamic Influence of Network Public Opinions on Price Fluctuation of Small Agricultural Products Based on NLP-TVP-VAR Model—Taking Garlic as an Example

1
College of Engineering, Northeast Agricultural University, Harbin 150030, China
2
College of Arts and Sciences, Northeast Agricultural University, Harbin 150030, China
*
Author to whom correspondence should be addressed.
Sustainability 2022, 14(14), 8637; https://doi.org/10.3390/su14148637
Submission received: 20 June 2022 / Revised: 9 July 2022 / Accepted: 13 July 2022 / Published: 14 July 2022
(This article belongs to the Section Economic and Business Aspects of Sustainability)

Abstract

:
In recent years, the price of small agricultural products has both plummeted and skyrocketed, which has a great impact on people’s lives. Studying the factors affecting the price fluctuation of small agricultural products is of great significance for stabilizing their price. With the development and application of social media, farmers and consumers are more greatly influenced by online public opinion, resulting in irrational planting behavior or purchasing behavior, which has a complex impact on the price of small agricultural products. Taking garlic as an example, we crawled through network public opinions about garlic price from January 2015 to December 2020 using web crawler technology. Then, the network public opinions were quantified using a natural language processing and time-varying parameter vector autoregression (NLP-TVP-VAR) model to empirically analyze their dynamic influence on garlic price fluctuation. It was found that both public attitude and public attention have a short-term influence on garlic price fluctuation, and the influences of each differ according to direction, intensity and timing. The influence of public attitude on garlic price fluctuation is positive, while the influence of public attention on garlic price fluctuation is largely negative. The influence intensity of public attitude is stronger than of public attention on garlic price fluctuation. The influence of public attitude on garlic price fluctuation shows a trend of intensifying, while that of public attention has been weaker than in previous years. In addition, based on the results of our study, we present some recommendations for improving the comprehensive information platform and price fluctuation early warning system for the whole industry chain of small agricultural products.

1. Introduction

Agriculture is the basic industry of social development, and agricultural products are the primary guarantee and prerequisite for human life and production; thus, the price of agricultural products has always been a key concern of state and society [1]. In China, with the upgrading of residents’ consumption structure and the continuous adjustment of the agricultural cultivation structure, the economic value of small agricultural products is increasing. The prices of small agricultural products directly impact the national economy and quality of residents’ lives [2]. For example, garlic price plummeted to ¥1.31/kg in May 2008 and skyrocketed to ¥14.98/kg in May 2017. Similarly, the price of ginger plummeted to ¥2.47/kg in June 2007 and skyrocketed to ¥16.64/kg in October 2014. Such drastic price fluctuations seriously affect the normal consumption patterns of residents and is prone to systemic risks [3]. There are many reasons resulting in the aforementioned phenomenon. Firstly, small agricultural products are characterized by significant seasonality, aggregation and asymmetry, which has a certain impact on price fluctuation [4,5]. Secondly, the volume of yield, market demand, trade and distribution are small, and the production areas are concentrated, which makes the price vulnerable to disruptions from external factors [6]. Finally, when the existing management cannot keep pace with developments in the current era, the scale, standardization, branding and informatization of production are relatively low, and the price is unable to respond to emergencies in a timely manner [7]. It can be seen that, in addition to being influenced by their own factors, there is a greater likelihood of interference in the price of small agricultural products due to external factors, especially with the progress of times and the development of technology, and the influencing factors are thus becoming increasingly diversified, and their contribution to small agricultural product prices is increasing. Therefore, it is important to analyze the factors influencing small agricultural product prices toward stabilizing small agricultural product prices and increasing farmers’ income.
At present, social media platforms, such as Sina Weibo, WeChat and online forums, play an important role in people’s lives. On the one hand, people can express their opinions or ideas through social media anytime, anywhere. On the other hand, our own opinions or decisions can be influenced by other’s sentiments [8]. According to social identity theory [9], when an opinion or a behavior is accepted by most people, individual behavior can be influenced by group behavior within the same social group, or the so-called “herd effect”. Furthermore, according to the theory of planned behavior [10], when someone publishes opinions with strong sentiments on the social media, others seem more easily influenced, resulting in irrational decisions being made. Conversely, the herd and strong sentiment effects are potentially useful for farmers when making decisions related to the price of small agricultural product and the planting area for next season. On the one hand, since farmers may be influenced by other people’s opinions on fixing small agricultural product price and the planting area for next season expressed on the social media, they make decisions that are aligned with other people’s opinions. On the other hand, since farmers easily trust opinions reflecting obviously polarized attitudes on social media, they make decisions aligned with these sentiments. Decisions made by farms in the case of the herd and strong sentiment effects result in price fluctuation of small agricultural products. For example, the mung bean price skyrocketed in 2010 because most people believed that mung bean could cure all diseases after a health expert published a book about the advantages of mung bean [11]. Furthermore, the extreme public panic caused by the African swine fever in 2018 led to plummeting pork prices [12]. Therefore, by analyzing the public attitude and attention to the fluctuation of small agricultural product prices, we can understand the farmers’ planting willingness and consumers’ purchase intention, which can be used in predicting trends in small agricultural product prices.
China is the largest garlic grower, consumer and exporter in the world, and the garlic industry plays an important role in China’s agricultural industry [13]. However, in the process of development of the garlic industry, a serious event occurred due to the lack of attention to network public opinions, called “Cangshan Garlic” [14], which resulted in serious damage to the entire garlic industry as well as the image of government and social security. With the continuous improvement of agricultural informatization construction in China, the Ministry of Agriculture and Rural Affairs issued the Agricultural and Rural Big Data Pilot Program in 2016 and actively carried out a big data pilot study of eight important agricultural products, including garlic [15]. However, since the existing management cannot keep pace with developments in the current era and the scale, standardization, branding and informatization of production are relatively low, garlic prices are still plummeting and skyrocketing. Therefore, this paper taking garlic as an example, explored the influences of network public opinions on garlic prices.
Equilibrium price theory states that the interactions between basic demand and supply market forces are the main driving forces determining small agricultural market equilibrium and agricultural price fluctuations [16]. In the garlic market, the influences of public attitude and attention on garlic price fluctuation act mainly through changing supply and demand. The network public opinions contain a lot of information, among which the most important is public attitude and public attention [17]. Public attitude and attention, to an extent, influence farmers’ willingness to plant garlic, causing the relationship between supply and demand in the garlic market to change and thus affect garlic price. When the public attitude toward garlic prices shows positive tendencies, farmers will choose to raise the price of garlic and tend to plant more garlic. The more attention this positive sentiment receives will, on the one hand, make farmers more willing to plant garlic, which increases the garlic supply; on the other hand, consumers will choose to buy other alternative small agricultural products because the garlic price is too high. When the supply of garlic in the market exceeds the demand, the price of garlic will decline. When the public attitude about garlic prices turns negative, farmers would prefer to reduce the garlic price to sell out their stock and be less willing to plant garlic. The more attention this negative sentiment receives, the more unwilling farmers will be to plant garlic, and the garlic supply will decline. When the market supply of garlic is less than demand, garlic prices will rise. Therefore, this paper proposes the following hypotheses:
H1. 
Public attitudes have a short-term promoting effect on price fluctuations.
H2. 
Public attentions have a short-term inhibitory effect on garlic price fluctuation.
This study aims to examine the influence of network public opinions on the price fluctuation of small agricultural products. Taking garlic as an example, the influences of public attention and public attitude on garlic price fluctuation were studied and discussed. However, how to quantify the public attitude and public attention and construct relevant indicators reasonably is the main challenge of this study, which directly affects the estimation and analysis of subsequent model.
The main contribution of this paper is to propose a two-stage method, including a natural language processing and time-varying parameter vector autoregression (NLP-TVP-VAR) model to quantitative the public attention and public attitude, and analyze the dynamic impact of network public opinions on garlic price fluctuation. Firstly, this paper crawls the network public opinions, including examining the content of posts about garlic (such as price, international trade volume and weather, etc.), number of views and post time, etc., from garlic forums using crawler technology to construct a dataset on public opinions about garlic. In the first stage of NLP-TVP-VAR, this paper classifies polarity sentiment of network public opinions on garlic using sentiment analysis, and the result on polarity sentiment labels is then used to construct the sentiment indicators. The procedure can be divided into three steps: (a) segmentation of network public opinion on garlic into several words using a natural language processing and information retrieval (NLPIR) big data analysis platform; (b) sentiment classification based on new sentiment lexicon and SVM; and (c) construction of sentiment indicators for public attention and public attitude. Public attention is constructed according to the number of views, which is called Read, and public attitude is constructed according to the number of positive sentiment posts and the number of negative sentiment posts, which is called BI. In the second stage of NLP-TVP-VAR, this paper uses TVP-VAR model, together with the garlic price and sentiment indicators, to analyze the dynamic influence of network public opinions (including public attention and public attitude) on garlic price fluctuation. The procedure mainly includes two steps: (a) A Markov chain Monte Carlo (MCMC) algorithm is used to estimate the time-varying parameters in terms of unobserved latent variables. (b) Impulse response analysis is used to examine the dynamic relationship between public attention, public attitude and garlic price fluctuation. Finally, the influences of public attention and attitude on the garlic price are assessed. These results can assist the government and relevant departments in guiding and developing online public opinion in a positive direction toward controlling the prices of small agricultural products and stabilizing small agricultural product markets.
The rest of the paper is structured as follows: Section 2 reviews the literature on the main factors influencing agricultural product price fluctuation, methods of sentiment analysis, and the relationship between network public opinions and market prices. Section 3 delineates the research variables and methodology issues, which include the consideration of web crawler technology, natural language processing techniques and autoregressive models. Section 4 introduces the NLP results and discusses the dynamic influence of garlic network public opinions on garlic price based on TVP-VAR. Conclusions and suggestions to keep the price of small agricultural products stable are provided in Section 5. Section 6 details the research limitations and future research directions.

2. Literature Review

2.1. Factors Influencing Agricultural Product Price Fluctuation

As small agricultural products have obvious characteristics, such as being seasonal, having a concentrated origin, easy storage, etc., their prices are vulnerable to influence by the external environment, leading to frequently appearance of skyrocketing and plummeting phenomena [18,19]. The price fluctuations of small agricultural products are mainly influenced by several factors, such as supply and demand [20,21], climate [22] and international macroeconomic factors [23], etc. Considering supply and demand, Hassan [24] found that supply logistic was the main factor influencing vegetable price fluctuation. Liu [25] pointed out that inventory has a certain impact on the ginger price. From the viewpoint of climate, Deressal [26] suggest there is a certain relationship between climate and agricultural product output, which causes agricultural product prices to be influenced. Yuan [27] demonstrated that climate is the main factor influencing the price of perishable agricultural products. In the view of international macroeconomic factors, Benavides [28] found that the exchange rate is the main factor influencing the price of agricultural products. The research of Westcoot [29] and Wu [30] showed that the international energy market is highly correlated with the agricultural product market in China. In addition, many studies have shown that inflation, domestic future price and money supply exacerbate abnormal price fluctuations of agricultural products [1,31]. The results from studies on the influencing factors of small agricultural products price are in accordance with those from previous social economy studies, and the collection of historic data has a lagging nature.
However, these influences were found based on the environment of social economy at the particular time, and with the change in economic environment, the main influences also change. Furthermore, since collecting historic data of conventional influencing factors has a certain lagging nature, results on the analysis of price fluctuations of small agricultural product based on the use of conventional influencing factors are also relatively lagging and do not reflect real-time performance. When emergency situations occur, the analysis of prices based on the historic data of previous conventional influencing factors cannot produce accurate results; thus, the market is not flexible in dealing with emergencies, and prices will skyrocket and plummet.

2.2. Methods of Sentiment Analysis

Sentiment analysis, also known as opinion mining, is a fundamental task in natural language processing (NLP) that involves the process of analyzing, processing, generalizing and reasoning network public opinions. Sentiment analysis has a wide range of application in domains such as the financial [32], e-commerce [33,34] and assessment teaching quality [35] domains, among others. The main methods of sentiment analysis are based on a sentiment lexicon, which in turn is based on deep learning, a subset of machine learning. Sentiment analysis methods based on sentiment lexicon refer to the division of sentiment polarity at different granularities based on the sentiment polarity of sentiment words provided by different sentiment lexicons. Yekrangi [36] and Beigi [37] constructed domain sentiment lexicons based on building upon the basic sentiment lexicon, which could effectively identify and extend on sentiment words in the corpus and improve the classification effect of the domain dataset. Machine-learning-based sentiment analysis methods refer to feature extraction and sentiment classification using machine learning methods with a large amount of annotated corpus information. Go and Bhayani [38] proposed using a supervised learning method to classify sentiment reviews as positive or negative when extracted from Twitter using naive Bayes, maximum entropy and SVM analysis algorithms, and the experiment showed 80% analysis accuracy. Deep-learning-based sentiment analysis methods are able to actively learn text features and learn semantic information in text based on deep network models to achieve sentiment classification [39]. Dashtipour et al. [40] automatically mined relevant features in text information for sentiment classification by convolutional neural network and LSTM model. Gopalakrishnan et al. [41] performed sentiment analysis on Twitter datasets by constructing an LSTM model with optimal parameters, and satisfactory sentiment classification performance was achieved.
However, it can be seen from the above literature analysis that most of the existing sentiment lexicons are manually constructed, which requires a lot of human and material resources, so machine-learning-based methods do not make full use of the contextual information of the contextual text, and deep-learning-based methods require large amounts of data to support them and are not suitable for small datasets.

2.3. Relationship between Network Public Opinions and Market Price Behavior

The majority of research on the relationship between network public opinions and market prices has focused on financial markets. Strau et al. [42] used the Granger causality test to study the relationships between the emotions in Dutch newspaper articles and stock market prices and found that negative emotions better reflected stock market trends. Derakhshan et al. [43] improved the accuracy of stock price predictions by building a new stock prediction system that combined technical stock price indicators and the sentiments expressed in news articles. In addition, there are some studies on the sentiment influences on agricultural market price behaviors. Hassouneh et al. [44] developed an avian influenza food panic information index to analyze the impact of the avian influenza epidemic on vertical poultry prices in Egypt. Chen et al. [45] calculated the positive and negative emotional tendency values on social networks based on CNN and tested the Granger causality between emotions and vegetable prices. Hsl et al. [46] analyzed the relationships between African swine fever (ASF) and meat prices based on a TVP-VAR model, and the results showed that there were some differences in the impact size, direction and duration of ASF on the prices of pork, chicken, beef and mutton. Liu et al. [47] quantified online negative sentiment using microblog text mining and the results of SVM as the sentiment value, which was then used to empirically analyze the dynamic impact of negative public emotions on agricultural product prices during the COVID-19 pandemic in China.
However, some common problems are encountered in the aforementioned studies. First of all, the public sentiment index in the abovementioned literature was not constructed according to public speech, so it cannot adequately reflect the real sentiment of public attitude. Second, only public attitude, and not public attention, was considered as an influencing factor of price fluctuation. Finally, many scholars only analyzed the influence of network public opinion on market price for a specific event and did not discuss the influence of network public opinions as a separate influencing factor.
Therefore, this paper tried to combine the natural language processing technology (NLP) and time-varying parameter vector autoregression (TVP-VAR) model to reasonably and objectively construct the indicators of public attention and public attitude, and investigate the time-varying relationship of public attitude and public attention on garlic price fluctuation. This study analyses the dynamic influence of public attention and public attitude on the price fluctuation of small agricultural products from the perspective of network public opinions, which enriches the influencing factors of small agricultural product price fluctuation, fills the gap of influence of public attention on price fluctuation and provides new ideas for the prediction and early warning of price fluctuation of small agricultural products.

3. Materials and Methods

3.1. Overview

This paper takes garlic as an example; the research approach is grounded on web crawler technology and a natural language processing technology (NLP) and time-varying parameter vector autoregression (TVP-VAR) model. Firstly, web crawler technology was used to obtain the data for network public opinions about garlic price fluctuation from garlic forums, and the content of posts and number of views were extracted as the source for construction of public attitude and public attention indices. Then, on the one hand, sentiment analysis was conducted, and the number of monthly positive and negative sentiment content of posts calculated, and the time series of BI was developed as Formula (3). On the other hand, the monthly number of views was calculated, and the time series of Read was developed as Formula (2). At the same time, the garlic market price data of the whole country were processed using Formula (1) to develop a basic time series of garlic price. Finally, before model estimation, a unit root test was conducted on the time series of BI, Read and R. To ensure time series stability, a model optimal lag order was selected, and the TVP-VAR model was used to analyze the time-varying influence of network public opinions on garlic price fluctuation. Figure 1 shows a flowchart of the experimental methods, and each method will be introduced in following section.

3.2. Research Variables

3.2.1. Garlic Price Dataset

Data on garlic prices were obtained from the Business Forecast website (http://cif.mofcom.gov.cn) (accessed on 27 August 2021). Business Forecast is a comprehensive information release platform of the Ministry of Commerce for domestic trade statistics monitoring and industry management. Thus, there is no doubt regarding the accuracy and comprehensiveness of the data. Therefore, we obtained the weekly garlic prices from the Business Forecast website and determined the time range to obtain the garlic price data for the six years from 2015 to 2020. Since the garlic price is to be standardized and averaged afterwards, the monthly average price was used as the garlic price for the month. In order to calculate this conveniently, the rate of garlic price volatility was defined, as shown in Formula (1).
R = ln P t ln P t 1
Here, P t and P t 1 represent the prices in months t and t − 1, respectively.

3.2.2. Network Public Opinion Datasets

(1)
Data acquisition
Although there are many carriers related to the topic of garlic prices on the Internet, in order to ensure the authority and authenticity of corpus, the selected website must meet the following requirements: (1) The website should focus on agriculture. (2) The amount of information should be relatively large and reflect the real fundamentals more comprehensively. (3) The time series should be complete to allow for prediction research with a wide range of time periods, so as to obtain a general conclusion. (4) The website should be influential enough to have some impact on price fluctuations. Based on the above four factors, this paper chose International Garlic Forum (http://bbs.51garlic.com) (accessed on 27 August 2021) as the source for public sentiment information. The forum of international garlic forum net is a large platform for everyone to discuss the factors of and trends in garlic price, with a large amount of information and complete time series.
With the popularity and rapid development of Internet, the network is flooded with a large amount of information. Web crawler technology emerged to facilitate effectively using the network resources and to quickly find useful information [48]. Web crawler technology is a program or script that automatically crawls web pages for information according to certain rules, simulating a browser, and is, thus, a way to obtain network resources [49]. Octopus is a universal Internet data collector for the whole network that can obtain standardized data from different websites or web pages. This paper collected information based on Octopus v8.2.0, that developed by Shenzhen Vision Information Technology Co., Ltd., Shenzhen, China, and the founder, Mr. Liu, is dedicated to the collection and analysis of big data information through the software of Octopus. The detailed principle is shown in Figure 2.
With regard to the type of information collected on posts, we obtained the username, post content, number of views, number of comments, and post time. After the content was collected, all information was exported and stored as an Excel file.
(2)
Data Processing
The dataset we used in the experiment is the garlic forum data. Using crawler technology, the relevant posts in the forum on garlic price from 2015 to 2020 were extracted. A total of 3562 pieces of posts were obtained. Then, the raw posts were cleaned up by excluding duplicates, advertising, intentional abuse and other useless information. Finally, 3357 posts that met the requirements remained. These posts were divided into two groups. One was for the posts with obvious sentiment, which were manually classified into 800 posts with positive sentiment and 800 posts with negative sentiment. The remaining posts were classified using machine learning methods. The classified posts were used to train and test the classifier. Some examples of the classified posts are shown in Table 1.
(3)
Construct Sentiment Index
In order to reflect the public attitude and public attention to garlic price from multiple angles, this paper divided the sentiment indicators into two categories. One category is the state of public attention based on the number of readings and posts, and the other category is the state of public attitude based on the number of positive sentiment posts and negative sentiment posts.
(a)
The change rate of monthly reading ( R e a d ), which mainly reflects the change in public attention to the garlic price. The larger the reading volume, the more intense the public emotion regarding the price of garlic [50]. It reflects the intensity of price fluctuation from the side. The calculation formula is shown in Formula (2).
(b)
The bullish index ( B I ) reflects the public’s positive sentiment toward prices. The sentiment index is computed as the spread between the percentage of positive and negative [51,52,53]. B I > 0 indicates that the public sentiment is positive, whereas B I < 0 means that the sentiment public is negative. The calculation formula is shown in Formula (3).
R e a d t = ln x t x t 1
B I t = ln 1 + p o s t 1 + n e g t
Here, x t is the number of readings in month t,   p o s t is the number of positive posts in month t, and n e g t is the number of negative posts in month t.

3.3. Sentiment Analysis Based on NLP

Sentiment analysis is a type of data mining measuring the inclination of people’s opinions through natural language processing (NLP) [54]. It has two components of application, namely, feature extraction and valence. The structure of sentiment analysis is shown in Figure 3.

3.3.1. Feature Extraction Based on NLPIR

Feature extraction consists of three main steps: word segment, stop word removal and keyword extraction. It is mainly used to extract useful information, such as topics or keywords, from a large amount of text through word segment techniques. Feature extraction is heavily reliant on dictionary analysis and aims to perform word segmentation from sentences and to clearly distinguish and classify each word form. Word segmentation in dictionary analysis for Chinese; however, is difficult due to the specific language characteristics. This paper uses the Chinese Academy of Science NLPIR Bigdata Semantic Intelligence Analytics Platform to segment the textual information of garlic network public opinions. NLPIR is a comprehensive software based on the needs of Chinese data mining that integrates the research results of web precision collection, natural language processing, text mining and semantic search.

3.3.2. Valence Based on Sentiment Lexicon and SVM

Since the basic sentiment lexicon is still incomplete, the generalization of sentiment words is limited [55], so it is necessary to identify some unique sentiment new words in the garlic market posts in constructing a sentiment lexicon for garlic. The support vector machine (SVM) model is mainly used for classification problems and can solve problems such as small sample size and nonlinearity, especially in solving text classification problems. Therefore, this paper proposes a sentiment classification method based on sentiment lexicon and SVM. The steps of valence based on sentiment lexicon and SVM are as follows:
  • Step 1: Construct basic sentiment lexicon.
The basic sentiment lexicon was constructed based on the Chinese Sentiment Dictionary Database of Dalian University of Technology [56] through integration and optimization by removing repetitive and useless words.
  • Step 2: Expanding sentiment words based on Word2Vec.
Word2Vec is a tool of training word vectors that was introduced by Google in 2013 [57]. The calculation formula is shown in Formula (4):
cos ( w 1 , w 2 ) = i = 1 n w 1 i w 2 i i = 1 n w 1 i 2 i = 1 n w 2 i 2
where w 1 , w 2 denote two words or phrases, and w 1 i , w 2 i denote their respective values taken in dimension i. The cos denotes the cosine value between the two words, where a higher value indicates a higher degree of association between the two words.
The polarity strength of the added sentiment words was determined by the semantic similarity between the candidate words and the baseline words. The calculation formula is shown in Formula (5):
S e n t i S c o r e ( w o r d ) = max [ 1 N j cos ( w o r d , s e t ) ]
where w o r d denotes the added sentiment word and s e t denotes the set of basic sentiment words. S e n t i S c o r e is the polar intensity of new words. New words with sentiment are taken into the basic sentiment lexicon as the new sentiment lexicon, which is the domain lexicon for the garlic market.
  • Step 3: Sentiment classification based on SVM
The basic model of SVM is the linear classifier defined as the one with largest interval on feature space. The addition of kernel tricks can turn basic SVM into a substantially nonlinear classifier with the learning goal of finding a separating hyperplane in a feature space: w · x + b = 0 , where w is the normal vector and b is the intercept. The radial basis function (RBF) kernel function was used to classify the sentiment polarity of garlic network public opinions.

3.4. TVP-VAR Model

The TVP-VAR model was employed in Primiceri [58] and Nakajima [59] to detect the time-varying nature of the effects of public opinions on garlic price fluctuation. Compared with the VAR model, the TVP-VAR model can not only characterize the time-varying characteristics of the variables but also deal with abnormal changes in the variables, which enhances the stability of the estimation results.
The TVP-VAR model is derived from the same algebraic formula as the SVAR model. The SVAR model with a p-order lag term can be written in Formula (6):
A t y t = F 1 y t 1 + + F p y t p + u t
where y t is a ( n × 1 ) vector of observed dependent variables and F 1 , , p are ( n × n ) matrices of time-varying coefficients. u t is a structural shock with zero mean and u t ~ N ( 0 , t t ) , A t is a lower triangular matrix, and the t is a diagonal matrix.
A t = [ 1 a 21 0 1 0 0 a n 1 a n , n 1 1 ]
t = [ σ 1 t 0 0 σ 2 t 0 0 0 σ n t 1 ]
Thus, both sides of Formula (6) are simultaneously multiplied by the inverse matrix of matrix A t to obtain Formula (9):
y t = B 1 y t 1 + + B s y t 1 + A t 1 t ε t
where ε t ~ N ( 0 , I k ) , B i = A t 1 F i ,   i = 1 , , s . In order to simplify the calculation, each element of the row in B i , t is collapsed into a k 2 s × 1 dimensional vector β . Furthermore, X t = I n [ y t 1 , , y t p ] is set, where the Kronecker product is shown by symbols. Therefore, Formula (5) can be further simplified as y t = X t β + A t 1 t ε t , and all parameters in the model are time-varying. Thus, the general form of TVP-VAR model is shown in Formula (10):
y t = X t β t + A t 1 t ε t
h t = ( h 1 t , h 2 t , , h k t ) ,   h j t = l n σ i t 2 ,   j = 1 , 2 , , t are defined, and it is assumed that the parameters in Formula (7) are in accordance with the following random walk process: β t = β t 1 + ν t ,   a t = a t 1 + ζ t ,   h t = h t 1 + η t . All innovations in the model are assumed to be jointly normally distributed, with the following variance–covariance matrix:
V = V a r ( u t ν t ζ t η t ) = ( I k 0 0 β 0 0 0 0 0 0 0 0 a 0 0 h )
where the n-dimensional matrix I k is an identity matrix, and β , a and h are definite positive matrices. Estimation using this method is difficult because of the large number of parameters. The MCMC algorithm and TVP-VAR model based on the Bayesian inference method can be used overcome this problem.

4. Results and Discussions

4.1. Sentiment Analysis

Using the NLPIR big data platform for word separation and discovery, new words are added to the base dictionary. Examples of new words added to the domain sentiment lexicon are shown in Table 2.
In order to demonstrate the validity of the algorithm, we compared the results with SVM, logistic regression, KNN, decision tree and random forest. In the experiment, we use the classified dataset to divide into the training set and test set in proportion to w . The result with different w is presented in Figure 4.
It can be seen from Figure 4 that when the proportion of training set to test set is 8:2, the classifiers of SVM, logistic regression and decision tree have the highest accuracy. When the proportion of training set to test set is 9:1, random forest has the highest accuracy. After comprehensive comparison, the training and test sets are randomly divided in the proportion of 8:2. The classification performance of the five classifiers was compared according to accuracy and time. The results are shown in Figure 5.
As can be seen from Figure 4, the SVM has the highest classification accuracy and takes the least amount of time. This is mainly because SVM can classify linear and nonlinear data by adding a dimension to the feature space, and it shows better performance than other classifiers for small samples. Logistic regression models are better for classifying linear data. KNN, decision tree and random forest do not classify small sample data well and are prone to overfitting. Therefore, this paper used an SVM classifier to classify the remaining forum data.
The relationship between BI, Read and R is shown in Figure 6.

4.2. Pre-Tests for the Time Series Data

4.2.1. Stability Test of Variables

To avoid the possibility of a “false regression”, a stability test was conducted on each time series before the model estimation. The augmented Dicky–Fuller (ADF) test [60] was used to assess the stability of the public attention, public attitude and garlic price fluctuation time series, the results of which are shown in Appendix B Table A1, which shows that the public attitude, public attention and garlic price fluctuation time series were stable. As the time series were stationary, it was necessary to determine the optimal lag order. To determine the number of lags in the VAR, the model is estimated from one to six lags, and the appropriate lag with the lowest values of Akaike information criterion and Schwarz criterion is selected [61]. The result is shown in Appendix B Table A2, which shows that the optimal lag order is 1.

4.2.2. Stability Test of Model

As the time series of public opinions and garlic price fluctuation may have some structural breaks, the traditional linear model may not be stable, which may not only influence the estimation result, but also tend to cause systematic errors [62]. Therefore, before proceeding to TVP-VAR estimation, we needed to check the stability of the model. For this, we first estimated the linear version of the VAR model and then checked the stability based on the plots of recursive residuals. The recursive residuals of the linear VAR model are presented in Appendix A Figure A1, which suggest the presence of serious parameter instabilities in the linear VAR model. Therefore, the nonlinear TVP-VAR model was employed to analyze the shock effect of public attention and public attitude on garlic price fluctuation.

4.3. The Model of Garlic Price Fluctuation with Network Public Opinions

4.3.1. Estimate the Time-Varying Parameters Based on MCMC Algorithm

The MCMC algorithm is used to estimate the time-varying parameters in terms of unobserved latent variables. Following the method of Nakajuma, the MCMC algorithm is used to draw 10,000 samples and discard the initial 1000 samples to obtain the model of valid samples. Table 3 reports the standard deviations, lower and upper 95% confidence intervals and the posterior means of the selected parameters based on the MCMC estimation of TVP-VAR model. The results based on Geweke [63] show that the null hypothesis of the convergence to the posterior distribution is not rejected for the parameters at the 5% level of significance. The sample autocorrelation functions, sample paths and posterior densities for selected parameters show that the simulation produced stable and uncorrelated samples, as highlighted in Appendix A Figure A2. Convergence of the time-varying parameters was successful, as demonstrated from the diagnostic tests. Most of the inefficiency factors were also found to be low, which shows that the number of iterations is sufficient for stable estimation using the TVP-VAR model.

4.3.2. Time-Varying Influence of Public Attention and Public Attitude on Garlic Price Fluctuation Based on the TVP-VAR Model

(1)
The analysis of stochastic volatility
Figure 7 shows the posterior mean with corresponding one-standard-deviation error bands. The plots of variables of public attention, public attitude and price fluctuation have different responses. The stochastic volatility of public attitude is maintained at a stable level, where the stochastic volatility of public attention reached its peak at the end of 2015 and then gradually tended to zero, the stochastic volatility of garlic price fluctuation peaked in June 2016, October 2019 and December 2020. The stochastic volatilities of public attention, public attitude and price fluctuation show different patterns for the same time period. Therefore, it is necessary to analyze the dynamic impulse responses of public attention and public attitude to garlic price fluctuation at the different periods and different lag intervals.
(2)
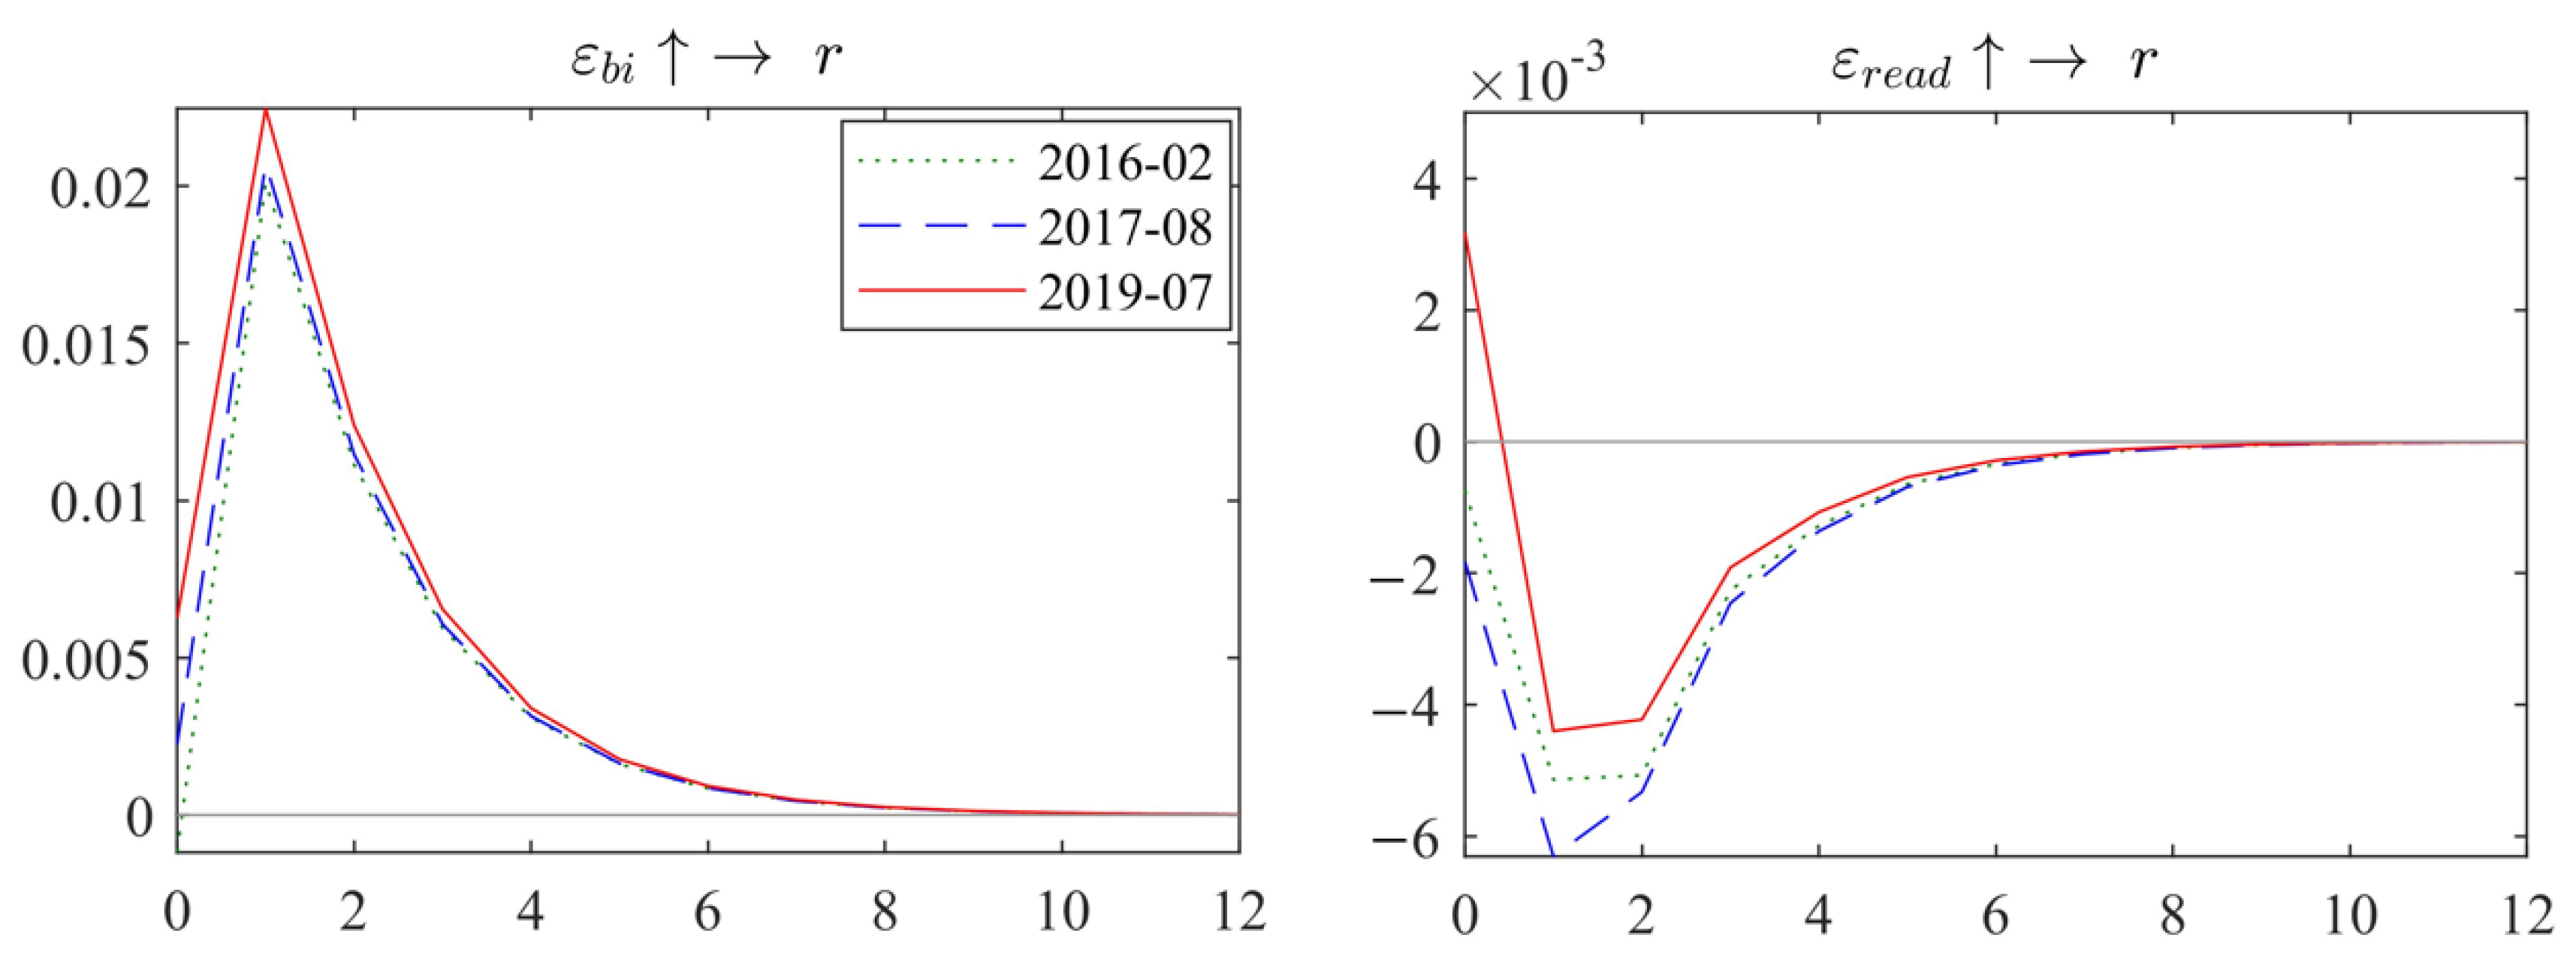
Equal interval impulse responses of garlic price fluctuations to changes in network public opinions
The dynamic impulse response of public attention and public attitude to garlic price fluctuation are shown in Figure 8. It shows the impulse responses of garlic prices after being impacted by one-unit standard deviation shock of network public opinions at different lag orders, from lag order 1, 3 and 5.
From Figure 8, it can be seen that the impulse responses of garlic prices to changes in public attitudes and public attention have obvious time-varying characteristics with the change of network public opinions, indicating that they have different impacts on garlic price fluctuations according to different periods. In terms of direction, when BI receives a positive shock of one-unit standard deviation, it brings a positive response to R, while when Read receives a positive shock of one-unit standard deviation, R responds negatively. This is mainly because when public attitudes are biased toward positive sentiment, garlic mediators will raise prices to gain more profits, while excessive public attention will prompt people to plant garlic or sell garlic at low prices. Therefore, positive sentiment has contributed to the rise of garlic price, and excessive attention will inhibit the rise of garlic prices to some extent. In terms of intensity, with the lag order is 1, the impulse response intensity of R affected by BI is around 0.02, while the maximum impulse response intensity of R affected by Read is around −0.006. The impact of BI on R is stronger than that of Read, indicating that public attitude has a greater impact on garlic price fluctuation than public attention. In terms of duration, the responses of R affected by BI and Read are different in different lag periods. When the lag order is 1, the intensity of the impulse responses of R affected by both BI and Read are the largest. When the lag order is 3, the intensity of the impulse responses of R affected by both BI and Read are significantly weaker. At the lag order of 5, the impulse responses of R affected by BI and Read are essentially zero. This indicates that with the increase in lag order, the influence of BI and Read on R rapidly decreases, and both have short-term effects.
(3)
Variable-interval impulse responses of garlic price fluctuations to changes in garlic network public opinion
In this paper, three time points, February 2016, August 2017 and July 2019, were selected to analyze the influence of public attitudes and public attention on garlic price fluctuation, which correspond to the three peaks of R. As shown in Figure 8, the impulse response trends of R are affected by BI and Read at different time points, which are basically consistent with the impulse response trends of R at different lag orders, but the response intensity varies over time. The results of time point impulse response of public attitude and public attention to garlic price fluctuation can be seen from Figure 9.
In terms of the impulse response trend, the impulse response of R affected by BI first rapidly rises and then gradually decreases to a zero value, the impulse response affected by Read first rapidly falls and then the impulse response gradually rises and eventually converges to a zero value. In term of the impulse response intensity, the impulse response of BI affected by R reaches its maximum intensity at a lag order of 1, around 0.02, and then gradually decreases to zero at a lag order of 9. The impulse response intensity of garlic price fluctuations is positive throughout the sample interval, indicating that positive sentiment is conducive to higher garlic prices. The impulse response for the change in Read reaches its maximum intensity at lag order 1, ranging from −0.004 to −0.007, and the impulse response then gradually rises to essentially zero at lag order 9. The impulse response intensity is essentially negative throughout the sample interval, indicating that public attention has a dampening influence on garlic price increases. In terms of different time points, the impulse response of R affected by BI is largest in July 2019, while in February 2016, the impulse response intensity of R is the smallest. The impulse response intensity of R affected by Read in August 2017 is largest, and the intensity is least in July 2019. This is mainly due to the rapid development of the Internet in recent years and the increasing influence of social media and news on people; hence, public attitudes have increasingly more influence on garlic price fluctuations. In addition, due to the increase in channels and resources to access information, farmers no longer blindly follow the trend of planting garlic, so the influence of public attention on garlic price fluctuation is weaker than in previous years.

4.4. Robustness Test

To verify the robustness of the above results, the different periods of time series data were used in analysis. The fluctuation of garlic price is divided into two periods according to the principle of valley-to-valley, where the first period runs from January 2015 to July 2018 and the second runs from August 2018 to December 2020. A VAR model was used to re-estimate the influence of public attention and public attitude on garlic price fluctuation in the two fluctuation periods, and the impulse responses are shown in Figure 10. The results show that public attitude has a short-term promoting influence on garlic price fluctuation in both the first and second periods, and public attention has an inhibiting influence on garlic price fluctuation after the order lag of 3. Among them, in the second period, the influence of public attention on garlic price fluctuation is promotion prior to inhibition, although there is a discrepancy with the result of the TVP-VAR model, which is consistent with the analysis in Section 1; that is, there is a promotion influence on garlic price fluctuation when attention is low, and an increasing inhibitory influence on garlic price fluctuation as attention increases. This demonstrates that the model estimation results in this paper are highly robust, and the conclusions are credible.

5. Conclusions

In order to study the influence of network public opinions on the price fluctuations of small agricultural products, this paper takes garlic as an example, crawling through garlic price-related information on garlic forums from January 2015 to December 2020 using web crawler technology, which included the text content and readings of individual posts, and sentiment analysis methods were used to construct numerical indicators of online public opinion, public attitude indicator (BI) and public attention indicator (Read), and the dynamic influence of public attitude and public attention on garlic price fluctuations was analyzed using a TVP-VAR model. The NLP-TVP-VAR model results support the original hypothesis that both public attitude and public attention have a short-term influence on garlic price fluctuation, and the influences differ in direction and intensity, which is also consistent with the conclusions in [47]. In terms of direction, the public attitude has a significant positive influence on garlic price fluctuation, whereas the public attention has an inhibiting influence. In terms of intensity, the intensity of garlic price fluctuations is more strongly affected by public attitude than public attention. In addition, the influences of public attitude and public attention on garlic price fluctuations vary at different time points. In recent years, the influence of public attitude on garlic price fluctuation has become stronger, while the influence of public attention on garlic price fluctuation has been weaker than in previous years.
Thus, to perfectly understand the factors influencing price fluctuation of small agricultural products and further increase the timeliness and accuracy of price fluctuation prediction of small agricultural product in addition to stabilize small agricultural product prices, we present the following countermeasures and suggestions:
(1)
The comprehensive information platform for the whole industrial chain of small agricultural products can be improved by collecting and releasing relevant information in a timely manner. A comprehensive information platform for the whole industrial chain should be constructed to realize the comprehensive collection, management and utilization of production and market circulation-related information, such as industrial dynamics, market conditions and natural disaster forecasts and scientifically respond to farmers’ rational entry or exit from the market;
(2)
An early warning system should be constructed for price fluctuations of small agricultural products, and corresponding measures taken in a timely manner. Since network public opinions can be crawled in real time, an early warning system for fluctuations in small agricultural product prices can be improved based on network public opinions. In addition to the conventional specific data including planted area, production, import and export prices and market prices, the value of network public opinions can be added to construct early warning indicators, which can allow more accurate predictions and provide basic support for the early warning model.

6. Limitations and Future Research

Network public opinions on small agricultural products includes not only forum information, but also news information. Different types of network public opinion information have different rates of dissemination and influence, which, in turn, have different impacts on the price fluctuations of small agricultural products. Therefore, it is necessary to further collect online public opinion information from different platforms and explore its impact on the price fluctuation of small agricultural products. In addition, we will further study the influence of public attentions and public attitudes on the price fluctuation of small agricultural products, and use network public opinion information to predict and provide early warnings on small agricultural prices, so as to provide the basis for farmers and the government to avoid market risks and, thus, more effectively guarantee the stability of small agricultural prices.

Author Contributions

Conceptualization, J.M.; methodology, Q.W.; software, X.L.; validation, X.L., J.M. and Q.W.; formal analysis, Q.W.; investigation, J.M.; resources, X.L.; data curation, J.M.; writing—original draft preparation, X.L.; writing—review and editing, Q.W.; visualization, X.L.; supervision, J.M.; project administration, J.M.; funding acquisition, J.M. All authors have read and agreed to the published version of the manuscript.

Funding

This research received no external funding.

Institutional Review Board Statement

Not applicable.

Informed Consent Statement

Not applicable.

Data Availability Statement

The data that support the findings of this study are available from the correspond author upon reasonable request.

Conflicts of Interest

The authors declare no conflict of interest.

Appendix A

Figure A1. Recursive residuals of the linear VAR model.
Sustainability 14 08637 g0a1
Figure A2. The results of MCMC algorithm.
Sustainability 14 08637 g0a2

Appendix B

Table A1. ADF stability test.
Variablet-Valuep-ValueConclusion
R−5.4988640.0000 ***stable
Read−10.757080.0001 ***stable
BI−7.7539600.0000 ***stable
Note: (1) The selection criteria of test form is based on minimum AIC and SC values; (2) *** is statistically significant at the level of 1%.
Table A2. Determination of the VAR model lag.
LagLogLLRFPEAICSCHQ
0−32.26060NA0.000450.8080180.908375 *0.847615 *
1−13.533818.25724 *0.000441 *0.785642 *1.1870680.944031
2−8.5301288.9288820.0004990.9086191.6111141.185798
3−2.49984610.205090.0005500.9999952.0035591.395965
43.89091910.225220.0006011.0802792.3849121.595041
511.4920211.460120.0006371.1233222.7290241.756875
616.264606.7550390.0007411.2533973.1601672.005740
Note: * represents the optimal lag period selected by the corresponding method.

References

  1. Li, J.D.; Li, X.D. Financial factors analysis of price fluctuation of small agricultural products in China: An empirical study based on garlic and mung bean price data. J. Agro-Tech. Econ. 2018, 8, 98–111. [Google Scholar]
  2. Apergis, N.; Rezitis, A. Agricultural price volatility spillover effects: The case of Greece. Eur. Rev. Agric. Econ. 2003, 30, 389–406. [Google Scholar] [CrossRef]
  3. Ghysels, E.; Santa-Clara, P.; Valkanov, R. There is a Risk-return Trade-off After All. J. Financ. Econ. 2005, 76, 509–548. [Google Scholar] [CrossRef] [Green Version]
  4. Meng, J.; Lv, X.C. Research on price fluctuation characteristics and Regularity of small farm products in China based on ARCH Model. Price Theory Pract. 2021, 3, 87–90. [Google Scholar]
  5. Ma, H.Y.; Zhao, X. The minor an empirical analysis of the characteristics of agricultural price volatility, China—In garlic, for example. Agric. Technol. Econ. 2021, 11, 33–48. [Google Scholar]
  6. Zhang, W.H.; Zhang, Y.L. Study on price fluctuation characteristics of Fish and aquatic products in China. J. Agro-Tech. Econ. 2020, 2, 133–142. [Google Scholar]
  7. Ma, Z.D.; Ding, T.J. Research on current situation of Garlic export trade in China. Rural. Econ. Sci. Technol. 2017, 2, 72–274. [Google Scholar]
  8. Wani, M.A.; Agarwal, N.; Jabin, S.; Hussain, S.Z. User emotion analysis in conflicting versus non-conflicting regions using online social networks. Telemat. Inf. 2018, 35, 2326–2336. [Google Scholar] [CrossRef]
  9. Davis, J.L.; Love, T.P.; Fares, P. Collective Social Identity: Synthesizing Identity Theory and Social Identity Theory Using Digital Data. Soc. Psychol. Q. 2019, 82, 254–273. [Google Scholar] [CrossRef]
  10. Sok, J.; Borges, J.R.; Schmidt, P.; Ajzen, I. Farmer Behaviour as Reasoned Action: A Critical Review of Research with the Theory of Planned Behaviour. J. Agric. Econ. 2020, 72, 388–412. [Google Scholar] [CrossRef]
  11. Zhang, X.Y. Research on Price Fluctuation and Prediction of Small Grains in China. Ph.D. Thesis, Chinese Academy of Agricultural Sciences, Beijing, China, 2019. [Google Scholar]
  12. Duan, Z.Z.; Liu, L.Z. A study on the dynamic relationship between price fluctuations of livestock and poultry products in China under the influence of African swine fever—Based on the perspective of public opinion management. Agric. Mod. Res. 2020, 41, 678–686. [Google Scholar]
  13. Gómez, D.; Salvador, P.; Sanz, J.; Casanova, J.L. Regional estimation of garlic yield using crop, satellite and climate data in Mexico. Comput. Electron. Agric. 2021, 181, 105943. [Google Scholar] [CrossRef]
  14. Wang, B.J. Research and Development of Garlic Industry Network Public Opinion Monitoring and Analysis System. Ph.D. Thesis, Shandong Agricultural University, Taian, China, 2019. [Google Scholar]
  15. Wang, J.; Ren, W.M. Big data serves the whole agricultural industry chain: Practice and exploration of Shandong province. Inf. Technol. Informatiz. 2018, 9, 9088. [Google Scholar]
  16. Qiu, C.; Colson, G.; Escalante, C.; Wetzstein, M. Considering macroeconomic indicators in the food before fuel nexus. Energy Econ. 2012, 34, 2021–2028. [Google Scholar] [CrossRef]
  17. Sun, Y.T.; Xiao, F.; Zhou, Y.; Tian, G.Z. Spatial-Temporal Distribution and Influence Mechanism of Internet Public Attention on COVID-19: A Case Study on the Baidu Searching Index. Trop. Geogr. 2020, 40, 375–385. [Google Scholar]
  18. Gao, X.D. The law and reason analysis of price fluctuation of small farm produce in China. Agric. Econ. 2017, 1, 133–135. [Google Scholar]
  19. Yu, A.Z.; Zhou, J.J.; Zhang, H.J. Analysis on current situation and trend of international trade of small farm products in China. Chin. J. Agric. Resour. Reg. Plan. 2020, 41, 110–120. [Google Scholar]
  20. Johnson, G.; Guoqing, S. Inflation and the Real Price of Grain in China. In Food Security and Economic Reform—The Challenges Facing China’s Grain Marketing System; Macmillan Press: London, UK, 1999. [Google Scholar]
  21. Mitra, S.; Boussard, J.M. A Nonlinear Cobweb Model of Agricultural Commodity Price Fluctuations; Fordham University: New York, NY, USA, 2008; Volume 3, pp. 321–331. [Google Scholar]
  22. Letson, D.; Podesta, G.P. The uncertain value of perfect ENSO phase forecasts: Stochastic agricultural prices and intra-phase climatic variations. Clim. Change 2005, 69, 163–196. [Google Scholar] [CrossRef]
  23. Liao, S.S. Study on financial causes and countermeasures of agricultural product price fluctuation. Manag. Mod. 2013, 4, 10–12. [Google Scholar]
  24. Hassan, D.; Simioni, M. Price Linkage and Transmission between Shippers and Retailers in the French Fresh Vegetable Channel. J. Coord. Chem. 2002, 63, 4165. [Google Scholar]
  25. Liu, G.D. Study on the risk of price bubble of small agricultural products—Taking ginger as an example. Price Theory Pract. 2018, 2, 55–58. [Google Scholar]
  26. Deressal, T.; Hassan, R.M. Economic Impact of Climate Change on Crop Production in Ethiopia: Evidence from Cross-section Measures. J. Afr. Econ. 2009, 18, 529–554. [Google Scholar] [CrossRef]
  27. Yuan, B.; Chen, C. Research on price fluctuations of perishable agricultural products from the perspective of weather changes. Arid. Zone Resour. Environ. 2020, 34, 147–153. [Google Scholar]
  28. Benavides, G. Price volatility forecasts for agricultural commodities: An application of historical volatility models, option implied and composite approaches for futures prices of corn and wheat. Rev. Adm. Finanz. Econ. 2009, 3, 40–59. [Google Scholar] [CrossRef]
  29. Westcott, P.C. Ethanol Expansion in the United States, How Will the Agricultural Sector Adjust; USDA: Washington, DC, USA, 2007; Volume 6, pp. 53–75.
  30. Wu, H.X. Research on spillover effect of grain market price fluctuation in China. J. Agric. Technol. Econ. 2012, 10, 14–21. [Google Scholar]
  31. Lu, H.M.; Jiang, X.Y. Financialization factors of China’s bulk agricultural product price volatility: An empirical study based on SVAR model. J. Agric. Tech. Econ. 2013, 2, 51–58. [Google Scholar]
  32. Khan, W.; Malik, U.; Ghazanfar, M.A.; Azam, M.A.; Alyoubi, K.H.; Alfakeeh, A.S. Predicting stock market trends using machine learning algorithms via public sentiment and political situation analysis. Soft Comput. 2020, 24, 11019–11043. [Google Scholar] [CrossRef]
  33. Ainin, S.; Feizollah, A.; Anuar, N.B.; Abdullah, N.A. Sentiment analyses of multilingual tweets on halal tourism. Tour. Manag. Perspect. 2020, 34, 100658. [Google Scholar] [CrossRef]
  34. Bose, R.; Dey, R.K.; Roy, S.; Sarddar, D. Sentiment Analysis on Online Product Reviews. In Information and Communication Technology for Sustainable Development; Springer: Singapore, 2020; pp. 559–569. [Google Scholar]
  35. Rani, S.; Kumar, P. A Sentiment Analysis System to Improve Teaching and Learning. Computer 2017, 50, 36–43. [Google Scholar] [CrossRef]
  36. Yekrangi, M.; Abdolvand, N. Financial markets sentiment analysis: Developing a specialized Lexicon. J. Intell. Inf. Syst. 2021, 57, 127–146. [Google Scholar] [CrossRef]
  37. Beigi, O.M.; Moattar, M.H. Automatic construction of domain-specific sentiment lexicon for unsupervised domain adaptation and sentiment classification. Knowl.-Based Syst. 2021, 213, 106423. [Google Scholar] [CrossRef]
  38. Go, A.; Bhayani, R.; Huang, L. Twitter Sentiment Classification Using Distant Supervision; CS224N Project Report; Stanford: Stanford, CA, USA, 2009; Volume 1, pp. 1–12. [Google Scholar]
  39. Alsaaran, N.; Alrabiah, M. Classical Arabic Named Entity Recognition Using Variant Deep Neural Network Architectures and BERT. IEEE Access 2021, 9, 91537–91547. [Google Scholar] [CrossRef]
  40. Dashtipour, K.; Gogate, M.; Adeel, A.; Larijani, H.; Hussain, A. Sentiment Analysis of Persian Movie Reviews Using Deep Learning. Entropy 2021, 23, 596. [Google Scholar] [CrossRef] [PubMed]
  41. Gopalakrishnan, K.; Salem, F.M. Sentiment Analysis Using Simplified Long Short-term Memory Recurrent Neural Networks. arXiv 2020, arXiv:2005.03993. [Google Scholar]
  42. Strau, N.; Vliegenthart, R.; Verhoeven, P. Lagging behind? Emotions in newspaper articles and stock market prices in the Netherlands. Public Relat. Rev. 2016, 42, 548–555. [Google Scholar] [CrossRef]
  43. Derakhshan, A.; Beigy, H. Sentiment analysis on stock social media for stock price movement prediction. Eng. Appl. Artif. Intell. 2019, 85, 569–578. [Google Scholar] [CrossRef]
  44. Hassouneh, I.; Radwan, A.; Serra, T.; Gil, J.M. Food scare crises and developing countries: The impact of avian influenza on vertical price transmission in the Egyptian poultry sector. Food Policy 2012, 37, 264–274. [Google Scholar] [CrossRef]
  45. Chen, J.; Zhou, H.; Hu, H.; Song, Y.; Gifu, D.; Li, Y.; Huang, Y. Research on agricultural monitoring system based on convolutional neural network. Future Gener. Comput. Syst. 2018, 88, 271–278. [Google Scholar] [CrossRef]
  46. Li, H.-S.; Hu, C.-P.; Lu, Z.; Li, M.-Q.; Guo, X.-Z. African swine fever and meat prices fluctuation: An empirical study in China based on TVP-VAR model. J. Integr. Agric. 2021, 20, 2289–2301. [Google Scholar] [CrossRef]
  47. Liu, Y.; Liu, S.; Ye, D.; Tang, H.; Wang, F. Dynamic impact of negative public sentiment on agricultural product prices during COVID-19. J. Retail. Consum. Serv. 2022, 64, 102790. [Google Scholar] [CrossRef]
  48. Hu, H.; Ge, Y.J.; Hou, D.Y. Using web crawler technology for geo-events analysis: A case study of the Huangyan Island incident. Sustainability 2014, 6, 1896–1912. [Google Scholar] [CrossRef] [Green Version]
  49. Kausar, M.A.; Dhaka, V.S.; Singh, S.K. Web crawler: A review. Int. J. Comput. Appl. 2013, 63, 31–36. [Google Scholar]
  50. Pang, L.; Li, J.Y. The Impact of Electronic Word-of-mouth on the Online Page View of Restaurants. Tour. Trib. 2014, 29, 111–118. [Google Scholar]
  51. Werner, A.; Muray, Z.F. Is all that talk just noise? The information content of internet stock message boards. J. Financ. 2004, 59, 1259–1294. [Google Scholar]
  52. Verma, R.; Soydemir, G. The impact of individual and institutional investor sentiment on the market price of risk. Q. Rev. Econ. Financ. 2009, 49, 1129–1145. [Google Scholar] [CrossRef]
  53. Oliveira, N.; Cortez, P.; Areal, N. The impact of microblogging data for stock market prediction: Using Twitter to predict returns, volatility, trading volume and survey sentiment indices. Expert Syst. Appl. 2017, 73, 125–144. [Google Scholar] [CrossRef] [Green Version]
  54. Ain, Q.T.; Ali, M.; Riaz, A.; Noureen, A.; Kamran, M.; Hayat, B.; Rehman, A. Sentiment analysis using deep learning techniques: A review. Int. J. Adv. Comput. Sci. Appl. 2017, 8, 424–433. [Google Scholar]
  55. Lu, K.; Wu, J.S. Sentiment Analysis of Film Review Texts Based on Sentiment Dictionary and SVM. In Proceedings of the 3rd International Conference on Innovation in Artificial Intelligence, New York, NY, USA, 15–18 March 2019; pp. 73–77. [Google Scholar]
  56. Chen, J.M.; Lin, H.F.; Yang, Z.H. Automatic acquisition of sentiment vocabulary based on syntax. CAAI Trans. Intell. Syst. 2009, 4, 100–106. [Google Scholar]
  57. Mikolov, T.; Chen, K.; Corrado, G.; Dean, J. Efficient Estimation of Word Representations in Vector Space. arXiv 2013, arXiv:1301.3781. [Google Scholar]
  58. Primiceri, G.E. Time varying structural vector autoregressions and monetary policy. Rev. Econ. Stud. 2005, 72, 821–852. [Google Scholar] [CrossRef]
  59. Nakajima, J. Time-varying parameter VAR model with stochastic volatility: An overview of methodology and empirical applications. Monet. Econ. Stud. 2011, 29, 107–142. [Google Scholar]
  60. Dickey, D.A.; Fuller, W.A. Distribution of the estimators for autoregressive time series with a unit root. J. Am. Stat. Assoc. 1979, 74, 427–431. [Google Scholar]
  61. Wen, F.; Zhang, M.; Deng, M.; Zhao, Y.; Ouyang, J. Exploring the dynamic effects of financial factors on oil prices based on a TVP-VAR model. Phys. A Stat. Mech. Appl. 2019, 532, 121881. [Google Scholar] [CrossRef]
  62. Zheng, Y.; Ma, J. Dynamic impact of avian influenza epidemic changes on livestock and poultry product prices: Based on TVP-VAR model. Res. Agric. Mod. 2018, 39, 751–760. [Google Scholar]
  63. Geweke, J. Evaluating the accuracy of sampling-based approaches to calculating posterior moments. Bayesian Stat. 1992, 4, 169–193. [Google Scholar]
Figure 1. Flowchart of the experimental methods used in this study.
Sustainability 14 08637 g001
Figure 2. Principle of data collection.
Sustainability 14 08637 g002
Figure 3. The structure of sentiment analysis.
Sustainability 14 08637 g003
Figure 4. Accuracy of different w .
Sustainability 14 08637 g004
Figure 5. Comparison of experimental results.
Sustainability 14 08637 g005
Figure 6. Relationship between BI, Read and R.
Sustainability 14 08637 g006
Figure 7. Posterior estimates for stochastic volatility of structural shock.
Sustainability 14 08637 g007
Figure 8. The dynamic impulse response of public attention and public attitude to garlic price fluctuation.
Sustainability 14 08637 g008
Figure 9. Time point impulse response of public attitude and public attention to garlic price fluctuation.
Sustainability 14 08637 g009
Figure 10. The impulse response of different periods.
Sustainability 14 08637 g010
Table 1. Example posts in the forum dataset.
PositiveNegative
Major good news came, immediately ushered in a wave of rising peak.There is no lowest, only lower.
Prices continue to rise today, the upward trend is clear, the market is healthy.The downside has been established, and a deep decline is coming.
Garlic prices will continue to rise after the Spring Festival. From most of the domestic production areas at present, there are not too many supplies left.Urgent tips, the plunge is coming, the new garlic will be listed in large quantities soon, and the plunge of garlic is in sight.
Table 2. Example of new words added to the domain sentiment lexicon.
Sentiment PolaritySentiment Words
Positiverising, boom, price increase, rebounding, stability, bullish, bullish market
Negativedecline, plummet, downward slide, downward, crag, weakness, price pressure, trough, risk, shocks, hidden risks, stagnant sales, alerts, bear market, lackluster, plague
Table 3. Estimation results for selected parameters of the TVP-VAR model.
ParameterMeanStd. Dev.95%L95%UCDInefficiency
( β ) 1 0.00230.00030.00180.00290.5398.42
( β ) 2 0.00230.00030.00180.00280.7598.04
( α ) 1 0.00570.00160.00340.00960.44340.96
( α ) 2 0.00530.00130.00330.00840.14625.94
( h ) 1 0.00590.00210.00330.01150.69856.63
( h ) 2 0.46160.13620.25080.77060.04167.00
Publisher’s Note: MDPI stays neutral with regard to jurisdictional claims in published maps and institutional affiliations.

