Article

Long-Term Nutrient Supply Options: Strategies to Improve Soil Phosphorus Availability in the Rice-Wheat System

by
Sunita Kumari Meena
1,2,
Brahma Swaroop Dwivedi
1,3,
Mahesh Chand Meena
1,
Saba Prasad Datta
1,
Vinod Kumar Singh
1,4,
Rajendra Prasad Mishra
5,
Debashish Chakraborty
1,
Abir Dey
1 and
Vijay Singh Meena
6,7,*
1
ICAR-Indian Agricultural Research Institute (ICAR-IARI), New Delhi 110012, India
2
Department of Soil Science, Sugarcane Research Institute, Dr. Rajendra Prasad Central Agricultural University (RPCAU), Pusa, Samastipur 848125, India
3
ICAR-National Bureau of Soil Survey and Land Use Planning (ICAR-NBSS & LUP), Nagpur 440033, India
4
ICAR-Central Research Institute for Dryland Agriculture (ICAR-CRIDA), Hyderabad 500059, India
5
ICAR-Indian Institute of Farming Systems Research (ICAR-IIFSR), Modipuram Meerut 250110, India
6
ICAR-Vivekananda Parvatiya Krishi Anusandhan Sansthan (ICAR-VPKAS), Almora 263601, India
7
CIMMYT-Borlaug Institute for South Asia (BISA), Samastipur 848125, India
*
Author to whom correspondence should be addressed.
Sustainability 2022, 14(14), 8629; https://doi.org/10.3390/su14148629
Submission received: 14 March 2022 / Revised: 3 June 2022 / Accepted: 11 July 2022 / Published: 14 July 2022
(This article belongs to the Special Issue Sustainable Agri-Food Networks)

Abstract

:
The indiscriminate use of chemical fertilizers can deteriorate soil, grain, and environmental quality; still, these can be restored if integrated nutrient management options with inclusion of legumes in the cropping system are adopted. A long-term (19 year) rice-wheat system experiment was examined to find out the best nutrient management practices (BNMP) through recommended dose of fertilizers (RDF), integrated plant nutrition system (IPNS), soil test crop response (STCR), farmyard manure (FYM), along with the inclusion of pulses (berseem and cowpea). Seven nutrient management practices were applied in combination of organic and chemical fertilizer in the rice-wheat system. Results showed that a significant variation was seen in phosphorus (P) fractions among the treatments and soil depths. The results showed a significantly (p < 0.05) higher contribution to phosphorus availability by Residual-P followed by NaHCO3-Po > NaOH-Pi > NaOH-Po > HCl-P > NaHCO3-Pi > available P and lowest in WSP under different long-term management options in rice-wheat system after completing 19 crop cycles. Variations in soil P-fractions with depth were compared to different treatment combination, and a considerable increase in all the major P-fractions was noticed. The continuous application of various IPNS options as organic farming (OF), RDF, STCR, and the inclusion of pulses (berseem and cowpea) significantly improved all P fractions in the soil system and offered an added benefit in terms of sustainability of production and soil health compared to the solo application of chemical fertilizers. Overall, results showed that IPNS options (berseem and cowpea) showed its superiority over the rest of the treatment. This study suggests that the inclusion of pulses would increase P-availability in soil system.

Graphical Abstract

1. Introduction

Phosphorus (P) is an essential macronutrient for sustainable food production system classified by the European Commission [1]. P is the second most essential plant nutrient after nitrogen (N); it plays key roles in metabolism, structure, and energy in plant system. The P-fractions in soil system and nutrient cycling in agroecosystems are of increased curiosity due to its involvement to the global environmental issues [2,3]. Changes in the P concentration affect the P-cycle; long-term experiments could help to understand the P dynamics in soil-plant system. Sustainable management of P is crucial for both global food security and conservation of aquatic ecosystems [4,5,6]. Global food security is a priority for the forthcoming growth agenda of the United Nations (UN). Because of the major requirement of the sustainable food production on the uninterrupted supply of phosphatic-fertilizers to attain UN-Sustainable Development Goals (SDGs). P is a non-renewable natural resource [7,8]. Sustainable food production is crucial for achieving zero hunger and malnutrition by 2030 [9,10]. Nonetheless, agricultural activities are also negatively affecting the resilience of our planet as it is the major non-point source of pollution, mainly due to the indiscriminate use chemical fertilizers [11].
P has low efficiency (8 to 33%); applied P will fix with aluminum, iron, and manganese in acidic soils and with calcium in calcareous soils [5,12,13]. However, indiscriminate use of chemical fertilizer has led to decline in productivity, profitability, soil degradation, and environment pollution [14,15]. Therefore, the efficient management of P in agricultural soils is needed to lessen the environmental pollution induced by P and support food production [16,17]. The P management through mineral fertilizer is also unsustainable because of excessive price of phosphatic fertilizers. Systematic representation of P dynamics is presented in Figure 1.
The increased price of chemical fertilizers was among the reasons of the global food price shock in August 2007 [18]. According to Minemakers Limited [19], the global phosphate rock (PR) price showed a 400% increase (US$ 50 to 200 per ton) during 2007; diammonium phosphate (DAP) price increased from US$ 265 to 1040 per ton in 2008 [20]. Due to the sudden rise in DAP and other chemical fertilizer prices, in 2008, fertilizer riots were seen in developing nations [21]. Results suggested that the judicious application of organic manure and chemical fertilizers improved P dynamics in agricultural soils [21,22]. When a high responsiveness of P in the soil system is achieved, the management of the P in soils is difficult compared to other nutrients. The issue is not of P-reserves in soil system, but of its availability to the plant system. One viable way to mobilize these residual P compounds and to conserve the most valuable natural soil system for sustainable food production is the use of organic amendment, balanced fertilization, and inclusion of pulses in cropping system; P is the second most important soil fertility problem throughout the world [23].
P availability improved with the judicious application of organic manure and chemical fertilizers [24,25]. Yet the plants mainly depend upon inorganic P forms for their P requirements. Mineral applications had significant impact on concentration, forms, and availability of P to soil-plant systems [4]. Results concerning the distribution of different forms of P and their dynamics in soil help to evaluate the long-term availability of P. Long term studies have revealed that application of inorganic fertilizer could have a risk of environmental pollution [25]. Hence finding a suitable management strategy that limit both agricultural loss of P to waterways and support crop yield is important for sustainability of agricultural production. Efficient nutrient management is the key to high yield, long-term sustainability, and reduced environmental pollution [26,27].
Balanced fertilizer application will help to develop sustainable food production system for feeding the global population [25,28,29,30]. The soil system has very less concentration of available P, as well as decreased crop productivity and increased soil degradation. So, there is a burning issue to try to find a sustainable strategy by which P fertilizers can be used more efficiently in rice-wheat system. Current long-term field experiment was started with the aim to find out the best nutrient management practices for sustainable food production system and soil sustainability. The supposition set for our study was that the accumulation of different fractions of phosphorous might be affected by the various IPNS options in the rice-wheat system. To assess this hypothesis, the aims of this study were (i) to quantify the IPNS and soil depths on phosphorous pools, (ii) to assess the best nutrient supply options and quantitative phosphorous status, as well as the relationship between the two, compared to unfertilized plot in long-run with a broad view to assess best doses of P vis-à-vis environmental pollution risk.

2. Materials and Methods

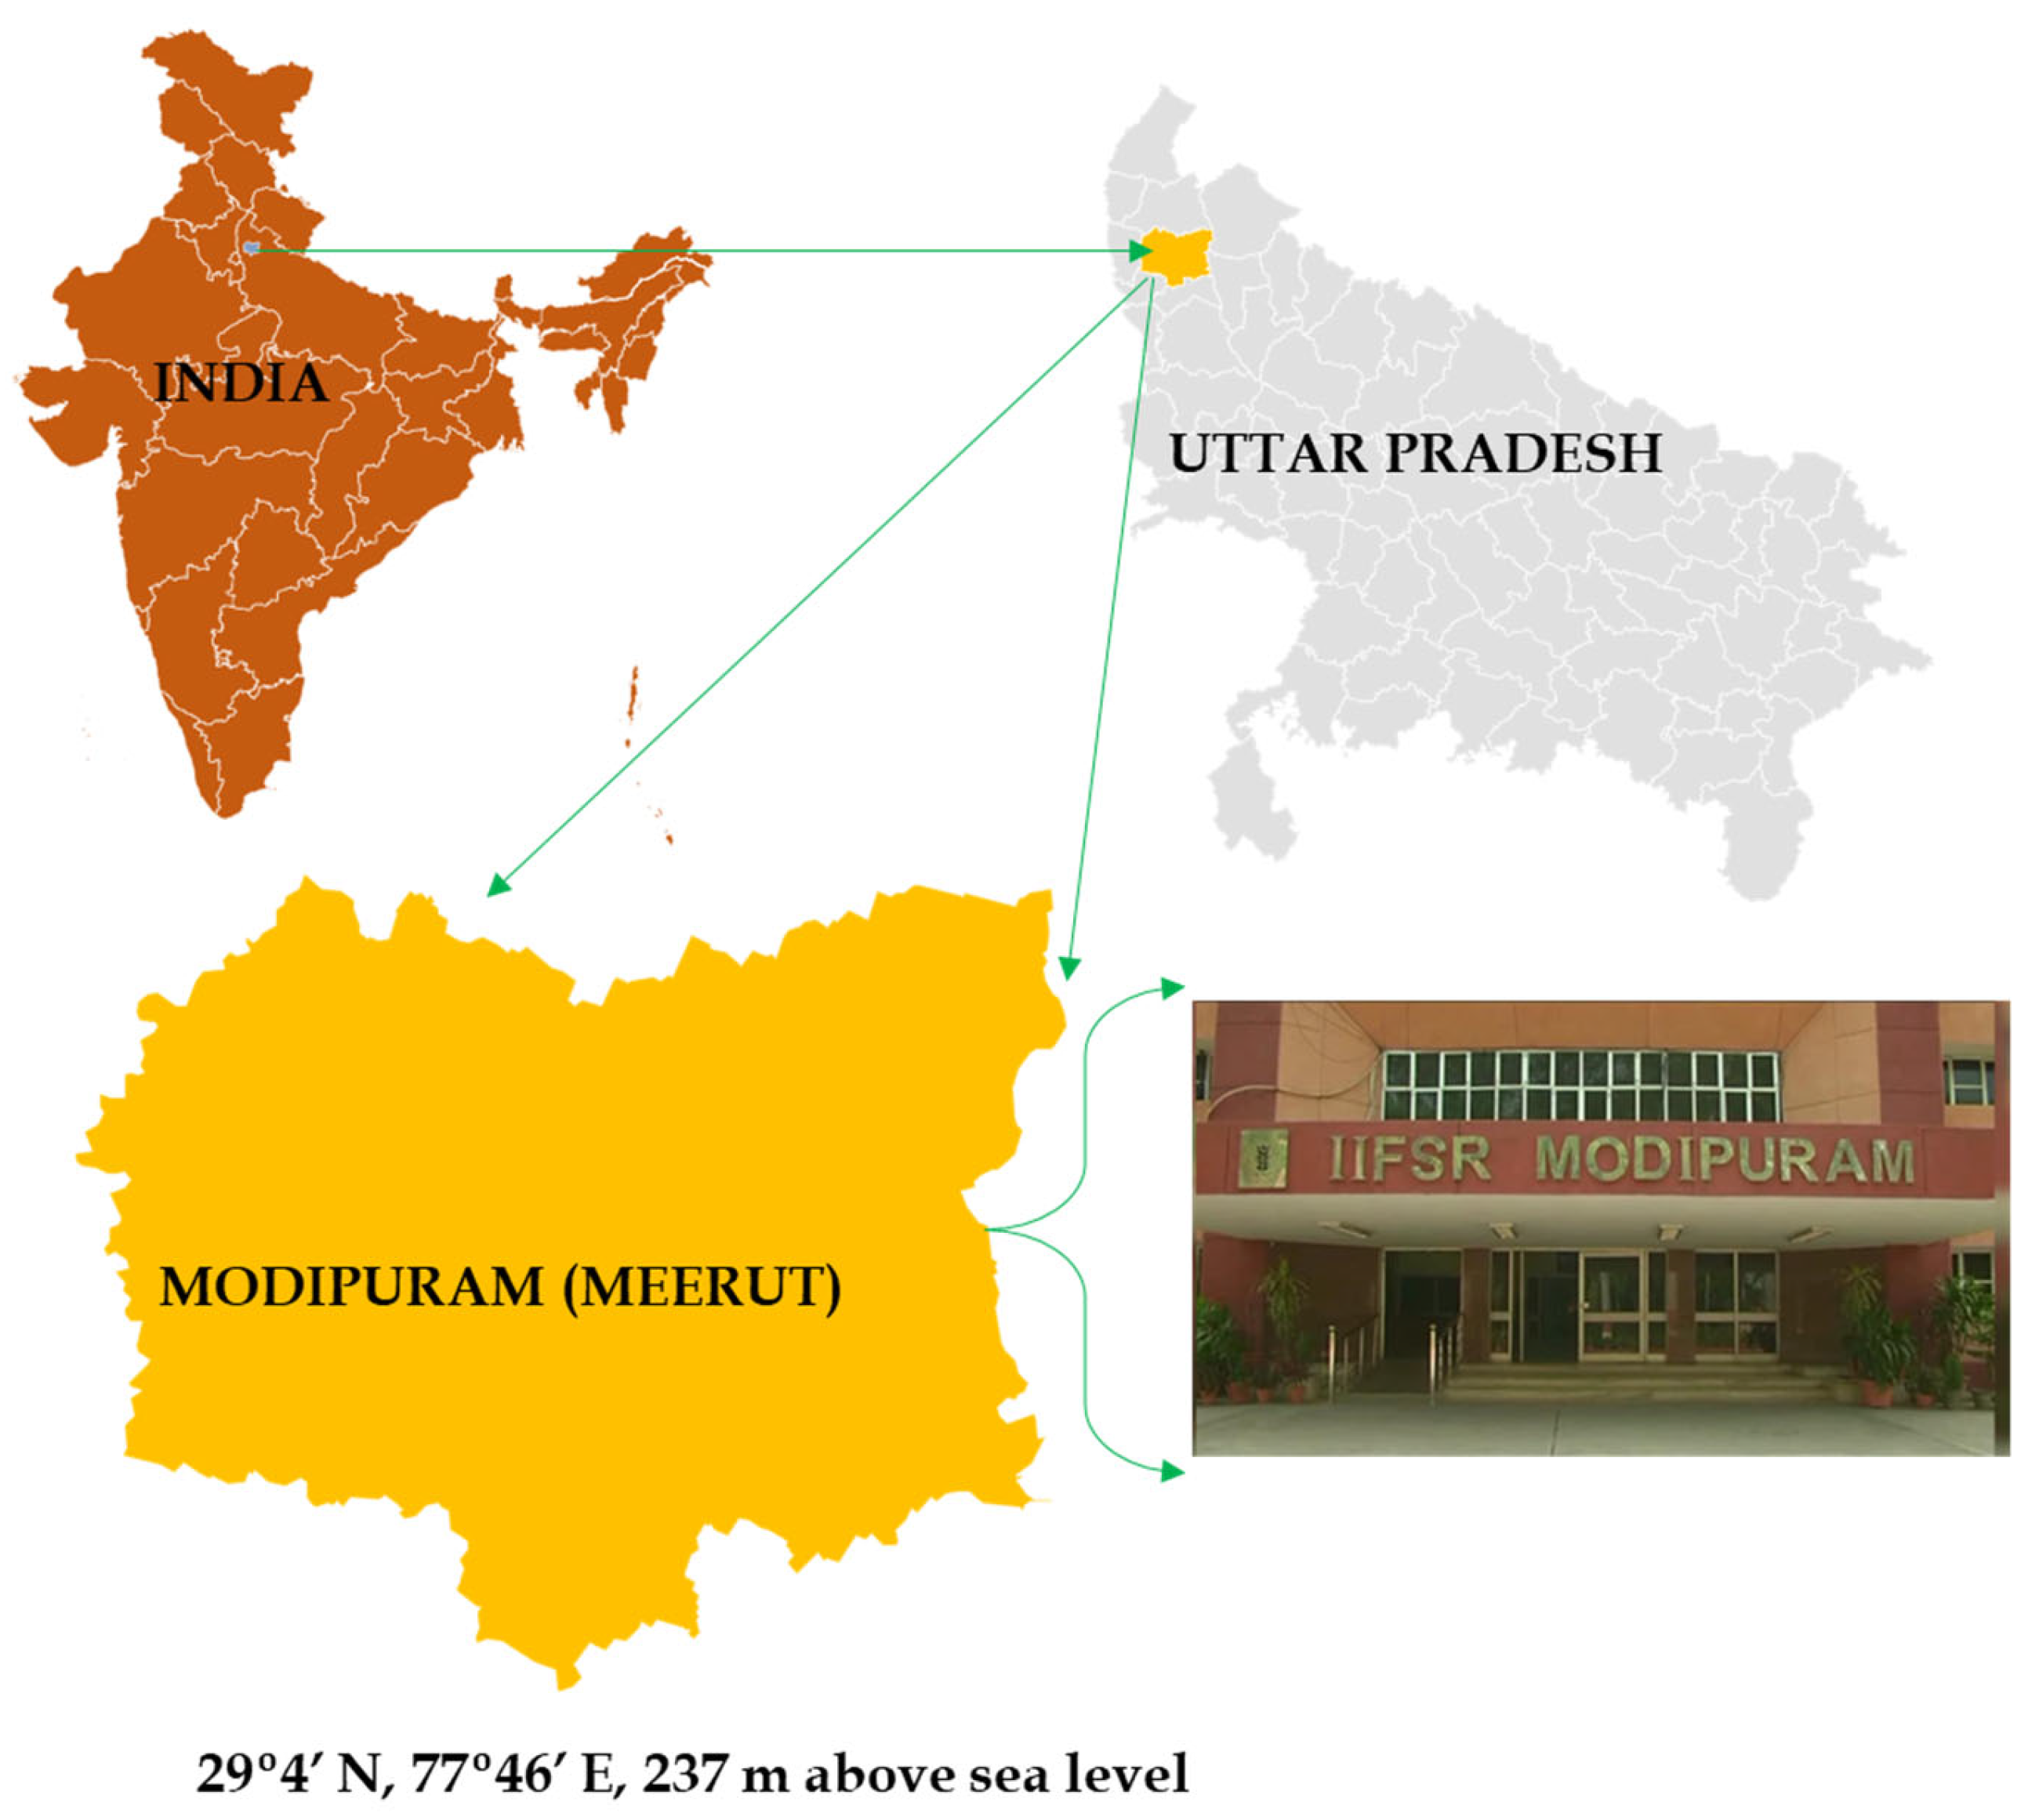
2.1. Site Descriptions

Ongoing long-term field experiment (starting year 1998) site of ICAR-Indian Institute of Farming Systems Research (29°4′ N, 77°46′ E, 237 m above sea level) was selected (Figure 2). The average monthly minimum (7.2 °C) and maximum (20.1 °C) temperatures in January and corresponding temperatures in May minimum (24.2 °C) and maximum (39.8 °C) with annual rainfall of 823 mm were recorded.

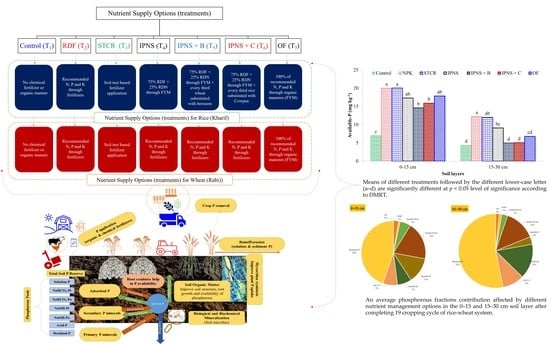
2.2. Treatments and Experimental Design

The long-term cropping system experiment involving different nutrient supply options under rice-wheat rotation is shown below (Table 1). The experiment was conducted in large plots (individual plot area 1000 m2). All treatments were Randomized Block Design (RBD) and four replications. Total seven nutrient supply options treatment were imposed in the long-term cropping system experiment as T1: control i.e., no chemical fertilizer or organic manure; T2: recommended fertilizer dose to rice and wheat; T3: soil-test based fertilizer application in both crops; T4: 75% of recommended N, P, and K through fertilizers +25% substitution of recommended N through FYM in rice and RDF in wheat crop; T5: 75% of recommended N, P, and K through fertilizers + 25% substitution of recommended N through FYM + every third wheat substituted with berseem for rice and RDF for wheat crop; T6: 75% of recommended N, P, and K through fertilizers + 25% substitution of recommended N through FYM + every third rice substituted with cowpea for rice and RDF for wheat crop; T7: 100% of recommended N, P, and K through organic manures (FYM) in both crops.

2.3. Collection, Processing, and Analysis of Soil Samples

After the completion of 19 cropping cycles at ICAR-IIFSR, Modipuram, Meerut four sets of four replicated samples of both surface (0–15 cm) and sub-surface (15–30 cm) soil layers were collected from all treatments during May 2016 after the harvesting of wheat crop with a core sampler (with a core of 3.9 cm diameter and 179.2 cm3 volume). The first set with four replications was used to measure soil bulk density. From the second set with four replications of undisturbed soil samples, a set of sub-samples with four replications was taken for determination of microbial biomass carbon. The soil samples of the third set were air-dried, ground in a wooden mortar and pestle, and sieved to pass through a 2 mm sieve. For analysis of different phosphorous fractions, sub-samples with four replications were taken and further sieved through a 0.2 mm sieve.

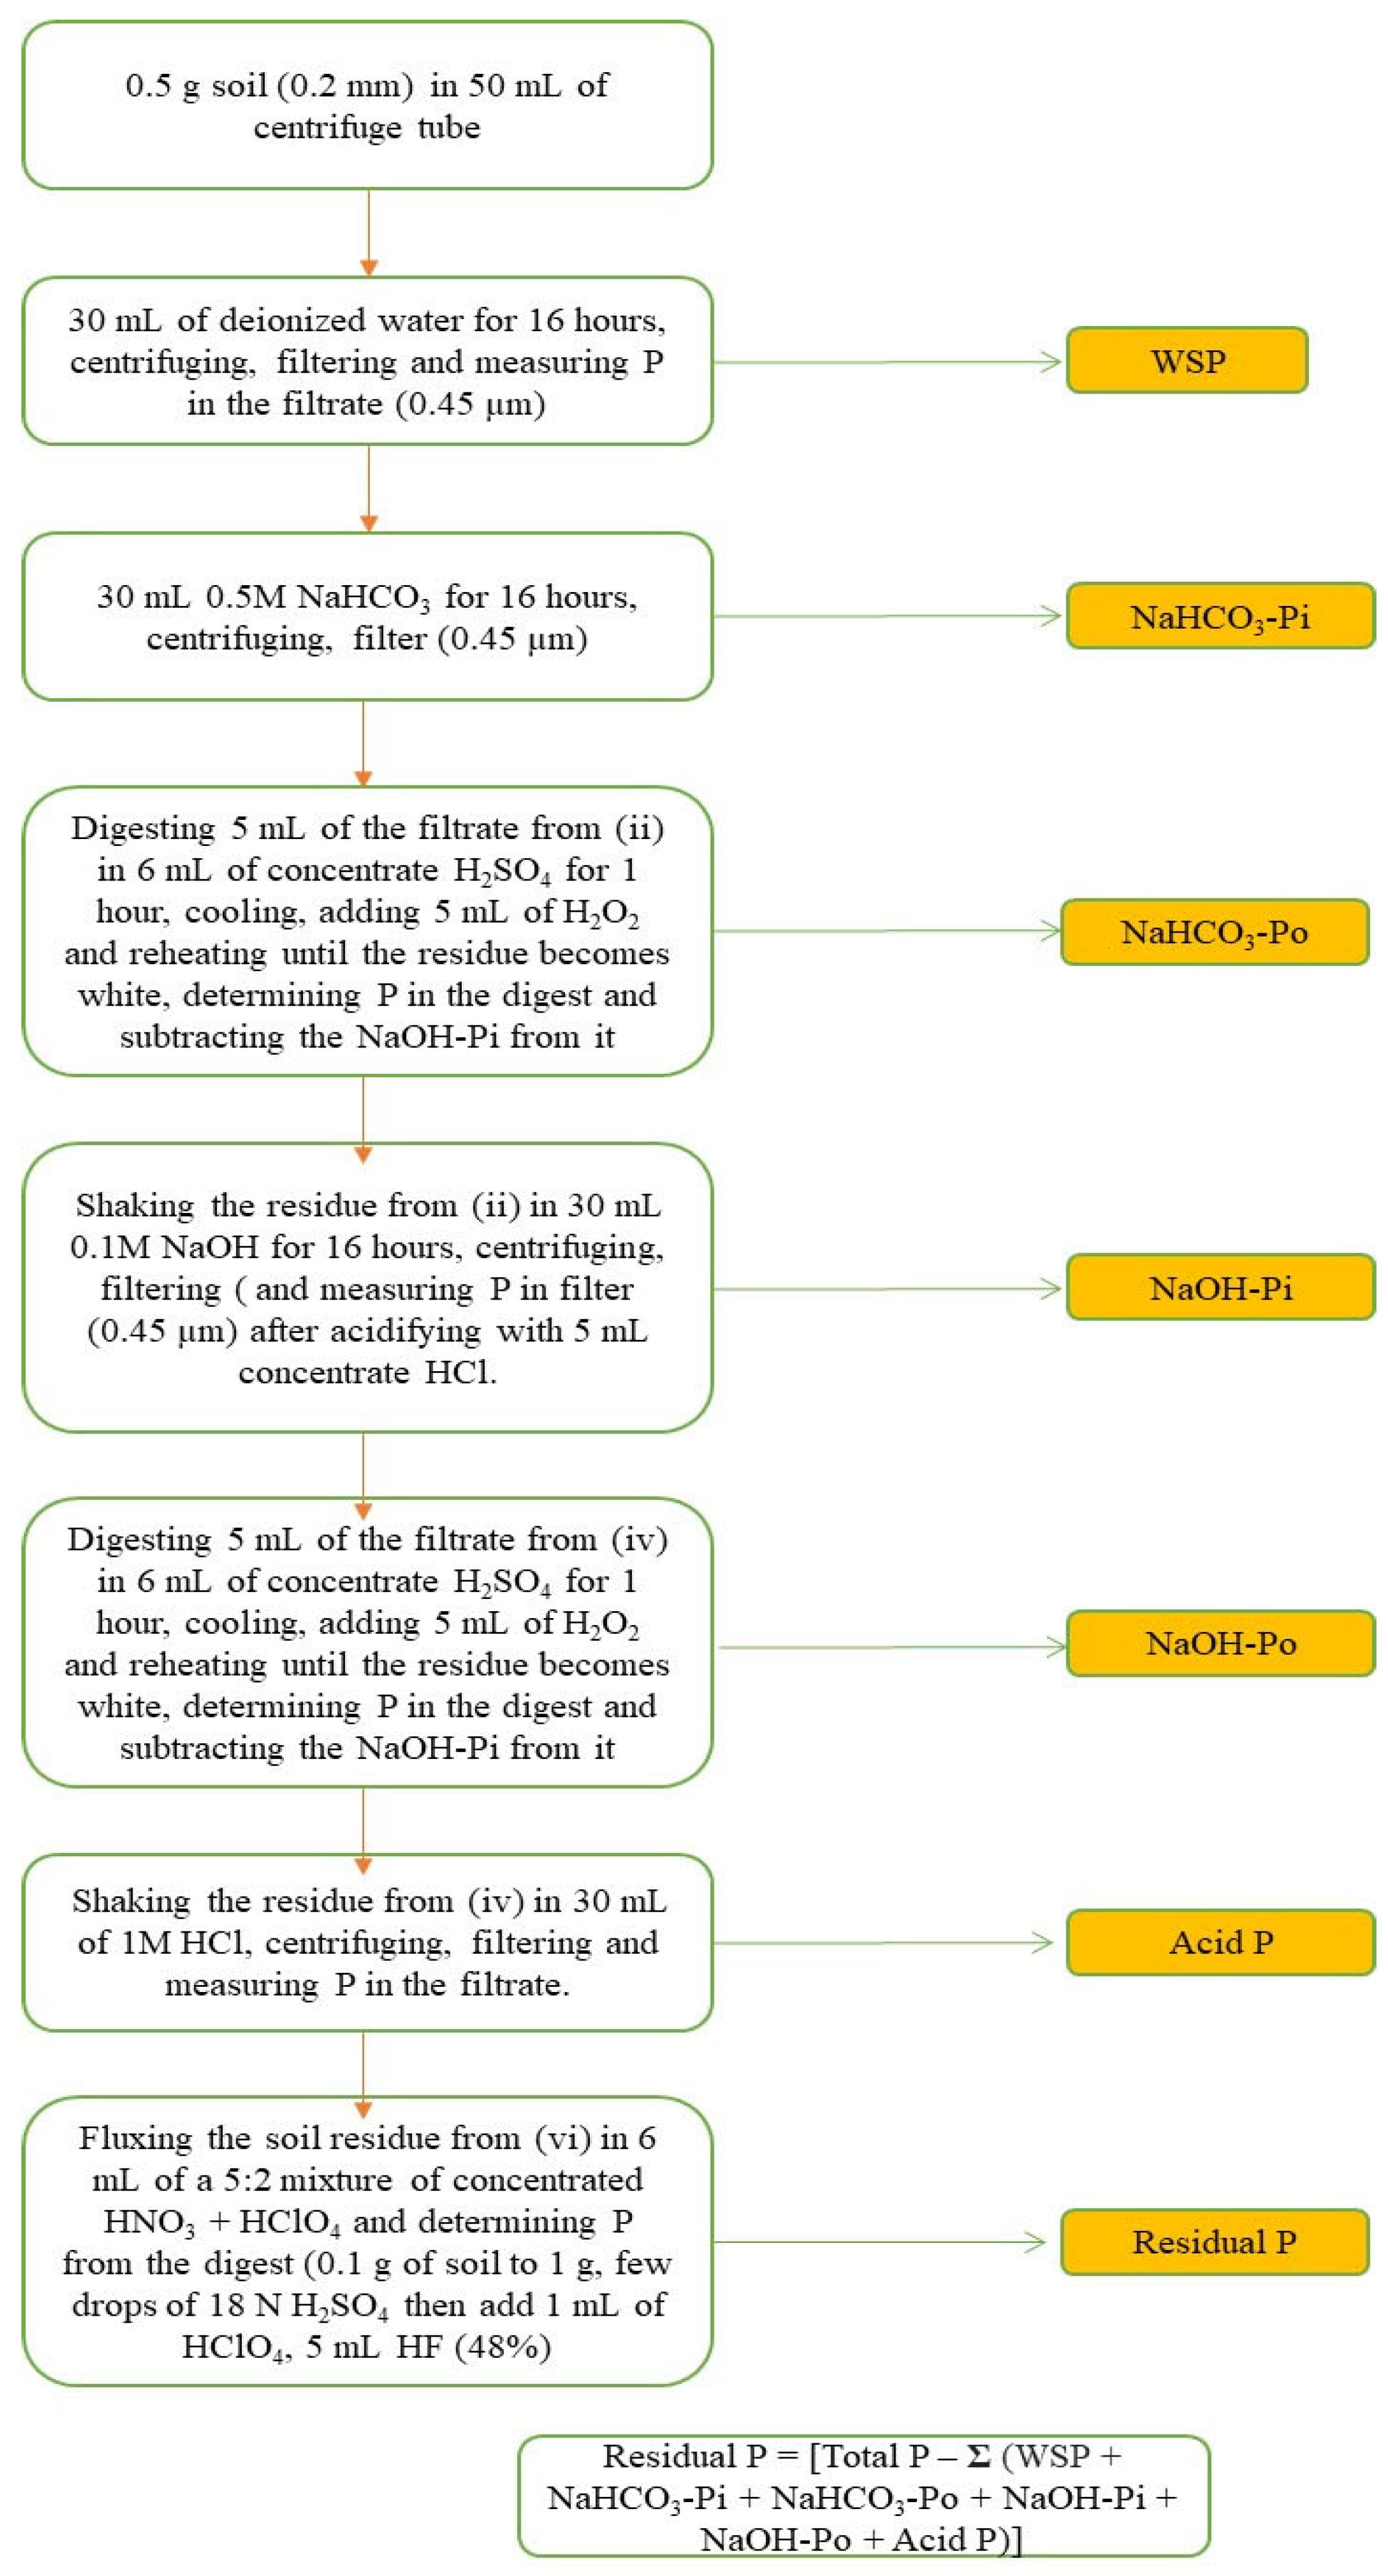
2.4. Modified Hedley Fractionation Method of Phosphorus

Sequential fractionation procedures have been used to characterize lability of soil and manure P based on susceptibility to extraction by a series of chemical compounds by adopted modified Hedley fractionation [31] (Figure 3). The soil P fractions are measured in sequence: (i) solution P, by shaking 0.5 g soil (0.2 mm) in 30 mL of deionized water for 16 h, centrifuging, filtering and measuring P in the filtrate; (ii) NaHCO3-P, by shaking the residue from (i) in 30 mL 0.5 M NaHCO3 for 16 h, centrifuging, filtering and measuring P in the filtrate; (iii) NaHCO3-Po, by digesting 5 mL of the filtrate from (ii) in 6 mL of concentrate H2SO4 for 1 h, cooling, adding 5 mL of H2O2 and reheating until the residue becomes white, determining P in the digest and subtracting the NaOH-Pi from it; (iv) NaOH-Pi, by shaking the residue from (ii) in 30 mL 0.1 M NaOH for 16 h, centrifuging, filtering and measuring P in the filtrate after acidifying with 5 mL concentrate HCl; (v) NaOH-Po, by digesting 5 mL of the filtrate from (iv) in 6 mL of concentrate H2SO4 for 1 h, cooling, adding 5 mL of H2O2 and reheating until the residue becomes white, determining P in the digest and subtracting the NaOH-Pi from it; (vi) acid-P, by shaking the residue from (iv) in 30 mL of 1 M HCl, centrifuging, filtering and measuring P in the filtrate; (vii) residual-P, by fluxing the soil residue from (vi) in 6 mL of a 5:2 mixture of concentrated HNO3 and HClO4 and determining P from the digest (0.1 g soil to 1 g, few drops of 18 N H2SO4 then add 1 mL of HClO4, 5 mL HF (48%). Teflon crucible 70% covered place on sand bath at 200–250 °C, evaporates to dryness 1 to 1.5 h then cooling. Repeat all the steps 2–3 times. Add a few drops of H2SO4 to make volume 5 mL 6 N HCl, adding boiling water for 0.5 h. Yellowish solution is final color filter with Whatman Filter Paper number-42 final volume 100 mL (1000 times dilution). All P was figured out colorimetrically after neutralization, when necessary, with dilute HCl and NaOH and the neutral pH indicated by the slight yellowish colour of the solution in the presence of p-nitrophenol indicator. Absorbance of P was figured out at a wavelength 712 nm by spectrophotometer.

2.5. Statistical Analysis

The generated data were processed for analysis of variance (ANOVA) and Duncan’s multiple range test (DMRT) was used to compare the differences between the means using as applicable to randomized block design to assess differences among the treatment means as described by Gomez and Gomez [32]. Correlation coefficients were computed using SPSS programme (SPSS version 16) (SPSS 1990).

3. Result and Discussion

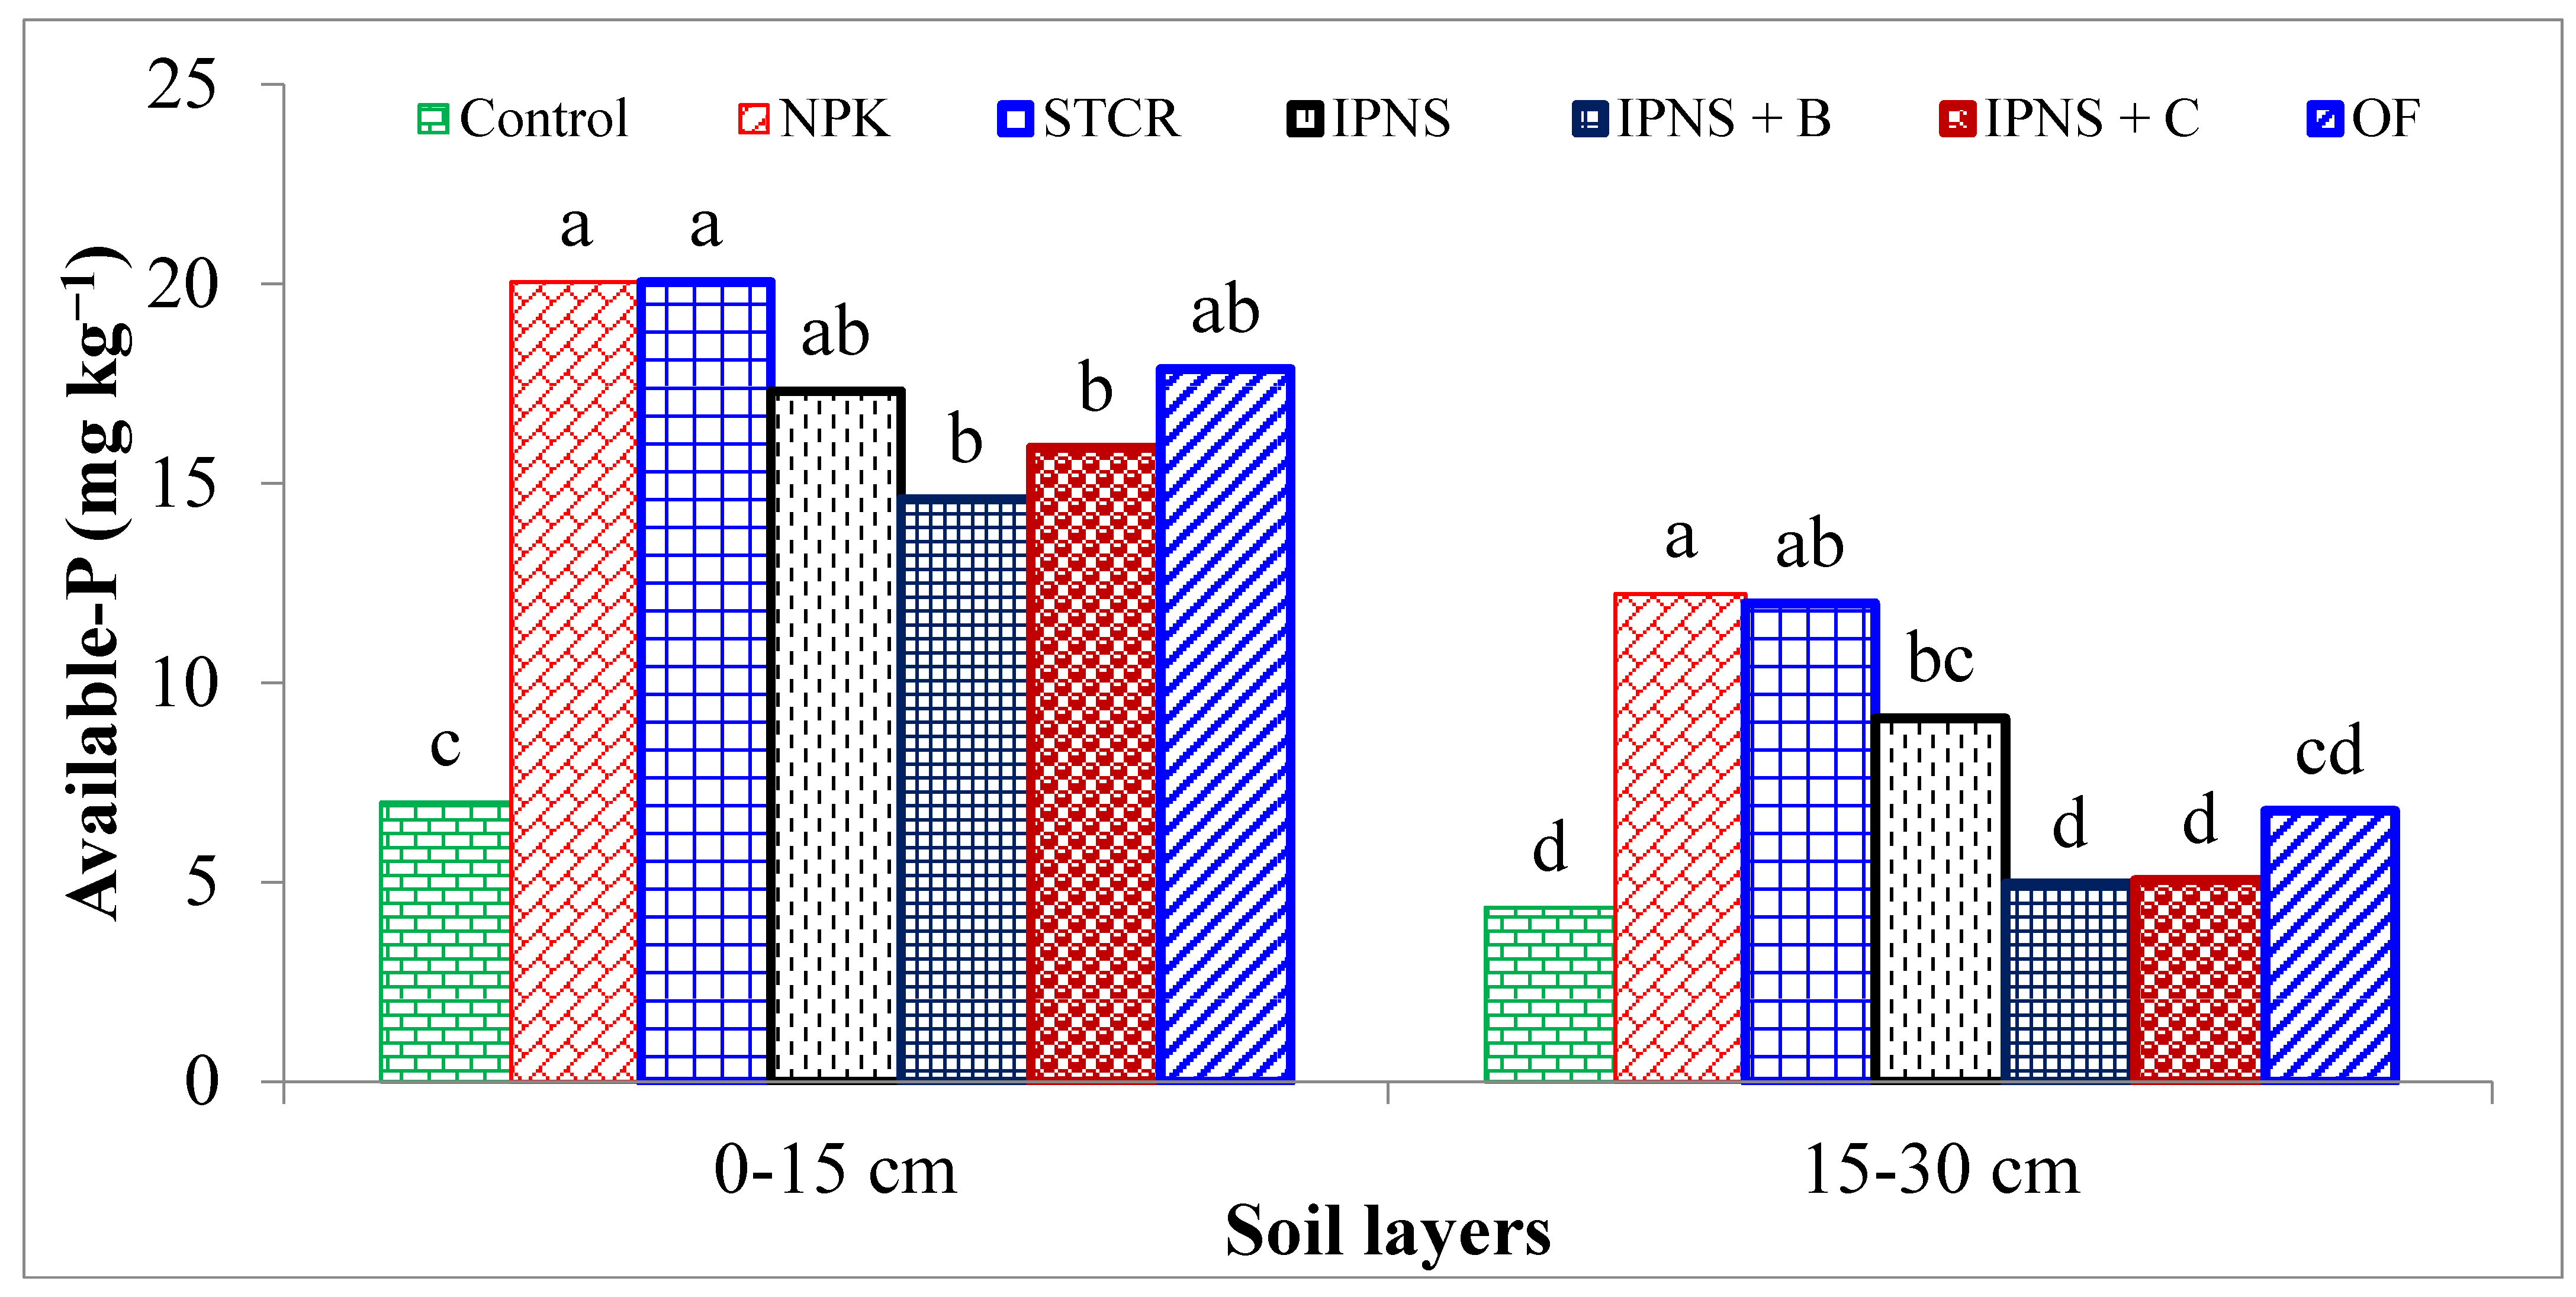
3.1. Effect of Long-Term Nutrients Supply Options on Soil Available Phosphorus

Results showed that the effect of long-term fertilization on soil available-P in the 0–15 and 15–30 cm soil layer of rice-wheat system significantly (p < 0.05) influenced the availability of P-availability in 0–15 and 15–30 cm soil layer (Figure 4). Plot with the treatment with NPK and STCR showed significant (p < 0.05) superiority over the rest of the treatment with the availability of 20.04 mg kg−1 available-P in 0–15 cm soil layer followed by the OF (17.89 mg kg−1), IPNS (17.31 mg kg−1), IPNS + C (15.90 mg kg−1), IPNS + B (14.61 mg kg−1), and the significant (p < 0.05) as well as lowest (7.01 mg kg−1) phosphorous availability was observed in the control plot; it was ~36% lower in comparison to the NPK- and STCR-treated plots (Figure 4).
Similarly, in case of 15–30 cm soil layers, results suggested that the plot with NPK treatment found maximum (12.23 mg kg−1) available-P; it was on par with the STCR (12.00 mg kg−1) followed by the IPNS (9.10 mg kg−1), OF (6.79 mg kg−1), IPNS + C (5.05 mg kg−1), IPNS + B (4.96 mg kg−1), and the lowest (4.36 mg kg−1) was recorded in the control plot. The plot treated with NPK showed significant (p < 0.05) superiority by 35.65% over the control treatment (Figure 4). It could be due to the P-solubilization by native efficient rhizosphere microbes [33], and pulses naturally promote to improving soil system [34].

3.2. Effect of Long-Term Nutrients Supply Options on Water Soluble Phosphorous (WSP)

Results observed that the long-term nutrient management practices significantly (p < 0.05) influenced the P-pools in 0–15 and 15–30 cm soil layers under the rice-wheat system (Table 2 and Table 3). The availability of water soluble phosphorous (WSP) was significantly (p < 0.05) influenced by the long-term nutrient management options. WSP also acts as extremely sensitive indicators that reflect the availability of phosphorous in soil system. However, the WSP content of P-pools vary considerably. WSP was ordinarily estimated to have ~7% of P-pools. WSP significantly (p < 0.05) varied from 4.64 to 8.95 mg P kg−1 under different nutrient management options in the 0–15 cm soil layer. Maximum (8.95 mg P kg−1) WSP contain was observed under IPNS + B plot followed by the IPNS (8.67 mg P kg−1), IPNS + C (8.50 mg P kg−1), STCR (5.57 mg P kg−1), OF (5.02 mg P kg−1); however, the significantly (p < 0.05) lowest (4.64 mg P kg−1) WSP was recorded in the control treatment. The treatment with IPNS + B showed its significant (p < 0.05) superiority by ~ 52% over the untreated control plot of rice-what system under long-term nutrient supply options (Table 2). Similarly, in the 15–30 cm soil layer, WSP varied from 3.45 to 7.44 mg P kg−1 among different treatment combination. Maximum WSP was recorded in IPNS + C (7.44 mg P kg−1) treated plot followed by IPNS (6.01 mg P kg−1) > IPNS + B (5.91 mg P kg−1) > STCR (5.19 mg P kg−1) > OF (4.87 mg P kg−1) > NPK (4.57 mg P kg−1) and control (3.45 mg P kg−1) treatment (Table 3). It was observed that a significant (p < 0.05) improvement in WSP and other P-pools by integrated nutrient management [35].

3.3. Effect of Long-Term Nutrients Supply Options on NaHCO3-Pi

In the case of the sodium bicarbonate inorganic soluble phosphorous (NaHCO3-Pi), it was significantly (p < 0.05) varied from 8.71 to 37.20 mg P kg−1 among the long-term different nutrient management practices (Table 2 and Table 3). The significantly (p < 0.05) highest (37.20 mg P kg−1) NaHCO3-Pi was recorded under the organic farming (OF) management practices; this treatment combination showed its significant (p < 0.05) superiority over the rest of the treatment combination. The availability of NaHCO3-Pi was recorded in the following order OF (37.20 mg P kg−1) > IPNS + C (28.49 mg P kg−1) > IPNS + B (23.43 mg P kg−1) > IPNS (20.89 mg P kg−1) > NPK (17.73 mg P kg−1) > STCR (17.41 mg P kg−1) and control (8.71 mg P kg−1) treated plots. However, in the case of 15–30 cm soil layer, the amount of NaHCO3-Pi was significantly (p < 0.05) varied from 6.33 to 18.58 mg P kg−1 among different nutrient management in the rice-wheat system (Table 2). Significantly (p < 0.05) highest NaHCO3-Pi was recorded in IPNS + C (18.58 mg P kg−1) treated plot followed by IPNS (16.94 mg P kg−1) > IPNS + B (15.51 mg P kg−1) > OF (11.23 mg P kg−1) > STCR (11.09 mg P kg−1) > NPK (9.50 mg P kg−1) and control (6.33 mg P kg−1) treatment. Plot with IPNS + C showed its significant (p < 0.05) superiority over the rest of the treatment; it was ~34% higher in comparison to the untreated control plot (Table 3). The use of organic manure and IPNS options were also able to fix (Al-P, Ca-P, Fe-P) and to improve and prevent soil fixation, during the decomposition of organic matter and release of different acids that would help to release the P from a fixed form [36].

3.4. Effect of Long-Term Nutrients Supply Options on NaHCO3-Po

Results showed that the availability of sodium soluble bicarbonate organic phosphorous (NaHCO3-Po) significantly (p < 0.05) varied from 53.07 to 130.16 under different long-term nutrient supply options (Table 2 and Table 3). The significantly (p < 0.05) highest NaHCO3-Po was reported with the OF (130.16 mg P kg−1) followed by the IPNS + C (101.26 mg P kg−1), IPNS + B (83.80 mg P kg−1), IPNS (74.56 mg P kg−1), STCR (70.60 mg P kg−1), NPK (69.87 mg P kg−1), and the lowest (53.07 mg P kg−1) was recorded with untreated control plot under long-term nutrient management options. The plot with organic farming (OF) management significantly (p < 0.05) showed superiority by ~41% over the untreated control treatment (Table 2).
Nevertheless, in case of 15–30 cm soil layer, amount of NaHCO3-Po was significantly (p < 0.05) varied from 48.83 to 83.76 mg P kg−1 among different long-term nutrient supply options under rice-wheat system. Maximum NaHCO3-Po was recorded in IPNS + C (83.76 mg P kg−1) followed by IPNS + B (83.36 mg P kg−1) > IPNS (68.81 mg P kg−1) > OF (64.55 mg P kg−1) > NPK (62.30 mg P kg−1) > STCR (59.67 mg P kg−1) and the significantly (p < 0.05) lowest (48.83 mg P kg−1) amount of NaHCO3-Po was found under the control plot. Plot with IPNS + C showed its significant (p < 0.05) superiority (+58%) over the control plot (Table 3). The significantly (p < 0.05) lowest value of NaHCO3-Po observed under control plot, which might be due to continuous removal of P from soil P reserve without any replenishment through fertilizers [37].

3.5. Effect of Long-Term Nutrients Supply Options on NaOH-Pi

Data revealed that the fraction of sodium hydroxide inorganic soluble phosphorous (NaOH-Pi) significantly (p < 0.05) varied from 31.13 to 88.22 mg P kg−1 among different nutrient management practices under long-term rice-wheat system (Table 2 and Table 3). The significantly (p < 0.05) highest (88.22 mg P kg−1) NaOH-Pi was observed in organic farming (OF) management treatment followed by the IPNS + B (76.76 mg P kg−1), IPNS + C (70.40 mg P kg−1), IPNS (64.58 mg P kg−1), STCR (53.13 mg P kg−1), NPK (52.22 mg P kg−1) and control (31.13 mg P kg−1) plots. The plot with OF management showed its significant (p < 0.05) superiority over the rest of the treatment combination under long-run of rice-wheat system (Table 2).
Meanwhile, in case of 15–30 cm soil layer results showed that the concentration of NaOH-Pi ranged from 8.04 to 25.85 mg P kg−1 under different nutrient management. Significantly (p < 0.05) highest NaOH-Pi was recorded in IPNS + C (25.85 mg P kg−1) followed by IPNS + B (24.76 mg P kg−1) > IPNS (21.31 mg P kg−1) > OF (18.40 mg P kg−1) > NPK (9.95 mg P kg−1) > STCR (9.13 mg P kg−1), while the significant (p < 0.05) lowest amount of NaOH-Pi was recorded in the control (8.04 mg P kg−1) treatment. One treatment (IPNS + C) showed its significant (p < 0.05) superiority over the rest of the treatments; it was ~31% higher as compared to control treatment (Table 3). This reflection could be credited to the differences in the native efficient rhizospheric microbes in relation to different nutrient supply options [21].

3.6. Effect of Long-Term Nutrients Supply Options on NaOH-Po

In the case of sodium hydroxide organic soluble phosphorous (NaOH-Po), the significantly (p < 0.05) highest (57.84 mg P kg−1) was observed in the untreated control plot; it showed its significant superiority of the rest of the treatment combination (Table 2 and Table 3). NaOH-Po fractions significant (p < 0.05) varied from 48.33 to 57.84 mg P kg−1 among different nutrient management practices under long-term rice-wheat system. Data testified that NaOH-Po fraction was observed in following order control > NPK > STCR > IPNS > IPNS + C, IPNS + B, and the lowest was recorded in the OF management portions (Table 2).
Nevertheless, in the case of 15–30 cm soil layer, the concentration of NaOH-Po significantly varied from 68.70 to 83.68 mg P kg−1 among different nutrient supply options in rice-wheat system (Table 3). Significantly (p < 0.05) higher NaOH-Po content was recorded with IPNS + C (83.68 mg P kg−1) treated plots, followed by IPNS + B (78.05 mg P kg−1) > IPNS (73.41 mg P kg−1) > OF (72.39 mg P kg−1) > NPK (75.12 mg P kg−1) > STCR (74.94 mg P kg−1), and the significantly lower (68.70 mg P kg−1) value of NaOH-Po was reported with control plot. Plot with IPNS + C showed its significant (p < 0.05) superiority over the rest of treatment combination under long-term rice-wheat system over the periods. Some of the soil inorganic-P removed by crops was probably converted to organic-P in decomposed [38,39,40].

3.7. Effect of Long-Term Nutrients Supply Options on HCl-P

Data revealed that the hydrochloric acid soluble phosphorous (HCl-P) significantly (p < 0.05) varied from 29.28 to 50.08 mg P kg−1 among the different nutrient supply options under long-run of rice-wheat system (Table 2 and Table 3). Significantly (p < 0.05) highest HCl-P was observed in the OF (50.08 mg P kg−1) management practiced followed by the IPNS + B (46.74 mg P kg−1), IPNS + C (44.69 mg P kg−1), IPNS (44.49 mg P kg−1), NPK (37.47 mg P kg−1), STCR (36.41 mg P kg−1), and control (29.28 mg P kg−1) plot. OF showed its significant superiority by ~ 58% over the untreated control plot. However, in the case of 15–30 cm soil layer, the concentration of HCl-P significantly (p < 0.05) varied from 27.20 to 55.41 mg P kg−1 under different management practices (Table 2). Maximum concentration of HCl-P was observed under IPNS + B (55.41 mg P kg−1) treated plots, followed by IPNS + C (53.94 mg P kg−1) > IPNS (53.19 mg P kg−1) > OF (48.95 mg P kg−1) > NPK (46.44 mg P kg−1) > STCR (44.67 mg P kg−1) and lowest (27.20 mg P kg−1) value of HCl-P was reported in the control plot. The plot with IPNS + C showed its significant superiority over the rest of treatment combination under long-term rice-wheat system over the periods; it was ~49% higher concentration over the control plot (Table 3). The HCl-P fraction included (Ca-P) similarly residual-P incused occluded P [36]. Comparable results also reported by De Schrijver et al. [41] and Haokip et al. [40].

3.8. Effect of Long-Term Nutrients Supply Options on Residual Phosphorous

The case of the residual-P is the largest fraction contribution among all P-pools. It was significantly (p < 0.05) varying among the different long-run treatment options ranged 252.30 to 312.04 mg P kg−1 (Table 2 and Table 3). Residual-P was influenced significantly by different nutrient supply options, and it was reported in following order IPNS + C (312.04 mg P kg−1) > OF (304.69 mg P kg−1) > STCR (301.01 mg P kg−1) > IPNS + B (288.14 mg P kg−1) > IPNS (275.74 mg P kg−1) > NPK (267.38 mg P kg−1) and control (252.30 mg P kg−1). Similarly, in the 15–30 cm soil layer, the soil significantly (p < 0.05) varied from 231.16 to 299.17 mg P kg−1 among different treatment combination (Table 3). Maximum residual-P was recorded in IPNS + C (299.17 mg P kg−1) treated plot followed by OF (287.22 mg P kg−1) > IPNS + B (272.52 mg P kg−1) > IPNS (256.43 mg P kg−1) > STCR (253.63 mg P kg−1) > NPK (246.78 mg P kg−1) and significantly lowest (231.16 mg P kg−1) amount of residual-P was recorded with control treatment. It was ~ 22% higher as compared to control treatment (Table 3). The impact of residual-P compared to other fractions significantly (p < 0.05) varied among the treatment due to acidification under rhizospheric conditions [42].

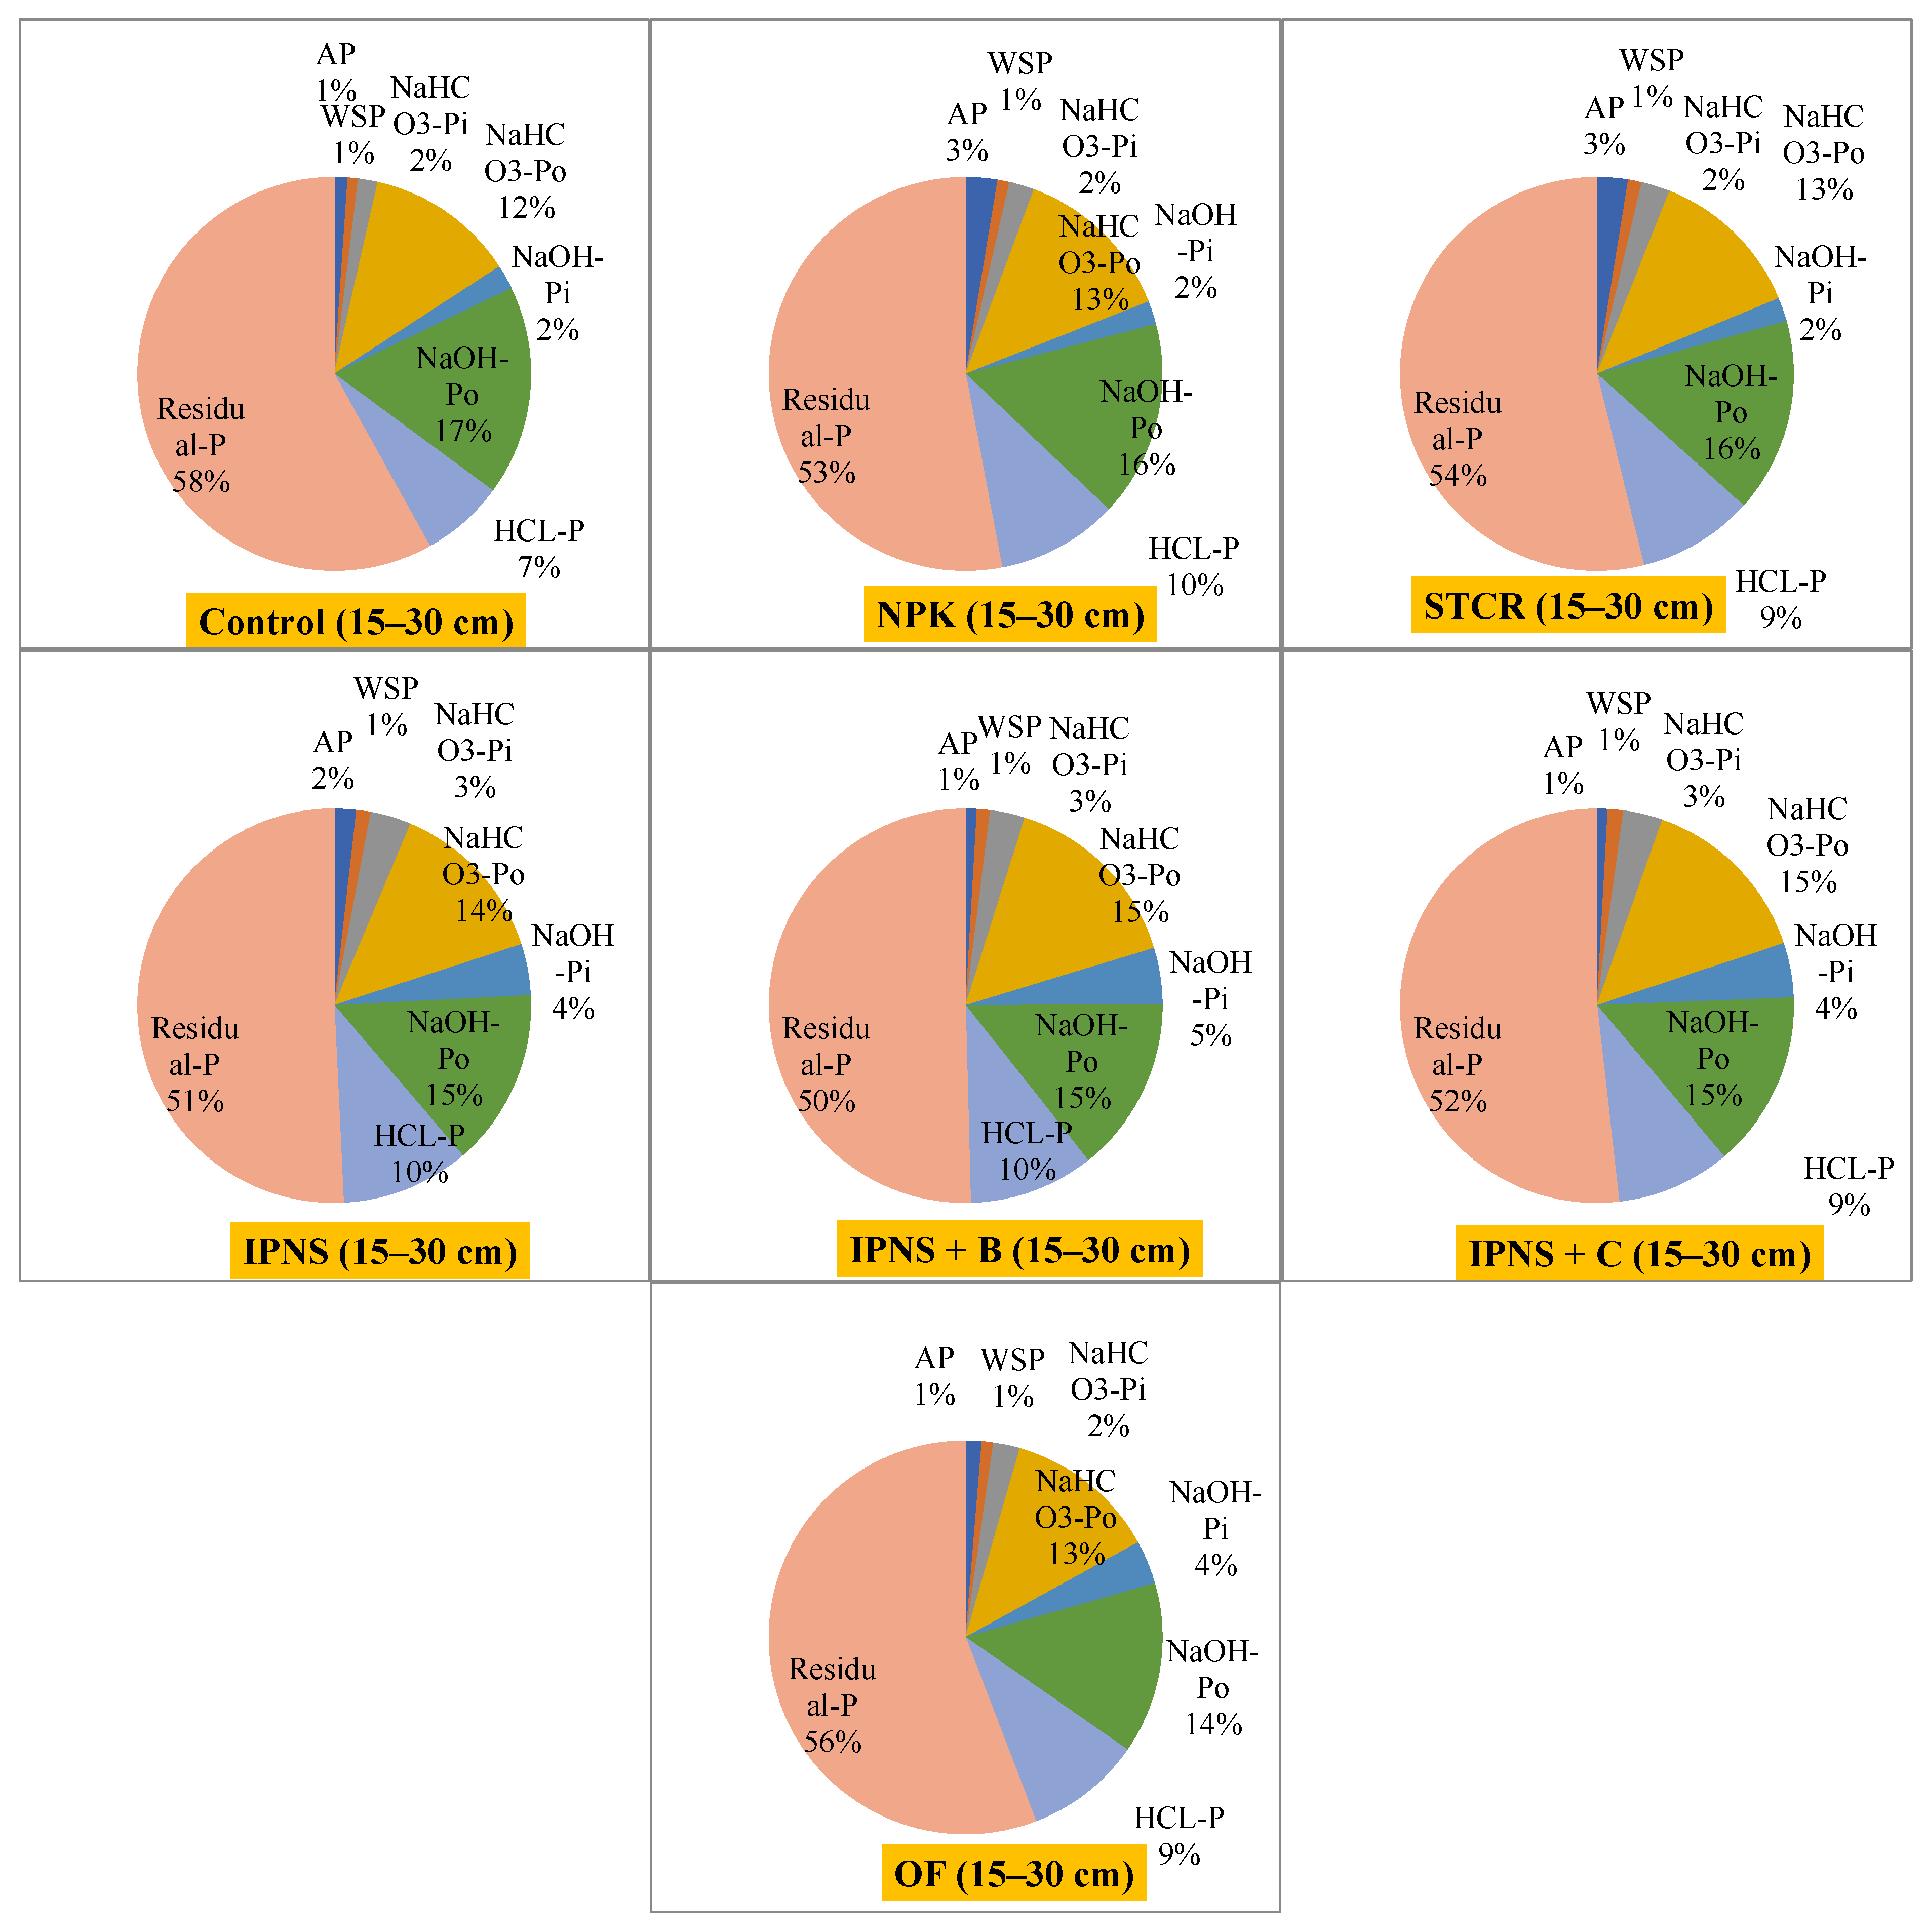
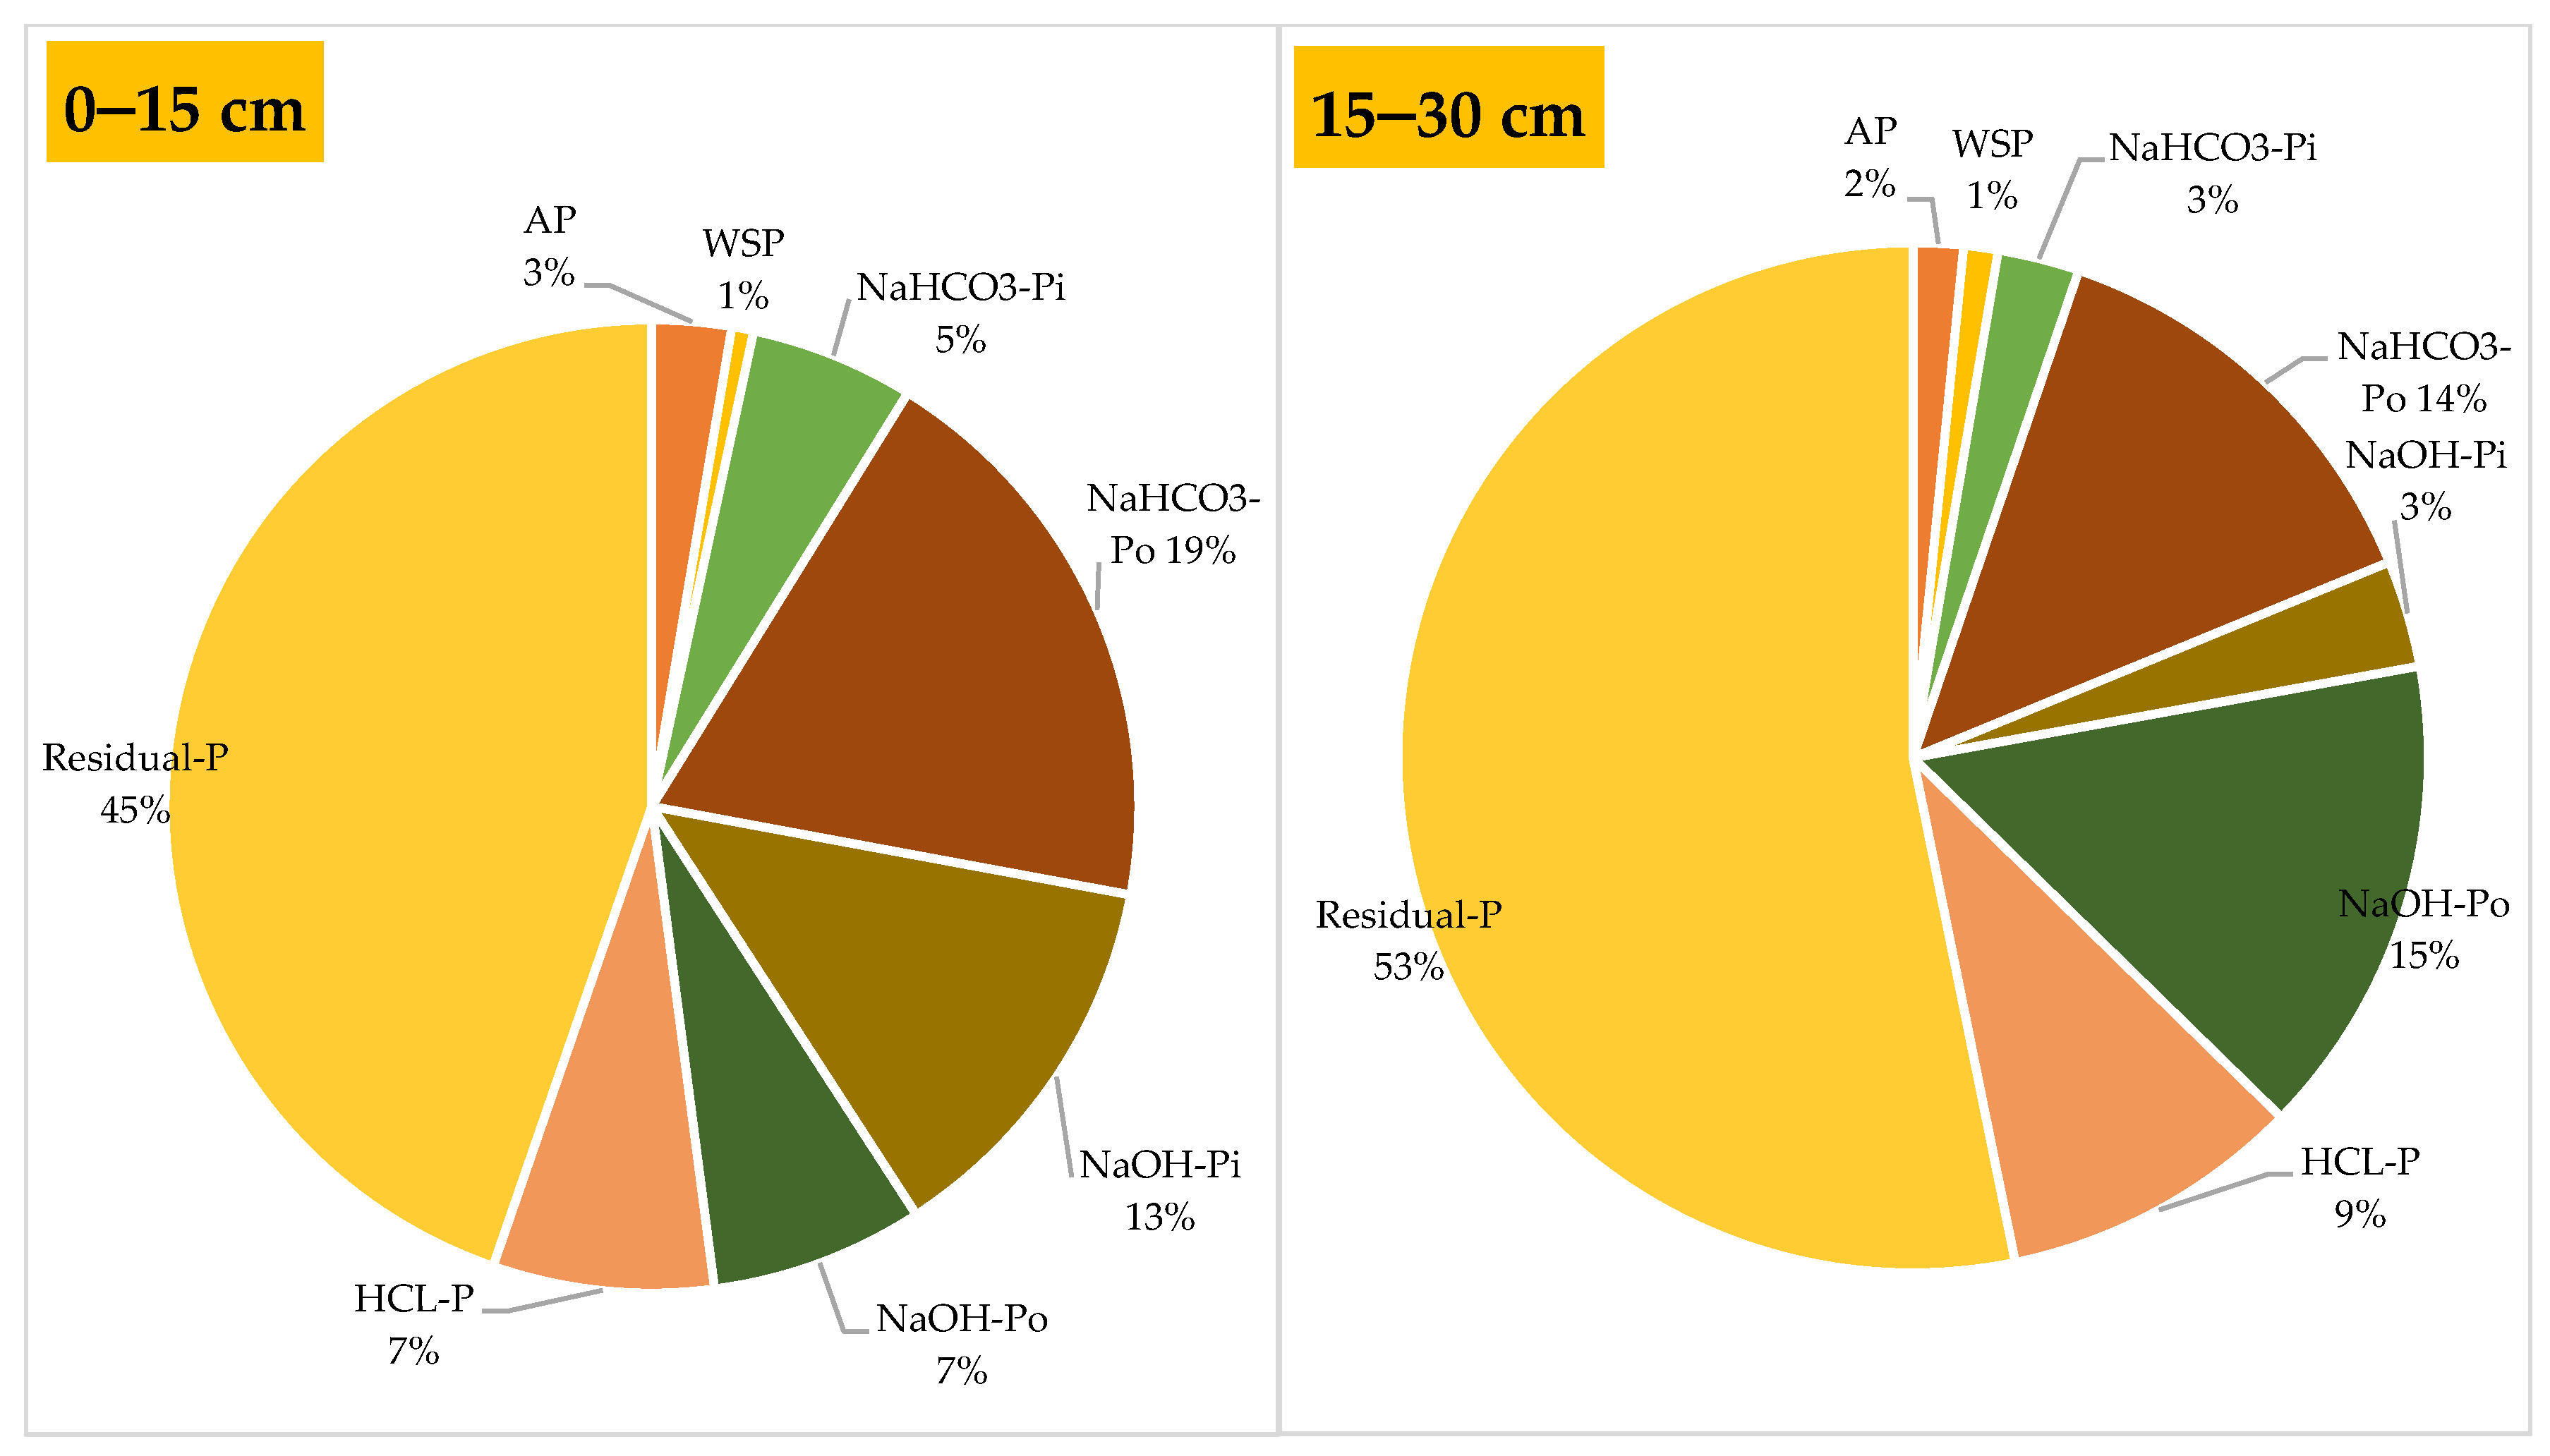
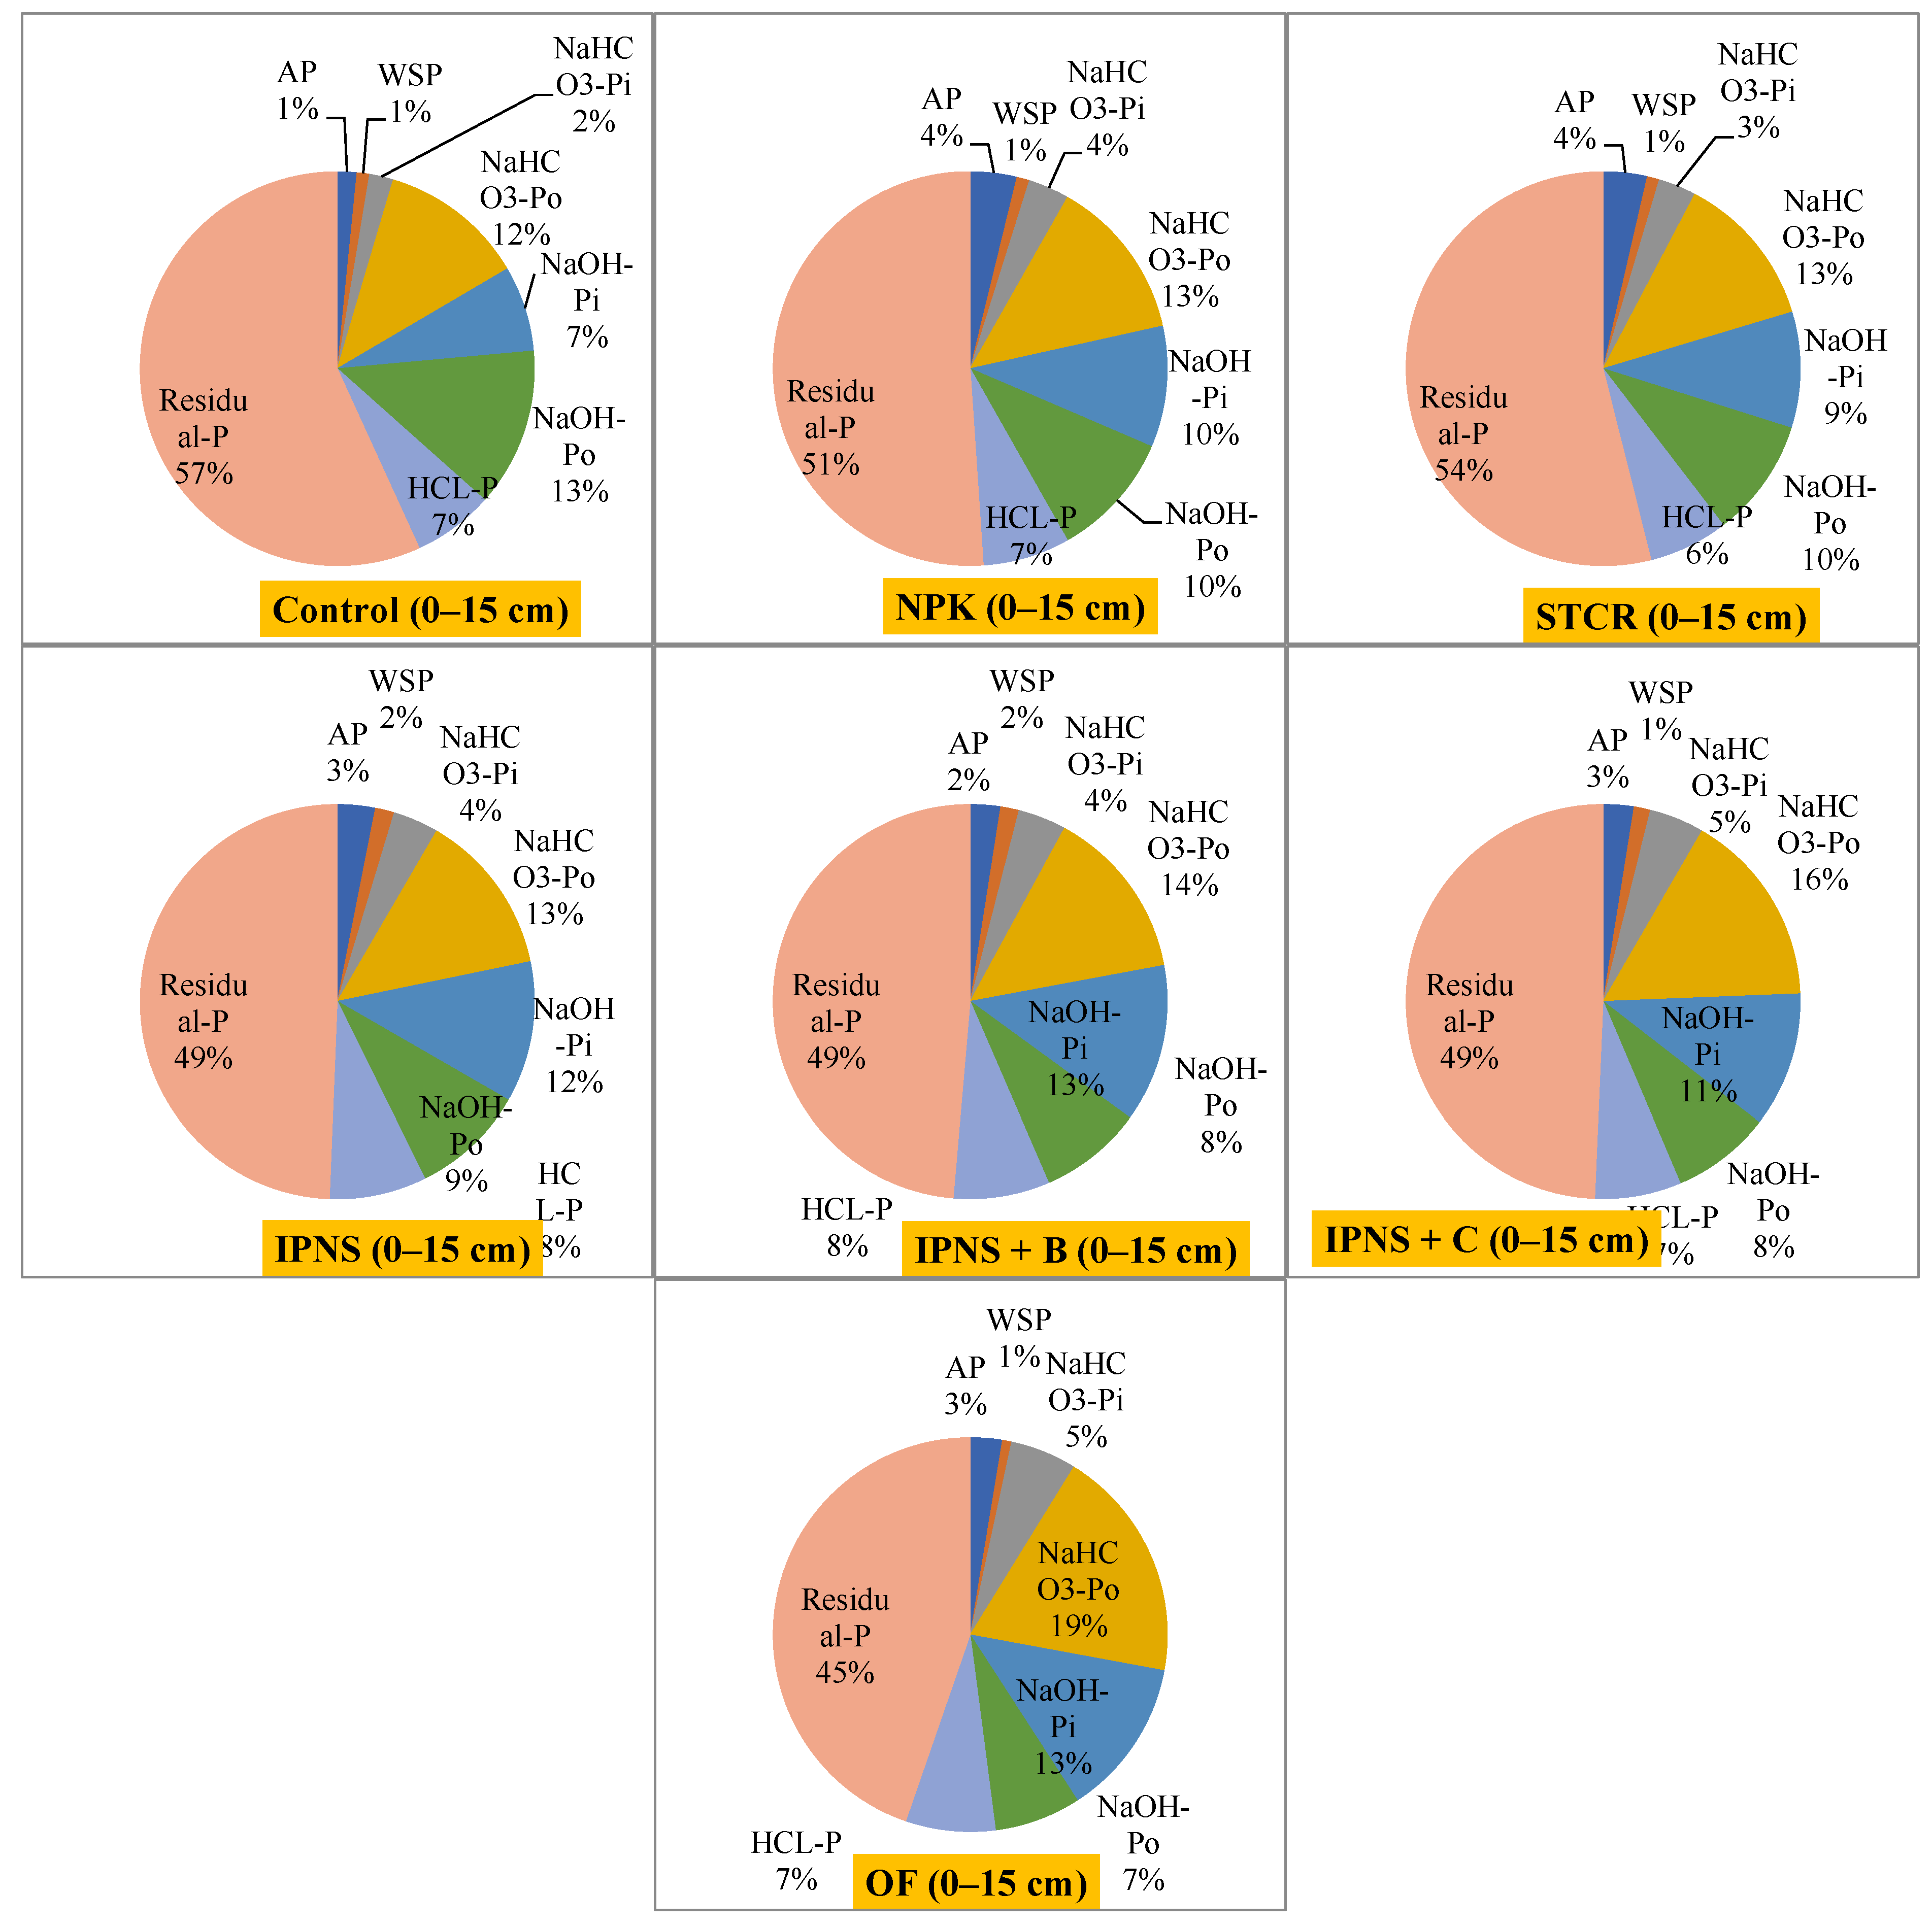
3.9. Effect of Long-Term Nutrients Supply Options on Soil Phosphorus Fractions Contribution

Results showed that highest residual-P was recorded in the control (57%), followed by STCR (54%), NPK (51%), IPNS, IPNS + B and IPNS + C (49% each) and lowest was reported in OF (45%). Similarly, second most dominated P fractions was NaHCO3-Po and it was recoded in following order OF > IPNS > IPNS + C > IPNS + B > NPK ≥ STCR > control (Figure 5).
Meanwhile, in the case of 15–30 cm soil layer, it was seen that residual-P was the dominant P-fractions and reported in following order control (58%) > OF (56%) > STCR (54%) > NPK (53%) > IPNS + C (52%) > IPNS (51%) > IPNS (50%) (Figure 6). However, the second most dominant P fraction was NaHCO3-Po; it was reported in the following order: IPNS + C ≥ IPNS + B > IPNS > OF ≥STCR ≥ NPK > control (Figure 6).
Data showed that residual phosphorus and NaHCO3-Po were the dominant P-fractions in both soil layer after the completing 19 system cycles (Figure 7). In the case of 0–15 cm soil layer the maximum (45%) contributed by residual-P followed by the NaHCO3-Po (19%), NaOH-Pi (13%), both HCl-P and NaOH-Po (7%), NaHCO3-Pi > AP (3%) and lowest contribution by WSP (1%) under different long-term nutrient supply options of rice-wheat system over the periods (Figure 7). Nevertheless, in the case of 15–30 cm soil layers, it was reported in following order residual-P (53%) > NaOH-Po (15%) > NaHCO3-Po (14%) > HCl-P (9%) > NaOH-Pi (3%) ≥ NaHCO3 (3%), > AP (2%) and lowest contribution by WSP (1%) under different nutrient management practices (Figure 7). An average phosphorous fraction contribution in 0–15 cm soil layer was registered in the following order: residual-P (45%) > NaHCO3-Po (19%) > NaOH-Pi (13%) > NaOH-Po and HCl-P (7% each) > NaHCO3-Pi (5%) > AP (3%) and lowest contribution by WSP (1%) (Figure 7). However, in the case of 15–30 cm soil layer, it was reported in following order: residual-P > NaOH-Po > NaHCO3-Po > HCl-P > NaHCO3-Pi ≥ NaOH-Pi > AP > WSP (Figure 7). These results correspond with those presented by Henríquez and Killorn [43]. IPNS options improve nutrient availabilities [44,45,46].

3.10. Relationship between P-Fractions

Relationship between different P fractions significantly influenced by different IPNS options (Table 4). NaHCO3-Pi fraction had a significant positive relationship with NaHCO3-Po (r = 0.985 **), NaHCO3-Pi (r = 0.946 *), HCl-P (r = 0.915 **), residual-P (r = 0.784 *), meanwhile with NaOH-Po has significantly negative relationship (r = −0.946 **). The case of NaHCO3-Po significantly correlated with NaOH-Pi (r = 0.892 **), HCl-P (r = 0.844 *), residual-P (r = 0.760 *); however, NaOH-Po had significantly negative correlations (r = −0.892 **). Similarly, NaOH-Pi significant positive correlated with NaOH-Po (r = 1.00 **) and HCl-P (r = 0.986 **). However, NaOH-Po had significant negative relationship (r = −0.986 **). The results corroborate the findings of Haokip et al. [40], Subehia et al. [46] and Chowdhury et al. [47].

4. Conclusions and Recommendations

Results suggested that integrated plant nutrition system strategies have the potential to improve P-availability, and that the co-management of integrated plant nutrition system and organic farming options led to higher P-availability (+12%) as compared to soil test crop response (STCR) in rice-wheat system after completing 19 cropping cycles. The reduction in P-availability in control and recommended dose of fertilizer (RDF) were lower than that of IPNS + berseem and cowpea (IPNS + B and IPNS + C). Better strategies for best nutrient management practices and other innovative IPNS management strategies need to be developed and applied to improve the P-availability in soil systems. The contributions to phosphorus availability were shown to be residual-P (49%) followed by NaHCO3-Po (19%), NaOH-Pi (13%), NaOH-Po and HCl-P (7%), Na-HCO3-Pi (5%), available-P (3%), and WSP (1%). In the case of 15–30 cm soil layers, it was shown to be residual-P (53%), NaOH-Po (15%), NaHCO3-Po (14%), HCl-P (9%), NaHCO3-Pi and NaOH-Pi (3%), available-P (2%), and WSP (1%) under different long-term nutrient supply options of rice-wheat system after the completion of 19 cropping cycles.
Overall results suggested that STCR, organic farming, integrated plant nutrition system + berseem, and cowpea have the potential to support P dynamics. When legumes (cowpea and berseem) were grown every three years, nutrient availabilities to plants were positive in both integrated plant nutrition system options. Concerning legume integration, higher P-availability (+12%) was found as compared to the control plot after the completion of 19 cropping cycles.

Author Contributions

S.K.M.: investigation, data curation, writing—original draft, visualization. B.S.D.: conceptualization, investigation, supervision. M.C.M.: software, review, editing, supervision. S.P.D.: conceptualization, investigation, supervision. V.K.S.: conceptualization, investigation, methodology, supervision. R.P.M.: methodology, investigation, data curation, maintenance. D.C.: methodology, investigation, review, editing, supervision. A.D.: software, formal and data analysis, editing. V.S.M.: data curation, writing, review, visualization, editing. All authors have read and agreed to the published version of the manuscript.

Funding

This research has received no external funding.

Institutional Review Board Statement

Not applicable.

Informed Consent Statement

Not applicable.

Data Availability Statement

The data that support the findings of this study are available from the corresponding author upon reasonable request.

Acknowledgments

We thank ICAR-IIFSR, Modipuram for sharing the ongoing long-term experiment.

Conflicts of Interest

All authors agree with the no potential conflicts of interest on financially or non-financially, directly or indirectly related to the work, are relevant in all fields of science for publishing this manuscript.

References

  1. European Commission. Study on the EU’s List of Critical Raw Materials (Final Report); European Commission: Brussels, Belgium, 2020.
  2. UNEP. Emerging Issues in Our Global Environment. UNEP Year Book-2011; United Nations Environment Programme: Nairobi, Kenya, 2011; Available online: http://www.unep.org/yearbook/2011 (accessed on 30 January 2022).
  3. FAO Statistical Yearbook. Africa Food and Agriculture, Part-2: Hunger Dimension; Food and Agricultural Organizations of the United Nations: Rome, Italy, 2014; Available online: http://www.fao.org/3/a-i3620e.pdf (accessed on 5 February 2022).
  4. Chowdhury, R.B.; Zhang, X. Phosphorus use efficiency in agricultural systems: A comprehensive assessment through the review of national scale substance flow analyses. Ecol. Indic. 2021, 121, 107172. [Google Scholar] [CrossRef]
  5. Chowdhury, R.B.; Chakraborty, P. Magnitude of anthropogenic phosphorus storage in the agricultural production and the waste management systems in the regional and country scales. Environ. Sci. Pollut. Res. 2016, 23, 15929–15940. [Google Scholar] [CrossRef] [PubMed]
  6. Chowdhury, R.B.; Moore, G.A.; Weatherley, A.J.; Arora, M. A novel substance flow analysis model for analysing multi-year phosphorus flow at the regional scale. Sci. Total Environ. 2016, 572, 1269–1280. [Google Scholar] [CrossRef] [PubMed]
  7. Chowdhury, R.B.; Moore, G.A.; Weatherley, A.J. A multi-year phosphorus flow analysis of a key agricultural region in Australia to identify options for sustainable management. Agric. Syst. 2018, 161, 42–60. [Google Scholar] [CrossRef]
  8. Chowdhury, R.B.; Moore, G.A.; Weatherley, A.J.; Arora, M. A review of recent substance flow analyses of phosphorus to identify priority management areas at different geographical scales. Resour. Conserv. Recycl. 2014, 83, 213–228. [Google Scholar] [CrossRef]
  9. UNDP. Sustainable Development Goals (SDGs); United Nations Development Programme: New York, NY, USA, 2016; Available online: http://www.undp.org/content/undp/en/home/sdgoverview/post-2015-development-agenda.html (accessed on 30 January 2022).
  10. Woolston, C. Healthy people, healthy planet. Nature 2020, 588, S54–S56. [Google Scholar] [CrossRef]
  11. Eisenstein, M. Natural solutions for agricultural productivity. Nature 2020, 588, S58–S59. [Google Scholar] [CrossRef]
  12. Puggaard, L.; Lund, P.; Liesegang, A.; Sehested, J. Long term effect of reduced dietary phosphorus on feed intake and milk yield in dry and lactating dairy cows. Livest. Sci. 2014, 159, 18–28. [Google Scholar] [CrossRef]
  13. Bindraban, P.S.; Dimkpa, C.O.; Pandey, R. Exploring phosphorus fertilizers and fertilization strategies for improved human and environmental health. Biol. Fertil. Soils 2020, 56, 299–317. [Google Scholar] [CrossRef] [Green Version]
  14. Leinweber, P.; Bathmann, U.; Buczko, U.; Douhaire, C.; Eichler-Löbermann, B.; Frossard, E.; Ekardt, F.; Jarvie, H.; Krämer, I.; Kabbe, C.; et al. Handling the phosphorus paradox in agriculture and natural ecosystems: Scarcity, necessity, and burden of P. Ambio 2018, 47, 3–19. [Google Scholar] [CrossRef] [Green Version]
  15. Liu, G.; Deng, L.; Wu, R.; Guo, S.; Du, W.; Yang, M.; Bian, J.; Liu, Y.; Li, B.; Chen, F. Determination of nitrogen and phosphorus fertilisation rates for tobacco based on economic response and nutrient concentrations in local stream water. Agric. Ecosyst. Environ. 2020, 304, 107136. [Google Scholar] [CrossRef]
  16. Suh, S.; Yee, S. Phosphorus use-efficiency of agriculture and food system in the US. Chemosphere 2011, 84, 806–813. [Google Scholar] [CrossRef] [PubMed]
  17. Sutton, M.A.; Bleeker, A.; Howard, C.M.; Bekunda, M.; Grizzetti, B.; de Vries, W.; van Grinsven, H.J.M.; Abrol, Y.P.; Adhya, T.K.; Billen, G.; et al. Our Nutrient World: The Challenge to Produce More Food and Energy with Less Pollution; Centre for Ecology and Hydrology (CEH): Edinburgh, UK; United Nations Environment Program (UNEP): Nairobi, Kenya, 2013. [Google Scholar]
  18. FAO. Current World Fertilizer Trends and Outlook to 2015; Food and Agriculture Organisation of the United Nations: Rome, Italy, 2011; Available online: http://ftp.fao.org/ag/agp/docs/cwfto15.pdf (accessed on 5 February 2022).
  19. Minemakers Limited. Rock Phosphate Price Rockets to Us$200/Tonne. Feasibility Planning Initiated on the Wonarah Project, Northern Territory. ASX and Press Release, 9 January 2008; Minemakers Limited (ABN 48116296541): West Perth, Australia, 2008; Available online: http://www.minemakers.com.au/downloads/News/080109RockPhosphatePriceSkyRockets.pdf (accessed on 5 February 2022).
  20. ACCC (Australian Competition and Consumer Commission). ACCC Examination of Fertiliser Prices; Australian Competition and Consumer Commission: Canberra, Australia, 2008. Available online: http://www.accc.gov.au/publications/accc-examination-of-fertiliser-prices (accessed on 30 January 2022).
  21. Liu, E.; Yan, C.; Mei, X.; He, W.; Bing, S.H.; Ding, L.; Liu, Q.; Liu, S.; Fan, T. Long-term effect of chemical fertilizer, straw, and manure on soil chemical and biological properties in northwest China. Geoderma 2010, 158, 173–180. [Google Scholar] [CrossRef]
  22. The Guardian. Soaring Fertiliser Prices Threaten World’s Poorest Farmers; The Guardian: London, UK, 2008; Available online: http://www.theguardian.com/environment/2008/aug/12/biofuels.food (accessed on 30 January 2022).
  23. Bononi, L.; Chiaramonte, J.B.; Pansa, C.C.; Moitinho, M.A.; Melo, I.S. Phosphorus-solubilizing Trichoderma spp. from Amazon soils improve soybean plant growth. Sci. Rep. 2020, 10, 2858. [Google Scholar]
  24. Castagno, L.N.; Sannazzaro, A.I.; Gonzalez, M.E.; Pieckenstain, F.L.; Estrella, M.J. Phosphobacteria as key actors to overcome phosphorus deficiency in plants. Ann. Appl. Biol. 2021, 178, 256–267. [Google Scholar] [CrossRef]
  25. Ch’ng, H.Y.; Ahmed, O.H.; Majid, N.M.A. Improving phosphorus availability in an acid soil using organic amendments produced from agroindustrial wastes. Sci. World J. 2014, 2014, 506356. [Google Scholar] [CrossRef]
  26. Duboc, O.; Hernandez-Mora, A.; Wenzel, W.W.; Santner, J. Improving the prediction of fertilizer phosphorus availability to plants with simple, but non-standardized extraction techniques. Sci. Total Environ. 2021, 806, 150486. [Google Scholar] [CrossRef]
  27. Nandan, R.; Poonia, S.P.; Singh, S.S.; Nath, C.P.; Kumar, V.; Malik, R.K.; McDonald, A.; Hazra, K.K. Potential of conservation agriculture modules for energy conservation and sustainability of rice-based production systems of Indo-Gangetic Plain region. Environ. Sci. Pollut. Res. 2021, 28, 246–261. [Google Scholar] [CrossRef]
  28. Bhatt, R.; Kukal, S.S.; Busari, M.A.; Arora, S.; Yadav, M. Sustainability issues on rice-wheat cropping system. Int. Soil Water Conserv. Res. 2016, 4, 64–67. [Google Scholar] [CrossRef] [Green Version]
  29. Montpellier Panel Report. Sustainable Intensification: A New Paradigm for Africa Agriculture. Agriculture for Impact, 15 Princes Gardens; South Kensington Campus, Imperial College: London, UK, 2013; Available online: https://ag4impact.org/wp-content/uploads/2013/04/MP_0176_Report_Redesign_2016.pdf (accessed on 29 July 2019).
  30. Muller, A.; Schader, C.; El-Hage Scialabba, N.; Brüggemann, J.; Isensee, A.; Erb, K.-H.; Smith, P.; Klocke, P.; Leiber, F.; Stolze, M.; et al. Strategies for feeding the world more sustainably with organic agriculture. Nat. Commun. 2017, 8, 1290. [Google Scholar] [CrossRef] [Green Version]
  31. Zhao, Y.; Li, Y.; Yang, F. Critical review on soil phosphorus migration and transformation under freezing-thawing cycles and typical regulatory measurements. Sci. Total Environ. 2021, 751, 141614. [Google Scholar] [CrossRef] [PubMed]
  32. Levy, E.T.; Schlesinger, W.H. A comparison of fractionation methods for forms of phosphorus in soils. Biogeochemistry 1999, 47, 25–38. [Google Scholar] [CrossRef]
  33. Gomez, K.A.; Gomez, A.A. Statistical Procedures for Agricultural Research; John Wiley and Sons: New York, NY, USA, 1984; 680p. [Google Scholar]
  34. Alori, E.T.; Glick, B.R.; Babalola, O.O. Microbial phosphorus solubilization and its potential for use in sustainable agriculture. Front. Microbiol. 2017, 8, 971. [Google Scholar] [CrossRef] [PubMed] [Green Version]
  35. FAO. Pulses and Climate Change; Food and Agriculture Organization of the United Nations: Rome, Italy, 2016; Available online: http://www.fao.org/fileadmin/user_upload/pulses-2016/docs/factsheets/Climate_EN_PRINT.pdf (accessed on 30 January 2022).
  36. Ohno, T.; Hoskins, B.R.; Erich, M.S. Soil organic matter effects on plant available and water-soluble phosphorus. Biol. Fert. Soils 2007, 43, 683–690. [Google Scholar] [CrossRef]
  37. Bhattacharyya, P.N.; Jha, D.K. Plant growth-promoting rhizobacteria (PGPR): Emergence in agriculture. World J. Microbiol. Biotechnol. 2012, 28, 1327–1350. [Google Scholar] [CrossRef]
  38. Meena, M.D.; Biswas, D.R. Phosphorus and potassium transformations in soil amended with enriched compost and chemical fertilizers in a wheat–soybean cropping system. Commun. Soil Sci. Plant Anal. 2014, 45, 624–652. [Google Scholar] [CrossRef]
  39. Reddy, D.; Kushwah, S.; Srivastava, S.; Khamparia, R.S. Long-term wheat residue management and supplementary nutrient input effects on phosphorus fractions and adsorption behavior in a Vertisol. Commun. Soil Sci. Plant Anal. 2014, 45, 541–554. [Google Scholar] [CrossRef]
  40. Haokip, I.C.; Dwivedi, B.S.; Meena, M.C.; Datta, S.P.; Jat, H.S.; Dey, A.; Tigga, P. Effect of conservation agriculture and nutrient management options on soil phosphorus fractions under maize-wheat cropping system. J. Indian Soc. Soil Sci. 2020, 68, 45–53. [Google Scholar] [CrossRef]
  41. Cross, A.F.; Schlesinger, W.H. A literature review and evaluation of the. Hedley fractionation: Applications to the biogeochemical cycle of soil phosphorus in natural ecosystems. Geoderma 1995, 64, 197–214. [Google Scholar] [CrossRef]
  42. De Schrijver, A.; Vesterdal, L.; Hansen, K.; De Frenne, P.; Augusto, L.; Achat, D.L.; Staelens, J.; Baeten, L.; De Keersmaeker, L.; De Neve, S.; et al. Four decades of post-agricultural forest development have caused major redistributions of soil phosphorus fractions. Oecologia 2012, 169, 221–234. [Google Scholar] [CrossRef]
  43. Sattari, S.Z.; Ittersum, M.K.V.; Giller, K.E.; Zhang, F.; Bouwman, A.F. Key role of China and its agriculture in global sustainable phosphorus management. Environ. Res. Lett. 2014, 9, 054003. [Google Scholar] [CrossRef] [Green Version]
  44. Henríquez, C.; Killorn, R. Soil P forms and P uptake under intensive plant growth in the greenhouse. Agron. Costarric. 2005, 29, 83–97. [Google Scholar]
  45. Urkurkar, J.S.; Tiwari, A.; Chitale, S.; Bajpai, R.K. Influence of long-term use of inorganic and organic manures on soil fertility and sustainable productivity of rice (Oryza sativa) and wheat (Triticum aestivum) in Inceptisols. Indian J. Agric. Sci. 2010, 80, 208–212. [Google Scholar]
  46. Subehia, S.K.; Sepehya, S.; Rana, S.S.; Negi, S.C.; Sharma, S.K. Long-term effect of organic and inorganic fertilizers on rice (Oryza sativa L.)-wheat (Triticum aestivum L.) yield, and chemical properties of an acidic soil in the western Himalayas. Expl. Agric. 2013, 49, 382–394. [Google Scholar] [CrossRef]
  47. Chowdhury, R.B.; Moore, G.A.; Weatherley, A.J.; Arora, M. Key sustainability challenges for the global phosphorus resource, their implications for global food security, and options for mitigation. J. Clean. Prod. 2017, 140, 945–963. [Google Scholar] [CrossRef]
Figure 1. Phosphorous cycling in soil: (a) soil organic matter quantity and quality, (b) crop choice and cropping system design, (c) mycorrhiza symbiosis, and (d) biological and biochemical mineralization rates. In addition to soil test P concentrations, these factors should be considered when making fertility recommendations.
Sustainability 14 08629 g001
Figure 2. Experimental site of long-term rice-wheat system.
Sustainability 14 08629 g002
Figure 3. Phosphorus pools analysis by adopted modified Hedley fractionation method.
Sustainability 14 08629 g003
Figure 4. Effect of long-term fertilization on soil available-P in the 0–15 and 15–30 cm soil layer of rice-wheat system. Means of different treatments followed by the different lower-case letter (a–d) are significantly different at p < 0.05 level of significance according to DMRT.
Sustainability 14 08629 g004
Figure 5. Effect of different nutrient management options on soil phosphorous fractions contribution in the 0–15 cm soil layer after completing 19 cropping cycle of rice-wheat system.
Sustainability 14 08629 g005
Figure 6. Effect of different nutrient management options on soil phosphorous fractions contribution in the 15–30 cm soil layer after completing 19 cropping cycle of rice-wheat system.
Sustainability 14 08629 g006
Figure 7. An average phosphorous fractions contribution affected by different nutrient management options in the 0–15 and 15–30 cm soil layer after completing 19 cropping cycle of rice-wheat system.
Sustainability 14 08629 g007
Table 1. Experimental setup and treatments details for different nutrient supply options.
TreatmentTreatment Details
CodeKharif (Rice)Rabi (Wheat)
T1ControlNo chemical fertilizer or organic manureNo chemical fertilizer or organic manure
T2NPKRecommended N, P and K through fertilizersRecommended N, P and K through fertilizers
T3STCRSoil-test based fertilizer applicationSoil-test based fertilizer application
T4IPNS75% of recommended N, P and K through fertilizers + 25% substitution of recommended N through FYMRecommended N, P and K through fertilizers
T5IPNS + B75% of recommended N, P and K through fertilizers + 25% substitution of recommended N through FYM + every third wheat substituted with berseemRecommended N, P and K through fertilizers
T6IPNS + C75% of recommended N, P and K through fertilizers + 25% substitution of recommended N through FYM + every third rice substituted with cowpeaRecommended N, P and K through fertilizers
T7OF100% of recommended N, P and K through organic manures (FYM)100% of recommended N, P and K through organic manures (FYM)
Table 2. Effect of long-term nutrient supply on soil P-pools in the 0–15 cm soil layer of rice-wheat system (Means of different treatments followed by the different lower-case letter (a–f) are significantly different at p < 0.05 level of significance according to DMRT).
TreatmentsWSPNaHCO3-PiNaHCO3-PoNaOH-PiNaOH-PoHCl-PResidual-P
mg P kg−1
Control4.64 c8.71 e53.07 e31.13 e57.84 a29.28 e252.30 f
NPK5.43 bc17.73 d69.87 d52.22 d54.33 b37.47 d268.38 e
STCR5.57 b17.41 d70.60 d53.13 d54.18 b36.41 d301.01 b
IPNS8.67 a20.89 c74.56 cd64.58 c52.27 c44.49 c275.74 d
IPNS + B8.95 a23.43 c83.80 c76.76 b50.24 d46.74 b288.14 c
IPNS + C8.50 a28.49 b101.26 b70.40 c51.30 c44.69 c312.04 a
OF5.02 bc37.20 a130.16 a88.22 a48.33 e50.08 a304.69 b
Table 3. Effect of long-term nutrient supply on soil phosphorus fractions in the 15–30 cm soil layer of rice-wheat system (Means of different treatments followed by the different lower-case letter (a–f) are significantly different at p < 0.05 level of significance according to DMRT.).
TreatmentsWSPNaHCO3-PiNaHCO3-PoNaOH-PiNaOH-PoHCl-PResidual-P
mg P kg−1
Control3.45 d6.33 d48.83 c8.04 d68.70 d27.20 e231.16 f
NPK4.57 c9.50 c62.30 b8.95 d75.12 c46.44 d246.78 e
STCR5.19 c11.09 c59.67 bc9.13 d74.94 c44.67 d252.63 d
IPNS6.01 b16.94 ab68.81 b21.31 bc73.41 c53.19 b256.43 d
IPNS + B5.91 b15.51 b83.36 a24.76 ab78.05 b55.41 a272.52 c
IPNS + C7.44 a18.58 a83.76 a25.85 a83.68 a53.94 ab299.17 a
OF4.87 c11.23 c64.55 b18.40 c72.39 c48.95 c287.22 b
Table 4. Relationship (R-values) between P-fractions under rice-wheat system.
P-Fractions WSPNaHCO3-PiNaHCO3-PoNaOH-PiNaOH-PoHCl-PResidual-P
Available-P0.096 NS0.443 NS0.352 NS0.462 NS−0.462 NS0.441 NS0.530 NS
WSP10.241 NS0.107 NS0.442 NS−0.442 NS0.542 NS0.300 NS
NaHCO3-Pi 10.985 **0.946 **−0.946 **0.915 **0.784 *
NaHCO3-Pi 10.892 **−0.892 **0.844 *0.760 *
NaOH-Pi 1−1.000 **0.986 **0.737 NS
NaOH-Po 1−0.986 **−0.737 NS
HCl-P 10.674 NS
** Correlation is significant at the 0.01 level (2-tailed); * Correlation is significant at the 0.05 level (2-tailed); NS—Non significant.
Publisher’s Note: MDPI stays neutral with regard to jurisdictional claims in published maps and institutional affiliations.

