Article

Ground-Mounted Photovoltaic and Crop Cultivation: A Comparative Analysis

by
Sandro Sacchelli
1,
Valerii Havrysh
2,
Antonina Kalinichenko
3,4,* and
Dariusz Suszanowicz
3
1
Department of Agriculture, Food, Environment and Forestry, University of Florence-18, P.le delle Cascine, I-50144 Florence, Italy
2
Department of Tractors and Agricultural Machines, Operating and Maintenance, Mykolayiv National Agrarian University, 54020 Mykolaiv, Ukraine
3
Institute of Environmental Engineering and Biotechnology, University of Opole, 45-040 Opole, Poland
4
Information System and Technology Department, Poltava State Agrarian University, 36-003 Poltava, Ukraine
*
Author to whom correspondence should be addressed.
Sustainability 2022, 14(14), 8607; https://doi.org/10.3390/su14148607
Submission received: 4 June 2022 / Revised: 10 July 2022 / Accepted: 11 July 2022 / Published: 14 July 2022

Abstract

:
Human civilization depends on energy sources, mainly fossil fuels. An increase in the prices of fossil fuels and their exhaustibility limit economic growth. Carbon dioxide emission causes global environmental problems. Global crises (including COVID-19) have sharpened food and energy supply problems. The decentralized energy supply systems as well as the expedition of the application of renewable energy may solve these challenges. The economic shift to renewable power generation intensifies the competition between food crop production and green energy for land. This paper applied an open-source spatial-based model to quantify the solar power generation (the ground-mounted photovoltaic panels) for the southern regions of Poland (the Opole region) and Ukraine (the Mykolaiv region). The model used technical, economic, and legal constraints. This study compared economic indicators of the solar power generation and the crop production projects for rain-fed land. The net present value (NPV) and the profitability index (PI) were used for the economic evaluation. Additionally, the coefficients of variation were determined to assess investment risks. The use of r.green.solar model to find the spatial distribution of the reduction of carbon dioxide emission was the novelty of this study. The analysis revealed that the PV projects have higher NPV, but lower PI compared to the crop production. The PV projects have lower coefficients of variation. This fact testifies that these projects are less risky.

1. Introduction

An increase in the use of renewable energy is caused by three primary reasons. The rapid increase in the demand for energy in developing countries is the first reason [1]. The desire of energy importing countries to improve their energy security is another one [2]. Finally, the mitigation of climate change is the most significant reason. To curb greenhouse gas emissions and to achieve the climate neutrality by 2050 is the objective of using renewable energy [3]. The International Renewable Agency revealed that the solar photovoltaics had developed faster than other renewable energy technologies over the last ten years [4]. The photovoltaics is expected to cover 25% of the world’s electricity demand by 2050 [5].
An increase in the use of renewable energy can help human civilization meet its energy demand as well as to curb climate change. In this regard, the solar power generation has a great potential. Moreover, the photovoltaic conversion of sunlight into energy is more efficient than the photosynthesis [6]. Therefore, the solar power production is more effective than the bioenergy production from an energy point of view. The application of the PV plants on agricultural lands results in the land-use conflict between the edible crop production and the solar power generation [7]. This conflict is escalated in countries that have limited land areas [8].
The global supply and demand in energy markets shape energy prices. The supply imbalance has negative impact on the fossil energy prices. Brent crude oil price jumped up from USD70/barrel in November 2021 to almost USD120/barrel in March 2022 (Figure 1) [9]. Natural gas price peaked on 7 March 2022 (Figure 2) [10].
In 2021, a rise of the wholesale electricity prices has occurred in European countries. An increase in the fossil fuel prices and an unfavorable situation in the wind power generation (in 2021 output dropped by 3.15% because of poor winds) were the primary reasons. A significant fluctuation in electricity prices was observed. The wholesale electricity prices were the highest in Germany and Poland. In Poland, the wholesale electricity prices rose from EUR57.77/MWh (January) to EUR179.64/MWh (December) in 2021. They have exceeded their highest level in the last decade [11,12]. In Finland and Ukraine, they were lower (Figure 3) [13,14]. Since the 1960s, Portugal and Spain have established several agreements to interconnect their power lines. This solution allows countries to use their generation resources in a better way. Therefore, these countries have the same electricity prices [15]. The wholesale prices of electricity in the European Union have risen by approximately 30% since 2008 [16]. This situation in the electricity market promotes the development of the renewable energy, such as solar power generation.
In the recent years, the world economy faced crises that have demonstrated an adverse impact on the energy security. Those were COVID-19 and the Russian-Ukrainian war. In the current situation, many scientists insist on the need to speed up the development of the renewable energy sources [17]. Up to February 2022, the European Union had severe dependence on Russian fossil fuels. About 25% of crude oil and 40% of natural gas were imported from Russia [18]. This dependence is a menace for the energy security.
The European leaders have generated the following responses to these challenges. The first reaction was to re-operate coal-fired power plants. The liquefied natural gas supply from the USA and Qatar was the other reaction [19]. The next step was the transition to nuclear power plants. And finally, the Russian-Ukrainian war made European leaders accelerate the development of the renewable power generation, including the photovoltaics [20]. The European Commission plans to increase solar power generation by 15 TWh in 2022. This value of renewable electricity is enough to substitute about 2.5 billion cubic meters of natural gas. By the end of 2022, 25% of European power generation is expected to be covered by the solar energy [21].
Coal is a primary fuel for power generation in Poland. Polish coal-fired power plants generate about 70% of national electricity [22]. Their operation causes high carbon dioxide emission [23]. Moreover, it is a reason that the country has the highest price of electricity in the European Union [22]. Polish authorities and business are looking for alternatives to solve environmental and economic challenges. As a result, Poland demonstrates the positive dynamics of the solar energy market growth [24]. Moreover, the PV power plants can be an element of vertical integration in agriculture [25,26].
In Ukraine, the share of renewables in energy consumption is 3.31%. It is less than in Europe (42%) and in the world (12.5%). The power generation relies primarily on coal and uranium. In 2020, the share of renewable electricity was 10.7% [27]. It is less than in the world (27.8%). The solar power provides 29% of Ukrainian renewable electricity [28]. Southern regions of Ukraine are promising for the photovoltaics. Due to the state support, farmers increase in the solar power capacity [29].
Photovoltaic may be an effective solution for local power supply systems in rural areas. PV plants are most economically attractive if all the solar electricity is consumed by the owner of the installation [30,31]. However, their development requires public acceptance [32,33] and financial support [34]. Authorities reached the limits of what the public can accept [35]. Incorporating public acceptance into energy policy is a challenge for policymakers [36]. Roddis et al. [37] argued that public acceptance might be a core principle of solar power justice.
The development of the solar power generation is constrained by the following factors: the high investment costs, the high costs of the electricity storage, the strong dependence on climate and geographical conditions, the legislation, and the technical features [38,39]. There are various support mechanisms to increase the capacity of solar power [40]. They seriously affect the attractiveness of investment projects [41]. Feed-in-tariff, tax incentives, green certificates, etc. are a spotlight of numerous studies [42,43].
These power generation systems are explored by many researchers [44,45]. Their studies confirmed that the attractiveness of the PV projects strongly depended on the economy and the geography. The majority of the research was focused on the specific regions [29,46,47]. For example, Brodziński et al. [48] studied photovoltaic farms of the North-Eastern Poland. Therefore, the international application of the results is difficult.
A trade-off between the crop production and the renewable energies such as the photovoltaic (PV) on arable land is a topic thoroughly investigated in the last decade. Different research projects have focused on the land use and the constraints for the installation of the PV plants. For example, Dias et al. [49], as well as Majumdar and Pasqualetti [50], propose the methodologies to evaluate the technical potential of the utility-scale solar PV projects (>1 MW) for Portugal and Arizona (USA), respectively. The Geographic Information Systems (GIS) are tools widely applied to evaluate the best locations for the PV plants.
Calvert and Mabee [51] developed a GIS-based land-suitability modelling and map overlay technique to evaluate the production potential and land-use efficiency. This modelling is used to compare the PV technologies against two short-rotation woody coppice systems (poplar and willow) and two perennial grass systems (switchgrass and miscanthus) in Ontario (Canada). Different investigations often combined GIS with multicriteria evaluation. Marques-Perez et al. [52] used GIS and PROMETHEE (Preference Ranking Organization Method for Enrichment Evaluations) technique to create a map, which shows a ranking of areas with high potential for solar farm development in Valencian communities (Spain). Tercan et al. [53] merged GIS and AHP (Analytic Hierarchy Process) to depict land suitability for the PV plants in central Anatolia (Turkey).
Farmers and decision-makers need practical decision support systems (DSS) to evaluate the best choice for their land and the convenience of traditional agriculture production concerning the PV installation. Therefore, economic appraisal is also required in addition to trade-off analysis. Economic valuation is rarely used to analyse alternative agricultural land application [54].
We set up the following hypotheses.
Hypothesis 1 (H1).
The crop production is more profitable than the photovoltaic power generation.
Hypothesis 2 (H2).
The reduction of carbon dioxide emission in any location is not only a function of the solar radiation. It also depends on the types of the functioning power plants.
The purpose of this study was to compare the economic efficiency of the PV and the crop production projects in the Mykolaiv region (Ukraine) and the Opole region (Poland). Specific objectives are as follows:
  • The analysis of climate conditions;
  • The economic efficiency of the PV projects;
  • The economic indicators of the crop production and their comparison with the PV projects;
  • The reduction of carbon dioxide emission for the PV projects.
  • The results will be useful to develop a strategy for the regional division of labor.

2. Materials and Methods

This study assessed the economic efficiency and the environmental attractiveness of the photovoltaics in the southern regions of Poland and Ukraine. The Mykolaiv and the Opole regions are characterized by high solar insolation for each country.

2.1. Data Collection

In this study, we analyzed different information to compare the economic efficiency of the conventional farming and the PV power generation. We used Official State Statistical data [55,56,57], research papers, reports [58,59,60,61], weather station records [62,63], and market prices [64,65,66,67] to find the necessary data. For the conventional farming, the data contained the following information: main crops, yield, agricultural land area, market prices of crops, and costs of farming activities. We studied investment costs, local solar radiation, electricity generation, and operational expenses for the PV projects. Additionally, the climate data (precipitation, average air temperature, solar radiation, etc.) were taken from the national meteorological databases.

2.2. Net Present Value and Profitability Index for Crop Cultivation Projects

For the crop cultivation projects, the NPV can be calculated via the following formula:
N P V c = j = 1 L T c G I C j P C j 1 + 0.01 r j I c , EUR / ha ,
where GICj is the gross income for crop production in the jth year, USD/ha; PCj is the crop production costs (operating costs) in the jth year, EUR/ha; r is the discount rate, %; Ic is the investment costs for the crop production project, EUR/ha; LTc is the lifetime of the project year.
The gross income in the jth year is equal to [29]:
G I C j = i = 1 n C R F i Y i M P i j ,   EUR / ha ,
where Yi is the yield of the ith crop, t/ha; MPi is the market price of the ith crop, EUR/t; CRFi is the crop rotation factor for the ith crop; n is the number of crops.
The production costs in the jth year are equal to
P C j = A M R j + F C j + L C j + C C j ,   EUR / ha ,
where AMPj is the repair costs, t/ha; FCj is the fuel costs, EUR/ha; LCj is the labor costs, EUR/ha; CCj is the chemical costs (fertilizers, herbicides, etc.), EUR/ha.
The profitability index (PI) is a dimensionless indicator. It may be used as a criterion for any investment project. It is calculated via the following formula:
P I = j = 1 L T c G I C j P C j 1 + 0.01 r j I c .

2.3. Coefficient of Variation

The coefficient of variation (CV) is a dimensionless indicator. It measures the relative dispersion. The coefficient of variation allows researchers to compare the data sets with different units. We determined the coefficient of variation for the economic indicators such as the NPV and the PI. The coefficient of variation was calculated via the formula
C V = σ M V 100 ,
where σ is the standard deviation of a certain indicator; MV is the mean value of a certain indicator.
The standard deviation is determined as
σ = 1 n i = 1 n x i M V 2 ,
where n is the number of observations; xi is the ith observed value of a certain indicator.

2.4. R.Green.Solar Model

To compare financial performances of traditional agricultural crops and PV plants, the r.green.solar model was applied [42]. The tool is an open-source spatial-based model capable of quantifying the energy production from the solar photovoltaic (PV) ground-mounted panels from theoretical and economic viewpoints. We introduced socio-economic and environmental constraints (i.e., legal, technical, etc.) in the evaluation. Due to the objective of this study, a simplified version of r.green.solar was applied.
The GIS-based tool integrates different geodata into a territorial information system. The procedure is implemented on GRASS GIS software v.7.8. The variables imported by the model are:
  • Solar radiation;
  • Digital Terrain Model (DTM);
  • Land use and main roads;
  • Boundaries.
As to the solar radiation, the raster data were derived from PVGIS map v.4 [68,69]. The data represent the yearly average global irradiance on an optimally inclined surface (W/m2) for 2007–2016 in Europe, Africa, and South-West Asia. The solar radiation data have been calculated from the operational solar radiation data set provided by the Climate Monitoring Satellite Application Facility (CM SAF). As to Digital Terrain Model (DTM), raster data were obtained from Copernicus Land Monitoring Services [70]. As to the Land use and main roads, a vector map was taken from the OpenStreetMap project [71]. The analysis was focused on the “farmland” areas, excluding other rural, artificial, and protected surfaces. Main roads are considered if their classification code is: primary, primary link, secondary, secondary link, tertiary, tertiary link, or track grade 1 because of their suitability for truck and logistic phase needed for PV installation and maintenance.
As to the boundaries, vector maps represented the boundary of each case study. The investigated areas are the Mykolaiv region in Ukraine and the Opole region in Poland. The study areas have been chosen as they are the southern regions of the countries.
To minimize the spatial error, each map was calibrated and georeferred to a specific region, with EPSG code 6385 (UCS-2000 zone 11) for Mykolaiv and EPSG code 2174 (Pulkovo 1942-58 zone IV) for Opole. Technical energy (TE, expressed in MWh) took into account the actual PV plants’ available surface, altitude, slope, and solar cell efficiency. In particular, the shadow effect and the space for maneuver were considered by a depiction of a suitable percentage on the total surface [54,72]. For all other numerical values, the spatial-independent coefficients applied to the case studies and the explanation of symbols; see Table 1.

2.5. Economic Indicator of a PV Plant

The financial disposal of energy was computed by the quantification of the area with positive Net Present Value (NPV), following the approach applied in Sacchelli et al. [54]. In the first step, revenues (REV) from energy selling can be quantified as:
R E V = W p + i n c ,   EUR ,
where W is the annual electricity generation, MWh.
The actualised value of revenues (RPV) can be computed as:
R P V = R E V 1 + 0.01 r + 0.01 d l c 1 0.01 r + 0.01 d 1 + 0.01 r + 0.01 d l c ,   EUR .
The total costs comprise the implementation, the operation and the maintenance expenses as well as the decommission of the PV plants. Specifically, they include purchase and installation, connection to electric grid, surface renting, maintenance, cleaning, administrative and consultancies, insurance, and decommission. They are calculated as reported in Table 1.
Actualised costs can be expressed as:
C P V = I + g + R + m + c + a + s 1 + 0.01 r l c 1 0.01 r 1 + 0.01 r l c + 0.01 d 1 + 0.01 r l c ,   EUR .
Eventually, the Net Present Value can be computed by the following formula:
N P V = R P V C P V ,   EUR .
The profitability index is equal to
P I = R P V C P V .

2.6. Carbon Dioxide Emissions

The PV power generation substitutes fossil fuels used by conventional power supply systems. That results in the decrease in carbon dioxide emission [74,75]. There is a methodology to find out carbon dioxide emissions savings of a separate PV plant [76,77,78]. However, the selection of the optimal location of solar power plants, taking into account the local characteristics of the area, remains to be an unresolved problem [79]. The spatial distribution of the reduction of carbon dioxide emission based on the r.green.solar model is the novelty of this study. For each element plot, the carbon dioxide emissions reduction was calculated by the following formula:
C D S i = E c E n i E F ,   kgCO 2 / ( ha · year ) ,
where EcEni is the specific PV power generation for ith plot, MWh/(ha·year); EF is the emission factor, kgCO2/MWh.
The emission factor took all life cycle phases of power generations [80,81]. Its value was determined by a national generation mix. We assumed the following emission factors: Ukraine–318 kgCO2/MWh [61,82,83,84,85]; Poland–934 kgCO2/MWh [86].

3. Results and Discussion

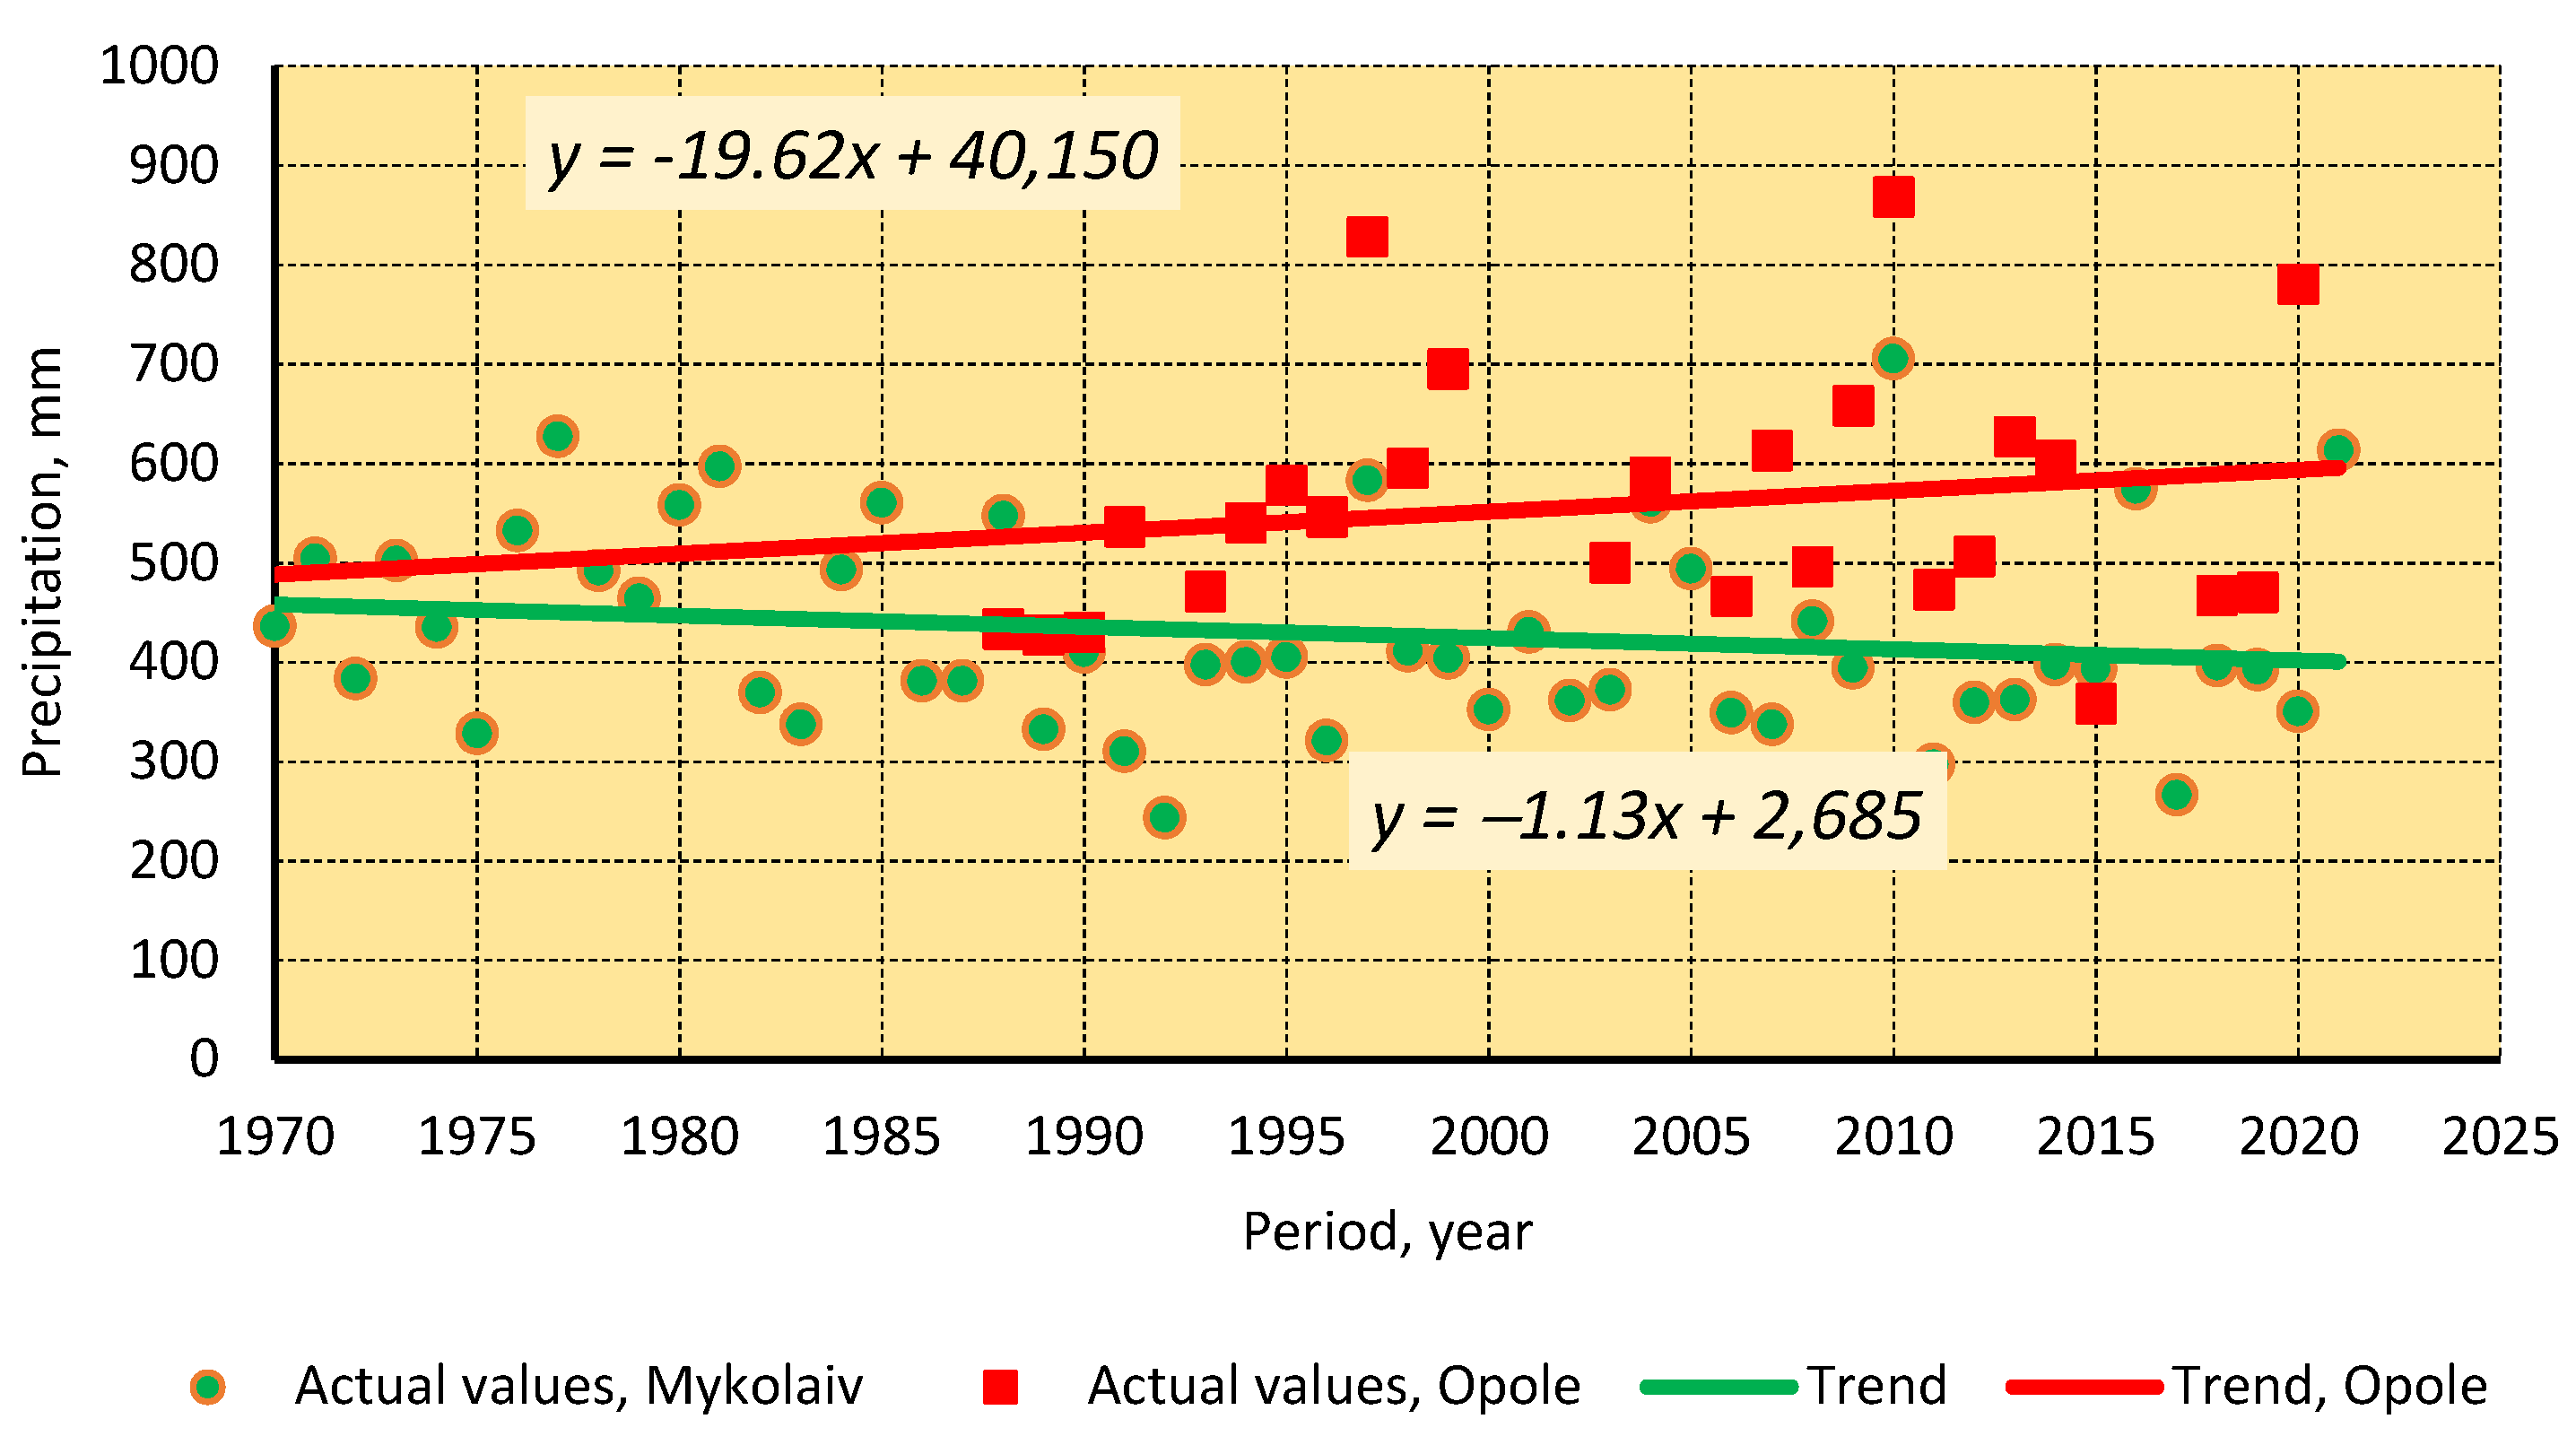
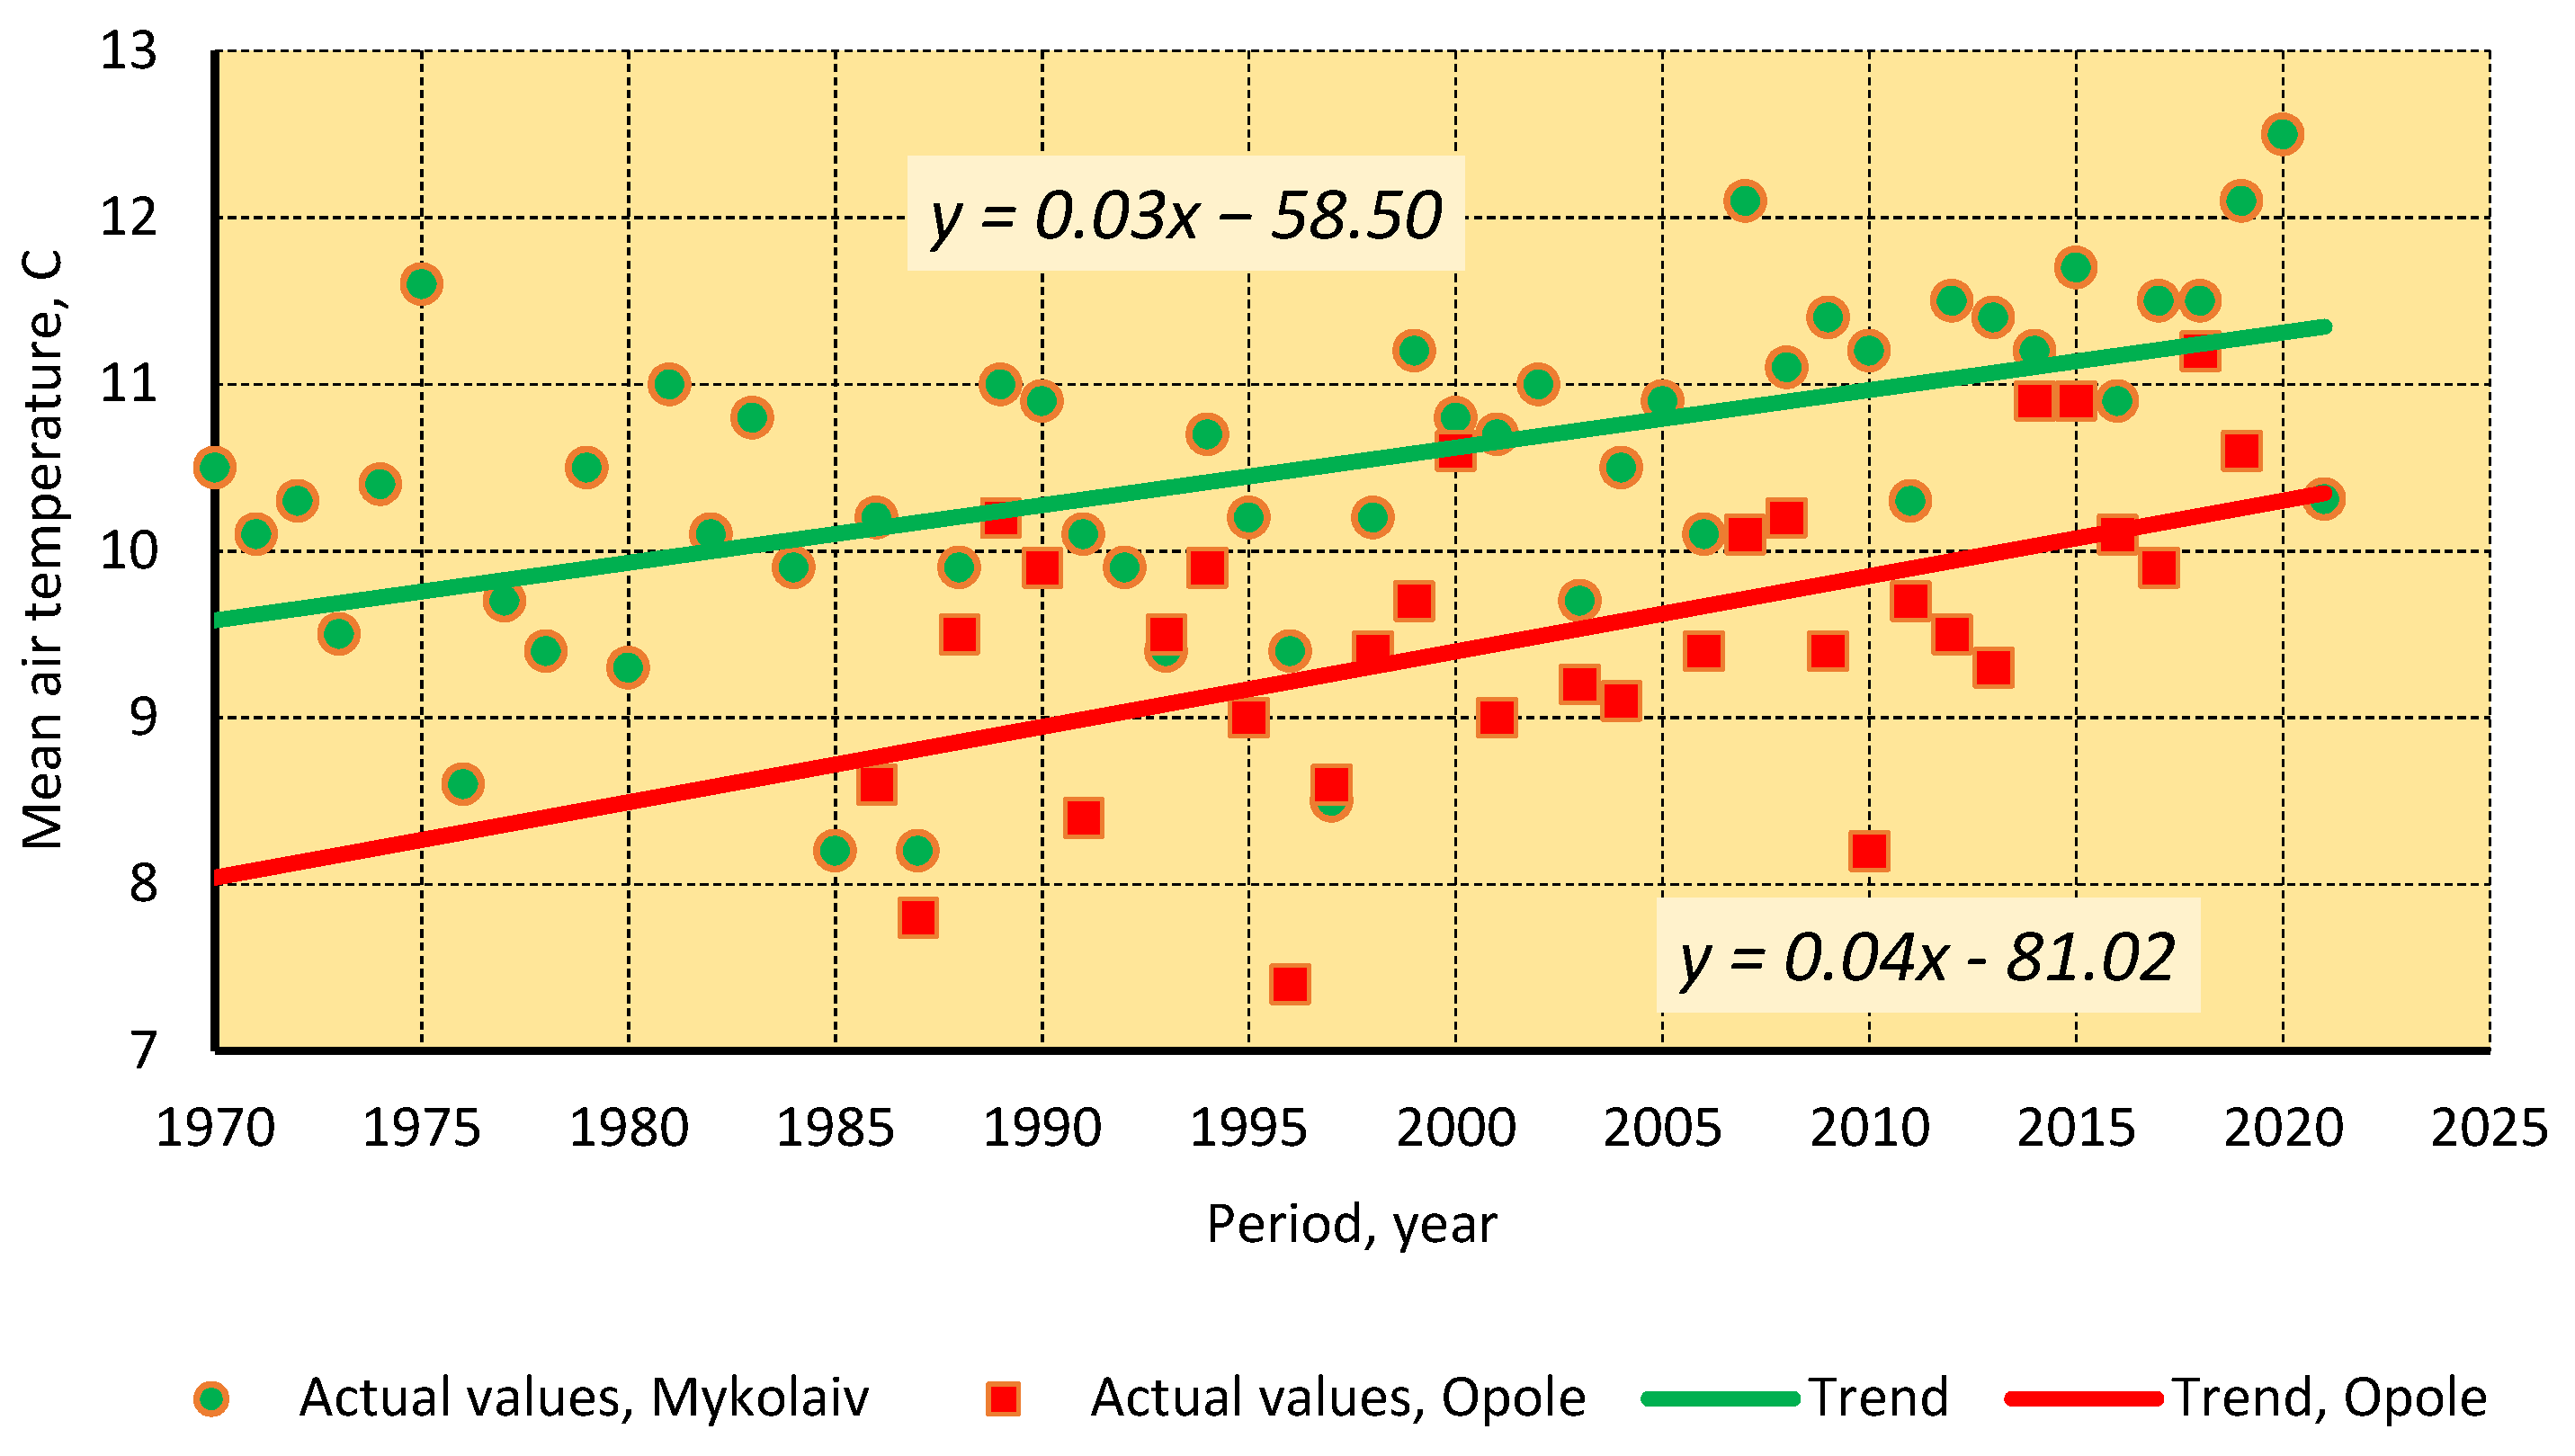
3.1. Climate Conditions and the Status of Agriculture

The weather conditions in the Mykolaiv and Opole regions were as follows. Despite the significant fluctuation of atmospheric precipitation (from 240 to 750 mm), there was a drop in the Mykolaiv region (Figure 4). Since 1970, precipitation has decreased from 450 mm to about 380 mm (or 12%). In the Opole region, an increase in the precipitation level took place [62,63]. In the Mykolaiv region, the average atmospheric temperature has increased from 9.6 °C to 11.25 °C (Figure 5). It constitutes 17%. During the same time period, the average atmospheric temperature in the Opole region also rose. However, its value was less than in the Mykolaiv region [62,63]. The mean annual precipitation sums in the Opole region were from 10% (1992) to 50% (2020) more than in the Mykolaiv region. The weather monitoring revealed that the mean annual temperature in the Mykolaiv region was 10% higher than in the Opole region. These data are important both for the crop production and the solar power generation projects.
The agricultural features of the regions are given in the Table 2 [55,56,87,88]. The Mykolaiv region has almost four-fold more arable land than the Opole one. Its farmers use more powerful agricultural tractors due to the fact that 77.1% of Ukrainian farms own more than 1000 ha of arable lands [87,88].
Wheat, barley, corn, sunflower, and rapeseed are the main crops in the Mykolaiv region [87,88]. In the Opole region, wheat, barley, corn, triticale, cereal mixed, and rapeseed are the main crops. Their share ranged from 69.18% to 87.07% of the total land area (Figure 6) [55,56]. Their mix provide the gross income up to EUR902/ha. In Mykolaiv region, corn has the highest average yield. Sunflower has the lowest average yield (Table 3). In our study, we used official statistical data [57,87,88]. In Opole region, corn also has the highest average yield. Rapeseed has the lowest average yield. However, the average yields are 50–80% higher in Poland than in Ukraine. This can be explained by the higher rainfall.

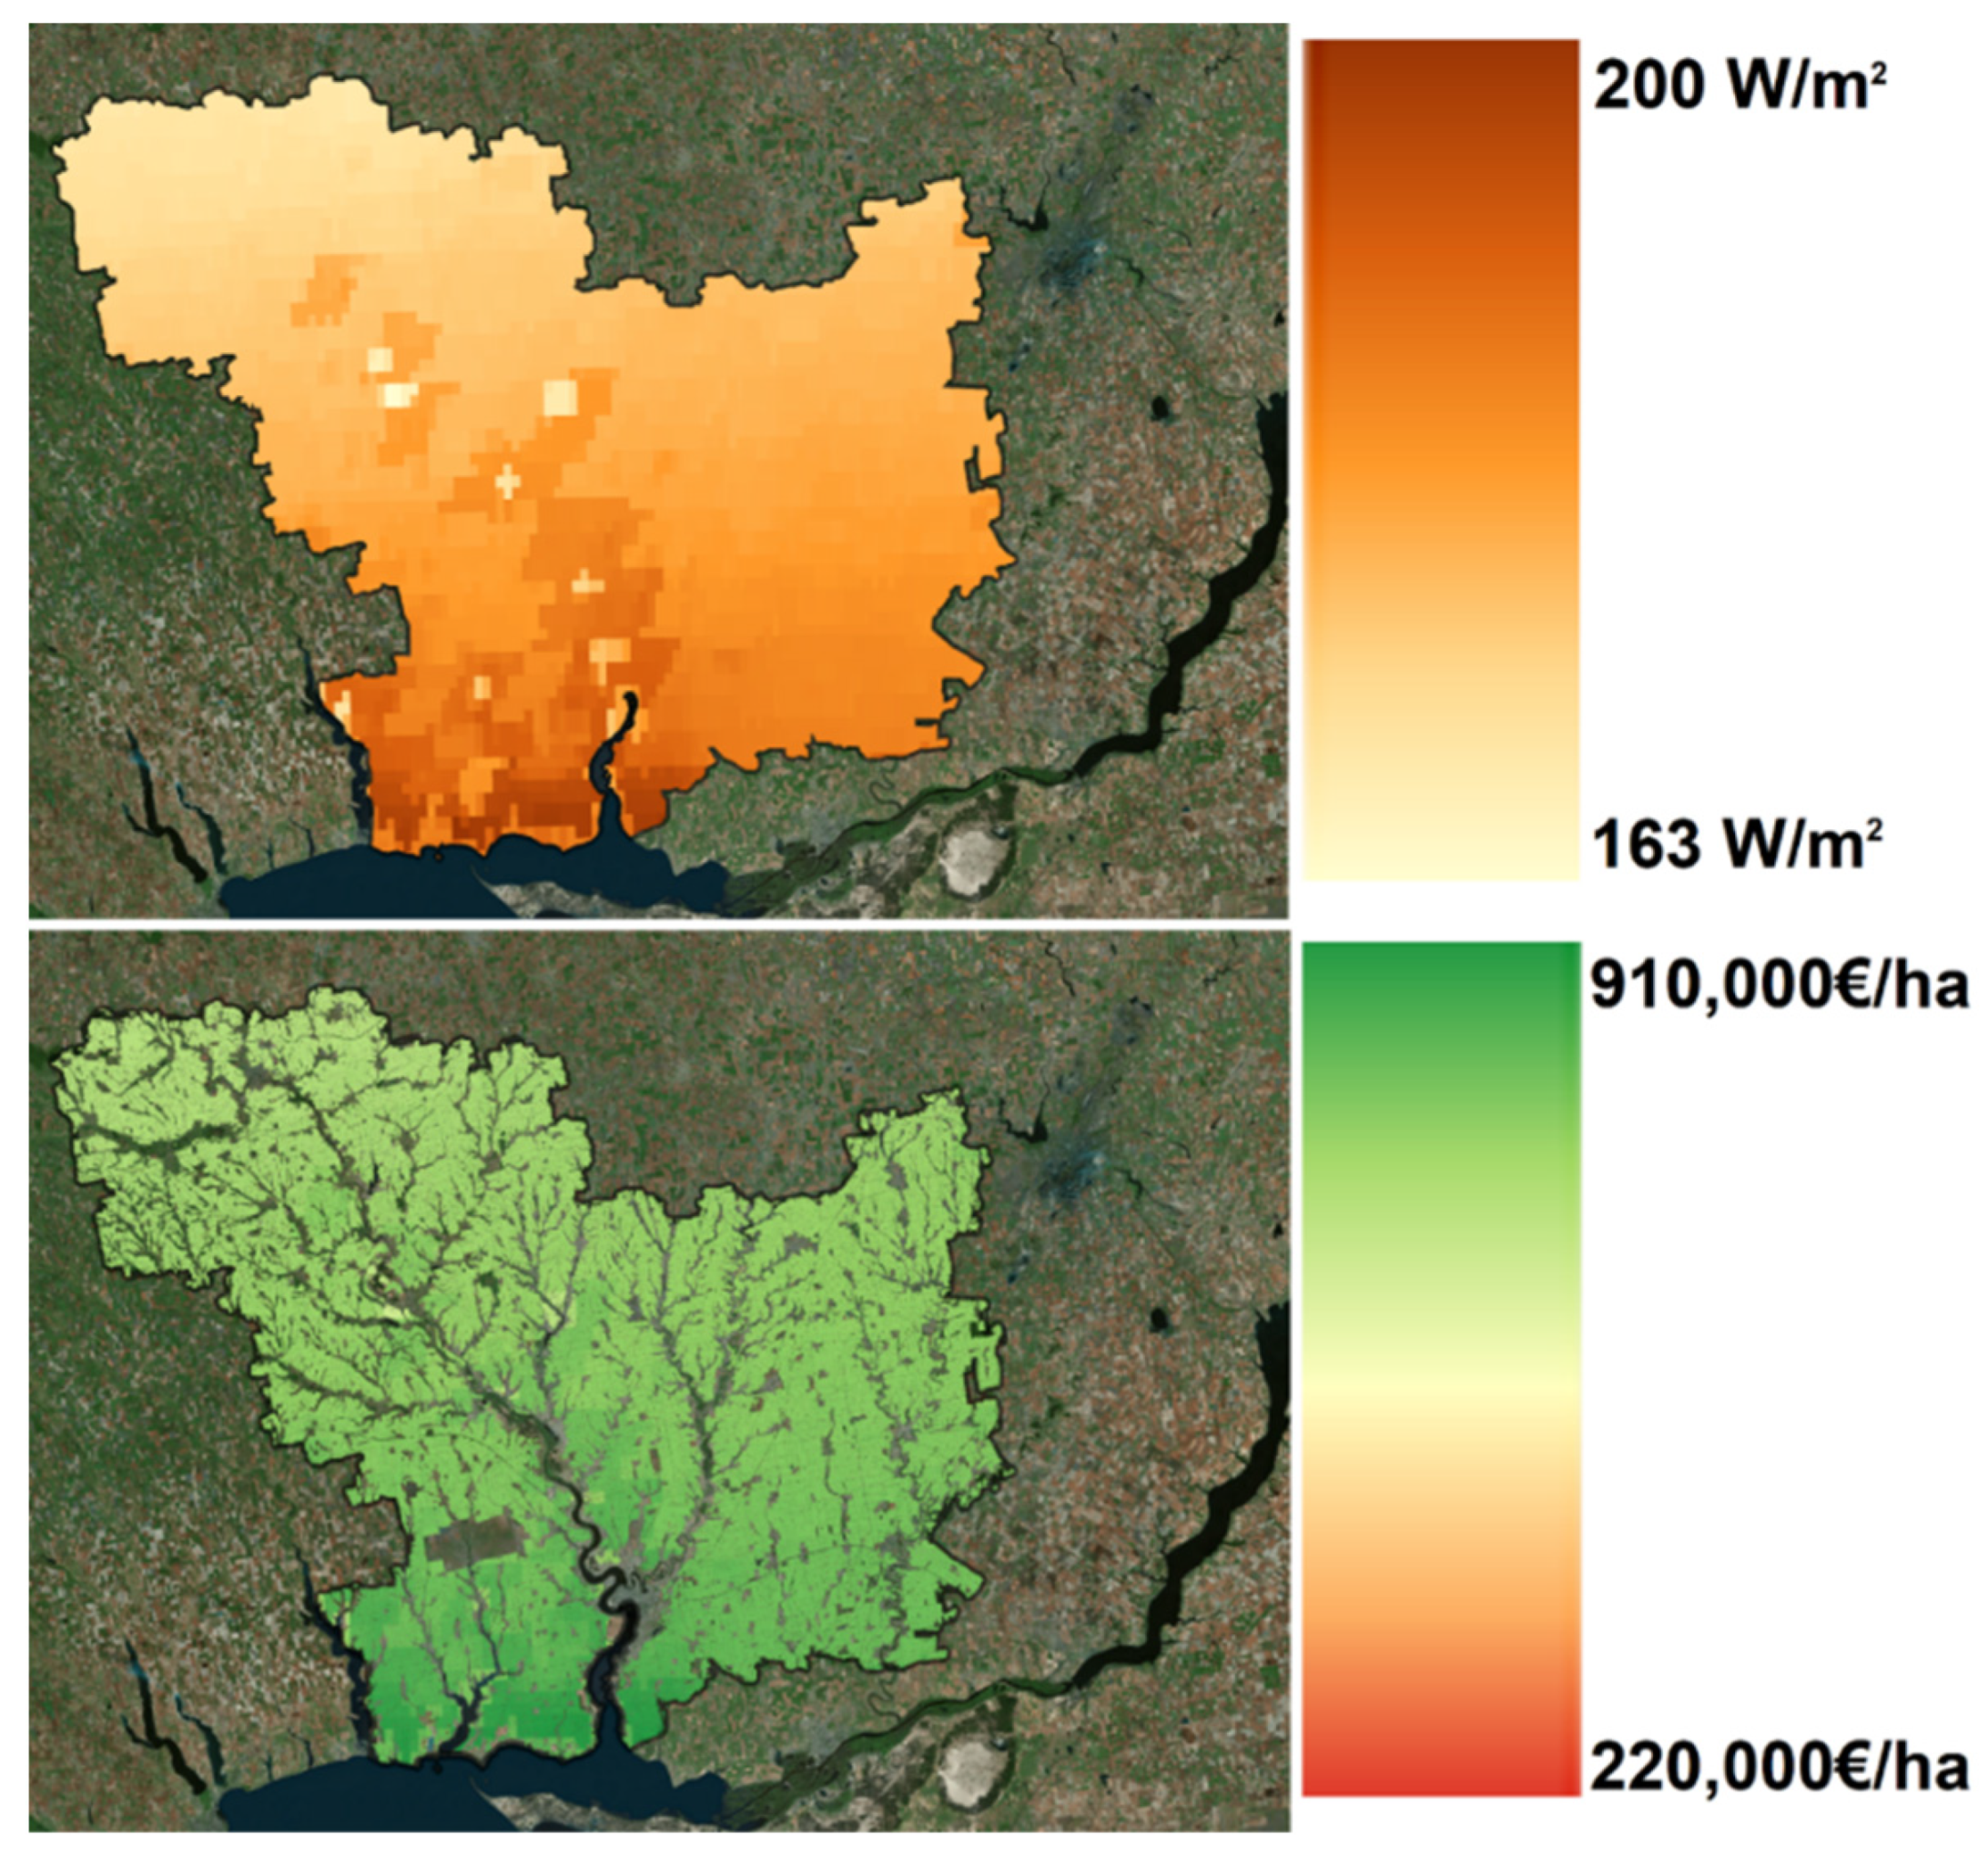
3.2. Economic Indicators of PV Projects

The solar radiation in the Mykolaiv region ranges from 165 to 200 W/m2. It constitutes 121.6% to 129.8% compared to the Opole region. The use of r.green.solar model gives the following results. In the Mykolaiv region, NPV ranges from EUR220,000/ha to EUR910,000/ha. The average NPV is EUR771,829/ha (lifetime is 20 years, and a discount rate is equal to 3%). More than 333,108 ha have a positive net present value. In the Opole region, the average NPV is EUR71,938/ha. 28,039 ha of farmland can provide the positive NPV. The differences (averaging one order of magnitude) are mainly due to the different irradiation values and the electricity prices (the Ukrainian feed-in tariff is almost twice more than the Polish one). The results are depicted in Figure 7 and Figure 8.

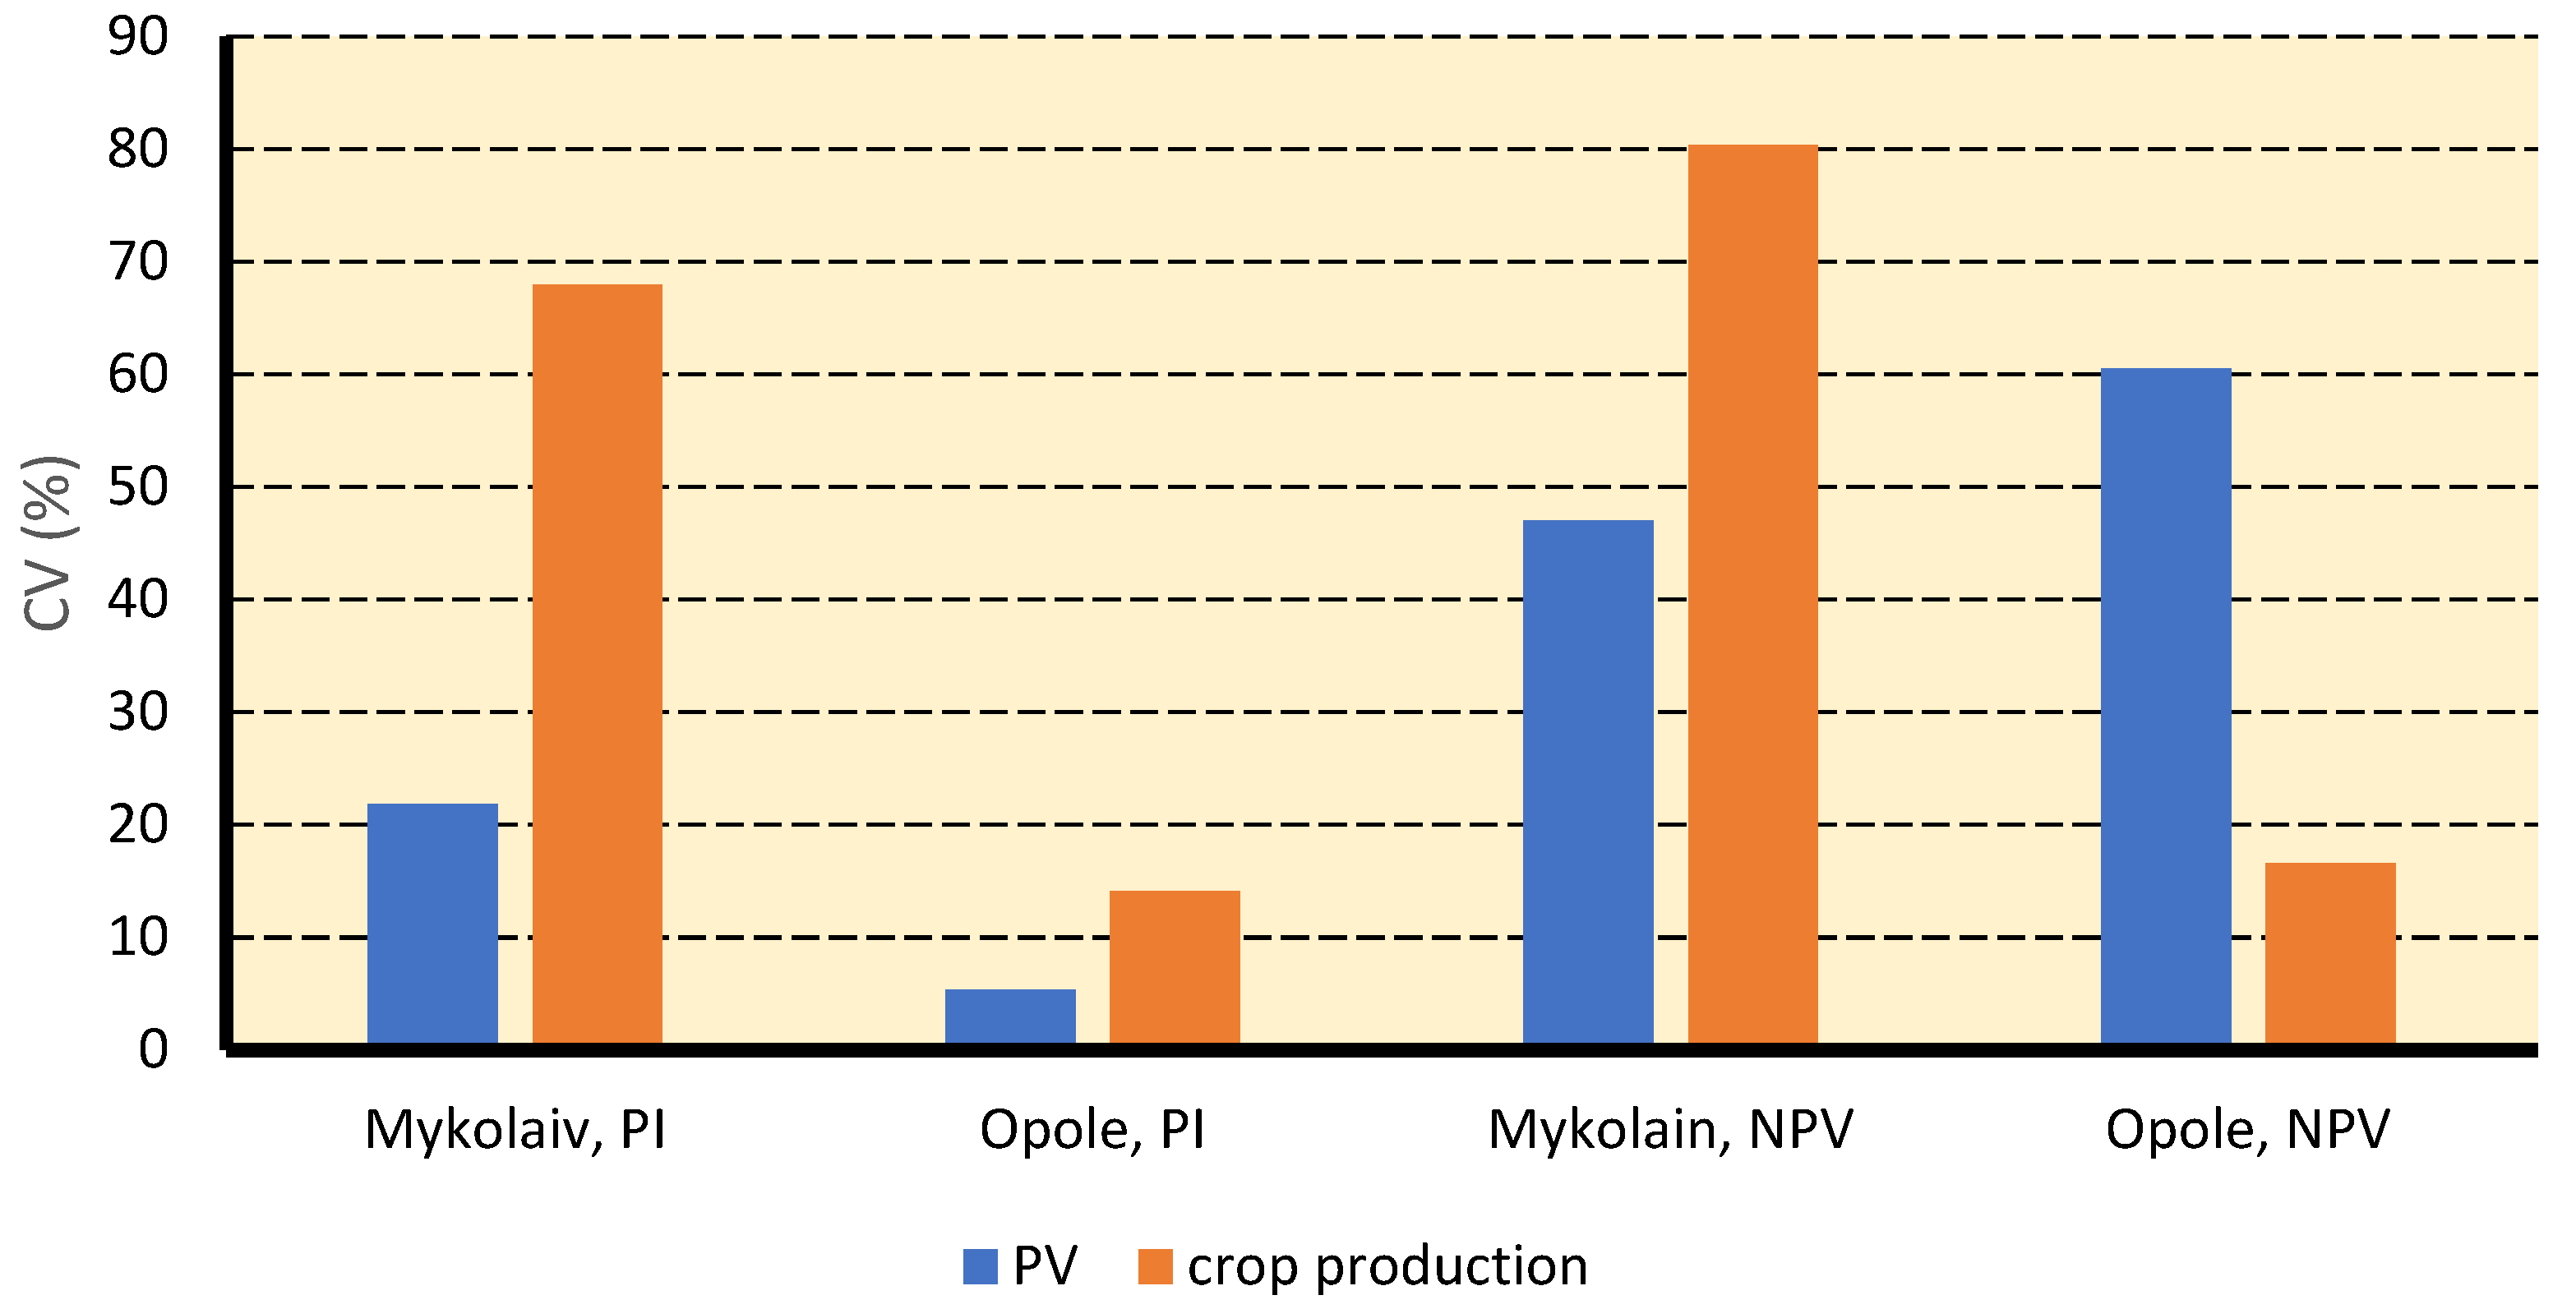
3.3. Economic Indicators of Crop Cultivation Projects

The initial investment costs are a function of the necessary agricultural machinery. The statistics show the following results for farmers in the Mykolaiv region. The average capacity of tractor engine was 94.9 kW. The number of agricultural machinery is presented in Table 4. In Ukraine, farmers use about 57.69 kg of diesel fuel per hectare and about 101 kg of mineral fertilizer per hectare [87,88].
We determined and analyzed the gross income and the gross profit for the crop production to calculate the NPV and the PI. Our calculation was based on the Official State Statistical data, reports, and current prices [59,60,64,65,66,67]. Actual prices in December 2021 were as follows: wheat–from USD251/t to USD330/t; barley–from USD256/t to USD290/t; corn–from USD225/t to USD294/t; sunflower–from USD580/t to USD716/t; rapeseed–from USD530/t to USD710/t [64]. In recent three years, in the Mykolaiv region, farmers got a gross annual income in the range of EUR506/ha to EUR1389/ha (Table 5). This variation is the result of weather conditions and market prices. Its average value was estimated at EUR863/ha [29]. According to our calculations, the NPV of a crop growing project ranged from EUR47.59/ha to EUR7111.59/ha. Its average value is anticipated to be about EUR2903.59/ha.
Polish farmers utilize agricultural tractors about 600 h per year. The normative lifetime of tractors is 12,000 h. Therefore, farmers use them for 20 years [89,90]. The economic indicators for the Opole region are presented in Table 6. The results of our calculations are similar to other researchers [48]. The crop cultivation projects have less NPV, but higher PI compared to the PV projects.
The coefficients of variation for the economic indicators (NPV and PI) were calculated. They are used to evaluate investment risks. The coefficients of variation allow financial analysts to compare alternative investment projects and make better decisions. They were determined for the PV and crop growing projects. The projects (the photovoltaic plant and the crop cultivation) have different coefficients of variation.
Let us consider NPV. In the Mykolaiv region, the coefficient of variation for a solar power plant is equal to 47. The same indicator for the crop production is higher (it is 80.3) (Figure 9). The determined coefficients of variation are more than 47. Obtained values indicate that net present values have a wide range of fluctuations. It confirms that the NPVs are formed under various factors, including cyclical, seasonal, and random. Comparing the risks for some investment projects, the preference should be given to the one for which the value of the coefficient of variation is the lowest. (It indicates that this project has the best ratio of the profitability and risk.) In our case, the results can be interpreted as follows. Investments in solar power plants are less risky as they have a lower coefficient of variation. In the Opole region, the coefficients of variation are lower than in the Mykolaiv region. Despite projects in Ukraine having better average NPV and PI, they are riskier.

3.4. The Reduction of Carbon Dioxide Emission

An emission factor of any country is formed by the available power plants, their technologies, and fuels (energy sources). The Ukrainian power supply system uses almost all power generation technologies: nuclear, thermal, hydropower, and renewables (wind, photovoltaic, biomass). Given the generation mix (Figure 10), the average emission factor is 318 kgCO2/MWh [61,65,80,81,82]. Carbon dioxide intensity in Ukraine was less than the average value in the European Union (407 kgCO2/MWh). In Poland, the emission factor is 934 kgCO2/MWh, because about 70% of electricity is produced by coal-fired power plants [86].
The PV power plants do not emit carbon dioxide at all. The carbon dioxide emissions occur only during the manufacturing process. Their values vary from 170 to 360 kgCO2/kWp [76,91]. The novelty of our study is the use of the r.green.solar model calculation the reduction of carbon dioxide emissions and their spatial distribution. As to the crop production, the modern agriculture is mechanized and uses a lot of chemicals. Farmers use tractors, combine harvesters, trucks, etc. Their internal combustion engines burn fossil fuels. Thus, agricultural activity results in carbon dioxide emissions due to the utilization of energy (diesel fuel, petrol, electricity, etc.), chemicals, etc. These emissions are a function of such factors as crop cultivar, climate zones, practice, etc. They vary from 50 to 3200 kgCO2/ha [92,93,94,95,96,97]. The results obtained are depicted in Figure 11, Figure 12 and Figure 13. Despite the higher solar radiation in the Mykolaiv region, it has lower carbon dioxide savings. The lower emission factor is a reason for the above. In the Opole region, the PV power generation can save up to 601 tCO2/ha per year. Therefore, the photovoltaics in Poland can play a primarily environmental role.
Therefore, photovoltaics aligns with the sustainable development goals of the United Nations [98]. The use of solar energy complies with the following goals: affordable and clean energy, climate action, sustainable cities and communities, and responsible consumption and production. Due to abundant solar energy potential, photovoltaics plays a significant role in transitioning toward a sustainable energy system. Our study confirms that agriculture has a great potential to make this transition.

4. Conclusions

The photovoltaics is the fast-growing renewable power generation technology in the world. Poland and Ukraine are no exception. A dynamic increase in the solar power generation improves energy security, curbs greenhouse gas emissions, and provides sustainable economic development. In this study, Polish and Ukrainian regions with the best solar radiation were analyzed. The r.green.solar model was applied to determine energy potential and carbon dioxide savings for the PV systems on rain-fed arable land.
Farmers of the Mykolaiv region and the Opole region cultivate grain and oilseed crops. Despite the fertile soil in the Mykolaiv region, its crop yields are almost half of Poland’s yield. Lower annual precipitation and the consumption of fertilizers are the primary reasons. Ukrainian farmers use more powerful tractors. Their average nominal engine power is 97.3 kW. It is almost twice as higher as in Poland. In the Mykolaiv region, an average tractor cultivates 265 ha or 1778% compared to the Opole region. It allows the Ukrainian farmers to consume less diesel fuel (65% compared to Poland).
The results of this study have proved the advanced hypothesis 1. The Net Present Values of the photovoltaic projects exceed ones of the crop cultivation projects. However, they have lower Profitability Indexes than the widespread farm practices. This is a general tendency.
The second hypothesis has been proved too. Despite the less solar radiation, the PV power generation in the Opole region has higher carbon dioxide savings than in the Mykolaiv region. The higher carbon dioxide intensity of the Polish power generation system is the main reason for the above.
The Mykolaiv region is preferable for the solar power plants. The PV plants can provide a higher NPV and PI. In the Mykolaiv region, the crop cultivation has almost the same average PI as in the Opole region. However, in the Opole region, the coefficients of variation are less than in the Mykolaiv region. Therefore, business in Poland is less risky.
The analysis of the so-called “agrophotovoltaic systems” in which the crop production and the PV power generation are integrated into one production system in the same area is a promising development [99]. Even if economic evaluation was developed in an agrivoltaic system [100], it was rarely used to investigate alternative use of agricultural land [54]. In addition, future research can focus on the positive and negative impacts of a PV system on arable land from multiple ecosystem services prospects.

Author Contributions

Conceptualization, V.H. and S.S.; methodology, V.H., S.S., A.K., and D.S.; software, D.S.; validation, V.H. and S.S.; formal analysis, V.H.; investigation, S.S.; writing—original draft preparation, V.H., S.S., A.K., and D.S.; writing—review and editing, V.H., S.S., A.K., and D.S.; supervision, V.H. All authors have read and agreed to the published version of the manuscript.

Funding

This research received no external funding.

Conflicts of Interest

The authors declare no conflict of interest.

References

  1. Hilgedieck, J.; Magdowski, A.; Christ, D.; Janczik, S.; Witt, J.; Kaltschmitt, M. Erneuerbare Energien Weltweit: Globaler Stand 2018. BWK Das Energ. Fachmag. 2019, 71, 18–40. Available online: http://hdl.handle.net/11420/4581 (accessed on 23 March 2022).
  2. Report of the Conference of the Parties on Its Twenty-First Session, Held in Paris from 30 November to 13 December 2015. 2016. Available online: https://unfccc.int/resource/docs/2015/cop21/eng/10.pdf (accessed on 23 March 2022).
  3. EC Clean Energy for All Europeans. Available online: https://op.europa.eu/en/publication-detail/-/publication/b4e46873-7528-11e9-9f05-01aa75ed71a1/language-en (accessed on 8 April 2022).
  4. IRENA. Renewable Energy Capacity Statistics 2020; International Renewable Energy Agency: Abu Dhabi, United Arab Emirates, 2020; Available online: https://irena.org/-/media/Files/IRENA/Agency/Publication/2020/Mar/IRENA_RE_Capacity_Statistics_2020.pdf (accessed on 1 May 2022).
  5. International Renewable Energy Agency (IRENA). Renewable Energy Statistics. July 2019. Available online: https://webstore.iea.org/key-world-energy-statistics-2019 (accessed on 8 May 2022).
  6. Blankenship, R.; Tiede, D.; Barber, J.; Brudvig, G.W.; Fleming, G.; Ghirardi, M.; Gunner, M.; Junge, W.; Kramer, D.; Melis, A.; et al. Comparing photosynthetic and photovoltaic efficiencies and recognizing the potential for improvement. Science 2011, 332, 805–809. [Google Scholar] [CrossRef] [PubMed] [Green Version]
  7. Fraunhofer ISE. Current and future cost of photovoltaics. In Longterm Scenarios for Market Development, System Prices and LCOE of Utility-Scale PV Systems; Agora Energiewende: Berlin, Germany, 2015; Available online: https://www.ise.fraunhofer.de/content/dam/ise/de/documents/publications/studies/AgoraEnergiewende_Current_and_Future_Cost_of_PV_Feb2015_web.pdf (accessed on 2 May 2022).
  8. Weselek, A.; Ehmann, A.; Zikeli, S.; Lewandowski, I.; Schindele, S.; Högy, P. Agrophotovoltaic systems: Applications, challenges, and opportunities. A review. Agron. Sustain. Dev. 2019, 39, 35. [Google Scholar] [CrossRef]
  9. WTRG Economics. Available online: https://wtrg.com/ (accessed on 3 April 2022).
  10. EU Natural Gas. Available online: https://tradingeconomics.com/commodity/eu-natural-gas (accessed on 3 April 2022).
  11. Wholesale Prices of Electricity in Poland from 2018 to 2022 (in Zloty/MWh). Available online: https://www.statista.com/statistics/1066654/poland-wholesale-electricity-prices/ (accessed on 20 May 2022).
  12. Polish Zloty to Euro Spot Exchange Rates for 2021. Available online: https://www.exchangerates.org.uk/PLN-EUR-spot-exchange-rates-history-2021.html (accessed on 20 May 2022).
  13. Average Monthly Electricity Wholesale Prices in Selected Countries in the European Union (EU) from January 2020 to January 2022. Available online: https://www.statista.com/statistics/1267500/eu-monthly-wholesale-electricity-price-country/ (accessed on 15 March 2022).
  14. Purchase Prices on the Day-Ahead Market for Group b Consumers in 2021. Available online: https://tek.energy/electricity/prices (accessed on 20 December 2021).
  15. Tidey, A. Brussels Agrees to ‘Iberian Exception’ Allowing Spain and Portugal to Cap Electricity Prices. Available online: https://www.euronews.com/my-europe/2022/04/26/brussels-agrees-to-iberian-exception-allowing-spain-and-portugal-to-cap-electricity-prices (accessed on 1 July 2022).
  16. Electricity Prices for Non-Household Consumers. Available online: https://ec.europa.eu/eurostat/statistics-explained/index.php?title=Electricity_price_statistics#Electricity_prices_for_non-household_consumers (accessed on 20 December 2021).
  17. Hosseini, S.E. An Outlook on the Global Development of Renewable and Sustainable Energy at the Time of COVID-19. Energy Res. Soc. Sci. 2020, 68, 101633. [Google Scholar] [CrossRef]
  18. How Europe’s Reliance on Russia’s Gas Plays into the War in Ukraine. Available online: https://www.npr.org/2022/02/09/1079338002/russia-ukraine-europe-gas-nordstream2-energy (accessed on 28 March 2022).
  19. Will Europe Have to Return to Coal if Russia Cuts Off Gas Imports? Available online: https://www.euronews.com/green/2022/03/07/europe-scrambles-to-keep-the-lights-on-as-it-sidelines-russian-gas (accessed on 30 April 2022).
  20. Hosseini, S.E. Transition Away from Fossil Fuels toward Renewables: Lessons from Russia-Ukraine Crisis. Future Energy 2022, 1, 2–5. Available online: https://fupubco.com/fuen/article/view/8 (accessed on 30 April 2022). [CrossRef]
  21. Scientific American: Science News, Expert Analysis, Health Research—Scientific American. Available online: https://www.scientificamerican.com/ (accessed on 30 April 2022).
  22. Brauers, H.; Oei, P.Y. The political economy of coal in Poland: Drivers and barriers for a shift away from fossil fuels. Energy Policy 2020, 144, 111621. [Google Scholar] [CrossRef]
  23. Energy Market Agency. Available online: https://www.are.waw.pl/ (accessed on 1 May 2022).
  24. Rataj, M.; Berniak-Woźny, J.; Plebańska, M. Poland as the EU Leader in Terms of Photovoltaic Market Growth Dynamics—Behind the Scenes. Energies 2021, 14, 6987. [Google Scholar] [CrossRef]
  25. Bilan, Y.; Nitsenko, V.; Havrysh, V. Energy Aspect of Vertical Integration in Agriculture. Rynek Energii 2017, 5, 98–110. Available online: http://dspace.onu.edu.ua:8080/bitstream/123456789/11761/1/98-110.pdf (accessed on 30 April 2022).
  26. Havrysh, V.; Kalinichenko, A.; Mentel, G.; Olejarz, T. Commercial Biogas Plants: Lessons for Ukraine. Energies 2020, 13, 2668. [Google Scholar] [CrossRef]
  27. BP Statistical Review of World Energy. 2021. Available online: https://www.bp.com/content/dam/bp/business-sites/en/global/corporate/pdfs/energy-economics/statistical-review/bp-stats-review-2021-full-report.pdf (accessed on 26 May 2022).
  28. IRENA. Energy Profile of Ukraine. 2021. Available online: https://www.irena.org/IRENADocuments/Statistical_Profiles/Europe/Ukraine_Europe_RE_SP.pdf (accessed on 26 May 2022).
  29. Havrysh, V.; Kalinichenko, A.; Szafranek, E.; Hruban, V. Agricultural Land: Crop Production or Photovoltaic Power Plants. Sustainability 2022, 14, 5099. [Google Scholar] [CrossRef]
  30. Bigorajski, J.; Chwieduk, D. Analysis of a micro photovoltaic/thermal—PV/T system operation in moderate climate. Renew. Energy 2019, 137, 127–136. [Google Scholar] [CrossRef]
  31. Kruzel, R.; Helbrych, P. Analysis of the profitability of a photovoltaic installation in the context of sustainable development of construction. E3S Web Conf. 2021, 49, 00061. [Google Scholar] [CrossRef] [Green Version]
  32. Fast, S. Social acceptance of renewable energy: Trends, concepts, and geographies: Social acceptance of renewable energy. Geogr. Compass 2013, 7, 853–866. [Google Scholar] [CrossRef]
  33. Upham, P.; Oltra, C.; Boso, À. Towards a cross-paradigmatic framework of the social acceptance of energy systems. Energy Res. Soc. Sci. 2015, 8, 100–112. [Google Scholar] [CrossRef]
  34. Schmidt, T.S. Low-carbon investment risks and de-risking. Nat. Clim. Chang. 2014, 4, 237–239. [Google Scholar] [CrossRef]
  35. DECC (Department of Energy and Climate Change). Statement on Ending Subsidies for Onshore Wind. 2015. Available online: https://www.gov.uk/government/speeches/statement-onending-subsidies-for-onshore-wind. (accessed on 9 July 2022).
  36. Wüstenhagen, R.; Wolsink, M.; Bürer, M.J. Social acceptance of renewable energy innovation: An introduction to the concept. Energy Policy 2007, 35, 2683–2691. [Google Scholar] [CrossRef] [Green Version]
  37. Roddis, P.; Carver, S.; Dallimer, M.; Norman, P.; Ziv, G. The role of community acceptance in planning outcomes for onshore wind and solar farms: An energy justice analysis. Appl. Energy 2018, 226, 353–364. [Google Scholar] [CrossRef]
  38. IRENA. Solar Energy. Available online: https://www.irena.org/solar (accessed on 1 May 2022).
  39. Gulaliyev, M.G.; Mustafayev, E.R.; Mehdiyeva, G.Y. Assessment of Solar Energy Potential and Its Ecological-Economic Efficiency: Azerbaijan Case. Sustainability 2020, 12, 1116. [Google Scholar] [CrossRef] [Green Version]
  40. Kulpa, J.; Olczak, P.; Surma, T.; Matuszewska, D. Comparison of Support Programs for the Development of Photovoltaics in Poland: My Electricity Program and the RES Auction System. Energies 2022, 15, 121. [Google Scholar] [CrossRef]
  41. Hagspiel, V.; Nunes, C.; Oliveira, C.; Portela, M. Green investment under time-dependent subsidy retraction risk. J. Econ. Dyn. Control 2020, 3936, 103936. [Google Scholar] [CrossRef]
  42. Sendstad, L.H.; Hagspiel, V.; Mikkelsen, W.J.; Ravndal, R.; Tveitstøl, M. The impact of subsidy retraction on European renewable energy investments. Energy Policy 2022, 160, 112675. [Google Scholar] [CrossRef]
  43. Dong, C.; Zhou, R.; Li, J. Rushing for subsidies: The impact of feed-in tariffs on solar photovoltaic capacity development in China. Appl. Energy 2021, 281, 116007. [Google Scholar] [CrossRef]
  44. Ameli, N.; Brandt, N. Determinants of households’ investment in energy efficiency and renewables: Evidence from the OECD survey on household environmental behaviour and attitudes. Environ. Res. Lett. 2015, 10, 044015. [Google Scholar] [CrossRef]
  45. Niamir, L.; Ivanova, O.; Filatova, T.; Voinov, A.; Bressers, H. Demand-side solutions for climate mitigation: Bottom-up drivers ofhousehold energy behavior change in the Netherlands and Spain. Energy Res. Soc. Sci. 2020, 62, 101356. [Google Scholar] [CrossRef]
  46. Bielski, S.; Marks-Bielska, R.; Zielińska-Chmielewska, A.; Romaneckas, K.; Šarauskis, E. Importance of Agriculture in Creating Energy Security—A Case Study of Poland. Energies 2021, 14, 2465. [Google Scholar] [CrossRef]
  47. BP. Statistical Review of World Energy, 68th ed.; BP: London, UK, 2019; Available online: https://www.bp.com/content/dam/bp/businesssites/en/global/corporate/pdfs/energy-economics/statistical-review/bp-stats-review-2019-full-report.pdf (accessed on 12 May 2022).
  48. Brodziński, Z.; Brodzińska, K.; Szadziun, M. Photovoltaic Farms—Economic Efficiency of Investments in North-East Poland. Energies 2021, 14, 2087. [Google Scholar] [CrossRef]
  49. Dias, L.; Gouveia, J.P.; Lourenço, P.; Seixas, J. Interplay between the potential of photovoltaic systems and agricultural land use. Land Use Policy 2019, 81, 725–735. [Google Scholar] [CrossRef]
  50. Majumdar, D.; Pasqualetti, M.J. Analysis of land availability for utility-scale power plants and assessment of solar photovoltaic development in the state of Arizona, USA. Renew. Energy 2019, 134, 1213–1231. [Google Scholar] [CrossRef]
  51. Calvert, K.; Mabee, W. More solar farms or more bioenergy crops? Mapping and assessing potential land-use conflicts among renewable energy technologies in eastern Ontario, Canada. Appl. Geogr. 2015, 56, 209–221. [Google Scholar] [CrossRef]
  52. Marques-Perez, I.; Guaita-Pradas, I.; Gallego, A.; Segura, B. Territorial planning for photovoltaic power plants using an outranking approach and GIS. J. Clean. Prod. 2020, 257, 120602. [Google Scholar] [CrossRef]
  53. Tercan, E.; Eymen, A.; Urfali, T.; Saracoglu, B.O. A sustainable framework for spatial planning of photovoltaic solar farms using GIS and multi-criteria assessment approach in Central Anatolia, Turkey. Land Use Policy 2021, 102, 105272. [Google Scholar] [CrossRef]
  54. Sacchelli, S.; Garegnani, G.; Geri, F.; Grilli, G.; Paletto, A.; Zambelli, P.; Ciolli, M.; Vettorato, D. Trade-off between photovoltaic systems installation and agricultural practices on arable lands: An environmental and socio-economic impact analysis for Italy. Land Use Policy 2016, 56, 90–99. [Google Scholar] [CrossRef] [Green Version]
  55. Statistical Yearbook of Agriculture. Warsaw 2021. Available online: https://stat.gov.pl/en/topics/statistical-yearbooks/statistical-yearbooks/statistical-yearbook-of-agriculture-2021,6,16.html (accessed on 5 May 2022).
  56. Energy Statistics in 2019 and 2020. Warsaw 2021. Available online: https://stat.gov.pl/en/topics/environment-energy/energy/ (accessed on 5 May 2022).
  57. Plant Growing in Ukraine 2020; State Statistics Service of Ukraine: Kyiv, Ukraine, 2021; Available online: http://www.ukrstat.gov.ua/druk/publicat/kat_u/2021/zb/05/zb_rosl_2020.pdf (accessed on 17 April 2022).
  58. Curtis, T.; Heath, G.; Walker, A.; Desai, J.; Settle, E.; Barbosa, C. Best Practices at the End of the Photovoltaic System Performance Period; Technical Report NREL/TP-5C00-78678; National Renewable Energy Laboratory (NREL): Golden, CO, USA, 2021; Available online: https://www.nrel.gov/docs/fy21osti/78678.pdf (accessed on 7 May 2022).
  59. United States Department of Agriculture, Foreign Agricultural Service. Grain and Feed Annual. Ukraine; Report Number: UP2021-0017; United States Department of Agriculture, Foreign Agricultural Service: Washington, DC, USA, 2021. Available online: https://apps.fas.EURa.gov/newgainapi/api/Report/DownloadReportByFileName?fileName=Grain%20and%20Feed%20Annual_Kyiv_Ukraine_04-15-2021 (accessed on 15 March 2022).
  60. United States Department of Agriculture, Foreign Agricultural Service. Oilseeds and Products Annual. Ukraine; Report Number: UP2021-0016; United States Department of Agriculture, Foreign Agricultural Service: Washington, DC, USA, 2021. Available online: https://apps.fas.EURa.gov/newgainapi/api/Report/DownloadReportByFileName?fileName=Oilseeds%20and%20Products%20Annual_Kyiv_Ukraine_04-15-2021 (accessed on 15 March 2022).
  61. Comparison of Lifecycle Greenhouse Gas Emissions of Various Electricity Generation Sources. World Nuclear Association Report. July 2011. Available online: http://www.world-nuclear.org/uploadedFiles/org/WNA/Publications/Working_Group_Reports/comparison_of_lifecycle.pdf (accessed on 29 April 2022).
  62. Monthly and Annual Precipitation in Nikolaev. 2021. Available online: http://www.pogodaiklimat.ru/history/33846_2.htm (accessed on 5 May 2022).
  63. Climate OPOLE. Available online: https://en.tutiempo.net/climate/ws-125300.html (accessed on 5 May 2022).
  64. Agrotender. Available online: https://agrotender.com.ua/traders/region_ukraine/yachmen (accessed on 15 April 2022).
  65. Equator of the Grain Season-2019/20 in Ukraine: Success & Challenges. Available online: https://www.apk-inform.com/ru/exclusive/topic/1507460 (accessed on 15 April 2022).
  66. Ukraine: Average Demand Prices for Grains and Oilseeds (13 June–20 June 2019). Available online: https://www.apk-inform.com/ru/news/price/1500863 (accessed on 29 April 2022).
  67. Costs of Agricultural Production in Enterprises in 2020. Available online: http://www.ukrstat.gov.ua/operativ/operativ2018/sg/vytr_na%20ver_sg_prod/arch_vytr_na%20ver_sg_prod_u.htm (accessed on 29 May 2022).
  68. Šúri, M.; Huld, T.A.; Dunlop, E.D.; Ossenbrink, H.A. Potential of solar electricity generation in the European Union member states and candidate countries. Sol. Energy 2007, 81, 1295–1305. [Google Scholar] [CrossRef]
  69. Huld, T.; Müller, R.; Gambardella, A. A new solar radiation database for estimating PV performance in Europe and Africa. Sol. Energy 2012, 86, 1803–1815. [Google Scholar] [CrossRef]
  70. Copernicus Land Monitoring Service at a Glance. Available online: https://land.copernicus.eu/ (accessed on 7 May 2022).
  71. Europe. Available online: https://download.geofabrik.de/europe.html (accessed on 7 May 2022).
  72. Karaveli, A.B.; Soytas, U.; Akinoglu, B.G. Comparison of large scale solar PV (photovoltaic) and nuclear power plant investments in an emerging market. Energy 2015, 84, 656–665. [Google Scholar] [CrossRef]
  73. Bedin, D.; Holland, E.; Chies, A.; Annunziata, V.; Virdis, A. PVS in BLOOM: Business Guide—Ground Photovoltaic Investments on Marginal Areas. Intelligent Energy Europe Programme. 2011. Available online: https://ru.scribd.com/document/238261741/Business-Guide-Power-Sun (accessed on 7 May 2022).
  74. Havrysh, V.; Kalinichenko, A.; Mentel, G.; Mentel, U.; Vasbieva, D.G. Husk Energy Supply Systems for Sunflower Oil Mills. Energies 2020, 13, 361. [Google Scholar] [CrossRef] [Green Version]
  75. Havrysh, V.; Hruban, V.; Sadovoy, O.; Kalinichenko, A.; Taikhrib, K. Sustainable Energy Supply Based on Sunflower Seed Husk for Oil Mills. In Proceedings of the International Conference on Modern Electrical and Energy Systems (MEES), Kremenchuk, Ukraine, 23–25 September 2019. [Google Scholar] [CrossRef]
  76. Hammad, M.; Ebaid, M.S.Y. Comparative economic viability and environmental impact of PV, diesel and grid systems for large underground water pumping application (55 wells) in Jordan. Renewables 2015, 2, 12. [Google Scholar] [CrossRef] [Green Version]
  77. Wskaźniki Emisyjności CO2, SO2, NOx, CO i Pyłu Całkowitego Dla Energii Elektrycznej na Podstawie Informacji Zawartych w Krajowej Bazie o Emisjach Gazów Cieplarnianych i Innych Substancji za 2019 Rok. 2020. Available online: https://www.kobize.pl/uploads/materialy/materialy_do_pobrania/wskazniki_emisyjnosci/Wskazniki_emisyjnosci_grudzien_2020.pdf (accessed on 1 June 2022).
  78. Krawczak, E. Studies on PV power plant designing to fulfil the energy demand of small community in Poland. E3S Web Conf. 2019, 116, 00040. [Google Scholar] [CrossRef]
  79. Farja, Y.; Maciejczak, M. Economic Implications of Agricultural Land Conversion to Solar Power Production. Energies 2021, 14, 6063. [Google Scholar] [CrossRef]
  80. Warner, E.S.; Heath, G.A. Life Cycle Greenhouse Gas Emissions of Nuclear Electricity Generation. J. Ind. Ecol. 2012, 16 (Suppl. 1), 73–92. [Google Scholar] [CrossRef]
  81. Kadiyala, A.; Kommalapati, R.; Huque, Z. Evaluation of the Life Cycle Greenhouse Gas Emissions from Hydroelectricity Generation Systems. Sustainability 2016, 8, 539. [Google Scholar] [CrossRef] [Green Version]
  82. Shlapak, M. Carbon Emission Factor for Ukrainian Electricity Grid. 2017. Available online: https://www.linkedin.com/pulse/carbon-emission-factor-ukrainian-electricity-grid-mykola-shlapak/?articleId=6324279390976962560 (accessed on 29 April 2022).
  83. Roth, M.B.; Jaramillo, P. Going nuclear for climate mitigation: An analysis of the cost effectiveness of preserving existing U.S. nuclear power plants as a carbon avoidance strategy. Energy 2017, 131, 67–77. [Google Scholar] [CrossRef]
  84. Raadal, H.L.; Gagnon, L.; Modahl, I.S.; Hanssen, O.J. Life cycle greenhouse gas (GHG) emissions from the generation of wind and hydro power. Renew. Sustain. Energy Rev. 2011, 15, 3417–3422. [Google Scholar] [CrossRef]
  85. In 2020, the Installed Capacity of WPPs and SPPs Increased by 41% and Their Share in the Generation Mix Doubled. Ukrenergo. Available online: https://ua.energy/general-news/in-2020-the-installed-capacity-of-wpps-and-spps-increased-by-41-and-their-share-in-the-generation-mix-doubled/ (accessed on 29 April 2022).
  86. Moro, A.; Lonza, L. Electricity carbon intensity in European Member States: Impacts on GHG emissions of electric vehicles. Transp. Res. Part D 2018, 64, 5–14. [Google Scholar] [CrossRef]
  87. Agriculture of Ukraine. Statistical Yearbook. 2020; Agriculture of Ukraine: Kyiv, Ukraine, 2021. Available online: http://www.ukrstat.gov.ua/druk/publicat/kat_u/2019/zb/09/Zb_sg_2020.pdf (accessed on 15 May 2022).
  88. Crop Production of Ukraine 2019. Statistical Yearbook. Kyiv 2020. Available online: http://www.ukrstat.gov.ua/druk/publicat/kat_u/2020/zb/04/zb_rosl_2019.pdf (accessed on 15 May 2022).
  89. Durczak, K. Reliability of Agricultural Tractors According to Polish Farmers. Teh. Vjesn. 2020, 27, 1761–1766. [Google Scholar] [CrossRef]
  90. Lorencowicz, E.; Uziak, J. Regional structure of tractor market in Poland. Agric. Eng. 2020, 24, 51–62. [Google Scholar] [CrossRef]
  91. Hou, G.; Sun, H.; Jiang, Z.; Pan, Z.; Wang, Y.; Zhang, X.; Zhao, Y.; Yao, Q. Life cycle assessment of grid-connected photovoltaic power generation from crystalline silicon solar modules in China. Appl. Energy 2016, 164, 882–890. [Google Scholar] [CrossRef]
  92. Holka, M.; Bieńkowski, J. Carbon Footprint and Life-Cycle Costs of Maize Production in Conventional and Non-Inversion Tillage Systems. Agronomy 2020, 10, 1877. [Google Scholar] [CrossRef]
  93. O’Neill, M.; Lanigan, G.J.; Forristal, P.D.; Osborne, B.A. Greenhouse Gas Emissions and Crop Yields From Winter Oilseed Rape Cropping Systems are Unaffected by Management Practices. Front. Environ. Sci. 2021, 9, 716636. [Google Scholar] [CrossRef]
  94. Debaeke, P.; Casadebaig, P.; Flenet, F.; Langlade, N. Sunflower crop and climate change: Vulnerability, adaptation, and mitigation potential from case-studies in Europe. OCL 2017, 24, D102. [Google Scholar] [CrossRef] [Green Version]
  95. Rajaniemi, M.; Mikkola, H.J.; Ahokas, J. Greenhouse Gas Emissions from Oats, Barley, Wheat and Rye Production. Agron. Res. 2011, 9, 189–194. [Google Scholar]
  96. Gan, Y.; Liang, C.; Chai, Q.; Lemke, R.L.; Campbell, C.A.; Zentner, R.P. Improving farming practices reduces the carbon footprint of spring wheat production. Nat. Commun. 2014, 5, 5012. [Google Scholar] [CrossRef] [PubMed] [Green Version]
  97. Gan, Y.; Liang, C.; May, W.E.; Malhi, S.S.; Niu, J.; Wang, X. Carbon footprint of spring barley in relation to preceding oilseeds and N fertilization. Int. J. Life Cycle Assess. 2012, 17, 635–645. [Google Scholar] [CrossRef]
  98. Sustainable Development Goals. Available online: https://www.unodc.org/roseap/en/sustainable-development-goals.html (accessed on 10 July 2022).
  99. Al Mamun, M.A.; Dargusch, P.; Wadley, D.; Zulkarnain, N.A.; Aziz, A.A. A review of research on agrivoltaic systems. Renew. Sustain. Energy Rev. 2022, 161, 112351. [Google Scholar] [CrossRef]
  100. Valle, B.; Simonneau, T.; Sourd, F.; Pechier, P.; Hamard, P.; Frisson, T.; Ryckewaert, M.; Christophe, A. Increasing the total productivity of a land by combining mobile photovoltaic panels and food crops. Appl. Energy 2017, 206, 1495–1507. [Google Scholar] [CrossRef]
Figure 1. Brent crude oil price.
Sustainability 14 08607 g001
Figure 2. EU natural gas price history.
Sustainability 14 08607 g002
Figure 3. The evolution of the wholesale electricity price in Ukraine and selected EU countries in 2021.
Sustainability 14 08607 g003
Figure 4. Precipitation for the Mykolaiv and Opole regions.
Sustainability 14 08607 g004
Figure 5. The average annual air temperature in the Mykolaiv and Opole regions.
Sustainability 14 08607 g005
Figure 6. Land area of primary crops.
Sustainability 14 08607 g006
Figure 7. The average yearly solar radiation and the Net Present Value in the Mykolaiv region.
Sustainability 14 08607 g007
Figure 8. The average yearly solar radiation and the Net Present Value in the Opole region.
Sustainability 14 08607 g008
Figure 9. The coefficients of variation.
Sustainability 14 08607 g009
Figure 10. The generation mix in Ukraine.
Sustainability 14 08607 g010
Figure 11. Carbon dioxide emissions savings, the Mykolaiv region.
Sustainability 14 08607 g011
Figure 12. Carbon dioxide emissions savings, the Opole region.
Sustainability 14 08607 g012
Figure 13. Carbon dioxide emissions footprints and savings, tCO2/(ha·year).
Sustainability 14 08607 g013
Table 1. Numerical values, coefficients and quantification of the costs for the case studies.
Symbol
(If Present)
DescriptionUnitValue or Calculation
Resolution of raster mapssquared pixel, m100
Upper limit of slope%20
Upper limit of altitudem a.s.l.800
Hypothesised hours of sun per dayhour10
Hypothesised days of sun per yearday300 for Mykolaiv region;
280 for Opole region
kNet available surface for PV plants installation%20
ηPV plant efficiency%75
pPrice of PV powerEUR/MWh107 for Mykolaiv region;
57 for Opole region
incAdditional optional incentives for PV energyEUR/MWh
rDiscount rate%3
dYearly decay of performance of photovoltaic modules%1
lcLifetime for PV plantsyears20
PInstalled PV powerMW/ha1
uUnit cost for fixed ground-mounted PV panels installationEUR/MW1,180,000
IPurchase and installation costEUR/haI=P·u·k
gCost for PV plants connection to electric gridEURCosts for the connection to the grid are differentiated according to the distance. In the absence of a regional dataset on geographic distribution of grid, a first approximation considered the distance (D) from i-th pixel to roads: 620 + (if D ≤ 200: EUR186; if 200 < D ≤ 700: EUR279; if 700 < D ≤ 1200: EUR836; if D > 1200: EUR1950).
RCost for rent of not irrigated arable landEUR/(ha year)150 for the Mykolaiv region;
266 for the Opole region
mMaintenance cost for PV plantsEUR/(ha year) m = 0.01 I [61]
cCleaning cost for PV plantsEUR/(ha year) c = 1000 i f 0.01 I < 1000 0.01 I i f 0.01 I > 1000 [73]
aAdministrative and consultancies costs for PV plantsEUR/(ha year) a = 3000 i f 0.01 I < 1000 0.01 I i f 0.01 I > 3000 [73]
sInsurance cost for PV plantsEUR/(ha year) s = 2000 i f 0.0015 I < 2000 0.0015 I i f 0.01 I > 2000 [73]
dDecommissioning cost for PV plantsEUR/MW331,200 [58]
Table 2. The Mykolaiv and Opole regions: agricultural features.
SpecificationUnitMykolaiv RegionOpole Region
Sown areathousand ha1699.7466.8
Agricultural land area per tractorha per unit26514.9
Average nominal tractor engine powerkW97.346.5
Consumption of fertilizersthousand tones171.798.2
kg per ha101210.4
Diesel fuel consumptionkg/ha57.59161.57
Table 3. Crop yields, t/ha.
CropMykolaiv RegionOpole Region
MinimumMaximumAverageMinimumMaximumAverage
wheat1.644.203.084.206.575.34
barley1.293.772.563.235.244.29
corn2.495.173.914.249.397.07
sunflower1.352.171.80---
rapeseed1.312.581.942.143.942.96
triticale---3.004.954.13
cereal mixed---2.944.053.48
Table 4. Investment costs.
MachineNumber per 1000 haCosts, EUR/ha
tractor3.77169.43
combine harvester0.80184.92
truck3.1282.68
plough1.894.88
cultivator2.6922.10
harrow6.9833.63
drill2.5526.41
machines for plant protection0.805.00
fertilizer spreader0.842.31
Total: 531.35
Table 5. The economic indicators for alternative projects (the PV and the crop cultivation in the Mykolaiv region).
IndicatorUnitPVCrop CultivationPV to Crop Cultivation Ratio
Investment coststhousand EUR/ha729.240.5311373.3
Lifetimeyear2082.5
NPVthousand EUR
  • Minimum
220.000.04764621.8
  • Maximum
910.007.111127.9
  • Average
771.832.904265.8
Profitability index-
  • Minimum
1.3021.0901.19
  • Maximum
2.24814.3840.16
  • Average
2.0576.4650.32
Table 6. The economic indicators for alternative projects (the PV and the crop cultivation in the Opole region).
IndicatorUnitPVCrop CultivationPV to Crop Cultivation Ratio
Investment coststhousand EUR/ha729.241.539
Lifetimeyear20201
NPVthousand EUR
  • Minimum
10.76.51.65
  • Maximum
97.09.89.89
  • Average
71.98.38.66
Profitability index
  • Minimum
1.015.220.19
  • Maximum
1.137.390.15
  • Average
1.106.370.17
Publisher’s Note: MDPI stays neutral with regard to jurisdictional claims in published maps and institutional affiliations.

