Article

Analysis on the Evolution and Resilience of Ecological Network Structure in Wuhan Metropolitan Area

1
School of Architecture and Urban Planning, Huazhong University of Science and Technology, Wuhan 430074, China
2
Hubei Engineering and Technology Research Center of Urbanization, Wuhan 430074, China
3
Built Heritage Research Center, Huazhong University of Science and Technology, Wuhan 430074, China
4
North China Power Engineering Co., Ltd., Beijing 100022, China
*
Author to whom correspondence should be addressed.
Sustainability 2022, 14(14), 8580; https://doi.org/10.3390/su14148580
Submission received: 24 May 2022 / Revised: 24 June 2022 / Accepted: 28 June 2022 / Published: 13 July 2022
(This article belongs to the Special Issue Landscape Analysis, Planning and Regional Development)

Abstract

:
With the accelerated urbanization and frequent occurrence of climate extremes, the regional ecosystem service level has ushered in a great challenge, and the resilience of the ecological network has gradually weakened, leading to lower ecological benefits and production levels. As a core ecologically sensitive area in the middle reaches of the Yangtze River, Wuhan metropolitan area has been expanding outward with rapid urbanization, crowding out surrounding arable and ecological land, and facing serious challenges to the sustainable development of the national space, while current cross-regional ecological protection measures need to be strengthened urgently, and exploring the structural resilience of its ecological network is of great significance to promote regional stability. In this study, Wuhan metropolitan area is taken as an example, and we explore the evolution and laws of ecological network structure from the perspective of network analysis by constructing ecological networks in Wuhan metropolitan area in 2000, 2010, and 2020. Firstly, we select regions from the ecological control line developed in China as ecological source sites, and also select multivariate data to supplement them. Then, the ecological network was established using the MCR model. Finally, network analysis was applied to discuss the evolution of network structure under multiple times and propose corresponding conservation strategies. The results show that (1) the major ecological resistance of Wuhan urban area has increased by 5.24% in 20 years. (2) The centrality and connectivity of the network nodes have increased over the 20-year period, and the overall structure of the network has stabilized and the resilience of the network has increased. (3) There is a strong link between changes in the network as a whole and local resilience. The results of the study will help analyze the relationship between the network as a whole and the region, and provide reference for optimizing the ecological network and constructing the systematic management of ecological security pattern.

1. Introduction

Global unsustainable human activities have a significant impact on the Earth’s ecosystem and threaten the ecological basis of the entire human society which results in global vegetation change and biodiversity reduction [1]. The disorderly expansion of cities usually leads to the heavy loss of ecological land, resulting in the continuous loss and fragmentation of natural habitats [2]. Landscape fragmentation results in the reduction in internal habitat patch area, the truncation of ecological corridors, and the decrease in landscape connectivity, which interferes with the normal landscape ecological process and ecological regulation ability, damages the health integrity of the ecosystem, and leads to the change of ecosystem service function [3,4]. In order to change this situation and strengthen the connections among ecosystems, local governments in China have formulated an ecological control line policy to maintain the integrity of urban ecosystems [5]. The ecological control line (ECL) is a series of closed spatial boundaries for preventing urban sprawl and ensuring the integrity and stability of regional ecosystems [6]. The policy strictly implemented an ecological protection program within the ECL in order to prevent further ecological degradation [5]. Wuhan metropolitan area is located in the middle reaches of the Yangtze River in the east of Hubei province, Central China (Figure 1). It has a very important strategic position in the development plan of China’s Yangtze River Economic Belt. Wuhan metropolitan area is not only the province’s economic center, but also one of the largest regional economic unions in China, with over 31.80 million residents currently living in its 57,968 km2 boundary [7]. With the proposal of the national strategy of the “Rise of Central China” plan and the construction of the “1 + 8 Wuhan metropolitan area”, the urbanization rate of the Wuhan metropolitan area has reached 63.521%. The built-up areas are expanding outward, compacting the surrounding cultivated and natural lands and hindering the sustainable development of the national land space [8]. In 2022, the Chinese government released the 14th Five-Year Plan for the Development of Urban Agglomerations in the Middle Reaches of the Yangtze River (the National Development and Reform Commission of China approved the plan on 24 February 2022) as the backbone of economic development in the Yangtze River middle reaches. Researching the Wuhan metropolitan area’s ecological security pattern is critical to the delivery of this plan. Ecosystem damage diminishes the size of internal habitat patches and destroys biological corridors, reducing the ecological landscape connectivity, which influences species migration and exchange [9]. The ecological security patterns also affect ecosystem function and service sustainability [10].
The ecological security pattern is an important basis for linking the ecological environment with sustainable socio-economic development [11]. The ecological network [12] is integral to regional spatial characteristics [13]. Ecological environment security and species diversity can be effectively maintained through ecological network construction [14,15]. To evaluate and respond to patterns, processes, and spatial relationships in actual landscape ecological networks, patterns and landscape connectivity indices are currently used [15]. In recent years, several approaches have been developed for constructing ecological network models, including the minimum cost distance method, the graph theory, and the recent theories (Table 1). The majority of these approaches consider node properties and relationships. However, the frequency of natural and man-made disasters has led to the integration of resilience as an overall stability concept into network research [16,17]. Ecological network stability influences the network overall structure, and ecological networks are a common representation of the geographical characteristics that determine a region’s sensitivity to shock, adaptability to shock, and growth capacity [18]. Thus, studying the resilience of ecological networks is vital.
Numerous studies have established that network resilience [28] is related to network structure.Network resilience can be evaluated using indicators such as network efficiency [17,29], network security [30], and network accessibility [31]; however, there is no unified network resilience evaluation approach. The effect of network nodes on network resilience has long been debated in several fields. Particularly, one study [32] argued that the frequent occurrence of man-made and natural disasters might cause network disruption, which can alter the normal functioning of nodes and result in other unpredictable outcomes. The importance, number, and connectivity of nodes within a network also determine network resilience, according to a previous study [33]. However, thus far, there has been little consideration of the relationship between nodes and overall network resilience.
The network analysis method considers the interactions among distinct components or neighboring levels within a network and combines the entire network for comparison [34]. This way, node-to-node and network-wide relationships can be effectively analyzed [35]. In network analysis, complex landscape features are reduced to simple nodes and associated edges to elucidate the network flow of ecological landscapes and structures [36]. The structure and function of the landscape network can also be calculated from the overall network density, network connectivity, and network circuitry [37]. Research has been conducted on the effects of node spatial distribution, node connectivity [33,38], and node function and structure [39] on network and node analysis. Most of the studies on ecological network resilience research have focused on the link between physical structure, ecological function, and the ecological network.
Thus, rather than focusing solely on the spatial relationship between nodes and network resilience, this study applies network science methods to investigate network resilience from a multi-temporal and varied perspective to clarify the influence of multiple indicator changes within network nodes on network resilience. The effects of changes in multiple network node indicators on network resilience are investigated.

2. Materials and Methods

2.1. Data Sources and Research Framework

Data were gathered from multiple sources at various time points. The sources include Landsat 4–8 satellite remote sensing band maps (with a basic grid size cell of 30 × 30 m); 2015 geographic digital elevation data on Hubei Province obtained from the geospatial data cloud of the Chinese Academy of Sciences (www.gscloud.cn/search accessed on 10 December 2021); land use maps of the Wuhan metropolitan area in Hubei Province for 2000, 2010, and 2020 (www.globallandcover.com accessed on 20 December 2021); and the ecological red line diagram of the Wuhan metropolitan area from the Delineation Scheme of Ecological Protection Red Line in Hubei Province (2017). The ecological resistance range was identified according to three factors: land use, vegetation coverage, and geographical feature information for 2000, 2010, and 2020. The variables of landscape resistance were computed using ArcGIS Pro software (2.5.0/Esri, Redlands, CA, USA) to produce an ecological resistance surface. The cost distance was determined using the minimum cumulative resistance (MCR) model. In this study it is necessary to analyze the linkage between the overall network and the internal nodes through the connectivity of the nodes in the ecological network, and the MCR model can calculate the biomigration costs of different landscapes in order to simulate the minimum cumulative resistance paths for constructing ecological network. These resistance paths together constitute the ecological network. Finally, network analysis is applied to compare the ecological network values in 20 year to discover its change pattern (Figure 2).

2.2. Methods

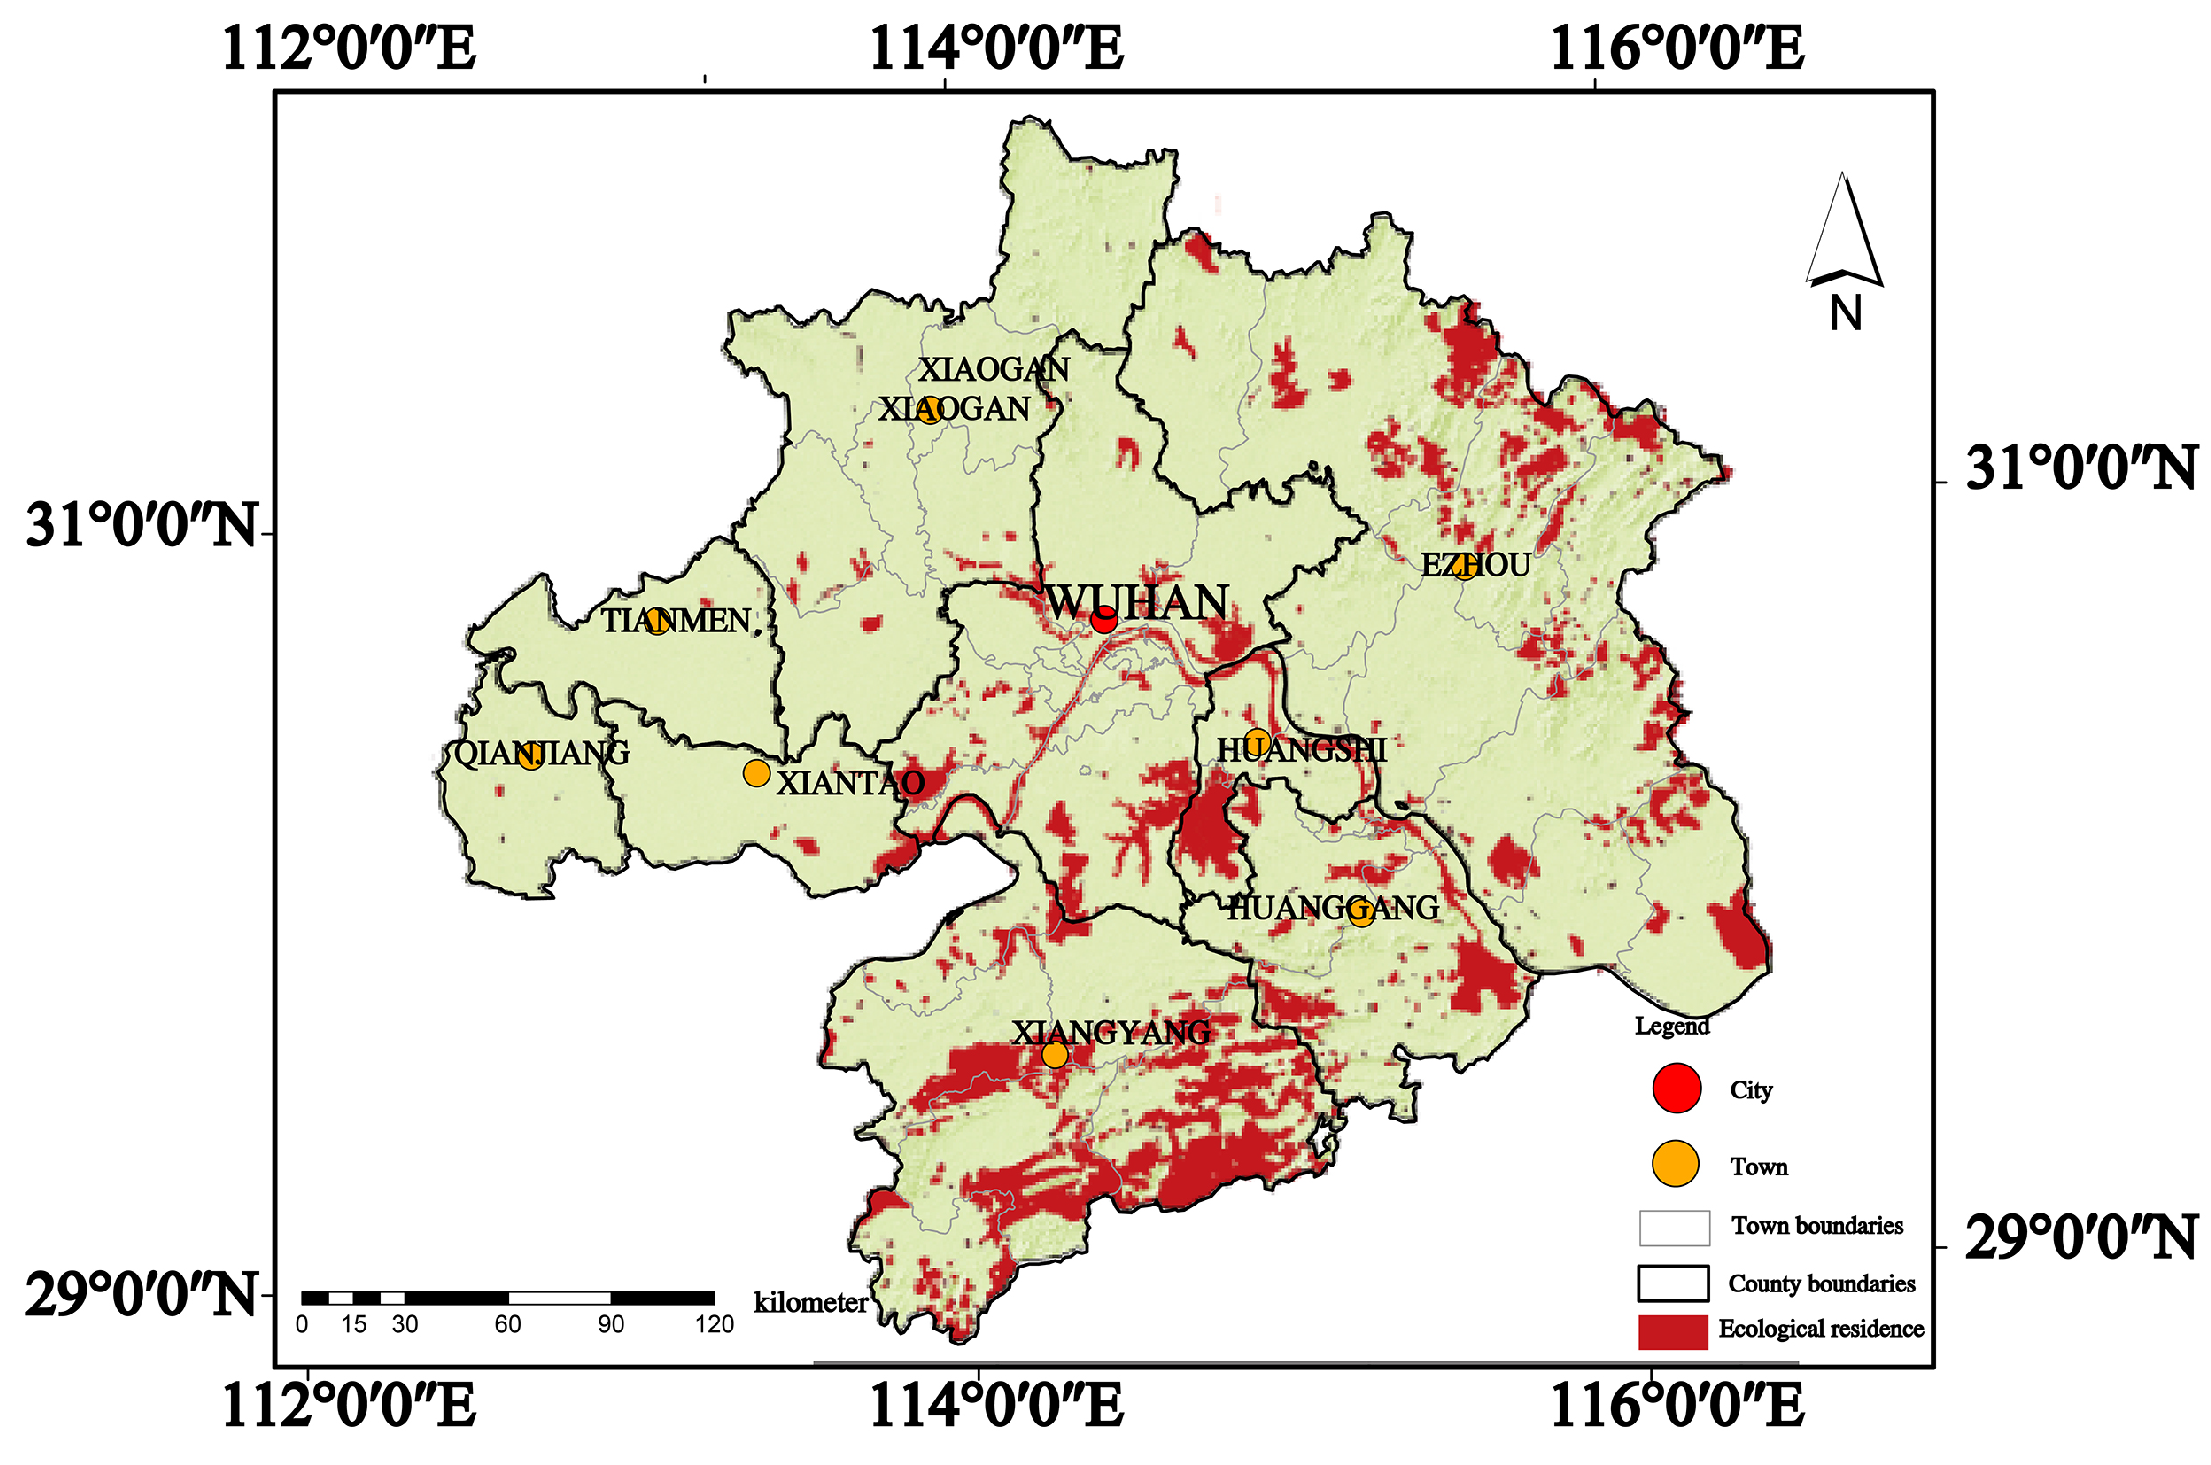
2.2.1. Recognition of Ecological Source Sites

Ecological source sites are “sources” of ecological land preservation, and they are chosen from regions with strong ecological functions and abundant biodiversity and existing species’ habitats. The exchange and spread of species are also considered in the selection of source sites [6]. The ecological source area of the Wuhan metropolitan region (Figure 3) was defined according to the ecological red line range of the “Hubei Province Ecological Protection Red Line Delimitation Scheme” issued by the Hubei provincial government in 2017. The ecological source regions of the Wuhan metropolitan area are widely distributed, with the south and northwest having the most and fewest regions, respectively.

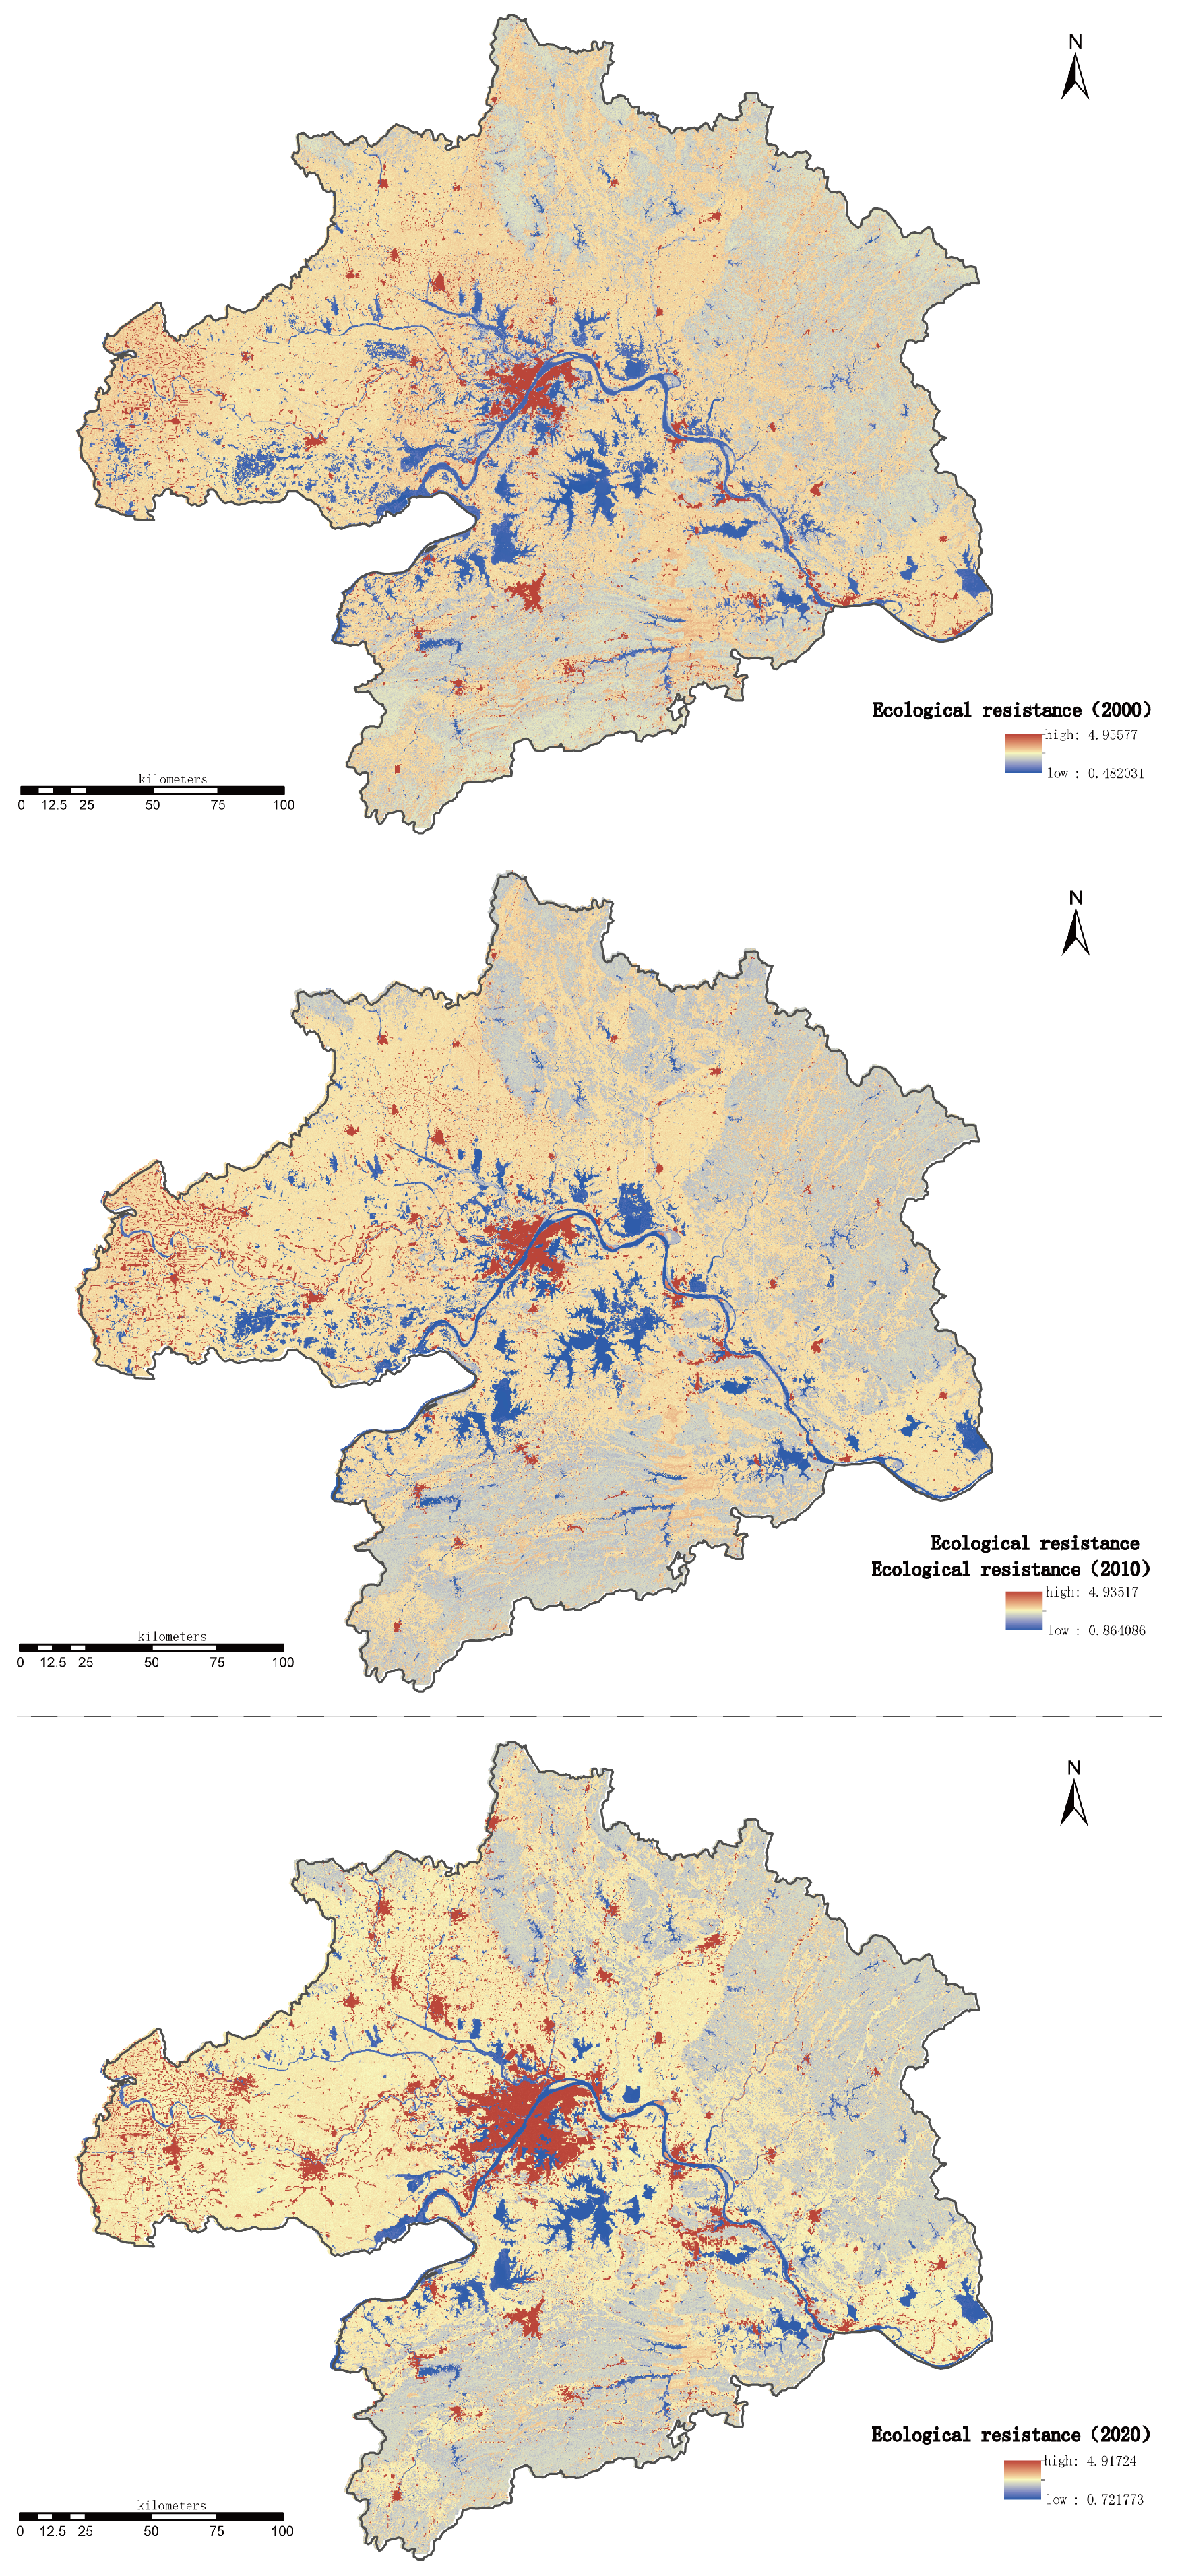
2.2.2. Construction of Ecological Resistance Surface

  • Land use type
    Land use, a significant component influencing biological landscape movement, reflects the positive or negative effects of various land use attributes on landscape movement. The land use in the research area is divided into water areas, natural protection land, forest land, grassland, cultivated land, bare land, facility land, and urban construction land, according to the “Classification of Land Use Status” (GB/T 21010-2017) standard (Table 2). Land use patterns differ considerably in ecological resistance creation, and thus depict the internal organic relationships in the ecological security pattern.
  • Vegetation coverage
    Fractional vegetation cover (FVC) measures vegetation density and reflects its growth pattern, and is a significant index for ecosystem description. This study estimated the impact of vegetation cover on an ecological resistance surface in the Wuhan metropolitan area using FVC as the foundational data.
  • Geographical feature information
    Geographical factors considerably affect ecological corridors, and clear disparities occur between mountainous and plains regions. In this study, the change in slope was primarily explored in the evaluation of geographical attributes. The 2000, 2010, and 2020 geographic elevation data of the Wuhan metropolitan area were evaluated using the main guidelines of comprehensive management planning for soil and water conservation (GB/T15772-2008).
  • Weight calculation
    According to previous research [40], the effects of natural conditions and human disturbance must be considered in the construction of a resistant surface. The importance of each element is represented by the increment value of each weight ( d I ). Patch connection is more critical when the weight is higher. The weights for the Wuhan metropolitan area were calculated over time using Formula (2), and the resistance was split into five levels: most important (5), very important (4), important (3), potential (2), and general (1) (Table 3).

2.3. Minimum Cumulative Resistance Model

The minimum cumulative resistance (MCR) model is widely used in the study of species migration and diffusion to simulate the tendency and possibility of species movement [41]. The MCR model is widely used to predict the urban land evolution process and landscape security patterns of natural areas. The core of the MCR model operation includes source area selection and ecological resistance surface construction [42]. Previous research has assumed that the urban ecological landscape continually increases, with the sources serving as the primary focal points. Other units will encounter resistance to the expansion range. The greater the resistance to the expansion, the greater the difficulty of environmental protection. The minimal resistance surface is determined from the ecological expansion resistance graph (Table 4).

2.4. Network Analysis

According to graph theory, network analysis [46] considers internal nodes and network structure as a system in an abstract network [47]. To facilitate the analysis of complex factors and values in the abstract network, the network nodes are often linked, and the nodes and the corresponding change in the overall structure are analyzed. Node indicators are stratified to observe the influence of the network nodes. The connectivity and centrality coefficients represent the connectivity and degree of correlation between nodes. The indicators of ecological nodes are evaluated using three indicators: C AD (Equation (4)), C BC (Equation (5)), and C CC (Equation (6)). To compare the structural change in overall network toughness, the average clustering coefficient (Equation (7)) and the closeness centralization (Equation (8)) of the network structure are simultaneously determined (Table 5).

3. Results

3.1. Ecological Resistance Surface Construction

Ecological minimum cumulative cost resistance was calculated for three years (2000, 2010, and 2020) based on land use type, geographic information, and fractional vegetation cover. The three-year integrated resistance surface was reclassified and thus the suitability zoning was obtained (Figure 4). The results show that the integrated resistance values of the key construction areas are between 5 and 4 (red areas in the figure), which are concentrated in the central city of Wuhan and the central city of each administrative region. These areas have large populations and large construction land areas, and the development of construction land in these areas will cause less damage to the environment, and can be used as key construction areas. In the process of development and construction in the key construction areas, attention should be paid to improving the land utilization rate and reducing the damage to the environment. The optimized construction area has a resistance value between 4 and 3 (yellow area in the figure), which is mainly located in the arable land and grassland of Wuhan metropolitan area. These areas can be used as complementary areas to the priority construction areas, so they are treated as optimized construction areas. The optimized construction zone is not spread around the source, and the southern part of the study area is more suitable for the expansion of construction land than the northern part, mainly due to the weakened ecological environment in the north, which should be optimally laid out to focus on the protection of forest land and arable land in the development process. The comprehensive resistance value of the restricted construction zone is between 3 and 2 (gray area in the figure), and the land type mainly includes grassland, woodland and some wetlands, whose role is to maintain ecological diversity, purify air, and provide water for the region. As a secondary suitable zone for the expansion of construction land, the restricted construction zone has more strict requirements for the development of construction land in this area, so construction in this area should be developed in an orderly manner according to the priority of construction land projects. The ecological restoration area has a comprehensive resistance value between 0 and 2 (blue area in the figure), mainly around rivers and lakes, and its land type is mainly lakes and wetlands. The ecological environment in the ecological restoration area is fragile, so the ecological protection in this area should be paid attention, all related construction activities in this area should be prohibited, and relevant policies should be formulated to protect it, with emphasis on ecological construction and environmental protection. The key construction area and the optimized construction area are taken as the main resistance surface, from which it is found that the ecological resistance surface increased by 5.24% from 2020 to 2000. This is due to the rapid expansion of construction land and the obstruction of the road network transportation system and the expansion of the resistance surface is mainly concentrated in the central cities and prefecture-level cities in Wuhan. The slower growth of ecological resistance surface in the northwestern region is caused by the slower urbanization of the region, which is far from the central city of Wuhan.

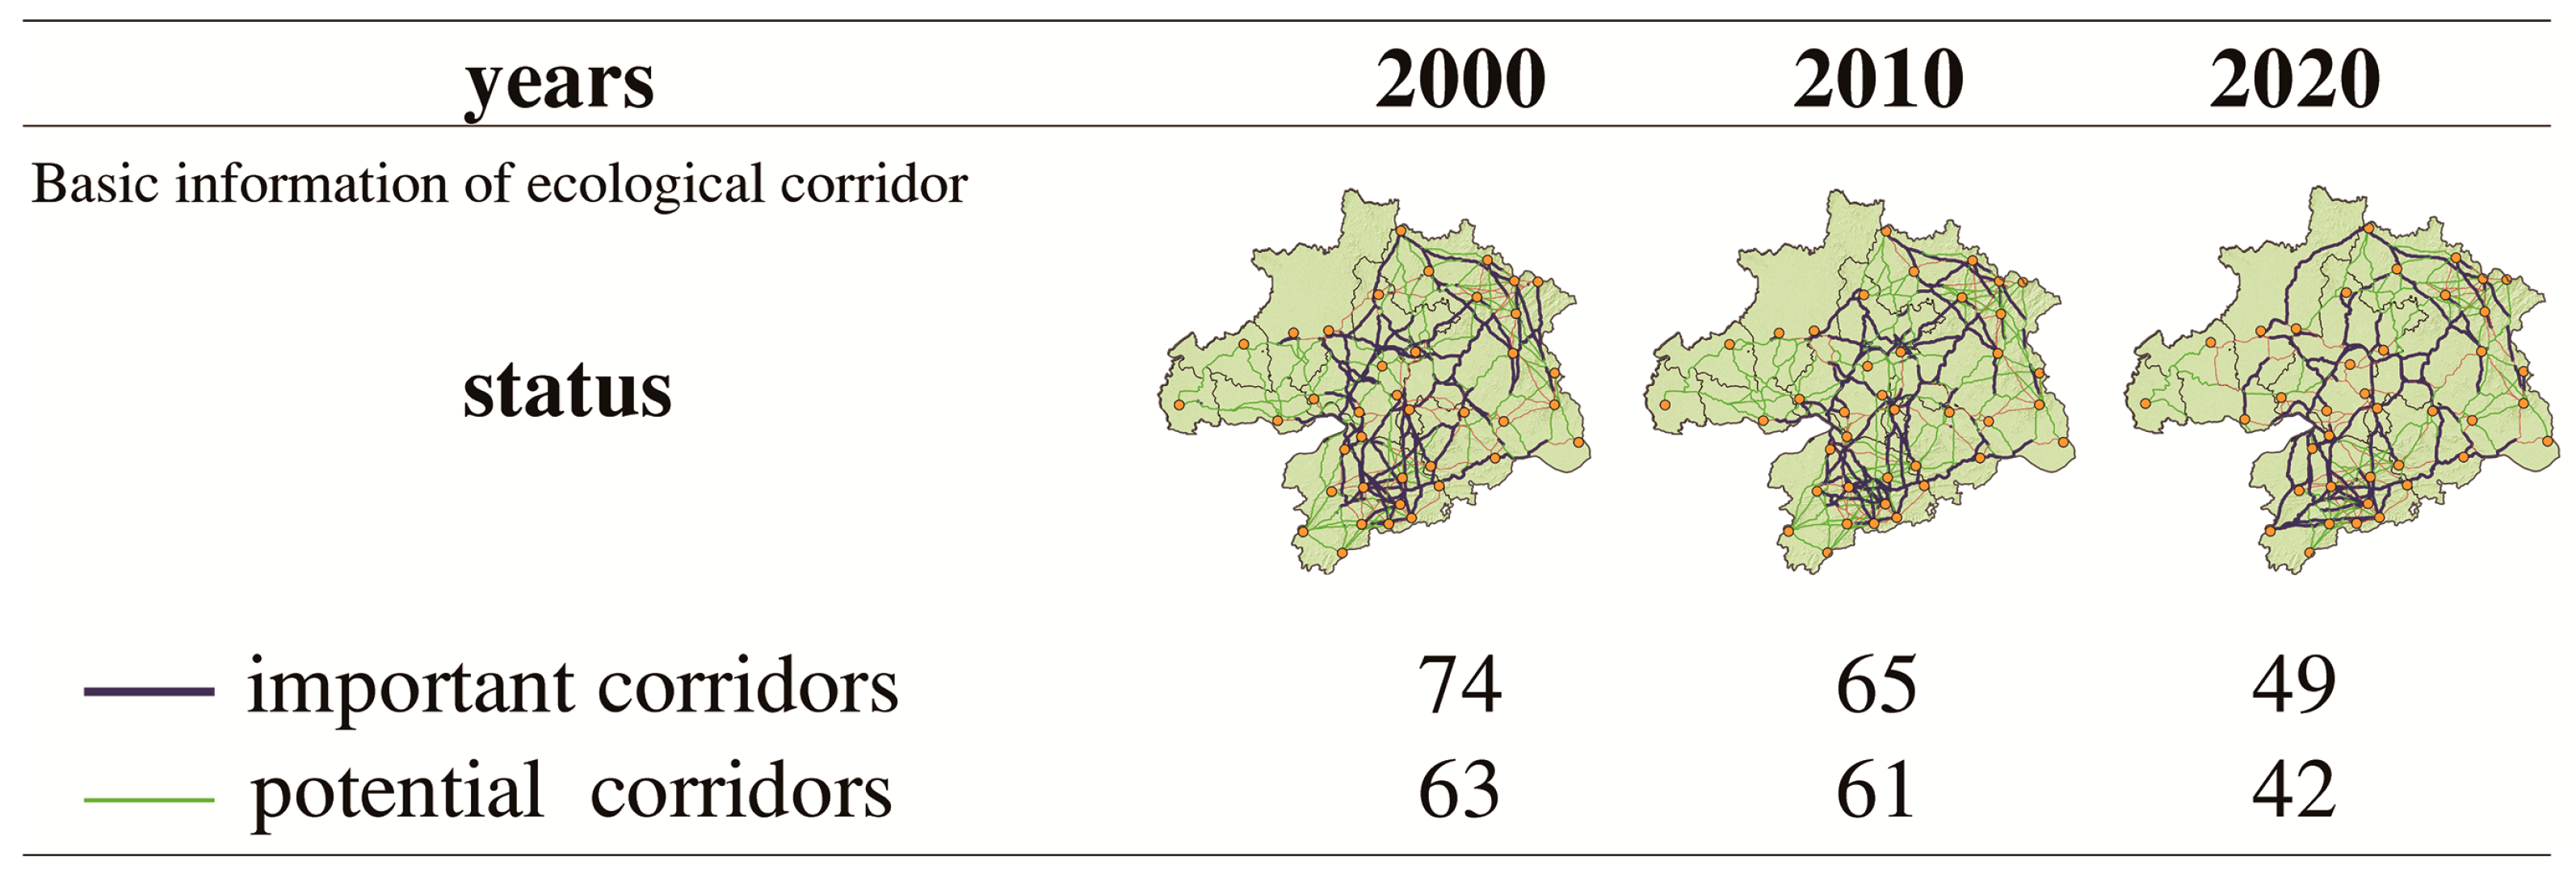
3.2. Ecological Corridor Generation

The ecological corridor was determined from the calculated M C R , with biological migration allowing for habitat-to-habitat crossing between ecological corridors and ecological nodes. According to the results (Figure 5), there were 74, 65, and 49 significant ecological corridors and 63, 61, and 42 potential ecological corridors in 2000, 2010, and 2020, respectively. The core nodes (19) are ecological nodes derived from the ecological source, and the secondary nodes are the corridor intersections. The core and secondary nodes make up the three-year ecological corridors. Between 2000 and 2010, the number of ecological corridors in the Wuhan metropolitan area decreased, with the number of important ecological corridors reducing by nine and the number of potential ecological corridors decreasing by two. Between 2010 and 2020, the major corridors decreased by 16 and the potential corridors by 19. Consequently, the main corridors are concentrated in the southern region.

3.3. Ecological Network Structure

Figure 6 compares the multiple network coefficients of the ecological corridor network structure over the three years. The results show the following:
  • Figure 6 depicts an upward trend in the average degree of ecological networks over the last three years. Figure 6 compares the 2000–2010 data with the 2010–2020 data. Over the years, the average degree first increases and then decreases, although the overall trend is stable. Further statistical analysis reveals that the most important ecological nodes in the Wuhan metropolitan area are found in the southern forests and along the western waterways. The central and southern regions have the strongest network connectivity, and the mutual influence among nodes is clearer, as depicted by the average degree.
  • The closeness centrality group reveals an overall increasing trend (Figure 6). Closeness centrality represents the closeness of a node to other nodes. The closeness centrality of the Wuhan metropolitan area expands as the city grows. The most important nodes are located around Wuhan and extend to the southern forest (Figure 6). The important nodes are also centered in the southern forest and agricultural area.
  • The overall indirect centrality of ecological networks has declined over the years (Figure 6). Despite the consistency in the number of the most important nodes over the past 20 years, the number of important nodes has reduced by 31.25% due to a decrease in the number of corridors. This directly influences the network scope of information dissemination, lowering the ecological network ability to control information and resource exchange among nodes.
  • Figure 6 demonstrates that the overall clustering coefficient has been increasing over the study period. The Wuhan metropolitan area’s overall connectivity is improving. The top half of the table demonstrates that, while the network propagation scope is weakening, the network connectivity and wholeness have expanded over the years. Consequently, the “near-center potential” was chosen to assess the changes in the overall ecological network to further study the entire network hierarchy and clarify the network structural stability. The closeness centralization of the Wuhan urban area has weakened over the years, as shown in the bottom half of the table. According to the findings of the network structure study, the network closeness centralization in the Wuhan metropolitan area has decreased, its variability has decreased, and its connectivity and balance have increased.
Figure 6. Ecological network node diagram.
Sustainability 14 08580 g006

4. Discussion

4.1. Relationship between Network Analysis Indicators and Network Resilience

Human activities have strongly altered the Earth’s surface, making landscape fragmentation a common form of ecological space [53]. In this case, large patches and fragmentation patches are usually randomly distributed in the landscape. In order to construct connections between them, this paper applies the method of constructing ecological networks and discusses and analyzes the structural changes within the network and the evolution of the overall network through network analysis. Tthe intersection of nodes and linkages forms an landscape ecological network. Such networks [54] are important for the exchange of energy, materials, and information between landscape elements [55]. Understanding the system structure and function is critical to clarifying its elasticity. In the analysis of the network function and structure [56], considering the physical and logical connections between nodes [57] and the diffusion and transferability of nodes [58] is vital. Moreover, understanding the structure and function of a system is critical to clarifying its resilience mechanism. The physical logical connection between nodes and the diffusion and transferability of nodes must be considered in the study of network function and structure [59]. Changes in the resilience of the overall network topology are linked to changes in the nodes. This allows for a more comprehensive examination of the effects of node changes on network resilience. This research is the first to consider the change in node importance and the number of three-year investigation periods over the past 20 years. Second, the differences in connectivity between nodes are analyzed and compared with the overall network resilience. The changes in a single node indicator do not directly explain the network change law. All node indicators should be included, and their impacts comprehensively examined. The assessment of the betweenness centrality, closeness centrality, and average degree indicators can reveal numerical changes in abstract networks, which can indicate the changes in node values within the network. The findings of this study reveal the following:
  • The network indicators of nodes have an important connection with the overall network structure. With the simplification of the network structure over 20 years, it is concluded from the changes of clustering coeifficent and closeness centralization that the overall ecological network structure of Wuhan metropolitan area tends to be stable.
  • The overall increase in the average degree index of the nodes within the network represents an increase in the average degree of the nodes within the network, an increase in the structural resilience of the nodes, and an increase in the stability of the equilibrium of the network.
  • In past 20 years, the increase in closeness centrality makes the connectivity between nodes within the network enhanced, the functional resilience of nodes enhanced, and the circulation of material and information within the network enhanced.
  • The yearly decrease in betweeness centrality indicates a weakening of structural variability within the network, an increase in functional resilience of important nodes, a weakening of the more centripetal overall network, and a more even index of all nodes in the network.

4.2. Impact of Network Analysis of Regional Ecological Security Patterns

To conduct targeted protection operations to establish ecological security patterns, it is necessary to define ecologically important objects and areas and protection targets. Network analysis is a multifactor method for node analysis that is based on the combination of important objects and connectivity levels. To optimize the object of the ecological security protection pattern, analyzing the important ecological objects and connectivity levels and formulating corresponding protection strategies is vital. The network structure of ecological corridors can be optimized through the coordination of important nodes and connectivity. Network structure optimization can improve both the efficiency and overall protection of an ecosystem. This study develops a “whole-node” ecological security pattern optimization framework according to the above concepts. Such a framework is critical for ecosystem protection.

4.2.1. Strengthening of Node

Integrity is a critical component of a network structure. Effective protection of all of the nodes is necessary to ensure network structure stability [60]. Thus, based on types of average degree nodes and layering results, this study presents appropriate protection mechanisms. The most important nodes in the network structure are those at the center of the range, as they reflect the distribution of ecologically important areas. The most important nodes are mainly located in the central and western areas of the Yangtze River Basin and the southern and eastern forest areas. The protection and strengthening of the nodes are important to ensure ecological network stability and circulation. The important nodes are mainly dispersed in the areas surrounding the most important nodes. This dispersion is one of the important indicators influencing average degree. In a fixed network structure, the important nodes of a region with strong node centrality are prone to the effects on other nodes, which is excellent for the collective protection of the entire area. The network integrity is unaffected by potential nodes or normal nodes. The majority of the nodes are outside the Wuhan metropolitan area, in forests and farmlands. As the purpose of node strengthening is to improve the quality and efficiency of ecological protection, it is vital to consider the scope of cultivation and construction, to avoid extensive ecological impact. In summary, both the design of eco-centric node strengthening and the preservation of important node layering must be balanced to successfully protect the region’s ecological security pattern.

4.2.2. Strengthening of Node Connectivity

In ecological safety pattern analysis, network node connectivity is an important indicator of landscape connectivity. The preservation and enhancement of node connectivity is a critical component for promoting species linkages to enable species diversity conservation and network structure improvement [61]. It should focus on the protection of important primary nodes, and at the same time carry out the improvement and protection of the surrounding ordinary nodes, so as to gradually support the improvement of the ecosystem and the overall ecological quality of the range. The most important nodes occur within ecological source areas, which can provide ecosystem services such as environmental protection, regulation, and recreation. Hierarchical network analysis of connected nodes can elucidate the changes in node connectivity, allowing for the selection of the most important ecological nodes and strong connectivity points for holistic ecological protection, and ensuring sufficient space for ecosystem services. The protection and enhancement of node connectivity can improve the network structure and ecological security pattern of the region.

4.3. The Impact of Constructed Ecological Networks on Eco-Regional Communities

Ecological networks reflect not only ecological connection, but also social management [62]. Conflict has always existed between ecological governance and local administration, which affects ecological protection and local economic development [63], particularly in the Wuhan metropolitan area, which is an administrative area with eight cities. Considering the protection norms and governance means of various regions is vital for ecological governance. Furthermore, in cross-regional ecological governance, considering ecological integration governance and the management strategy of hierarchical classification is essential. The hierarchical grading of multiple ecological nodes requires not only the protection and strengthening of nodes with strong ecological centrality, but also the integration and coordination of the network region development. It is necessary to establish an ecological management supervision mechanism of collaborative governance, an important protection point management mechanism, and unified overall planning. Moreover, improving the ecological compensation mechanism is essential. The input–output relationship of various types of production and construction is balanced with the equivalent ecological protection, and the ecological benefits and ecological supply of each administrative region are evaluated to form a coordinated development pattern of the administrative region.

4.4. Limitations and Further Research Directions

Despite the important contributions of this study, it has some limitations which deserve further research. First, the limited sample size may have resulted in deviations (bias). Further study on node recognition and network analysis methods is therefore required. Improving the recognition accuracy of regional nodes could better clarify the ecological network complexity. Second, improving the data classification and analysis framework would simplify the network structure, which would allow more cross-regional research. Nonetheless, despite its limitations, this study provides scientific guidance for the construction of ecological security patterns and the coordination of national and local ecological protection.

5. Conclusions

This study compared the changes in the ecological corridor network in the Wuhan metropolitan area in 2000, 2010, and 2020, and analyzed the relationship between node change and network resilience. The results showed that the network structure change in the Wuhan metropolitan area has been consistent over the past 20 years, and network resilience has risen over the years. This study elucidates the linkage between the resilience of ecological networks and network nodes through network analysis. From a network perspective, this approach allows for the analysis of the overall network and a clear interpretation of the mid-optimal nodes of the network. This study can provide a reference and demonstration for the construction of similar cross-scale and cross-regional ecological security patterns globally. Nonetheless, the results provide technical support for the 14th Five-Year Plan for the Development of Urban Agglomerations in the Middle Reaches of the Yangtze River (2022), thereby promoting the stability of ecological barriers in the Yangtze River middle reaches and the green development of the Yangtze River economic belt.

Author Contributions

Conceptualization, L.X., Y.W., Z.Z. and G.T.; methodology, L.X., Y.W. and Z.Z.; validation, L.X., Y.W., J.Z. and Z.Z.; formal analysis, L.X., Y.W. and Z.Z.; investion, G.T., L.X., Z.Z. and Y.W.; resources, L.X., J.Z., G.T. and Y.W.; data grooming, L.X., Y.W. and G.T.; writing—original draft preparation, L.X., Z.Z. and Y.W.; writing—review and editing, L.X., Z.Z. and Y.W.; visualization, G.T., Z.Z. and Y.W.; supervision, Z.Z., Y.W., J.Z. and L.X.; project administration, Y.W. and L.X.; and funding acquisition, L.X. All authors have read and agreed to the published version of the manuscript.

Funding

This research was funded by National Social Science Foundation of China, grant number 20FJYB032.

Institutional Review Board Statement

Not applicable.

Informed Consent Statement

Not applicable.

Data Availability Statement

Websites with URLs are listed in the paper and that information, including the data, is publicly available.

Acknowledgments

We would like to thank the National Social Science Foundation of China for supporting this research. We would also want to thank the Resource and Environment Science and Data Center, Institute of Geographic Sciences and Natural Resources Research, Chinese Academy of Sciences, for providing the Land Use/Cover Remote Sensing Monitoring Datasets 2000, 2010, and 2020.

Conflicts of Interest

The authors declare no conflict of interest.

References

  1. Nobel, A.; Lizin, S.; Brouwer, R.; Bruns, S.B.; Stern, D.I.; Malina, R. Are biodiversity losses valued differently when they are caused by human activities? A meta-analysis of the non-use valuation literature. Environ. Res. Lett. 2020, 15, 073003. [Google Scholar] [CrossRef]
  2. Haddad, N.M.; Brudvig, L.A.; Clobert, J.; Davies, K.F.; Gonzalez, A.; Holt, R.D.; Lovejoy, T.E.; Sexton, J.O.; Austin, M.P.; Collins, C.D.; et al. Habitat fragmentation and its lasting impact on Earth’s ecosystems. Sci. Adv. 2015, 1, e1500052. [Google Scholar] [CrossRef] [PubMed] [Green Version]
  3. Mitchell, M.G.; Suarez-Castro, A.F.; Martinez-Harms, M.; Maron, M.; McAlpine, C.; Gaston, K.J.; Johansen, K.; Rhodes, J.R. Reframing landscape fragmentation’s effects on ecosystem services. Trends Ecol. Evol. 2015, 30, 190–198. [Google Scholar] [CrossRef] [PubMed] [Green Version]
  4. Han, Q.; Keeffe, G. Promoting climate-driven forest migration through large-scale urban afforestation. Landsc. Urban Plan. 2021, 212, 104124. [Google Scholar] [CrossRef]
  5. Peng, J.; Pan, Y.; Liu, Y.; Zhao, H.; Wang, Y. Linking ecological degradation risk to identify ecological security patterns in a rapidly urbanizing landscape. Habitat Int. 2018, 71, 110–124. [Google Scholar] [CrossRef]
  6. Hong, W.; Guo, R.; Su, M.; Tang, H.; Chen, L.; Hu, W. Sensitivity evaluation and land-use control of urban ecological corridors: A case study of Shenzhen, China. Land Use Policy 2017, 62, 316–325. [Google Scholar] [CrossRef]
  7. Wen, L.; Chatalova, L.; Gao, X.; Zhang, A. Reduction of carbon emissions through resource-saving and environment-friendly regional economic integration: Evidence from Wuhan metropolitan area, China. Technol. Forecast. Soc. Chang. 2021, 166, 120590. [Google Scholar] [CrossRef]
  8. Chai, J.; Wang, Z.; Yu, C. Analysis for the Interaction Relationship between Urbanization and Ecological Security: A Case Study in Wuhan City Circle of China. Int. J. Environ. Res. Public Health 2021, 18, 13187. [Google Scholar] [CrossRef]
  9. Fang, C.; Wang, J. A theoretical analysis of interactive coercing effects between urbanization and eco-environment. Chin. Geogr. Sci. 2013, 23, 147–162. [Google Scholar] [CrossRef]
  10. Xu, J.; Fan, F.; Liu, Y.; Dong, J.; Chen, J. Construction of ecological security patterns in nature reserves based on ecosystem services and circuit theory: A case study in Wenchuan, China. Int. J. Environ. Res. Public Health 2019, 16, 3220. [Google Scholar] [CrossRef] [Green Version]
  11. Yu, K. Security Patterns in Landscape Planning with a Case in South China. Doctoral Thesis, Harvard University, Cambridge, MA, USA, 1995; pp. 1–10. [Google Scholar]
  12. Jongman, R.H. Nature conservation planning in Europe: Developing ecological networks. Landsc. Urban Plan. 1995, 32, 169–183. [Google Scholar] [CrossRef]
  13. Gao, J.; Liu, X.; Li, D.; Havlin, S. Recent progress on the resilience of complex networks. Energies 2015, 8, 12187–12210. [Google Scholar] [CrossRef] [Green Version]
  14. Dong, J.; Peng, J.; Xu, Z.; Liu, Y.; Wang, X.; Li, B. Integrating regional and interregional approaches to identify ecological security patterns. Landsc. Ecol. 2021, 36, 2151–2164. [Google Scholar] [CrossRef]
  15. Wang, Z.; Shi, P.; Zhang, X.; Tong, H.; Zhang, W.; Liu, Y. Research on Landscape Pattern Construction and Ecological Restoration of Jiuquan City Based on Ecological Security Evaluation. Sustainability 2021, 13, 5732. [Google Scholar] [CrossRef]
  16. Park, S.; Kim, T.H.; Eom, T.R. Impact of social network size and contact frequency on resilience in community-dwelling healthy older adults living alone in the republic of Korea. Int. J. Environ. Res. Public Health 2021, 18, 6061. [Google Scholar] [CrossRef]
  17. Kharrazi, A.; Akiyama, T.; Yu, Y.; Li, J. Evaluating the evolution of the Heihe River basin using the ecological network analysis: Efficiency, resilience, and implications for water resource management policy. Sci. Total. Environ. 2016, 572, 688–696. [Google Scholar] [CrossRef] [PubMed]
  18. Yu, Q.; Yue, D.; Wang, Y.; Kai, S.; Fang, M.; Ma, H.; Zhang, Q.; Huang, Y. Optimization of ecological node layout and stability analysis of ecological network in desert oasis: A typical case study of ecological fragile zone located at Deng Kou County (Inner Mongolia). Ecol. Indic. 2018, 84, 304–318. [Google Scholar] [CrossRef]
  19. Zhang, L.; Peng, J.; Liu, Y.; Wu, J. Coupling ecosystem services supply and human ecological demand to identify landscape ecological security pattern: A case study in Beijing–Tianjin–Hebei region, China. Urban Ecosyst. 2017, 20, 701–714. [Google Scholar] [CrossRef]
  20. Théau, J.; Bernier, A.; Fournier, R.A. An evaluation framework based on sustainability-related indicators for the comparison of conceptual approaches for ecological networks. Ecol. Indic. 2015, 52, 444–457. [Google Scholar] [CrossRef]
  21. Liu, D.; Chang, Q. Ecological security research progress in China. Acta Ecol. Sin. 2015, 35, 111–121. [Google Scholar] [CrossRef]
  22. Landguth, E.; Hand, B.; Glassy, J.; Cushman, S.; Sawaya, M. UNICOR: A species connectivity and corridor network simulator. Ecography 2012, 35, 9–14. [Google Scholar] [CrossRef]
  23. Foltête, J.C.; Clauzel, C.; Vuidel, G. A software tool dedicated to the modelling of landscape networks. Environ. Model. Softw. 2012, 38, 316–327. [Google Scholar] [CrossRef]
  24. Hand, B.; Carlson, R.; Landguth, E.; Glassy, J. Unicor: A Species Connectivity And Corridor Network Simulator. Intermt. J. Sci. 2011, 17, 50. [Google Scholar]
  25. Castilho, C.S.; Hackbart, V.; Pivello, V.R.; dos Santos, R.F. Evaluating landscape connectivity for Puma concolor and Panthera onca among Atlantic forest protected areas. Environ. Manag. 2015, 55, 1377–1389. [Google Scholar] [CrossRef] [PubMed]
  26. Dickson, B.G.; Albano, C.M.; Anantharaman, R.; Beier, P.; Fargione, J.; Graves, T.A.; Gray, M.E.; Hall, K.R.; Lawler, J.J.; Leonard, P.B.; et al. Circuit-theory applications to connectivity science and conservation. Conserv. Biol. 2019, 33, 239–249. [Google Scholar] [CrossRef]
  27. Bleyhl, B.; Baumann, M.; Griffiths, P.; Heidelberg, A.; Manvelyan, K.; Radeloff, V.C.; Zazanashvili, N.; Kuemmerle, T. Assessing landscape connectivity for large mammals in the Caucasus using Landsat 8 seasonal image composites. Remote Sens. Environ. 2017, 193, 193–203. [Google Scholar] [CrossRef]
  28. Holling, C.S. Resilience and stability of ecological systems. Annu. Rev. Ecol. Syst. 1973, 4, 1–23. [Google Scholar] [CrossRef] [Green Version]
  29. Li, X.; Xiao, R. Analyzing network topological characteristics of eco-industrial parks from the perspective of resilience: A case study. Ecol. Indic. 2017, 74, 403–413. [Google Scholar] [CrossRef]
  30. Wu, Y.; Hou, G.; Chen, S. Post-earthquake resilience assessment and long-term restoration prioritization of transportation network. Reliab. Eng. Syst. Saf. 2021, 211, 107612. [Google Scholar] [CrossRef]
  31. Martín, B.; Ortega, E.; Cuevas-Wizner, R.; Ledda, A.; De Montis, A. Assessing road network resilience: An accessibility comparative analysis. Transp. Res. Part D Transp. Environ. 2021, 95, 102851. [Google Scholar] [CrossRef]
  32. Crognier, G.; Tournebise, P.; Ruiz, M.; Panciatici, P. Grid operation-based outage maintenance planning. Electr. Power Syst. Res. 2021, 190, 106682. [Google Scholar] [CrossRef]
  33. Rushdi, A.M.A.; Hassan, A.K. Reliability of migration between habitat patches with heterogeneous ecological corridors. Ecol. Model. 2015, 304, 1–10. [Google Scholar] [CrossRef]
  34. Sayles, J.S.; Baggio, J.A. Social–ecological network analysis of scale mismatches in estuary watershed restoration. Proc. Natl. Acad. Sci. USA 2017, 114, E1776–E1785. [Google Scholar] [CrossRef] [PubMed] [Green Version]
  35. Delmas, E.; Besson, M.; Brice, M.H.; Burkle, L.A.; Dalla Riva, G.V.; Fortin, M.J.; Gravel, D.; Guimarães, P.R., Jr.; Hembry, D.H.; Newman, E.A.; et al. Analysing ecological networks of species interactions. Biol. Rev. 2019, 94, 16–36. [Google Scholar] [CrossRef] [Green Version]
  36. Kindlmann, P.; Burel, F. Connectivity measures: A review. Landsc. Ecol. 2008, 23, 879–890. [Google Scholar] [CrossRef] [Green Version]
  37. Kong, F.; Yin, H.; Nakagoshi, N.; Zong, Y. Urban green space network development for biodiversity conservation: Identification based on graph theory and gravity modeling. Landsc. Urban Plan. 2010, 95, 16–27. [Google Scholar] [CrossRef]
  38. Dong, J.; Dai, W.; Shao, G.; Xu, J. Ecological network construction based on minimum cumulative resistance for the city of Nanjing, China. ISPRS Int. J.-Geo-Inf. 2015, 4, 2045–2060. [Google Scholar] [CrossRef] [Green Version]
  39. Wang, T.; Li, H.; Huang, Y. The complex ecological network’s resilience of the Wuhan metropolitan area. Ecol. Indic. 2021, 130, 108101. [Google Scholar] [CrossRef]
  40. Carranza, M.L.; D’Alessandro, E.; Saura, S.; Loy, A. Connectivity providers for semi-aquatic vertebrates: The case of the endangered otter in Italy. Landsc. Ecol. 2012, 27, 281–290. [Google Scholar] [CrossRef]
  41. Knaapen, J.P.; Scheffer, M.; Harms, B. Estimating habitat isolation in landscape planning. Landsc. Urban Plan. 1992, 23, 1–16. [Google Scholar] [CrossRef]
  42. Zhang, R.; Zhang, L.; Zhong, Q.; Zhang, Q.; Ji, Y.; Song, P.; Wang, Q. An optimized evaluation method of an urban ecological network: The case of the Minhang District of Shanghai. Urban For. Urban Green. 2021, 62, 127158. [Google Scholar] [CrossRef]
  43. Zhu, C.; Peng, W.; Zhang, L.; Luo, Y.; Dong, Y.; Wang, M. Study of temporal and spatial variation and driving force of fractional vegetation cover in upper reaches of Minjiang River from 2006 to 2016. Acta Ecol. Sin. 2019, 39, 1583–1594. [Google Scholar]
  44. Saura, S.; Pascual-Hortal, L. A new habitat availability index to integrate connectivity in landscape conservation planning: Comparison with existing indices and application to a case study. Landsc. Urban Plan. 2007, 83, 91–103. [Google Scholar] [CrossRef]
  45. Yu, C.; Liu, D.; Feng, R.; Tang, Q.; Guo, C. Construction of ecological security pattern in Northeast China based on MCR model. Acta Ecol. Sin. 2021, 41, 290–301. [Google Scholar]
  46. Poisot, T.; Stouffer, D.B.; Kéfi, S. Describe, understand and predict. Funct. Ecol. 2016, 30, 1878–1882. [Google Scholar] [CrossRef]
  47. Choe, H.; Lee, D.H.; Seo, I.W.; Kim, H.D. Patent citation network analysis for the domain of organic photovoltaic cells: Country, institution, and technology field. Renew. Sustain. Energy Rev. 2013, 26, 492–505. [Google Scholar] [CrossRef]
  48. Newman, M.E. The structure and function of complex networks. SIAM Rev. 2003, 45, 167–256. [Google Scholar] [CrossRef] [Green Version]
  49. Anthonisse, J.M. The rush in a directed graph. Sticht. Math. Cent. Math. Besliskd. 1971, BN 9/71, 1–10. [Google Scholar]
  50. Sabidussi, G. The centrality index of a graph. Psychometrika 1966, 31, 581–603. [Google Scholar] [CrossRef]
  51. Watts, D.J.; Strogatz, S.H. Collective dynamics of ‘small-world’networks. Nature 1998, 393, 440–442. [Google Scholar] [CrossRef]
  52. Kang, S.M. Equicentrality and network centralization: A micro–macro linkage. Soc. Netw. 2007, 29, 585–601. [Google Scholar] [CrossRef]
  53. Lynch, J.P. Root phenotypes for improved nutrient capture: An underexploited opportunity for global agriculture. New Phytol. 2019, 223, 548–564. [Google Scholar] [CrossRef] [PubMed] [Green Version]
  54. Foltête, J.C.; Girardet, X.; Clauzel, C. A methodological framework for the use of landscape graphs in land-use planning. Landsc. Urban Plan. 2014, 124, 140–150. [Google Scholar] [CrossRef]
  55. Wickham, J.; Riitters, K.; Vogt, P.; Costanza, J.; Neale, A. An inventory of continental US terrestrial candidate ecological restoration areas based on landscape context. Restor. Ecol. 2017, 25, 894–902. [Google Scholar] [CrossRef] [PubMed] [Green Version]
  56. Leonard, P.B.; Duffy, E.B.; Baldwin, R.F.; McRae, B.H.; Shah, V.B.; Mohapatra, T.K. gflow: Software for modelling circuit theory-based connectivity at any scale. Methods Ecol. Evol. 2017, 8, 519–526. [Google Scholar] [CrossRef] [Green Version]
  57. Sterbenz, J.P.; Çetinkaya, E.K.; Hameed, M.A.; Jabbar, A.; Qian, S.; Rohrer, J.P. Evaluation of network resilience, survivability, and disruption tolerance: Analysis, topology generation, simulation, and experimentation. Telecommun. Syst. 2013, 52, 705–736. [Google Scholar] [CrossRef]
  58. Campbell, M. Avian reactions towards human approaches in different urban greenery structures in Nanaimo. Urban For. Urban Green. 2016, 19, 47–55. [Google Scholar] [CrossRef]
  59. Liang, Q.; Luo, D.; Ma, L.; Zhang, P.; Zhou, M.; He, Y.; Wang, B. Rolne: Improving the quality of network embedding with structural role proximity. In International Conference on Web Information Systems Engineering; Springer: Cham, Switzerland, 2020; pp. 16–28. [Google Scholar]
  60. Pereira, J.; Jordán, F. Multi-node selection of patches for protecting habitat connectivity: Fragmentation versus reachability. Ecol. Indic. 2017, 81, 192–200. [Google Scholar] [CrossRef]
  61. Pereira, J. Multi-node protection of landscape connectivity: Habitat availability and topological reachability. Community Ecol. 2018, 19, 176–185. [Google Scholar] [CrossRef]
  62. Sahraoui, Y.; Leski, C.D.G.; Benot, M.L.; Revers, F.; Salles, D.; van Halder, I.; Barneix, M.; Carassou, L. Integrating ecological networks modelling in a participatory approach for assessing impacts of planning scenarios on landscape connectivity. Landsc. Urban Plan. 2021, 209, 104039. [Google Scholar] [CrossRef]
  63. Gao, J.; Zou, C.; Zhang, K.; Xu, M.; Wang, Y. The establishment of Chinese ecological conservation redline and insights into improving international protected areas. J. Environ. Manag. 2020, 264, 110505. [Google Scholar] [CrossRef] [PubMed]
Figure 1. Scope of the Wuhan metropolitan area.
Sustainability 14 08580 g001
Figure 2. Technical route.
Sustainability 14 08580 g002
Figure 3. Distribution of ecological source sites in Wuhan metropolitan area.
Sustainability 14 08580 g003
Figure 4. Ecological resistance surface composition map.
Sustainability 14 08580 g004
Figure 5. Changes in ecological corridors.
Sustainability 14 08580 g005
Table 1. Network construction method.
Construction TheoryTheoretical CharacteristicsReference
Minimum consumption distance methodEcological sources and corridors are combined to establish landscape ecological security patterns.Zhang [19]
The resistance surface is created according to the “source-sink” theory and the flexible weighting factor.Theau [20]
Quantifying corridor width Biasing the impact of roads on species migration corridors.Liu [21]
Graph theoryNetwork structure maps constructed based on Euclidean distance or minimum cost distance to establish the degree of network connectivity at different landscape levels.Shahram [22]
Measuring overall network density based on patch node degree and association degree.Foltête [23,24]
Current theoryQuantifying the stochastic migration corridors of species, the Key network nodes and important conservation areas.Castilho [25]
Measure and analyze multiple potential corridors in the network.Dickson [26]
Corridor efficiency and functionality are evaluated.Bleyhl [27]
Table 2. Network construction method.
Geographic NumberLand Property
01Arable Land
03Woodland
04Grassland
05Construction Land
06Mine Silo Storage land
07Residential Land
10Transportation Land
11Land for water and water conservancy facilities
Table 3. Network construction method.
AssignmentLand Use TypeFractional Vegetation CoverSlope
1Waters, nature reserves−0.2–0.030–3
2Woodland0.03–0.073–8
3Arable land, grassland0.07–0.148–15
4Bare land, facility land0.14–0.2315–25
5Urban construction land0.23–0.62>25
Weights for 20000.6710.1990.13
Weights for 20100.6680.1970.135
Weights for 20200.7130.1490.138
Table 4. Network construction method.
NameFormulaCoefficient Description
Vegetation cover
F V C = N D V I max N D V I min N D V I max + N D V I min
N D V I max and N D V I min ( i ) are the maximum and minimum normalized difference vegetation index ( N D V I ) values of vegetation cover in the Wuhan urban area, respectively [43]. 
Weight calculation
d I ( % ) = 100 × I I remove I
I denotes the pre-change resistance factor, while I remove denotes the resistance factor after the change [33]. The ecological threat is higher at a higher d I  [44]. 
Minimum cumulative resistance
M C R = f min j = n i = m D i j × R i
f denotes the value of the minimum cumulative resistance, D i j denotes the spatial distance of species from source j to landscape unit i; R i denotes the resistance coefficient of landscape unit i to the movement of a species; f denotes the positive correlation between the minimum cumulative resistance and ecological processes [45]. 
Table 5. Network analysis index calculation formula.
NameFormulaCoefficient Description
Average degree
C A D ( i ) = 1 n i = 1 n k i
C A D ( i ) represents the average degree of node i, which is used to calculate node i and other j nodes. Average degree measures the degree of each node in the whole network. The higher the aggregation degree, the greater the average degree, and the greater the inter-node connection, which is more conducive to the formation of a stable network structure. The average degree reflects the degree of equality or importance of nodes [48]. 
Betweenness centrality
C B C ( i ) = d i j ( n ) d i j
C B C ( i ) represents the betweenness centrality of node i, d i j represents the number of shortest paths from i to j, and d i j ( n ) is the number of nodes passing through the shortest paths from i to j. A node with a low average degree may have a high intermediate centrality. An indirect centrality reflects the ability of a node to control other nodes to exchange information and resources [49]. 
Closeness centrality
C C C ( i ) = n 1 j i d i j
C C C ( i ) represents the closeness centrality of node i. The smaller the average shortest distance of a node, the greater the closeness centrality. The closeness centrality of a point is the reciprocal of the sum of the shortcut distances between the point and all other points in the network. It reflects the relative accessibility of the node in the network. Therefore, the higher the closeness centrality value of a node, the stronger the node accessibility [50]. 
Clustering coefficient
C C O ( i ) = 2 L i k i k i 1
C C O ( i ) represents the clustering coefficient of node i, and L i represents the number of links between k i neighbors of node i. The average clustering coefficient describes the clustering degree of nodes in network. The higher the aggregation degree, the higher the inter-node connection degree, which is more conducive to the formation of a stable network structure [51]. 
Closeness centralization
D C C = i = 1 n C C C max C C C ( i ) ( n 2 ) ( n 1 )
D C C represents the closeness centralization of network. C C C m a x denotes the maximum closeness centrality of the point, and C C C ( i ) denotes the relative closeness centrality of a point. The higher the closeness centrality potential, the greater the difference between network nodes, and the weaker the accessibility. In contrast, the smaller the difference between nodes in a network, the greater the connectivity balance, and the stronger the accessibility [52]. 
Publisher’s Note: MDPI stays neutral with regard to jurisdictional claims in published maps and institutional affiliations.

