
Rural Residents’ Perceptions, Attitudes, and Environmentally Responsible Behaviors towards Garbage Exchange Supermarkets: An Example from Huangshan City in China

Abstract
:1. Introduction
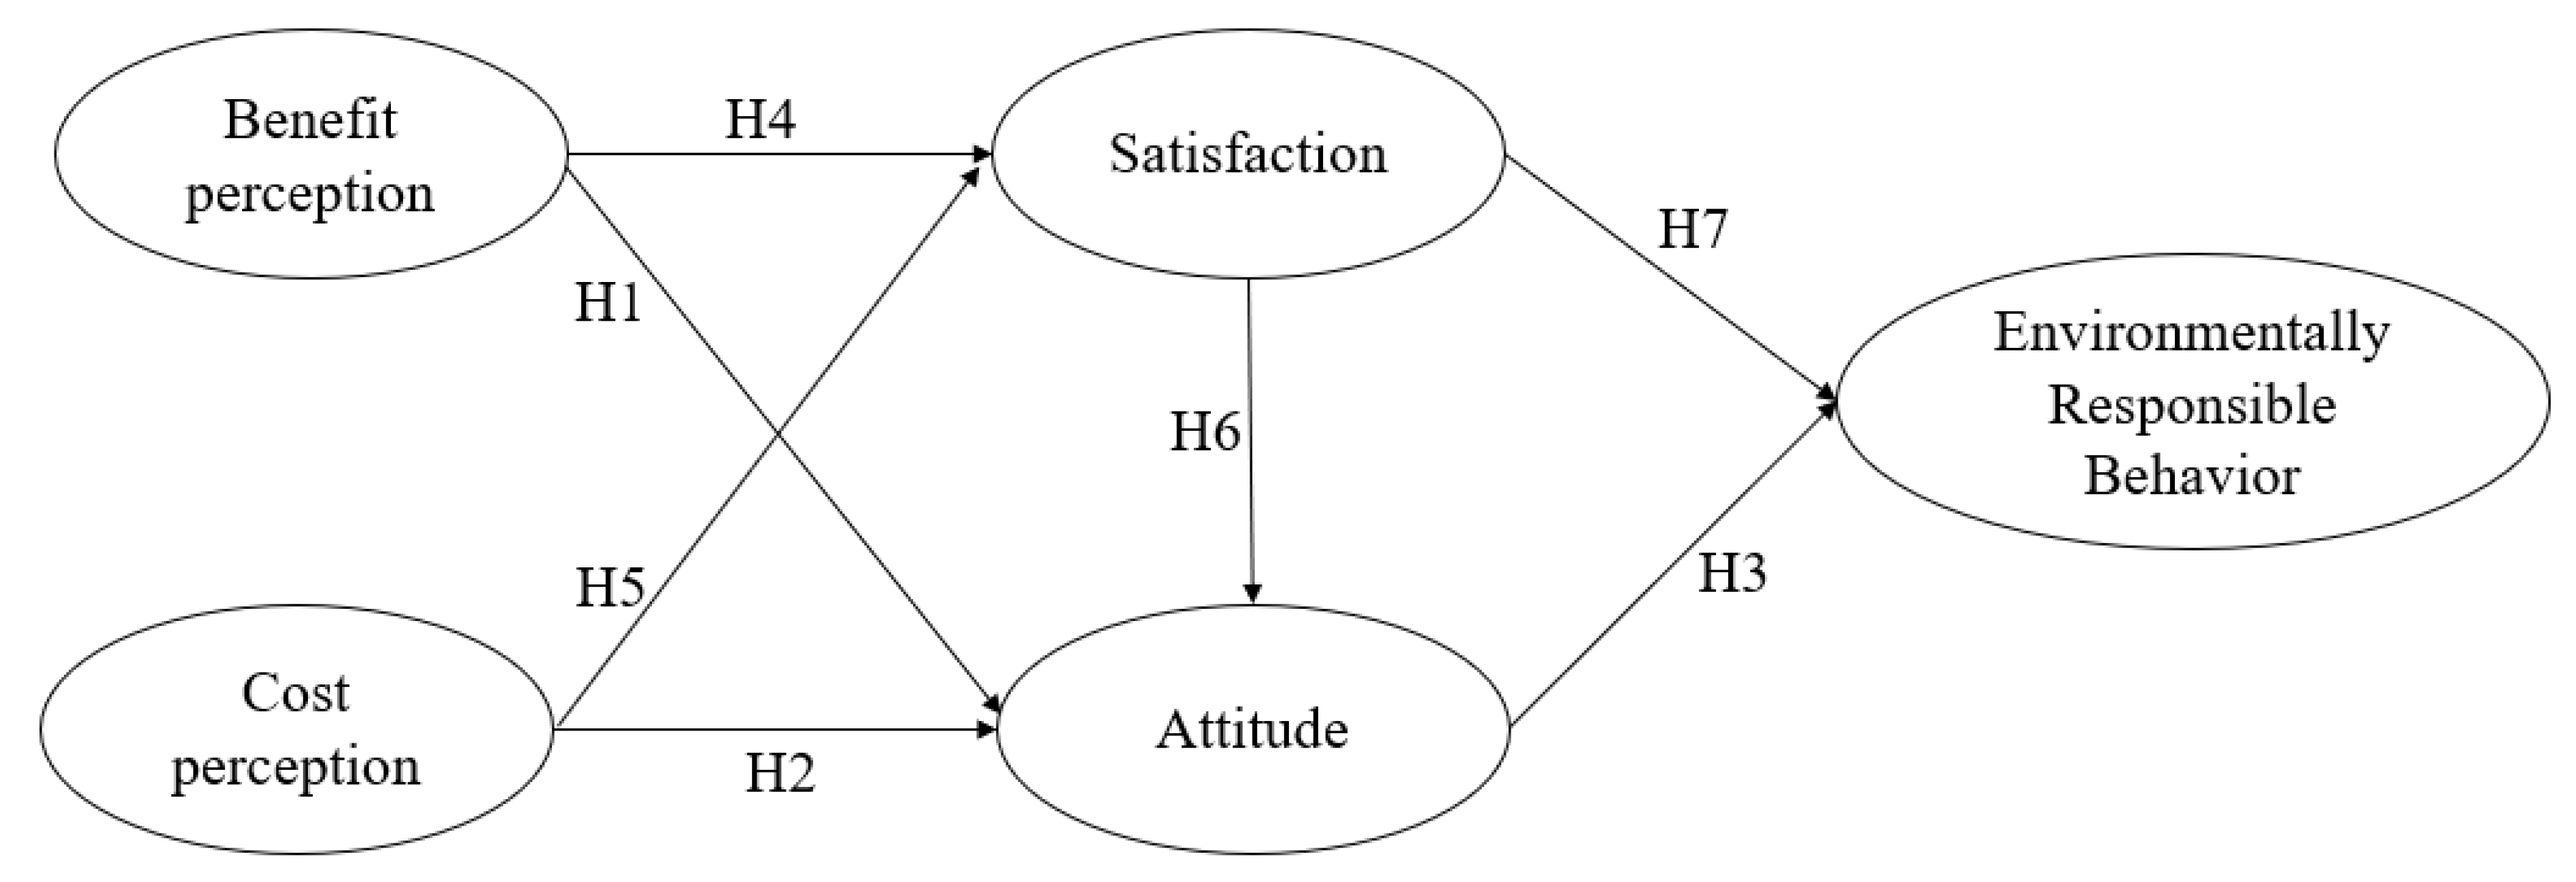
2. Model Building
2.1. Perception, Attitude, and Environmentally Responsible Behavior
2.2. Perception and Satisfaction
2.3. Satisfaction, Attitude, and Environmentally Responsible Behavior
3. Study Design
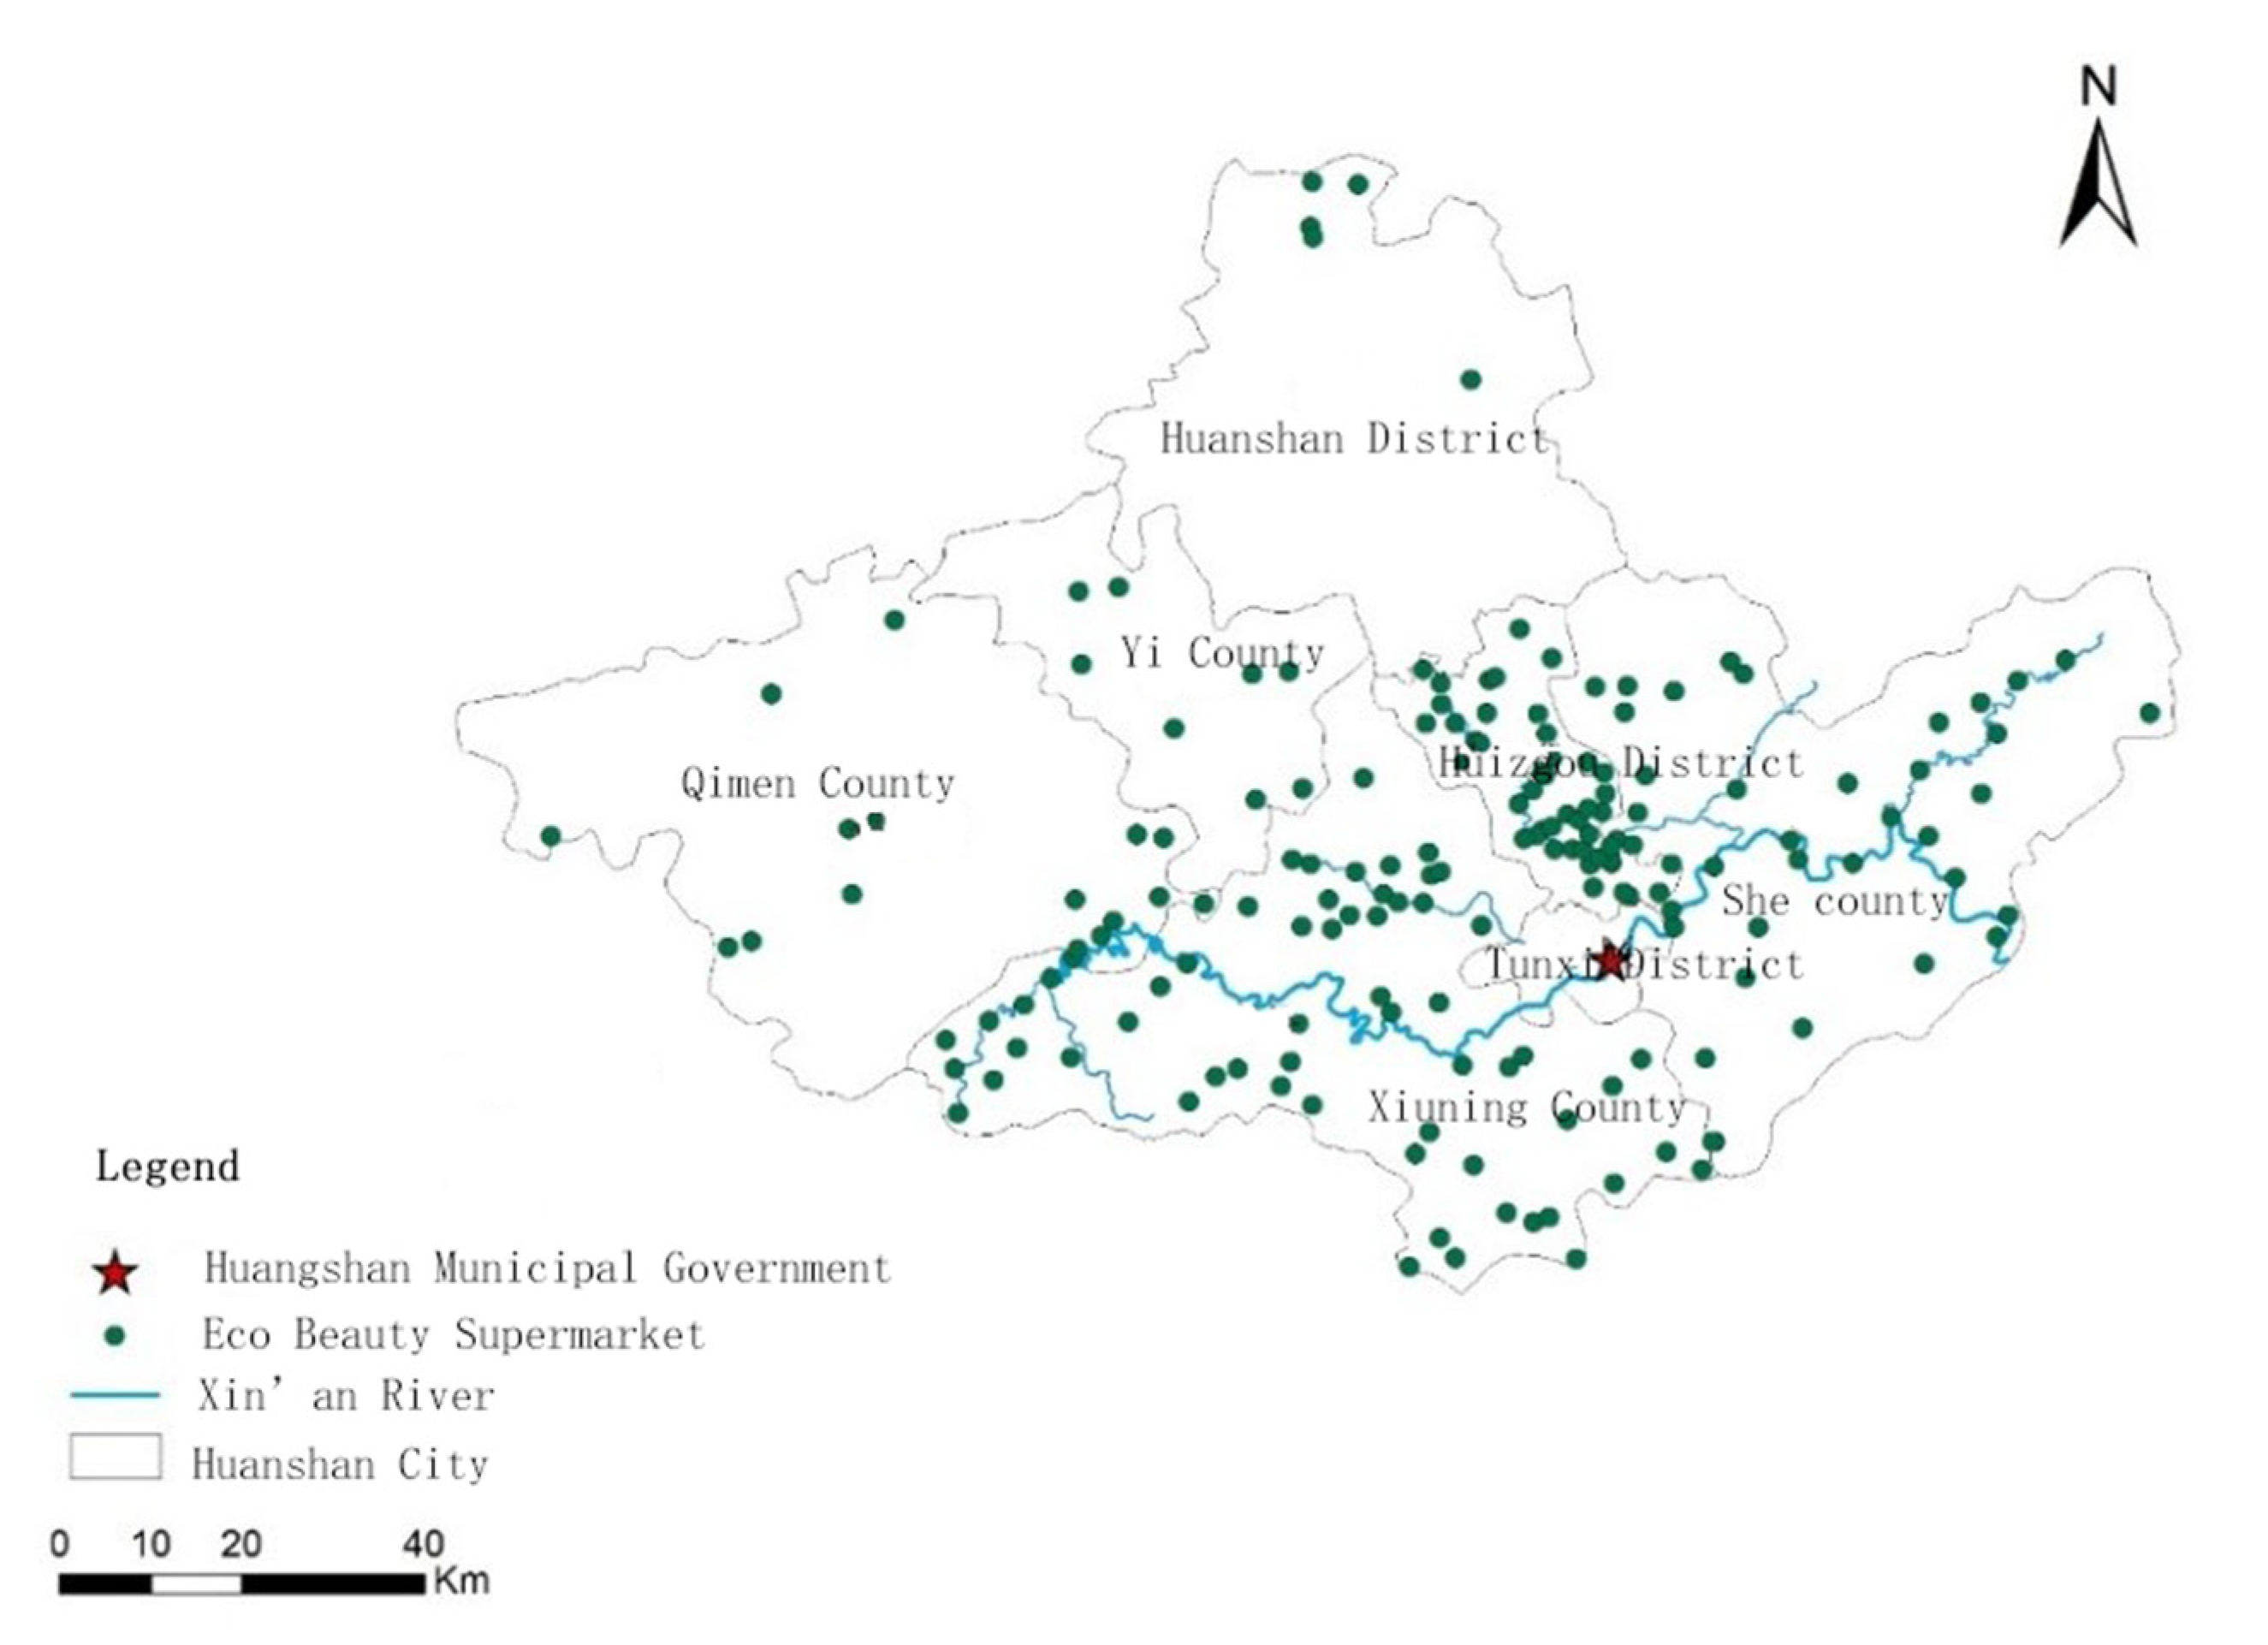
3.1. Case Outline
3.2. Questionnaire Design
- ➀
- Design and optimization. Based on domestic and foreign literature on perception, attitude, and behavior, combined with residents’ interview data, media data, and characteristics of garbage exchange supermarkets, a measurement scale for residents’ perceptions and attitudes is selected and designed. The perception dimension is based on the scale developed by Sirivongs and other scholars [34]. The items are screened and optimized, and perception is divided into two dimensions: benefit and cost perceptions. “Attitude” refers to Adams [8] and Yoon [51], with the help of the research of Kaiser [52] and Sirivongs [34] to determine the division of environmentally responsible behavior. “Attitude and Satisfaction” refer to Chen Anqi’s survey on the satisfaction with garbage exchange supermarkets. This current study refers to the above scale and designs the dimensions of attitude and satisfaction [36].
- ➁
- Pre-investigation. A pre-investigation was carried out on 10 August 2020 and resulted in 38 valid questionnaires. IBM SPSS20.0 software was used to input and analyze the data as well as to make necessary modifications and adjustments. The factor loadings of each measurement index met the requirements, and in line with the preset dimensions, a standard scale with 19 items was finally formed.
- ➂
- Formal questionnaires are formed. The questionnaire includes demographic details of the respondents, the characteristics of garbage exchange supermarkets, and the abovementioned 19 measurement indicators, and opinion consultation. The indicators are measured using a 5-point Likert-type scale, where “1” to “5” represent “strongly disagree” to “strongly agree”. The consultation section consists of two open questions: Do you have any opinions and suggestions on the construction of rural garbage exchange supermarkets and garbage classification? What are your opinions and suggestions on the improvement of the rural living environment?
3.3. Data Collection
4. Findings
4.1. Basic Information of Respondents
4.2. Exploratory Factor Analysis
4.2.1. Rural Residents’ Perceptions of Garbage Exchange Supermarkets
4.2.2. Environmentally Responsible Behavior of Rural Residents
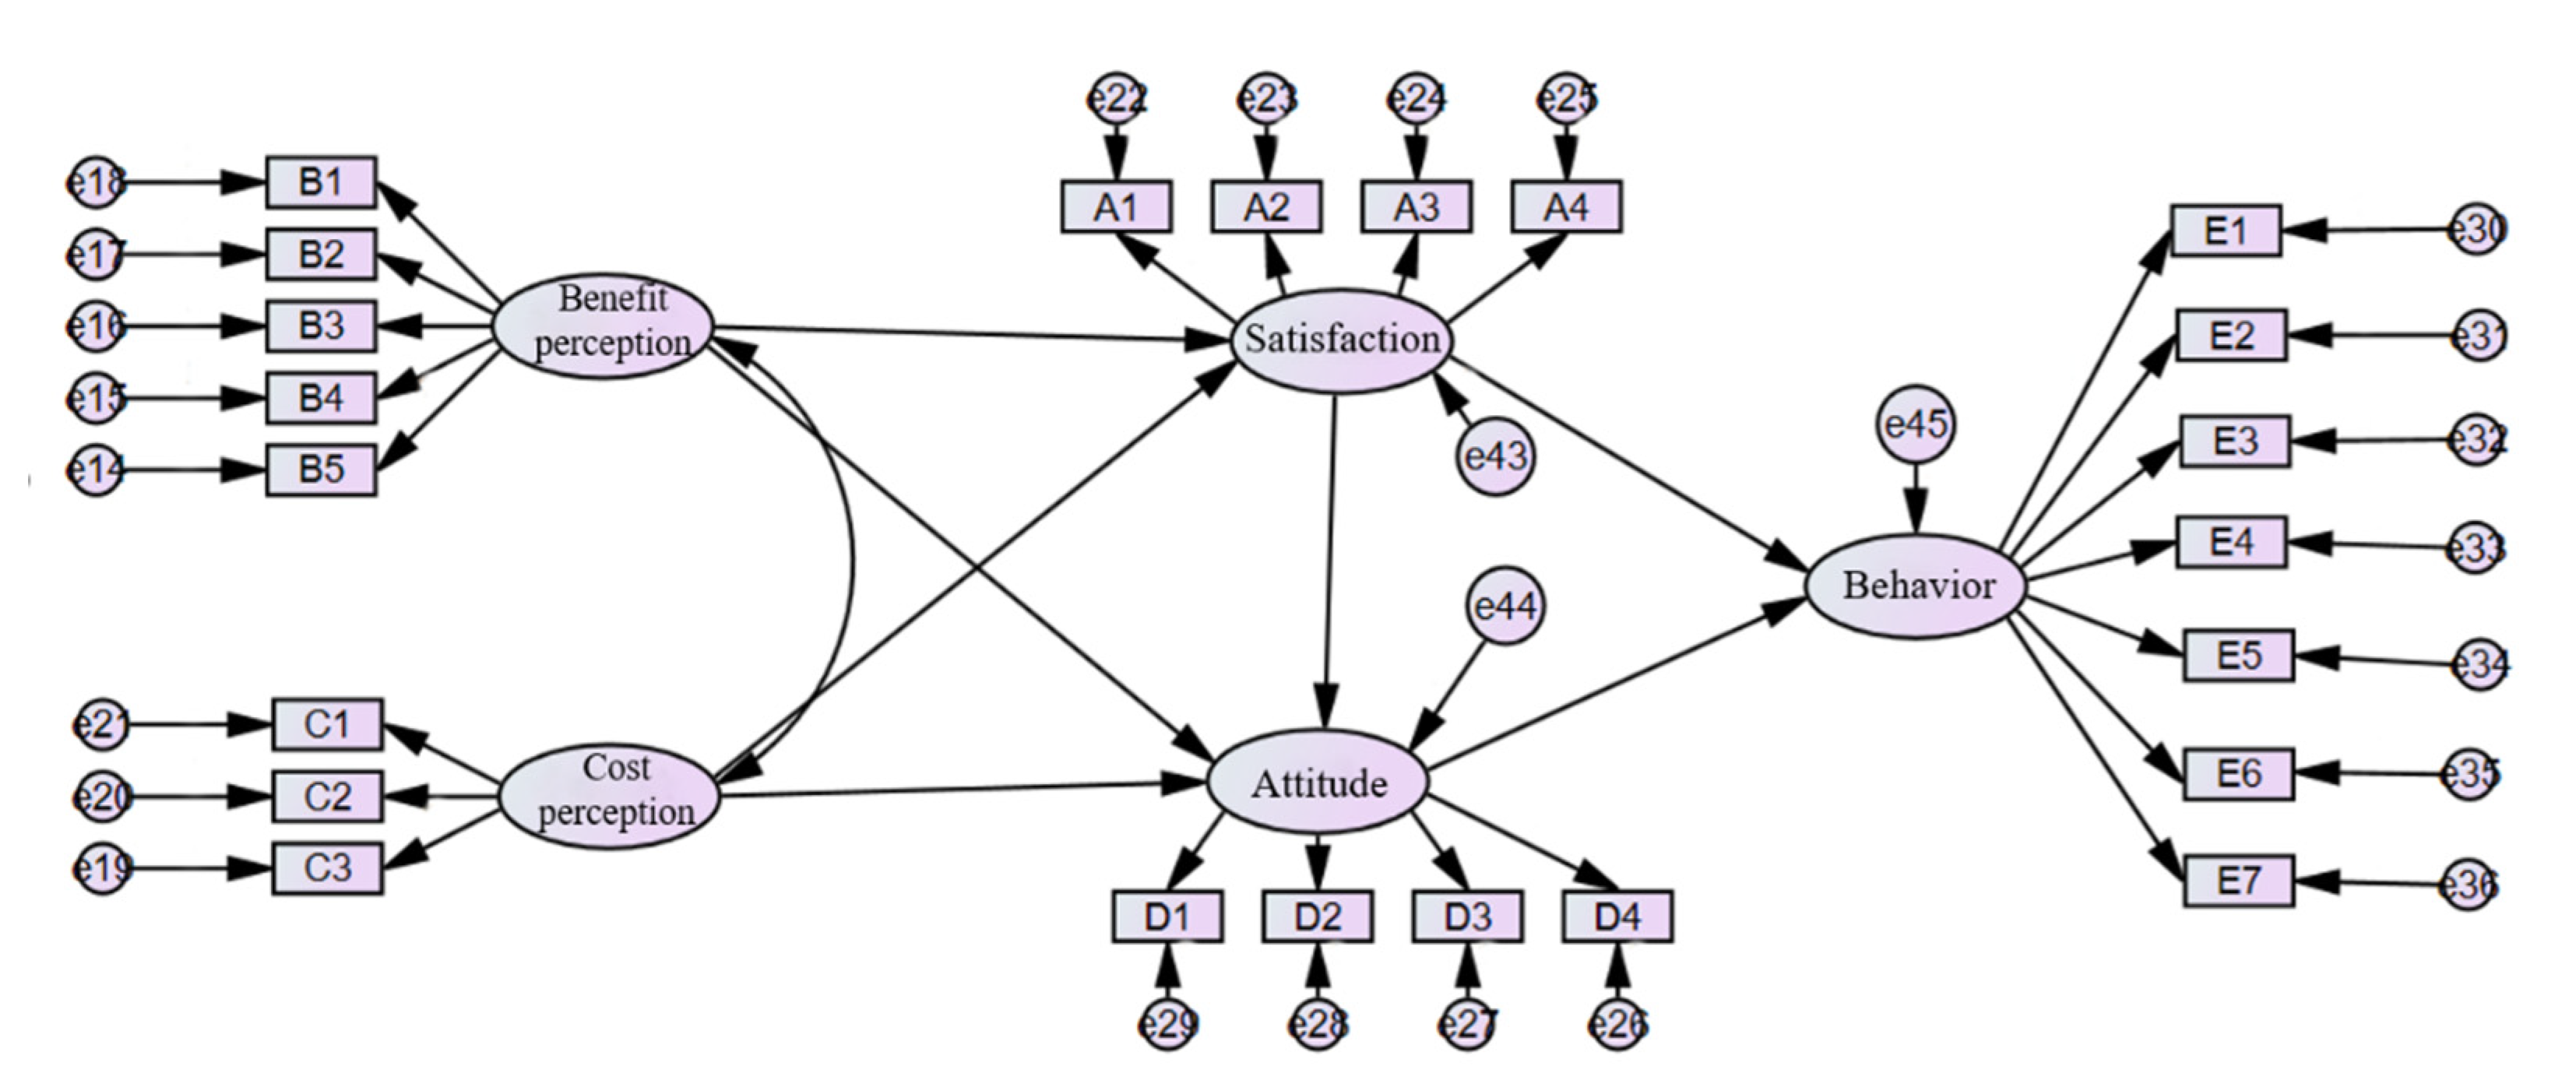
4.3. Confirmatory Factor Analysis
4.4. Structural Model Checking and Correction
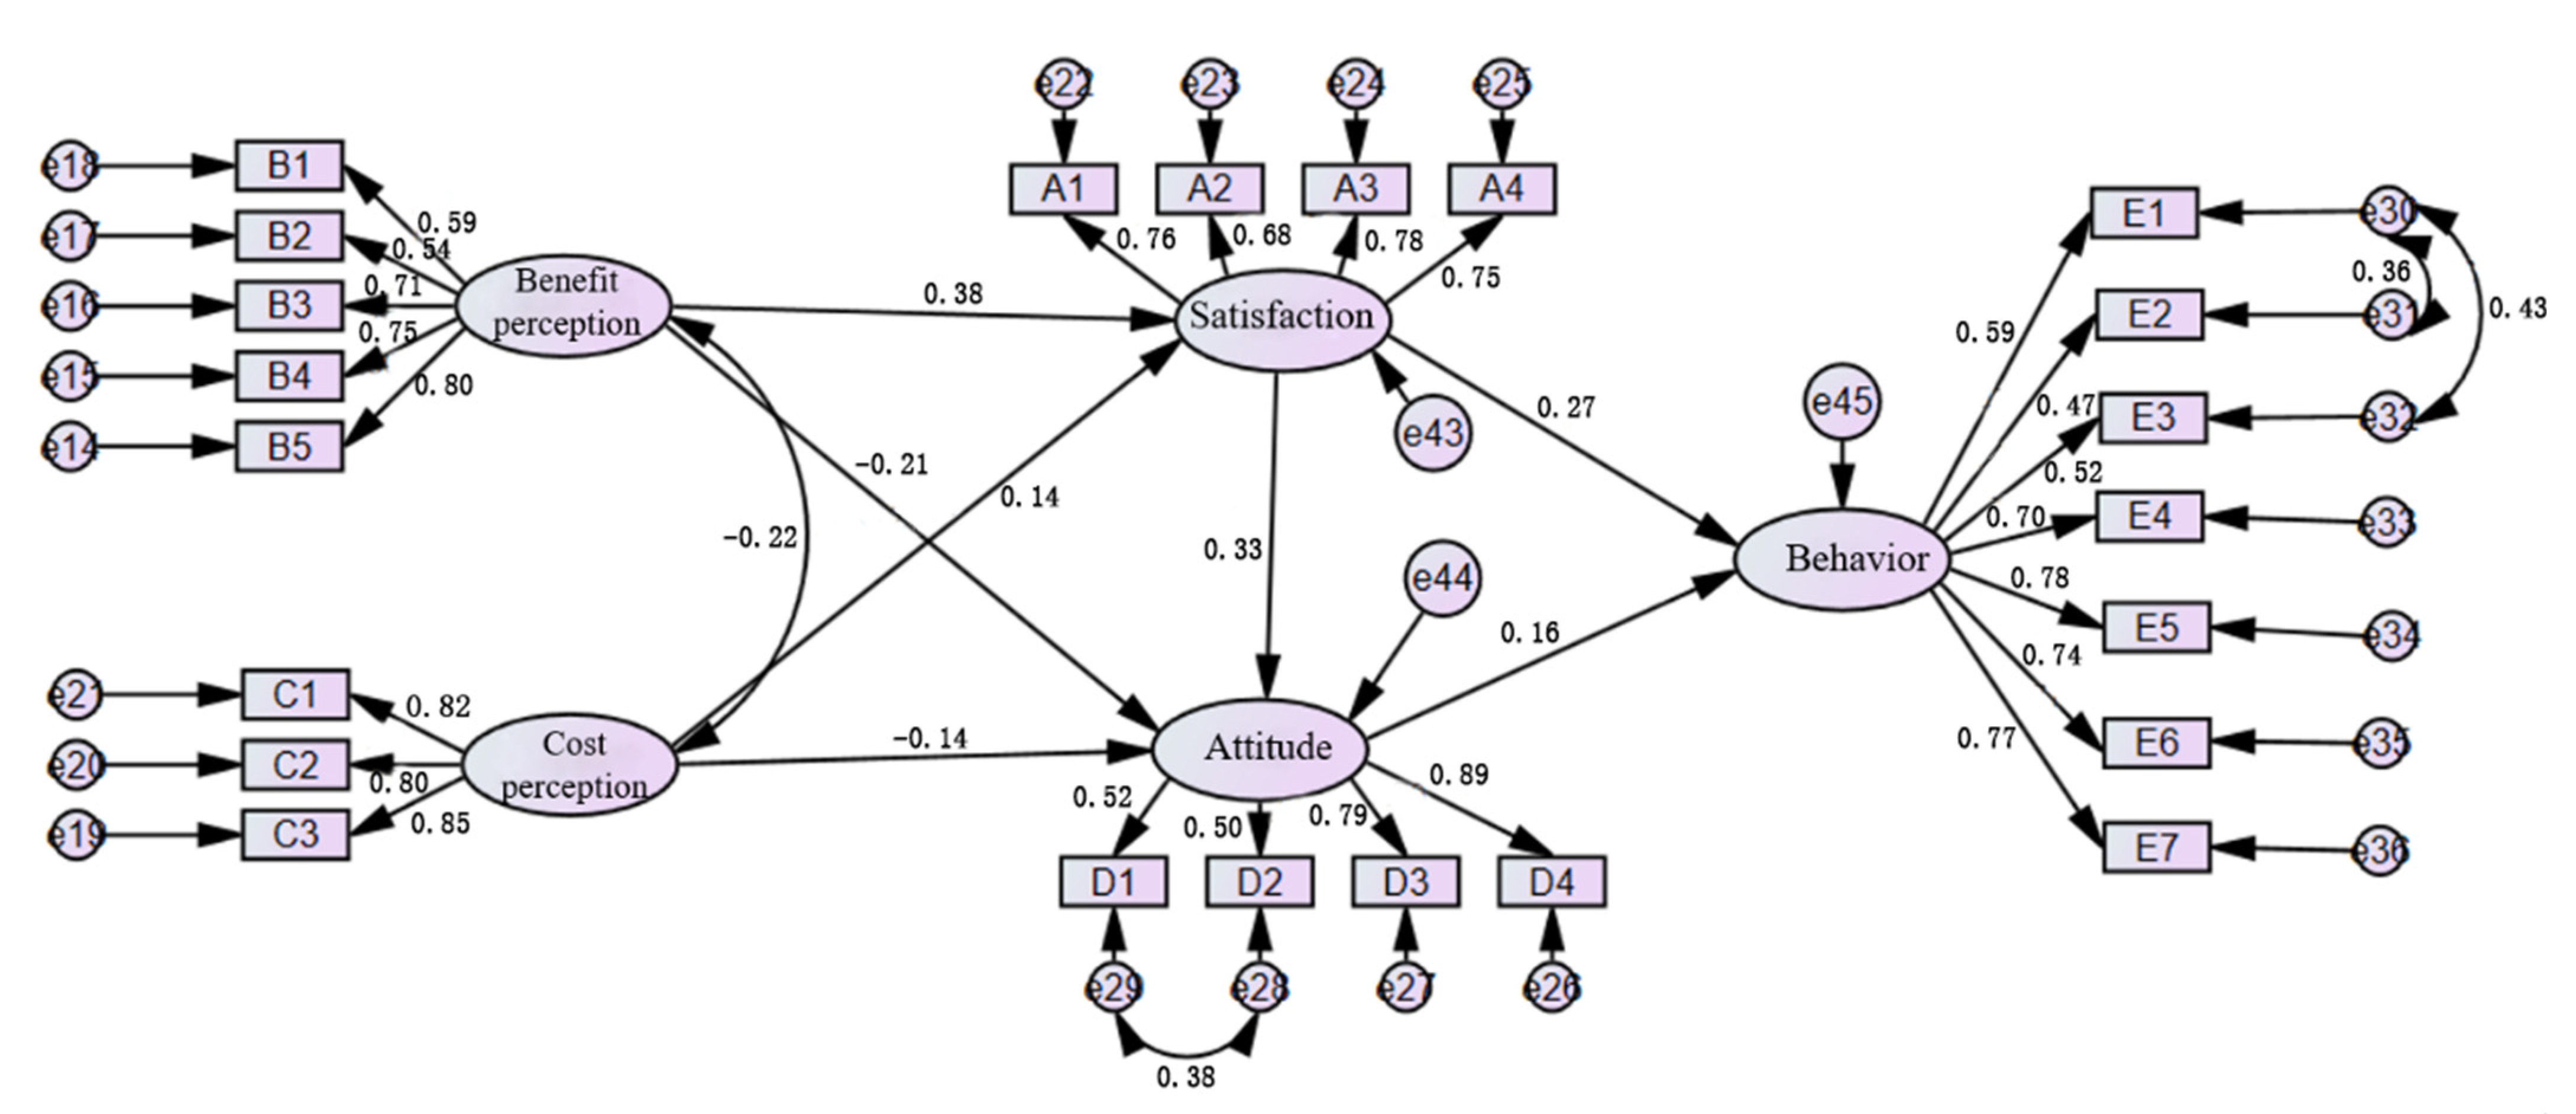
4.5. Structural Equation Model Analysis
5. Conclusions and Discussion
5.1. Conclusions
- (1)
- The dimension of residents’ perceptions is mainly divided into two aspects: benefit and cost perception. Residents’ perceptions of the benefits of the garbage exchange supermarkets are strong and positive, in which residents’ perceptions of environmental benefits are stronger; their awareness of environmental protection is strong; and their perceptions of the costs of the garbage exchange supermarkets are weak. The attitude towards the garbage exchange supermarket is highly positive and the satisfaction is high. Residents are quite satisfied with the exchange items, publicity mode, management model, exchange items, and types of convertible wastes in the garbage exchange supermarket. Overall, residents are willing to pay the cost to go to the supermarket to exchange. In addition, residents’ environmentally responsible behaviors are divided into compliance-type and promotion-type environmentally responsible behaviors, among which the former shows higher willingness and internal consistency.
- (2)
- Constructing and verifying the model of residents’ perceptions and behaviors show that:
- ➀
- Residents’ perceptions of the benefits of garbage exchange supermarkets positively affect their attitudes and satisfaction. Cost perception is unrelated to attitude but affects their satisfaction.
- ➁
- Residents’ attitudes towards garbage exchange supermarkets positively affect their environmentally responsible behaviors.
- ➂
- Residents’ satisfaction with garbage exchange supermarkets affects their attitudes and positively affects their environmentally responsible behaviors.
5.2. Discussion
- (1)
- First of all, it is necessary to increase the publicity regarding the need for environmental protection to the villagers and emphasize the importance of rural garbage exchange supermarkets in improving the living environment in rural areas. Let people realize that running a supermarket is a means to protect the environment and a provide a beautiful home, not an end in itself, and guide villagers to realize the dangers of plastic bags, which cannot be swapped for the sake of exchange, and reduce the generation of negative externalities.
- (2)
- The activities related to garbage exchange supermarkets (such as agricultural product exhibition, lectures on garbage classification) can be increased. The survey shows that in addition to garbage exchange, residents of Xixinan village in Huizhou District also participate in activities such as agricultural product exhibition and sale, which increases the residents’ sense of participation. However, the garbage exchange supermarkets in Liukou and Huangtian villages have a single function, i.e., garbage exchange.
- (3)
- For other non-convertible wastes in rural areas (such as construction waste), targeted collection and transportation must be carried out.
- (4)
- The types of exchange items available in supermarkets can be expanded to consider the needs of different age groups. Moreover, the capital source of the supermarket is the key to its sustainable operation, which needs more consideration and multi-channel financing.
Author Contributions
Funding
Institutional Review Board Statement
Informed Consent Statement
Data Availability Statement
Conflicts of Interest
References
- Liu, Y.; Li, Y. Revitalize the world’s countryside. Nature 2017, 548, 275–277. [Google Scholar] [CrossRef] [PubMed]
- Li, J.; Hu, Z. Countermeasures for Distributed Rural Waste Management in America. World Agric. 2017, 3, 33–37. [Google Scholar]
- Lu, S.; Li, X.; Du, H. Comparative Analysis and Some Suggestions of Typical Governance Modes of Rural Household Waste. World Agric. 2018, 2, 4–10. [Google Scholar]
- Liu, C.; Liang, D.; Chen, B. Foreign Experience Revelation for the Rural Municipal Solid Waste Treatment in China. Dev. Small Cities Towns 2016, 8, 23–27. [Google Scholar]
- Yao, J.; Zheng, G. Review of rural waste management and treatment modes in China and abroad. World Agric. 2019, 2, 77–82. [Google Scholar]
- Central Committee of the Communist Party of China. Opinions of the Central Committee of the Communist Party of China and the State Council on Grasping the Key Work in the Field of “Agriculture, Rural Areas and Farmers” to Ensure the Realization of a Well-Off Society in an All-Round Way as Scheduled; Central Committee of the Communist Party of China: Beijing, China, 2020.
- Florin-Constantin, M. Rural plastic emissions into the largest mountain lake of the Eastern Carpathians. R. Soc. Open Sci. 2018, 5, 172–396. [Google Scholar]
- El-Messery, M.A.; Ismail, G.A.; Arafa, A.K. Evaluation of municipal solid waste management in Egyptian rural areas. J. Egypt. Public Health Assoc. 2009, 84, 51–71. [Google Scholar]
- Bernardes, C.; Günther, W. Generation of Domestic Solid Waste in Rural Areas: Case Study of Remote Communities in the Brazilian Amazon. Hum. Ecol. 2014, 42, 617–623. [Google Scholar] [CrossRef]
- Niles, M.T. Majority of Rural Residents Compost Food Waste: Policy and Waste Management Implications for Rural Regions. Front. Sustain. Food Syst. 2020, 3, 123. [Google Scholar] [CrossRef]
- Vallente, J.; Limon, M.R.; Corales, N. Solid waste management beliefs and practices in rural households towards sustainable development and pro-environmental citizenship. Glob. J. Environ. Sci. Manag. 2020, 6, 441–456. [Google Scholar]
- Jenkins, R.R.; Martinez, S.A.; Palmer, K.; Podolsky, M.J. The determinants of household recycling: A material-specific analysis of recycling program features and unit pricing. J. Environ. Econ. Manag. 2003, 45, 294–318. [Google Scholar] [CrossRef] [Green Version]
- Jiang, L.; Zhao, X. Classified Treatment Management of Rural Domestic Waste: Model Comparison and Policy Enlightenment Based on a Case Study of Four Ecological Conservation Areas in Beijing. China Rural. Surv. 2020, 2, 16–33. [Google Scholar]
- Du, Y.; Liu, H.; Chen, L. On Efficiency Difference of PPP Mode and Traditional Mode in Rural Environmental Governance: A Comparative Analysis based on Domestic Waste Disposal Cases. J. Nanjing Univ. Technol. Soc. Sci. 2020, 19, 59–68. [Google Scholar]
- Tian, H. Actively Explore the Legalization of Rural Garbage Management. People’s Trib. 2019, 2, 90–91. [Google Scholar]
- Xie, Y. Comparison of Chinese and foreign legal systems for rural garbage disposal. World Agric. 2014, 7, 74–77. [Google Scholar]
- Zhang, X. Research on the legal problems existing in rural garbage disposal in my country. Leg. Vis. 2015, 20, 106–107. [Google Scholar]
- Ning, Q.; Li, B. On the commonweal trust system Of China in collecting and handling of rural garbage. J. Guangxi Adm. Cadre Inst. Polit. Law 2012, 27, 30–39. [Google Scholar]
- Xie, K.; Li, S.; Wang, Y. The Study of Rural Residents’ Willingness to Pay for the Centralized Treatment of Domestic Garbage: Based on the Theory of Planned Behavior. Ecol. Econ. 2020, 36, 177–182. [Google Scholar]
- Shen, J.; Qu, M.; Zhen, D.; Zhang, Y. Research on the farmers′ behavior of domestic waste source sorting-Based on TPB and NAM integration framework. J. Arid Land Resour. Environ. 2020, 34, 75–81. [Google Scholar]
- Xu, Q.; Wang, C.; Zhang, S. The influence of farmers ‘ participation on rural domestic waste sorting treatment. J. Agric. Resour. Environ. 2021, 38, 9. [Google Scholar]
- Ojedokun, O. Attitude towards littering as a mediator of the relationship between personality attributes and responsible environmental behavior. Waste Manag. 2011, 31, 2601–2611. [Google Scholar] [CrossRef] [PubMed]
- Foguesatto, C.R.; Borges, J.R.; Machado, J.D. Farmers’ typologies regarding environmental values and climate change: Evidence from southern Brazil. J. Clean. Prod. 2019, 232, 400–407. [Google Scholar] [CrossRef]
- Best, H. Environmental concern and the adoption of organic agriculture. Soc. Nat. Resour. 2010, 23, 451–468. [Google Scholar] [CrossRef]
- Aregay, F.A.; Minjuan, Z.; Tao, X. Knowledge, attitude and behavior of farmers in farmland conservation in China: An application of the structural equation model. J. Environ. Plan. Manag. 2017, 61, 249–271. [Google Scholar] [CrossRef]
- Gursoy, D.; Zhang, C.; Chi, O.H. Determinants of locals’ heritage resource protection and conservation responsibility behaviors. Int. J. Contemp. Hosp. Manag. 2019, 31, 2339–2357. [Google Scholar] [CrossRef]
- Han, J. There are “ ecological-beauty supermarkets” in the countryside of Huangshan City (N). The People’s Daily, 26 August 2021. [Google Scholar]
- Ajzen, I. The theory of planned behavior. Organ. Behav. Hum. Decis. Processes 1991, 50, 179–211. [Google Scholar] [CrossRef]
- Panwanitdumrong, K.; Chen, C.-L. Investigating factors influencing tourists’ environmentally responsible behavior with extended theory of planned behavior for coastal tourism in Thailand. Mar. Pollut. Bull. 2021, 169, 112507. [Google Scholar] [CrossRef]
- Shen, J.; Zheng, D.; Zhang, X.; Qu, M. Investigating Rural Domestic Waste Sorting Intentions Based on an Integrative Framework of Planned Behavior Theory and Normative Activation Models: Evidence from Guanzhong Basin, China. Int. J. Environ. Res. Public Health 2020, 17, 4887. [Google Scholar] [CrossRef]
- Luo, G. Research on Rural Ecological Environmental Supervision Behavior Based on the Perspective of Planned Behavior Theory Taking Henan Four Counties as an Example. J. Agric. Catastrophol. 2020, 10, 88–91. [Google Scholar]
- Wang, Y.; Long, X.; Li, L.; Wang, Q.; Ding, X.; Cai, S. Extending theory of planned behavior in household waste sorting in China: The moderating effect of knowledge, personal involvement, and moral responsibility. Environ. Dev. Sustain. 2021, 23, 7230–7250. [Google Scholar] [CrossRef]
- Ap, J. Residents’ perceptions on tourism impacts. Ann. Tour. Res. 1992, 19, 665–690. [Google Scholar] [CrossRef]
- Sirivongs, K.; Tsuchiya, T. Relationship between local residents’ perceptions, attitudes and participation towards national protected areas: A case study of Phou Khao Khouay National Protected Area, central Lao PDR. For. Policy Econ. 2012, 21, 92–100. [Google Scholar] [CrossRef]
- Duan, W.; Zhao, Z.; Ma, B.; Wen, Y. Perceptions of rural household surrounding the protection area on protection benefits and losses. Resour. Sci. 2015, 37, 2471–2479. [Google Scholar]
- Chen, A.; Zhu, H. A survey on the status quo and satisfaction of waste exchange supermarkets in Quzhou. Mod. Mark. 2019, 11, 222–224. [Google Scholar]
- Zhao, X.; Jiang, W.; Cheng, W. Study on the Willingness of Rural Residents to Participate in the Environmental Governance of Human Settlements Based on the Theory of Planned Behavior: Taking Xinjiang as an Example. J. Ecol. Rural Environ. 2021, 37, 439–447. [Google Scholar]
- Kollmuss, A.; Agyeman, J. Mind the Gap: Why Do People Act Environmentally and What Are the Barriers to Pro-Environmental Behavior? Environ. Educ. Res. 2002, 8, 239–260. [Google Scholar] [CrossRef] [Green Version]
- Zhou, J. Analysis of farmers’ vegetable quality and safety control behavior and its influencing factors: An empirical analysis based on 396 vegetable farmers in Zhejiang Province. Chin. Rural Econ. 2006, 11, 25–34. [Google Scholar]
- Nan, L.; Li, Y.; Tang, Y. Analysis on Motivation Factors of Cultivated Land Protection—Based on Micro-data from 1034 Farmer Households in Zhengzhou City. J. Huazhong Agric. Univ. 2013, 1, 72–76. [Google Scholar]
- Wilton, T. Models of consumer satisfaction: An extension. J. Mark. Res. 1988, 25, 204–211. [Google Scholar]
- Jiang, Y. Empirical Research on the Relationship between Service Quality of Rail Less-than-carload Freight Transportation and Customer Satisfaction—From the Perspective of Customer Perception. China Bus. Mark. 2021, 35, 11–23. [Google Scholar]
- Zheng, J.; Chen, Z.; Guo, J. The Effect of Public Perceived Quality of Urban Community Public Sports Service on Public Trust: Based on the Mediating Effect of Public Satisfaction. J. Chengdu Phys. Educ. Inst. 2021, 47, 94–100. [Google Scholar]
- Li, J.; Dai, G. The Effects of Motivation and Authenticity on Satisfaction in Festival Context—From Individualism-collectivism Perspective. J. Tech. Econ. Manag. 2021, 1, 93–98. [Google Scholar]
- Liu, Q.; He, J.; Hou, G. Farmers’ Perceived Value and the New Rural Residential Satisfaction: The Regulatory Role of Peasant Household Characteristics. Urban Dev. Stud. 2013, 20, 96–101. [Google Scholar]
- Lee, T.H.; Jan, F.H.; Yang, C.C. Conceptualizing and measuring environmentally responsible behaviors from the perspective of community-based tourists. Tour. Manag. 2013, 36, 454–468. [Google Scholar] [CrossRef]
- Wang, X.; Zeng, X. Perception, Intention, and Action: On Influencing Path of Urban Residents’ Waste Separation Behavior. J. Nanjing Univ. Technol. 2021, 16, 107–122. [Google Scholar]
- Wang, Z. Analysis of Residents’ Participation and Satisfaction in Waste Sorting—Taking Tongling City as an Example. Mod. Bus. Trade Ind. 2021, 42, 66–67. [Google Scholar]
- Chen, H.; Mei, Q.; Wang, Y.; Zhang, B.; Li, S. A research on the driving power about environmentally responsible behavior from the destination image of historic blocks: Satisfaction as mediator variable. Chin. J. Popul. Resour. Environ. 2017, 27, 106–116. [Google Scholar]
- Ma, B.; Feng, J.; Chen, L.; Wen, Y. Analysis of Farmers Satisfaction on Reserve and Protection Attitude: Based on the Survey Data from Seven Provinces Reserves. Ecol. Econ. 2017, 33, 146–151. [Google Scholar]
- Yoon, J.I.; Kyle, G.T.; Riper, C.J.V.; Sutton, S.G. Testing the Effects of Constraints on Climate Change—Friendly Behavior among Groups of Australian Residents. Coast. Manag. 2013, 41, 457–469. [Google Scholar] [CrossRef]
- Kaiser, F.G. A General Measure of Ecological Behavior. J. Appl. Soc. Psychol. 1998, 28, 395–422. [Google Scholar] [CrossRef]
- Cao, J.H. Research on Rural Domestic Waste Disposal Under the Perspective of Rural Revitalization. Chongqing Soc. Sci. 2019, 6, 44–54. [Google Scholar]


| Project | Frequency | Percentage | |
|---|---|---|---|
| Sex | Male | 84 | 25.9% |
| Female | 240 | 74.1% | |
| Under 20 | 0 | 0% | |
| Age | 20–29 years old | 9 | 28% |
| 30–39 years old | 19 | 5.9% | |
| 40–49 years old | 23 | 7.1% | |
| 50–59 years old | 94 | 29% | |
| Over 60 years old | 179 | 55.2% | |
| Elementary school and below | 222 | 68.5% | |
| Education | Junior high school | 70 | 21.6% |
| High school and secondary school | 17 | 5.2% | |
| College | |||
| Bachelor’s degree and above | 7 | 2.2% | |
| 5000 and below | 6 | 1.9% | |
| 5000–10,000 yuan | 225 | 69.1% | |
| Average annual income | 10,000–15,000 yuan | 39 | 12% |
| 20,000 yuan | 27 | 8.3% | |
| Farming | 34 | 10.5% | |
| Business | 174 | 46.3% | |
| Forestry/tea tndustry | 34 | 10.5% | |
| Source of income | Work to earn a living | 88 | 27.2% |
| Freelance | 53 | 16.4% | |
| Others | 16 | 4.9% | |
| Yes | 18 | 5.6% | |
| No | 321 | 99.1% | |
| Local resident | 3 | 0.9% | |
| Project | Frequency | Percentage | Project | Frequency | Percentage |
|---|---|---|---|---|---|
| Exchange type | Redemption frequency | ||||
| Plastic bag | 277 | 85.5% | 1 time/week | 54 | 16.7% |
| Cans | 43 | 13.3% | 2 times/month | 170 | 52.5% |
| Plastic drinking bottle | 231 | 71.3% | 2 times/year | 68 | 21 % |
| Paper drinking bottle | 1 time/year | 31 | 9.6% | ||
| Cigarette case | 62 | 9.1% | Other | 1 | 0.3% |
| Cigarette butt | Participation points system | ||||
| Other | 159 | 49.1% | Not implemented | 199 | 61.4% |
| Exchange item type | 129 | 39.8% | Implemented, not participating | 45 | 13.9% |
| Bbutter /soy sauce | 30 | 9.3% | Implemented, participated | 80 | 24.7% |
| Toothbrush | Learned about the supermarket via | ||||
| Toothpaste | Friends and neighbors | 183 | 56.5% | ||
| Dish soap | 103 | 31.8% | Letter to the villagers | 62 | 19.1% |
| Toilet paper | 66 | 20.4% | Village post announcement | 155 | 47.8% |
| Salt | 84 | 25.9% | Other | 8 | 2.5% |
| Chicken essence | 180 | 55.6% | Understanding of ecological compensation | ||
| Other | 72 | 22.2% | Know about eco-compensation | ||
| 202 | 62.3% | Heard of ecological compensation | 34 | 10.5% | |
| 14 | 4.3% | Do not know about ecological compensation | 42 | 13% | |
| 7 | 2.2% | 248 | 76.5% |
| Dimensions and Items | Mean Statistics | Standard Deviation Statistics | Factor Loadings | Variance Contribution Rate |
|---|---|---|---|---|
| Benefit perception | 4.33 | 0.53 | 17.988% | |
| B1 Spam exchange improves local image | 4.27 | 0.623 | 0.715 | |
| B2 Enhance residents’ awareness of environmental protection | 4.31 | 0.608 | 0.657 | |
| B3 After the establishment of the supermarket, the waste in the village has been reduced | 4.43 | 0.642 | 0.763 | |
| B4 Establishment of the supermarket contributes to the air protection | 4.30 | 0.628 | 0.803 | |
| B5 Establishment of the supermarket contributes to the water protection | 4.39 | 0.622 | 0.810 | |
| Cost perception | 2.27 | 1.01 | 35.185% | |
| C1 Need to spend time on learning and training related to garbage classification | 2.14 | 1.036 | 0.883 | |
| C2 Takes time to sort waste | 2.35 | 1.121 | 0.871 | |
| C3 You need to wait in line for garbage exchange | 2.40 | 1.161 | 0.888 | |
| Satisfaction | 4.15 | 0.701 | 50.512% | |
| A1 The exchange of garbage in the supermarket is very practical and safe | 4.28 | 0.741 | 0.825 | |
| A2 Garbage exchange supermarkets exchange a wide range of garbage types | 4.06 | 0.804 | 0.785 | |
| A3 Garbage exchange supermarkets is very convenient and affordable | 4.22 | 0.721 | 0.836 | |
| A4 The publicity model and the management of the garbage exchange supermarket are very suitable | 4.02 | 0.851 | 0.814 | |
| Manner | 4.37 | 0.618 | 65.315% | |
| D1 The establishment of the garbage exchange supermarket contributes to the improvement of the environment in the region | 4.24 | 0.742 | 0.753 | |
| D2 I am satisfied with the current management of the garbage exchange supermarket by the supermarket manager | 4.23 | 0.687 | 0.729 | |
| D3 I hope the garbage exchange supermarket will continue to run | 4.43 | 0.745 | 0.800 | |
| D4 I support the establishment of a garbage exchange supermarket | 4.50 | 0.710 | 0.851 |
| Environmentally Responsible Behavior | Mean | Standard Deviation | Factor Loadings | Variance Contribution Rate |
|---|---|---|---|---|
| Compliance environmentally responsible behavior | 4.34 | 0.618 | 38.171% | |
| E1 I have never littered plastic bags, cigarette butts, cigarette boxes, and other garbage in life | 4.38 | 0.735 | 0.840 | |
| E2 I will collect garbage and go to the garbage exchange supermarket for exchange | 4.34 | 0.692 | 0.827 | |
| E3 I collect and recycle waste paper | 4.29 | 0.732 | 0.812 | |
| Promoting environmentally responsible behavior | 4.14 | 0.743 | 32.047% | |
| E4 I will participate in volunteering activities related to garbage cleaning in the village | 4.21 | 0.868 | 0.753 | |
| E5 I will learn about garbage disposal and sorting | 4.07 | 0.905 | 0.809 | |
| E6 I will remind my friends to not litter | 4.16 | 0.887 | 0.775 | |
| E7 I will report the environmental issues and opinions in my area to the relevant departments | 4.12 | 0.960 | 0.825 |
| Latent Variable | Observed Variable | Factor Loadings | Cronbach’α | Combined Reliability (CR) | AVE Value |
|---|---|---|---|---|---|
| Benefit perception | B1 Spam exchange improves local image | 0.585 | 0.810 | 0.8096 | 0.4659 |
| B2 Enhance residents’ awareness of environmental protection | 0.520 | ||||
| B3 After the supermarket was established, the garbage in the village was reduced | 0.710 | ||||
| B4 Establishment of the supermarket contributes to the air protection | 0.755 | ||||
| B5 Establishment of the supermarket contributes to the water protection | 0.808 | ||||
| Cost perception | C1 It takes time for learning and training related to garbage classification | 0.815 | 0.861 | 0.8634 | 0.6783 |
| C2 It takes time to sort waste | 0.796 | ||||
| C3 Garbage exchange needs to wait in line | 0.850 | ||||
| Satisfaction | A1 The exchange items in the garbage exchange supermarket are very practical and there are many types | 0.767 | 0.831 | 0.8318 | 0.5535 |
| A2 The garbage exchange in the supermarket is very comprehensive | 0.686 | ||||
| A3 The garbage exchange supermarket is very convenient and affordable | 0.787 | ||||
| A4 The publicity model and management of the garbage exchange supermarket are very suitable | 0.731 | ||||
| Manner | D1 The establishment of garbage exchange supermarket contributes to the improvement of the environment in the region | 0.540 | 0.791 | 0.7889 | 0.4963 |
| D2 I am satisfied with the current management of the garbage exchange supermarket by the supermarket manager | 0.520 | ||||
| D3 I hope the garbage exchange supermarket will continue to run | 0.794 | ||||
| D4 I support the establishment of a garbage exchange supermarket | 0.891 | ||||
| Compliance ERB | E1 I have never littered plastic bags, cigarette butts, cigarette boxes, and other garbage in my life | 0.880 | 0.791 | 0.8263 | 0.6154 |
| E2 I will collect the garbage and go to the garbage exchange supermarket to exchange it | 0.703 | ||||
| E3 I collect and recycle waste paper | 0.760 | ||||
| Facilitated ERB | E4 I will participate in volunteering activities related to garbage cleaning in the village | 0.670 | 0.838 | 0.8391 | 0.5665 |
| E5 I will learn about waste disposal and sorting | 0.796 | ||||
| E6 I will remind my friends to not litter | 0.733 | ||||
| E7 I will report environmental issues and opinions in my area to the relevant departments | 0.778 |
| Fit Metrics | CMIN/DF | GFI | AGFI | NFI | IFI | TLI | CFI | RMSEA |
|---|---|---|---|---|---|---|---|---|
| Judgment standard | <3 | >0.9 | >0.9 | >0.9 | >0.9 | >0.9 | >0.9 | <0.08 |
| Initial model | 2.668 | 0.850 | 0.814 | 0.822 | 0.881 | 0.863 | 0.880 | 0.072 |
| Corrected model | 1.891 | 0.937 | 0.874 | 0.876 | 0.937 | 0.927 | 0.937 | 0.053 |
| Assumption | Path | Standardized Coefficient | CR Value | p Value | Result |
|---|---|---|---|---|---|
| H1 | Benefit perception → Attitude | 0.090 | 2.000 | * | Yes |
| H2 | Cost perception → Attitude | 0.041 | −2.153 | 0.312 | No |
| H3 | Attitude → Environmentally responsible behavior | 0.047 | 2.240 | * | Yes |
| H4 | Benefit perception → Satisfaction | 0.077 | 5.660 | *** | Yes |
| H5 | Cost perception → Satisfaction | 0.036 | −3.286 | ** | Yes |
| H6 | Satisfaction → Attitude | 0.083 | 4.439 | *** | Yes |
| H7 | Satisfaction → Environmentally responsible behavior | 0.056 | 3.3598 | *** | Yes |
Publisher’s Note: MDPI stays neutral with regard to jurisdictional claims in published maps and institutional affiliations. |
© 2022 by the authors. Licensee MDPI, Basel, Switzerland. This article is an open access article distributed under the terms and conditions of the Creative Commons Attribution (CC BY) license (https://creativecommons.org/licenses/by/4.0/).
Share and Cite
Lu, S.; Zhou, Z.; Lu, Y. Rural Residents’ Perceptions, Attitudes, and Environmentally Responsible Behaviors towards Garbage Exchange Supermarkets: An Example from Huangshan City in China. Sustainability 2022, 14, 8577. https://doi.org/10.3390/su14148577
Lu S, Zhou Z, Lu Y. Rural Residents’ Perceptions, Attitudes, and Environmentally Responsible Behaviors towards Garbage Exchange Supermarkets: An Example from Huangshan City in China. Sustainability. 2022; 14(14):8577. https://doi.org/10.3390/su14148577
Chicago/Turabian StyleLu, Song, Zehui Zhou, and Yingfan Lu. 2022. "Rural Residents’ Perceptions, Attitudes, and Environmentally Responsible Behaviors towards Garbage Exchange Supermarkets: An Example from Huangshan City in China" Sustainability 14, no. 14: 8577. https://doi.org/10.3390/su14148577
APA StyleLu, S., Zhou, Z., & Lu, Y. (2022). Rural Residents’ Perceptions, Attitudes, and Environmentally Responsible Behaviors towards Garbage Exchange Supermarkets: An Example from Huangshan City in China. Sustainability, 14(14), 8577. https://doi.org/10.3390/su14148577