Article

Emergency Monitoring of a Tailings Pond Leakage Accident Based on the GEE Platform

1
State Key Laboratory of Coal Resources and Safe Mining, China University of Mining and Technology (Beijing), Beijing 100083, China
2
College of Geoscience and Surveying Engineering, China University of Mining and Technology (Beijing), Beijing 100083, China
3
Hebei Research Center for Geoanalysis, Baoding 071051, China
4
Key Laboratory of Mineral Resources and Ecological Environment Monitoring, Baoding 071051, China
*
Author to whom correspondence should be addressed.
Sustainability 2022, 14(14), 8558; https://doi.org/10.3390/su14148558
Submission received: 22 May 2022 / Revised: 8 July 2022 / Accepted: 8 July 2022 / Published: 13 July 2022

Abstract

:
The utilization of mineral resources plays an important role in supporting and promoting economic development and social progress. As a necessary facility for the development and utilization of mineral resources, tailings ponds will cause a series of safety and environmental problems once accidents occur. Based on the Sentinel-2 images obtained from the GEE (Google Earth Engine) platform, this paper carried out emergency monitoring of the Yichun Luming Mining tailings pond leakage accident on 28 March 2020, through the spectral changes in monitoring points in the downstream rivers of the tailings pond, the changes in the images before and after the accident, and the analysis of long-time series various indexes. The results revealed that the pollution was quickly treated in a short time, and the river spectrum returned to normal on April 13. The pollution spread for approximately 300 km downstream to the Yijimi River and the Hulan River, and was finally intercepted at the Lanxi Old Bridge 67 km away from the Songhua River, so that more serious pollution was avoided. This accident had a direct impact on the surrounding six counties. The decrease in NDVI reflects that the accident has a certain degree of influence on the vegetation around the tailings pond, while the change in NDTI reflects that some remedial measures have been taken for the tailings pond after the accident. This study demonstrates the advantages of the GEE platform for the emergency monitoring of accidents, which can provide a reference for the emergency monitoring of similar accidents.

1. Introduction

Mineral resources are an important basis for the survival of human society, but they also bring a series of safety problems while they are exploited and utilized, and the development of the mining industry inevitably produces tailings ponds. There are more than 10,000 tailings ponds of various sizes in China [1]. The tailings pond is constructed by damming or enclosure, which is used to store tailings or other waste residues discharged from metal or nonmetal mines after beneficiation [2]. It contains a large number of useful or harmful components that cannot be treated temporarily, and it is the necessary infrastructure for mining activities [3], which has played a significant role in environment and resources protection. However, another problem is the accident-prone position of the mine [4]. As the tailings pond dam breaks, not only is the mine’s normal operation affected, but the surrounding residents’ and environment’s safety is also seriously threatened, with the possible result of a large number of casualties, the destruction of farmland and villages, and serious environmental pollution. Emergency monitoring of tailings pond leakage accidents is of great importance to protect the livelihood and property of people located downstream and ensure social stability [5].
As an important data acquisition method, remote sensing technology can compensate for the defects of traditional monitoring methods, and it has become an important means of accident monitoring in mining areas because of its obvious advantages, such as being fast, large-scale, continuous and dynamic, being less limited by ground conditions, and obtaining comprehensive information [6]. It can not only observe the air, soil, vegetation and water quality from a macro perspective but also track and monitor the development of sudden environmental pollution incidents in real time and quickly, formulate disposal measures in time, reduce the losses caused by pollution, and continuously monitor the pollution control and recovery status. At present, remote sensing investigation and monitoring of mine development has begun to pay attention to the impact of tailings ponds on the environment [7]. However, most of the current work remains at the stage of investigating and monitoring the solid waste accumulation and coverage area [8], as well as environmental risk assessment [9], and there is a lack of research on the overall environmental impact range and degree. Moreover, remote sensing technology usually uses the method of obtaining a spectrum on the spot to construct a quantitative inversion model for the pollution monitoring of vegetation and water, which has low timeliness. At the same time, the download and processing of remote sensing data are also complicated, and the monitoring of sudden accidents is not fast and effective enough [10].
The GEE (Google Earth Engine) cloud platform is a platform provided by Google for the online visual calculation, analysis and processing of a large amount of global-scale earth science data. Specifically, the GEE cloud platform integrates many remote sensing image datasets and geospatial datasets [11,12]. At the same time, the GEE cloud platform also has a strong global-scale analysis capability, which makes it very convenient for scientists, researchers and developers to monitor changes, map trends and quantify surface differences [13]. The monitoring of emergency accidents based on the GEE platform can overcome the difficulties of remote sensing data acquisition and pre-processing, quickly obtain various remote sensing images of the accident site, and at the same time, carry out long-term series monitoring, which contributes to emergency monitoring and processing of accidents. At present, a great deal of scientific research has been conducted on the GEE cloud platform application, including some research on mining areas. He et al. [14] mapped the year of ponding and recovery caused by underground coal mining in the Panxie mining area of Huainan from 1989 to 2016 on GEE; Sun et al. [15] developed an average impure reduction algorithm for a random forest model in the GEE, and selected Normalized Difference Built-up Index (NDBI), Modified Normalized Difference Water Index (MNDWI) and Normalized Difference Vegetation Index (NDVI) to extract landslide information from Landsat remote sensing data, and a precise extraction of landslides was obtained by visual interpretation; Ma et al. [16] combined the research status and main achievements of physical model tests of tailings ponds in China and summarized the problems and shortcomings of the tested model. However, no researchers have used the GEE to monitor and analyze the pollution of tailings ponds.
At 13:40 on 28 March 2020, the No. 4 well of a molybdenum mine tailings pond owned by Yichun Luming Mining Limited Company (Yichun, China) overflowed, resulting in an increase in water discharge and tailings sand. After the accident, sewage flowed approximately 3 km and entered the Yijimi River. According to the official announcement of The Ministry of Ecology and Environment of China, the occurrence of this accident directly affected the drinking water in Tieli city, and was a secondary environmental emergency with the largest tailings leakage. The most difficult emergency treatment and the extremely arduous task of ecological environment treatment and restoration in the later period occurred in China in the last 20 years.
In the above context, based on the Sentinel-2 images provided by the GEE platform, this paper carried out emergency monitoring of this accident through the spectral changes in monitoring points in the downstream river of the tailings pond, the changes in images before and after the accident, and the analysis of various long-time series indexes. The main objectives of this study were (1) to determine the propagation process of pollution in the river and the treatment time of pollution, as well as the starting point and end point of pollution; (2) to identify the polluted surrounding areas and counties, and the sewage flow direction after the tailings pond leakage accident; (3) to determine the impact of this accident on the nearest forest farm of the tailings pond, and the change in water body in the tailings pond.

2. Materials and Methods
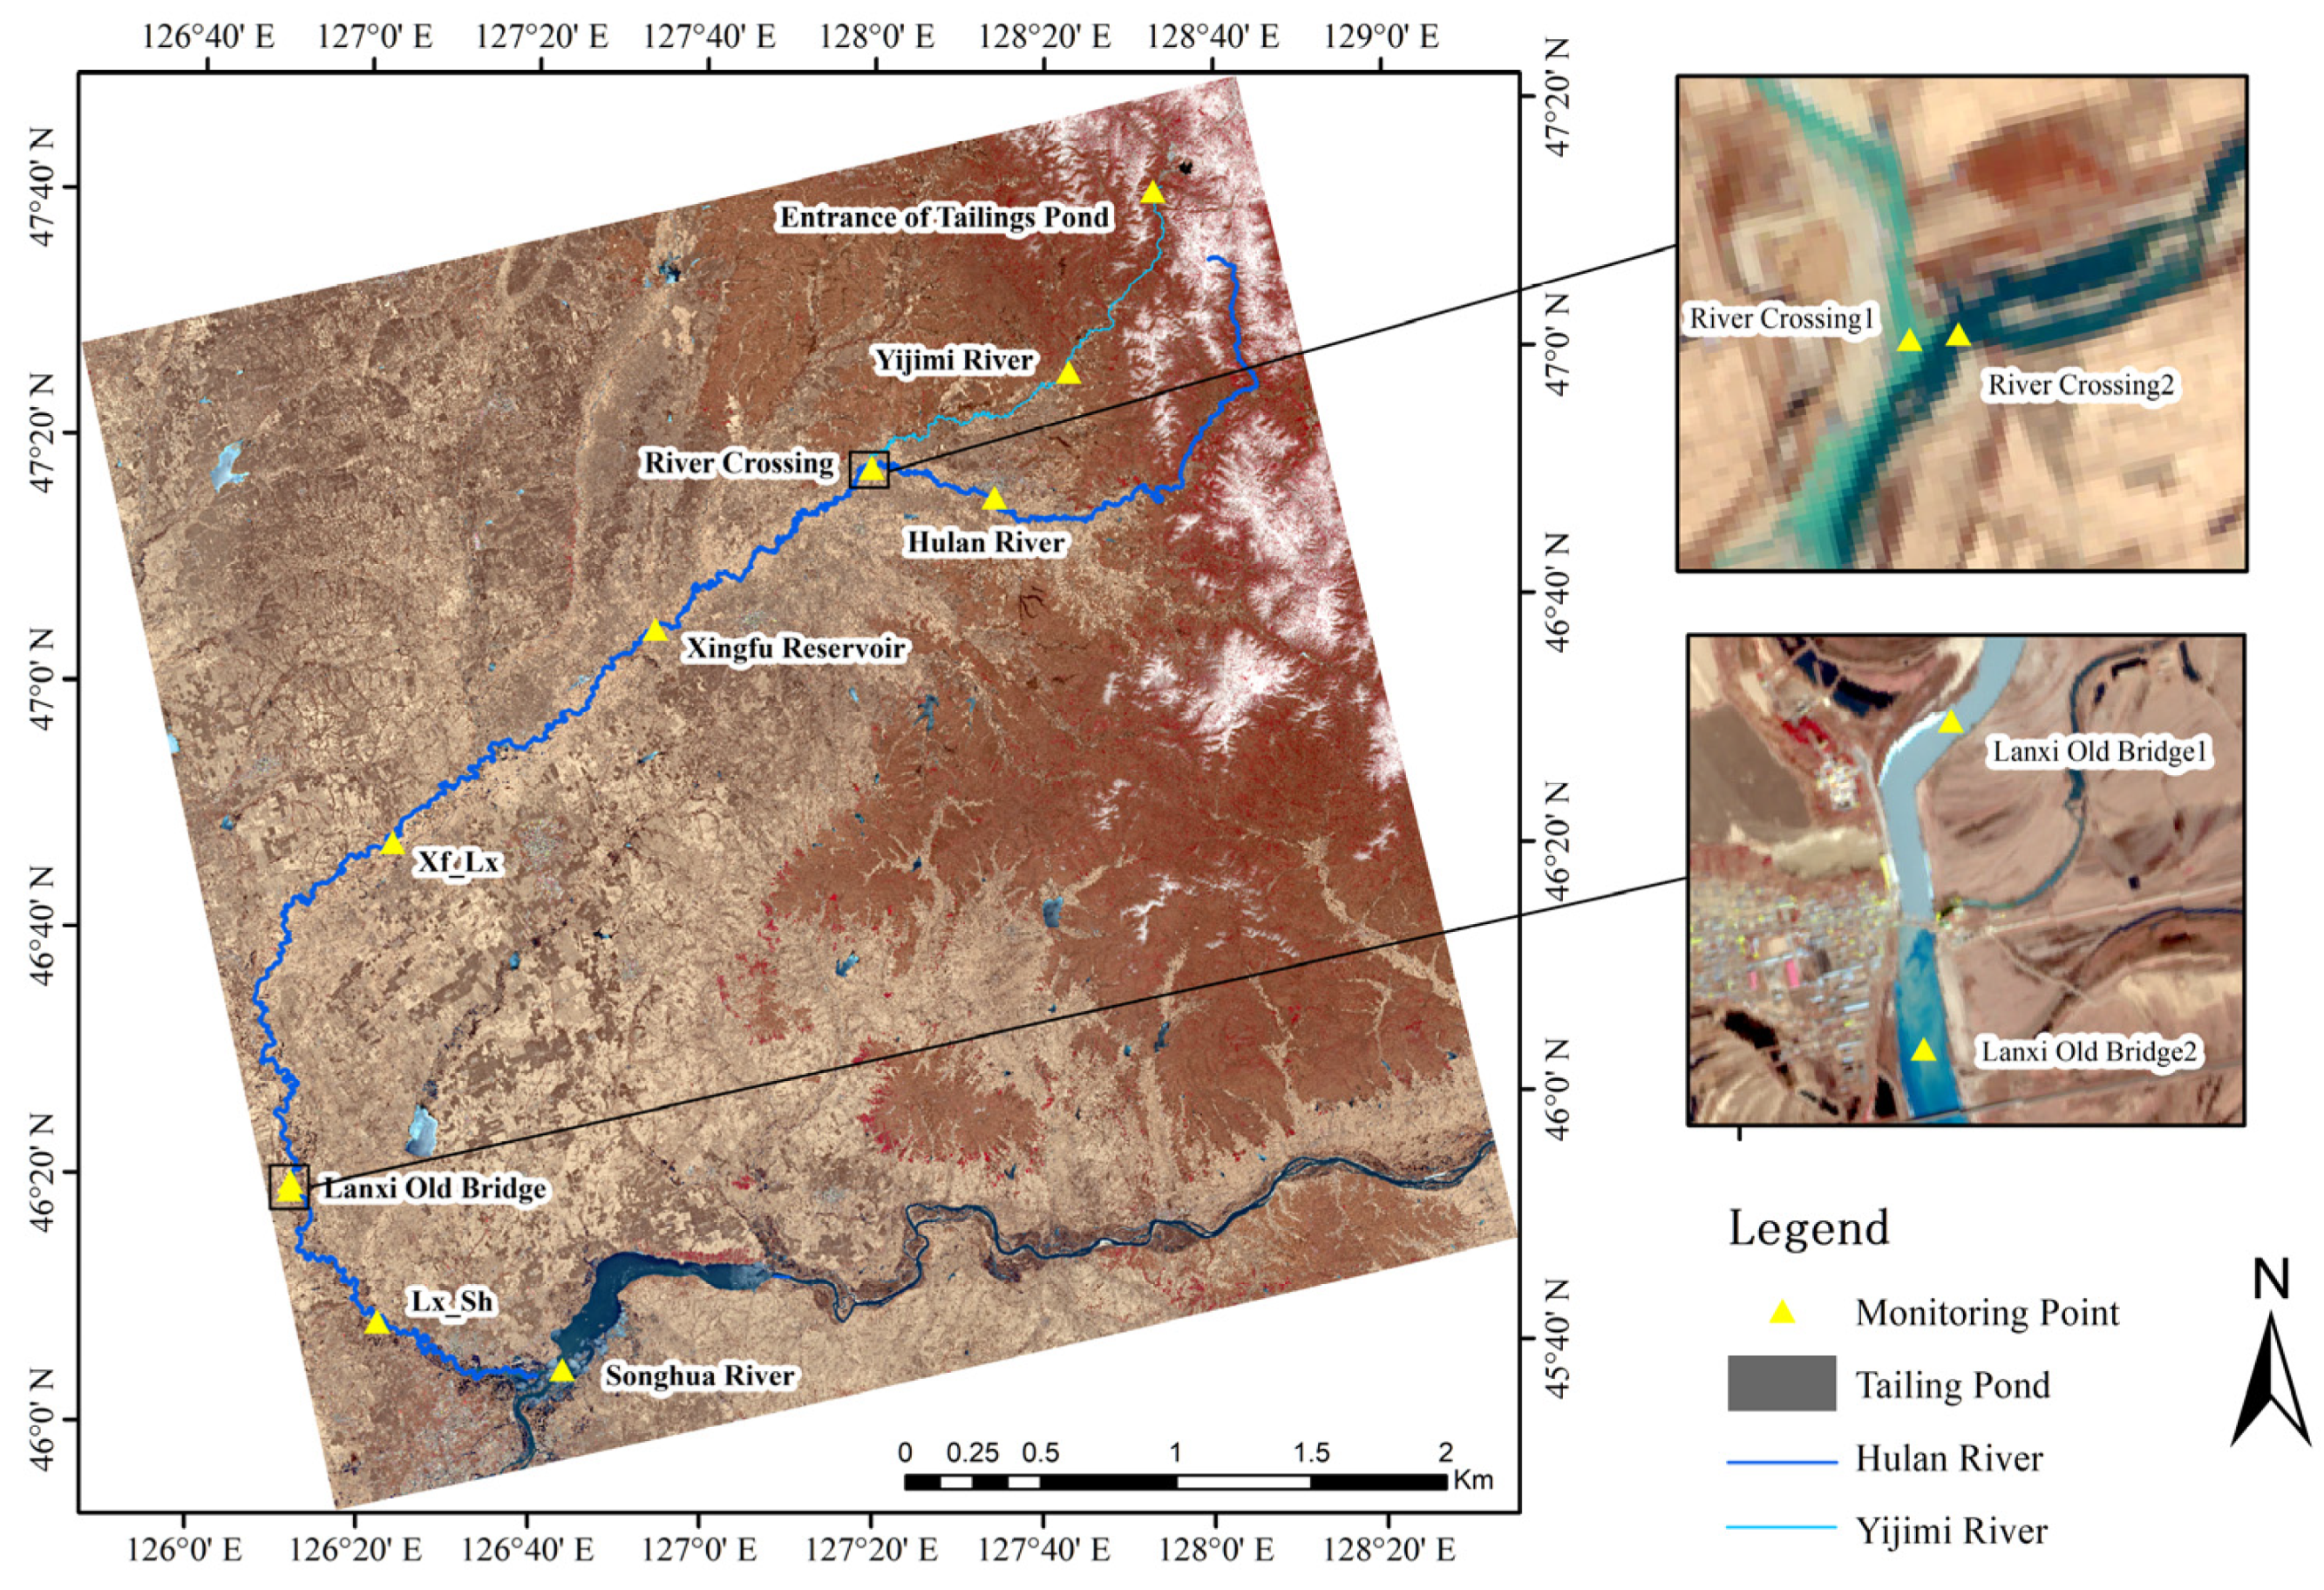
2.1. Study Area

The city of Yichun is located in northeastern Heilongjiang Province. It borders Harbin in the south and Heihe and Suihua in the west, with a total population of 1.276 million. There are 377 mineral sites of various types, including 4 large, 28 medium and 345 small deposits and mineralization points.
Luming Literature Mining Tailings Pond is a facility for storing tailings in Yichun Luming Literature Mining. The main component of tailings is a mixture of tailings and water with particle sizes below 200 mesh. The tailings pond is located 1 km to the east of its concentrator, surrounded by the Lesser Khingan Mountains forest region, with a rich water system. It is 5 km downstream of the Yijimi River, a secondary tributary of the Songhua River. The Yijimi River flows 115 km into the tributary of the Songhua River, Hulan River. Hulan River flows 295 km into the Songhua River, the largest tributary of Heilongjiang, one of the seven major rivers in China. A map of the counties and rivers around the leaking tailings pond and a true color image of the leaking tailings pond are shown in Figure 1.

2.2. Datasets

The Sentinel-2 images of ESA obtained from the GEE platform are the main raster data used for the dynamic monitoring of accidents in this paper. Based on GEE programming, Sentinel-2 L2A images with cloud coverage below 8% from 1 March 2019 to 31 October 2019 and 1 March 2020 to 31 October 2020 were screened and used as satellite image data for this study. These data are the bottom-of-atmosphere corrected reflectance data. The band information of Sentinel-2 is shown in Table 1. The vector data come from the Hulan River Basin vector data provided by the National Earth System Science Data Center, which includes the Hulan River Basin 1:250,000 water system dataset and the Hulan River Basin 1:250,000 boundary dataset.

2.3. Method

2.3.1. GEE-Based Pollution Dynamic Monitoring

After the Yichun tailings pond leakage accident on March 28, the leaked pollutants entered the Yijimi River and spread downstream along the river. To determine the date of pollution diffusion and the river channel through which it flows, this study randomly but uniformly selected Sentinel-2 images with cloud coverage less than 8% on the GEE platform and selected some monitoring points in the Yijimi River and Hulan River. After cloud removal from the images, nine bands, namely, ‘Blue’, ‘Green’, ‘Red’, ‘Red Edge1’, ‘Red Edge2’, ‘Red Edge3’, ‘NIR’, ‘SWIR1’ and ‘SWIR2’, were selected to calculate the average spectrum of about nine pixels around the monitoring points. The pollution changes at different monitoring points on different dates were also monitored. Figure 2 below shows the distribution of monitoring points.
The reflectivity of water is low, generally less than 10%, far lower than most other features. Water has a strong reflection in blue-green bands and a strong absorption in other visible bands. Clear water is the highest in the blue band, and the reflectivity decreases with the increase in wavelength. However, when there are other substances in the water, the reflectance changes. When the water contains chlorophyll, the peak reflectance is in the green band. When the water contains sediment, the visible reflectance will increase obviously, and the reflectance will increase with the increase in sediment content, with the peak value appearing in the yellow and red regions [17,18]. Therefore, when monitoring polluted water with tailings sand, the focus is mainly on the blue, green and red bands, which correspond to B2, B3 and B4 in the Sentinel-2 images.

2.3.2. GEE-Based Time Series Index Computing

There were several large forest farms around the tailings pond where the dam-break accident occurred, and the nearest forest farm was first affected by the accident. At the same time, the dam-break accident of the tailings pond would lead to an increase in water discharge accompanied by tailings sand. In order to study the influence of dam break of tailings pond on surrounding forest farms and determine the change in water content of the tailings pond, this paper used NDVI to study the forest farm closest to the tailings pond, and used NDTI to study the tailings pond area. The study areas are shown in Figure 3.
The normalized vegetation index (NDVI) was used to judge the impact of the accident on the surrounding forest farms, and long-term monitoring can effectively reflect the changes in vegetation coverage and growth status. Using infrared and near infrared band data [19], the NDVI formula is as follows:
NDVI = R n i r R r e d R n i r + R r e d
where R n i r is the near infrared band reflectance; R r e d is the red band reflectance; R n i r and R r e d correspond to bands 8 and 4 in the Sentinel-2 images. Based on Sentinel-2 data provided by the GEE platform, this study calculates NDVI changes associated with forest farms around tailings ponds over a long period of time, and compares different years to determine the impact of accidents on forest farms.
The normalized difference tillage index (NDTI) defined by Yu Moli [20] is used as the tailings spectral index to judge changes in the water content of tailings sands. The correlation coefficient between the NDTI defined by the extracted sensitive band and water content is 0.85. The calculation of NDTI can reflect the water content of tailings in the study area and identify changes in the tailings pond during the accident. The NDTI formula is as follows:
NDTI = R i R j R i + R j
where R i and R j represent the reflectance of the i-th band and the j-th band and correspond to the reflectance of the B11 and B12 bands in the Sentinel-2 image, respectively.

3. Results

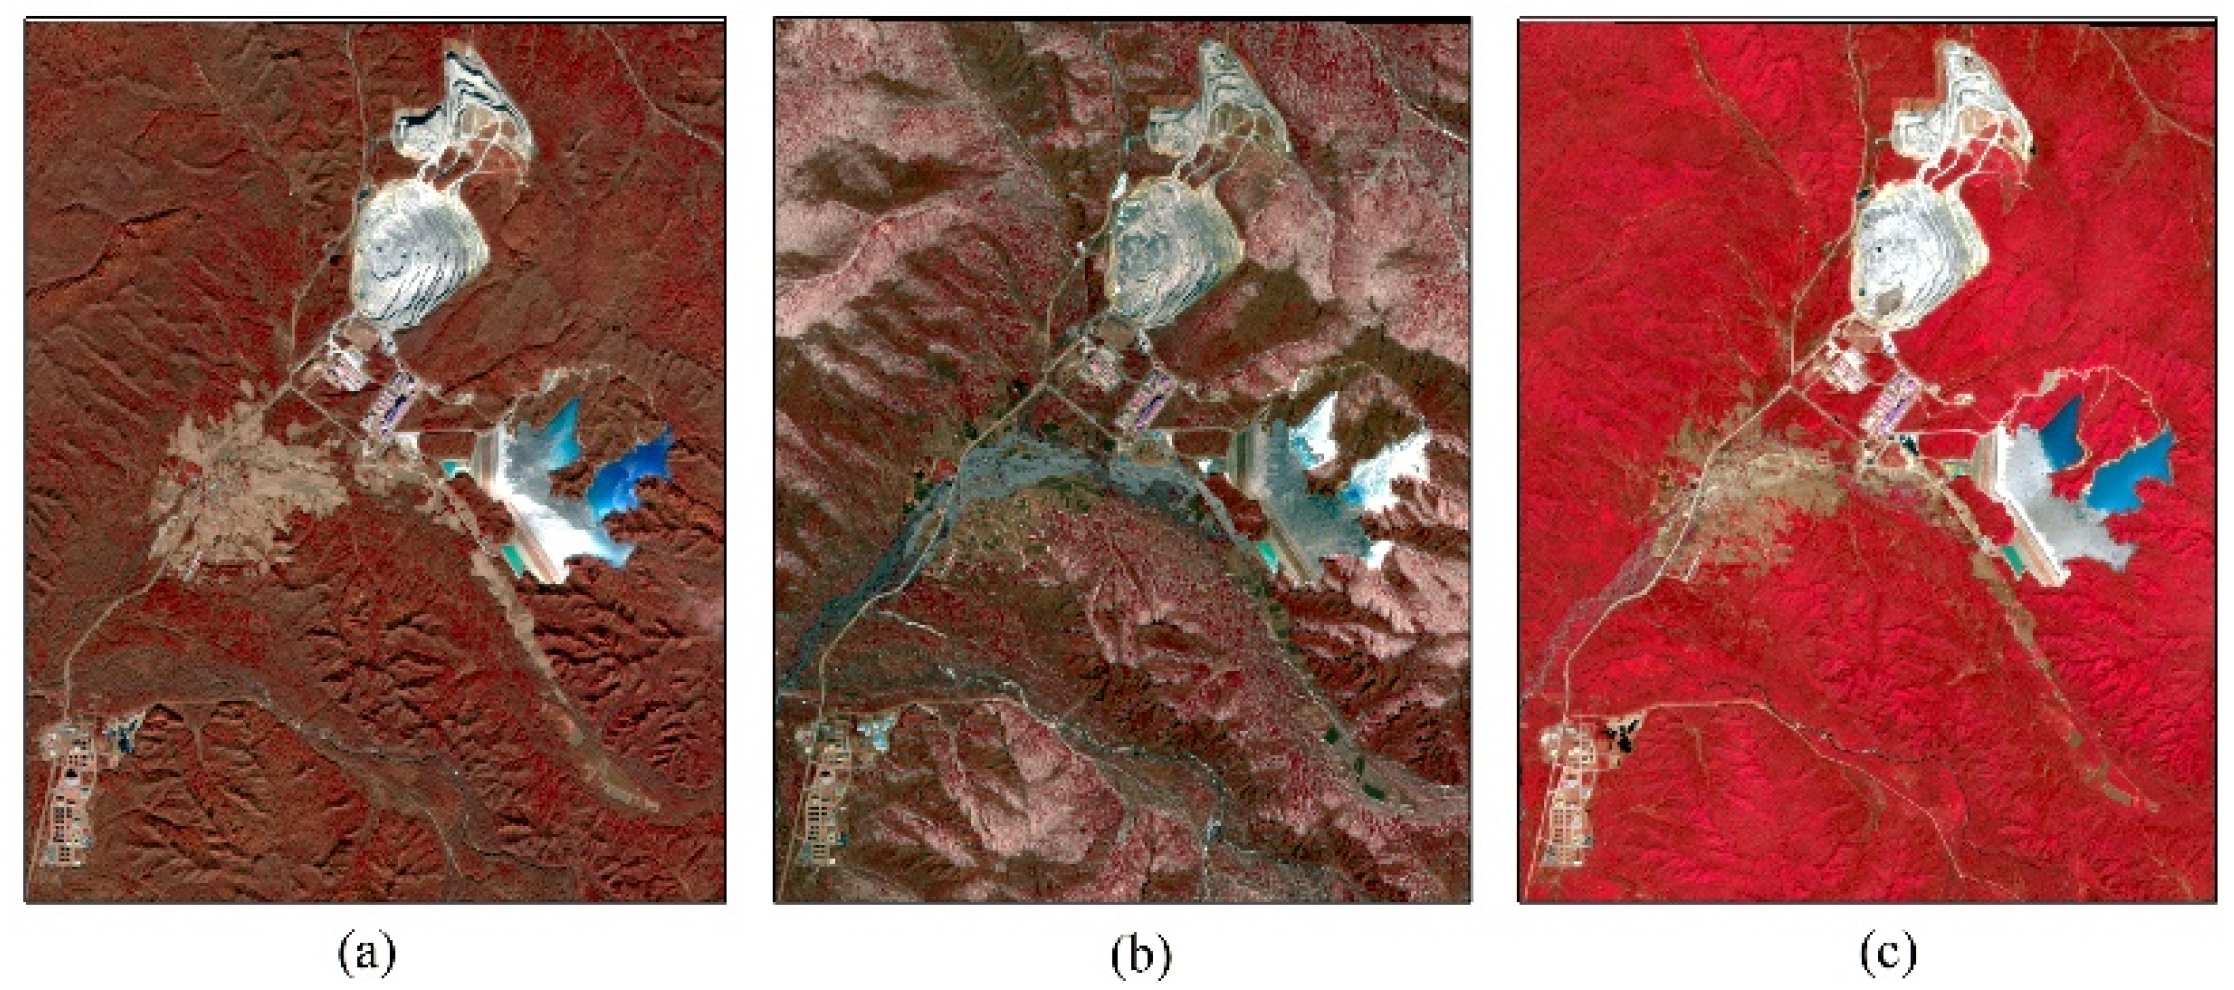
3.1. Results of GEE Pollution Dynamic Monitoring

Figure 4 shows the average spectral curves of each monitoring point on different dates. We can infer the change in pollution from the shape and height of the spectral curve, as well as the average of the spectral reflectance of the blue, green and red bands. As can be seen from the spectrum on 31 March, the spectral reflectance of blue, green and red bands was the highest at the entrance of the tailings pond, where the average spectral reflectance of blue, green and red bands was 0.23, the value at crossing 1 of Hulan River and Yijimi River was 0.20, and the value at the middle of Yijimi River was 0.19, indicating that the pollution flowed downstream, while the lower reflectance at the upper reaches of Hulan River was 0.15, indicating that the pollution did not flowe into the upper reaches of Hulan River. On 5 April, the highest spectral reflectance at Xingfu Reservoir was 0.17, indicating that the pollution reached Xingfu Reservoir at this time. On 10 April, the spectral reflectance of Lanxi Old Bridge 1 was obviously higher, which was 0.18, while other positions tended to be consistent, indicating that the pollution was the most serious at Lanxi Old Bridge 1. At the same time, the area downstream of Lanxi Old Bridge was 0.12, which was quite different from Lanxi Old Bridge 1, indicating that the pollution stayed in the upstream of Lanxi Old Bridge and was intercepted there. On 13 April, the spectral shape of each monitoring point in the lower reaches of Xingfu Reservoir was consistent, and the reflectance was close to that in the Songhua River. It can be found that the spectral reflectance of the Songhua River was relatively stable and consistent on 5 April, 10 April and 13 April, indicating that the pollution did not reach the Songhua River, and it had been treated before 13 April, which was consistent with the facts [21].
According to the pollution changes and the source and end of pollution obtained by spectral analysis, the surrounding counties affected by the tailings pond accident as well as the changes in the tailings pond were analyzed. Figure 5 shows the flow direction of sewage after the dam break of the tailings pond, the source and end points of pollution, the polluted river course and the counties. Figure 5b shows that after the accident, the sewage flowed through approximately 3 km and then entered the Yijimi River, which is the surface water source of Tieli city under the jurisdiction of Yichun city. Figure 5a shows that the tailings sand pollution mass spread for approximately 300 km in the Yijimi River and Hulan River and was eventually intercepted at the Lanxi Old Bridge of the Hulan River, 67 km away from the Songhua River. To date, the accident affected six surrounding counties, and the pollution was intercepted approximately 13 days after the accident.
Figure 6 shows the standard false color composite images near the tailings pond before and after the accident. Gray traces of sewage leakage can be clearly seen from the images during the accident as Figure 6b, and the color of the tailings is bright white, indicating that the water content in the tailings pond was obviously reduced, while the image after accident treatment as Figure 6c shows that the tailings pond is blue, which is no different from the image before the accident as Figure 6a, indicating that the tailings pond had returned to normal.

3.2. Time Series NDVI Calculation Results

Based on Sentinel-2 L2A images provided by GEE from 1 March 2020 to 31 October 2020, the NDVI changes in the two forest farms closest to the tailings pond were calculated and compared with the NDVI of the same period during the previous year. The results are shown in Figure 7.
By comparing the average NDVI curves of forest farms around the tailings pond in 2019 and 2020, we can see that the NDVI curves in 2020 decreased to a certain extent compared with those in 2019, especially in the vegetation growing season from July to September, and the NDVI value of 2020 was generally slightly lower than that of 2019, which indicates that the accident affected the surrounding vegetation to a certain extent, but the change degree was not large, and it is expected to return to a normal level with time.

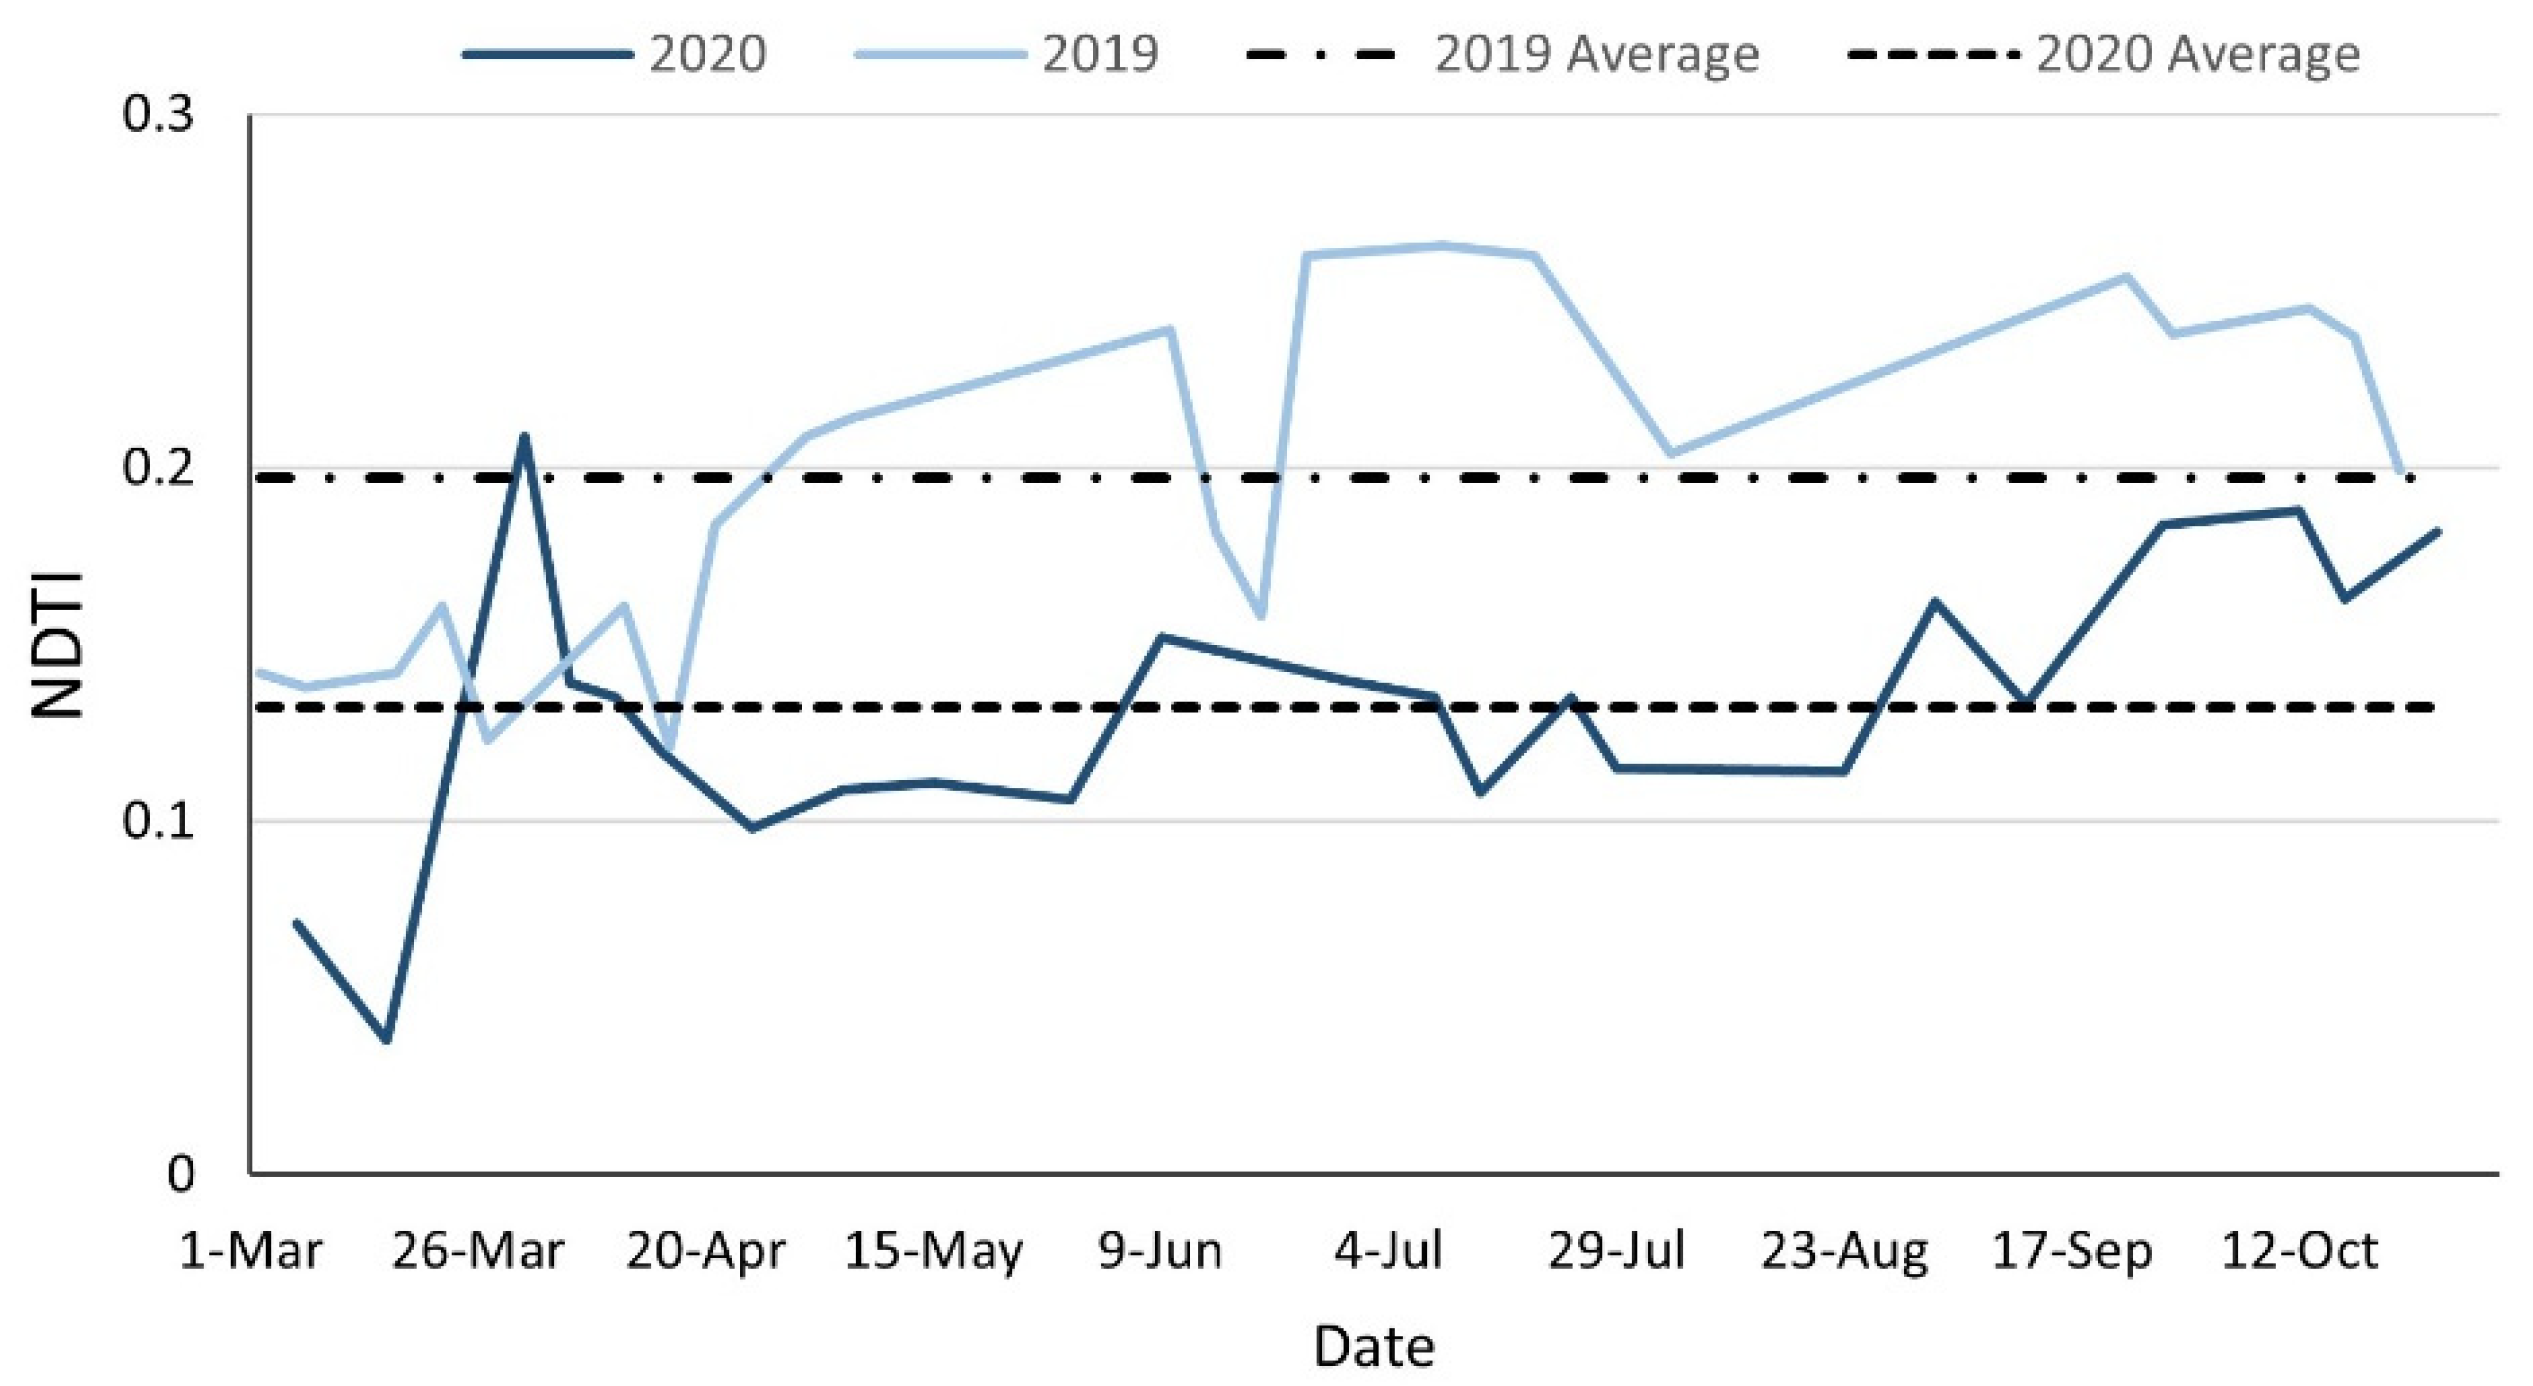
3.3. Time Series NDTI Calculation Results

Based on Sentinel-2 L2A images provided by GEE from 1 March 2019 to 31 October 2019 and 1 March 2020 to 31 October 2020, the water body part of the tailings pond was taken as the research area and the average NDTI of the research area was calculated. The results are shown in Figure 8.
By comparing the time series curves of NDTI in 2019 and 2020, it can be seen that the NDTI in the study area in 2020 was obviously lower than that in 2019, indicating that the water content of the tailings decreased after the accident. Especially after the accident on 28 March, the NDTI value increased obviously and then decreased gradually, which indicates that the loss of tailings solid waste, such as tailings sand, would make the water content of tailings ponds suddenly increase after the dam break accident, and then the water content of tailings decreased, which indicates that remedial measures, such as pumping water, were taken after the accident. After the accident treatment, the water content of the tailings pond did not rise to the same period of the year before, which may be due to the responsibility of protecting the safety of residents and their property around and downstream the mining area, and the mining area has not resumed production.

4. Discussion

Tailings ponds are a kind of hazard source with a high potential energy. Dam-break accidents often cause heavy casualties, significant property losses and difficulty in repairing environmental pollution due to many disaster-causing factors, complex mechanisms, strong suddenness and great destructive power [22]. According to the statistical data of 18,401 mines in the world, the failure rate of tailings dams is as high as 1.2%, which is two orders of magnitude higher than the failure rate of water storage dams of 0.01% [23]. Therefore, it is very important to monitor dam-break accidents in tailings ponds. The traditional monitoring method of tailings ponds is to obtain the geometric position, crack deformation and other information of tailings ponds through manual field investigations or traditional measuring instruments. This operation mode is inefficient, the data integrity is not strong, and the visualization of tailings pond analysis cannot be realized. Compared with traditional methods, remote sensing technology can quickly obtain information on a large scale to implement dynamic monitoring, and it is less affected by the ground, which can reduce the input of human and material resources. However, based on desktop remote sensing processing technology, it will require significant time at the stage of data acquisition and pre-processing, and the timeliness of accident monitoring is not strong. Accident emergency monitoring based on the GEE platform can solve the above problems.
There are also great advantages to monitoring accidents or disasters based on the GEE platform. First of all, GEE, as a cloud-based remote sensing big data processing platform, has massive data resources. The platform integrates widely used large-scale remote sensing image data of more than 40 years, as well as other statistical data [24]. A large number of online archive resources on the GEE platform can overcome the trouble that users spend much time collecting and storing data before processing and analyzing accidents, and users can easily select the right data for analysis according to the situation of accidents. At the same time, the GEE platform provides long time series remote sensing images, which can provide favorable conditions for monitoring environmental changes in a long time before and after the accident. At present, the total amount of data provided by GEE has exceeded 30 PB, and the data continues to increase at a rate of nearly 6000 scenes per day [25]. The dynamic update of GEE data can provide the latest data support for accident monitoring and improve the timeliness of analysis. In addition, compared with the traditional desktop remote sensing processing platform, the GEE cloud platform can avoid a large number of local computing processes and significantly reduce the cost of hardware investment. GEE is based on the cloud distributed computing cluster of the Google data center. On the premise of retaining the original information, the image is segmented into 256 × 256 pixel tiles for storage, and then distributed to tens of thousands of computers for parallel processing [26], which greatly improves the efficiency of massive data processing and visualization. Thus, the monitoring efficiency of the accident is greatly improved, the demand for accident emergency monitoring is met, and the monitoring and treatment of the accident provides a strong guarantee.
In this study, we used the Sentinel-2 for monitoring. Although the spatial resolution of the Sentinel-2 images reached 10 m, its temporal resolution is not high enough, and some images have a high cloud cover, with the result that the monitoring of tailings ponds cannot reach daily monitoring. In the future, other data sources can be introduced and combined with data with a higher spatial resolution and temporal resolution to monitor tailings ponds and their environmental pollution more accurately. In addition, other cloud computing platforms can be expanded, such as China’s PIE-Engine, which introduces Chinese-made satellite data such as GF and FY series, as well as data products such as climate, elevation, soil, land cover and population, and includes basic vector data such as global countries and administrative divisions at all levels in China, which can supplement and expand GEE monitoring [27]. This study considered monitoring during and after the accident, but in the future, we can make use of the GEE platform’s advantages in accident monitoring to carry out research on the pre-warning of tailings pond accidents. It is also important to promote the development of the whole process of tailings pond accident monitoring from pre-warning to in-process supervision and post-treatment, which will be of great significance to improve the comprehensive monitoring level of tailings pond accidents and secondary disasters, and to implement land spatial planning and natural disaster monitoring and early warning.

5. Conclusions

This paper based on the GEE platform combined with the Sentinel-2 images it provided, carried out emergency monitoring of the tailings pond leakage accident on 28 March using spectral reflectance and various indexes. The conclusions obtained are as follows:
(1)
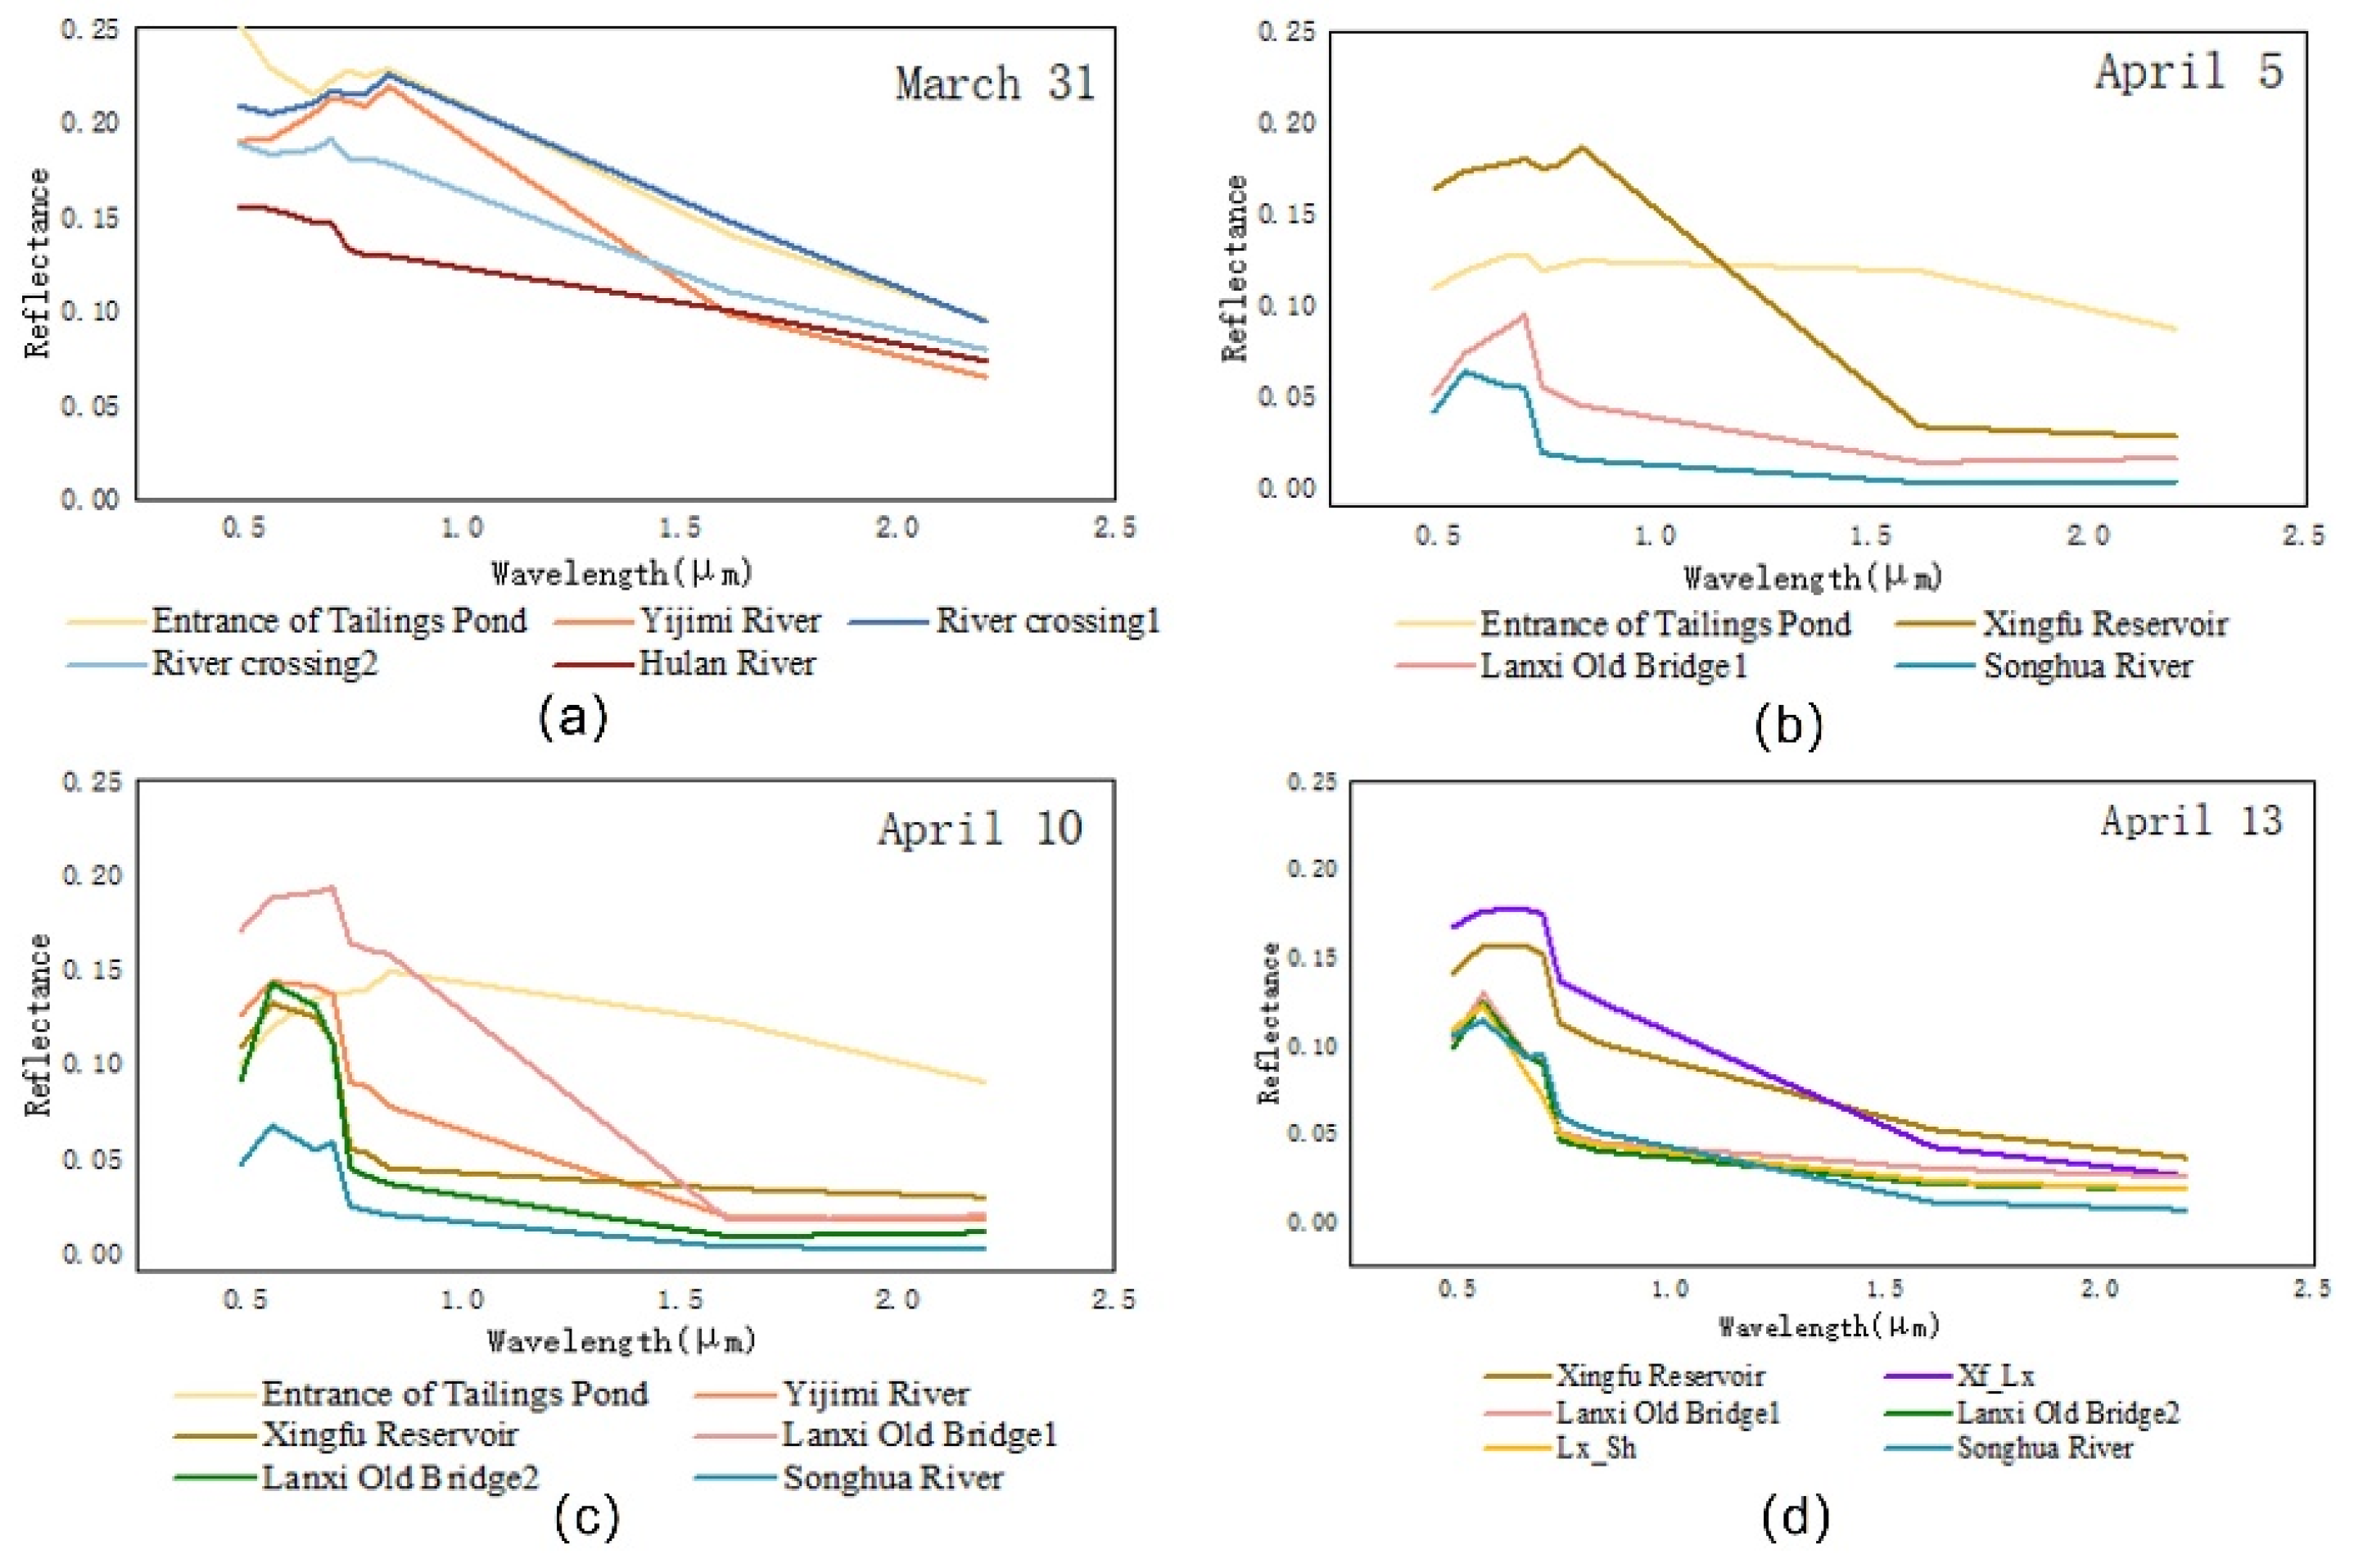
Through spectral changes in monitoring points in the downstream rivers of the tailings pond, it was found that: the spectra of rivers polluted by tailings sand are obviously different from those of unpolluted rivers, which are mainly manifested in the obvious increase in spectral reflectance in the blue, green or red band. Just after the accident, the spectral reflectance of the upstream monitoring points was the highest. With the passage of time, the spectral reflectance of the downstream monitoring points increased, and finally all returned to normal.
(2)
The pollution caused by the dam break of the tailings pond was quickly treated in a short time, and the river spectrum returned to normal on April 13. The pollution spread for approximately 300 km downstream of the Yijimi River and the Hulan River, and was finally intercepted at the Lanxi Old Bridge 67 km away from the Songhua River, so that more serious pollution accidents were avoided. This accident had a direct impact on the surrounding six counties, and after the accident was handled, the impact gradually disappeared.
(3)
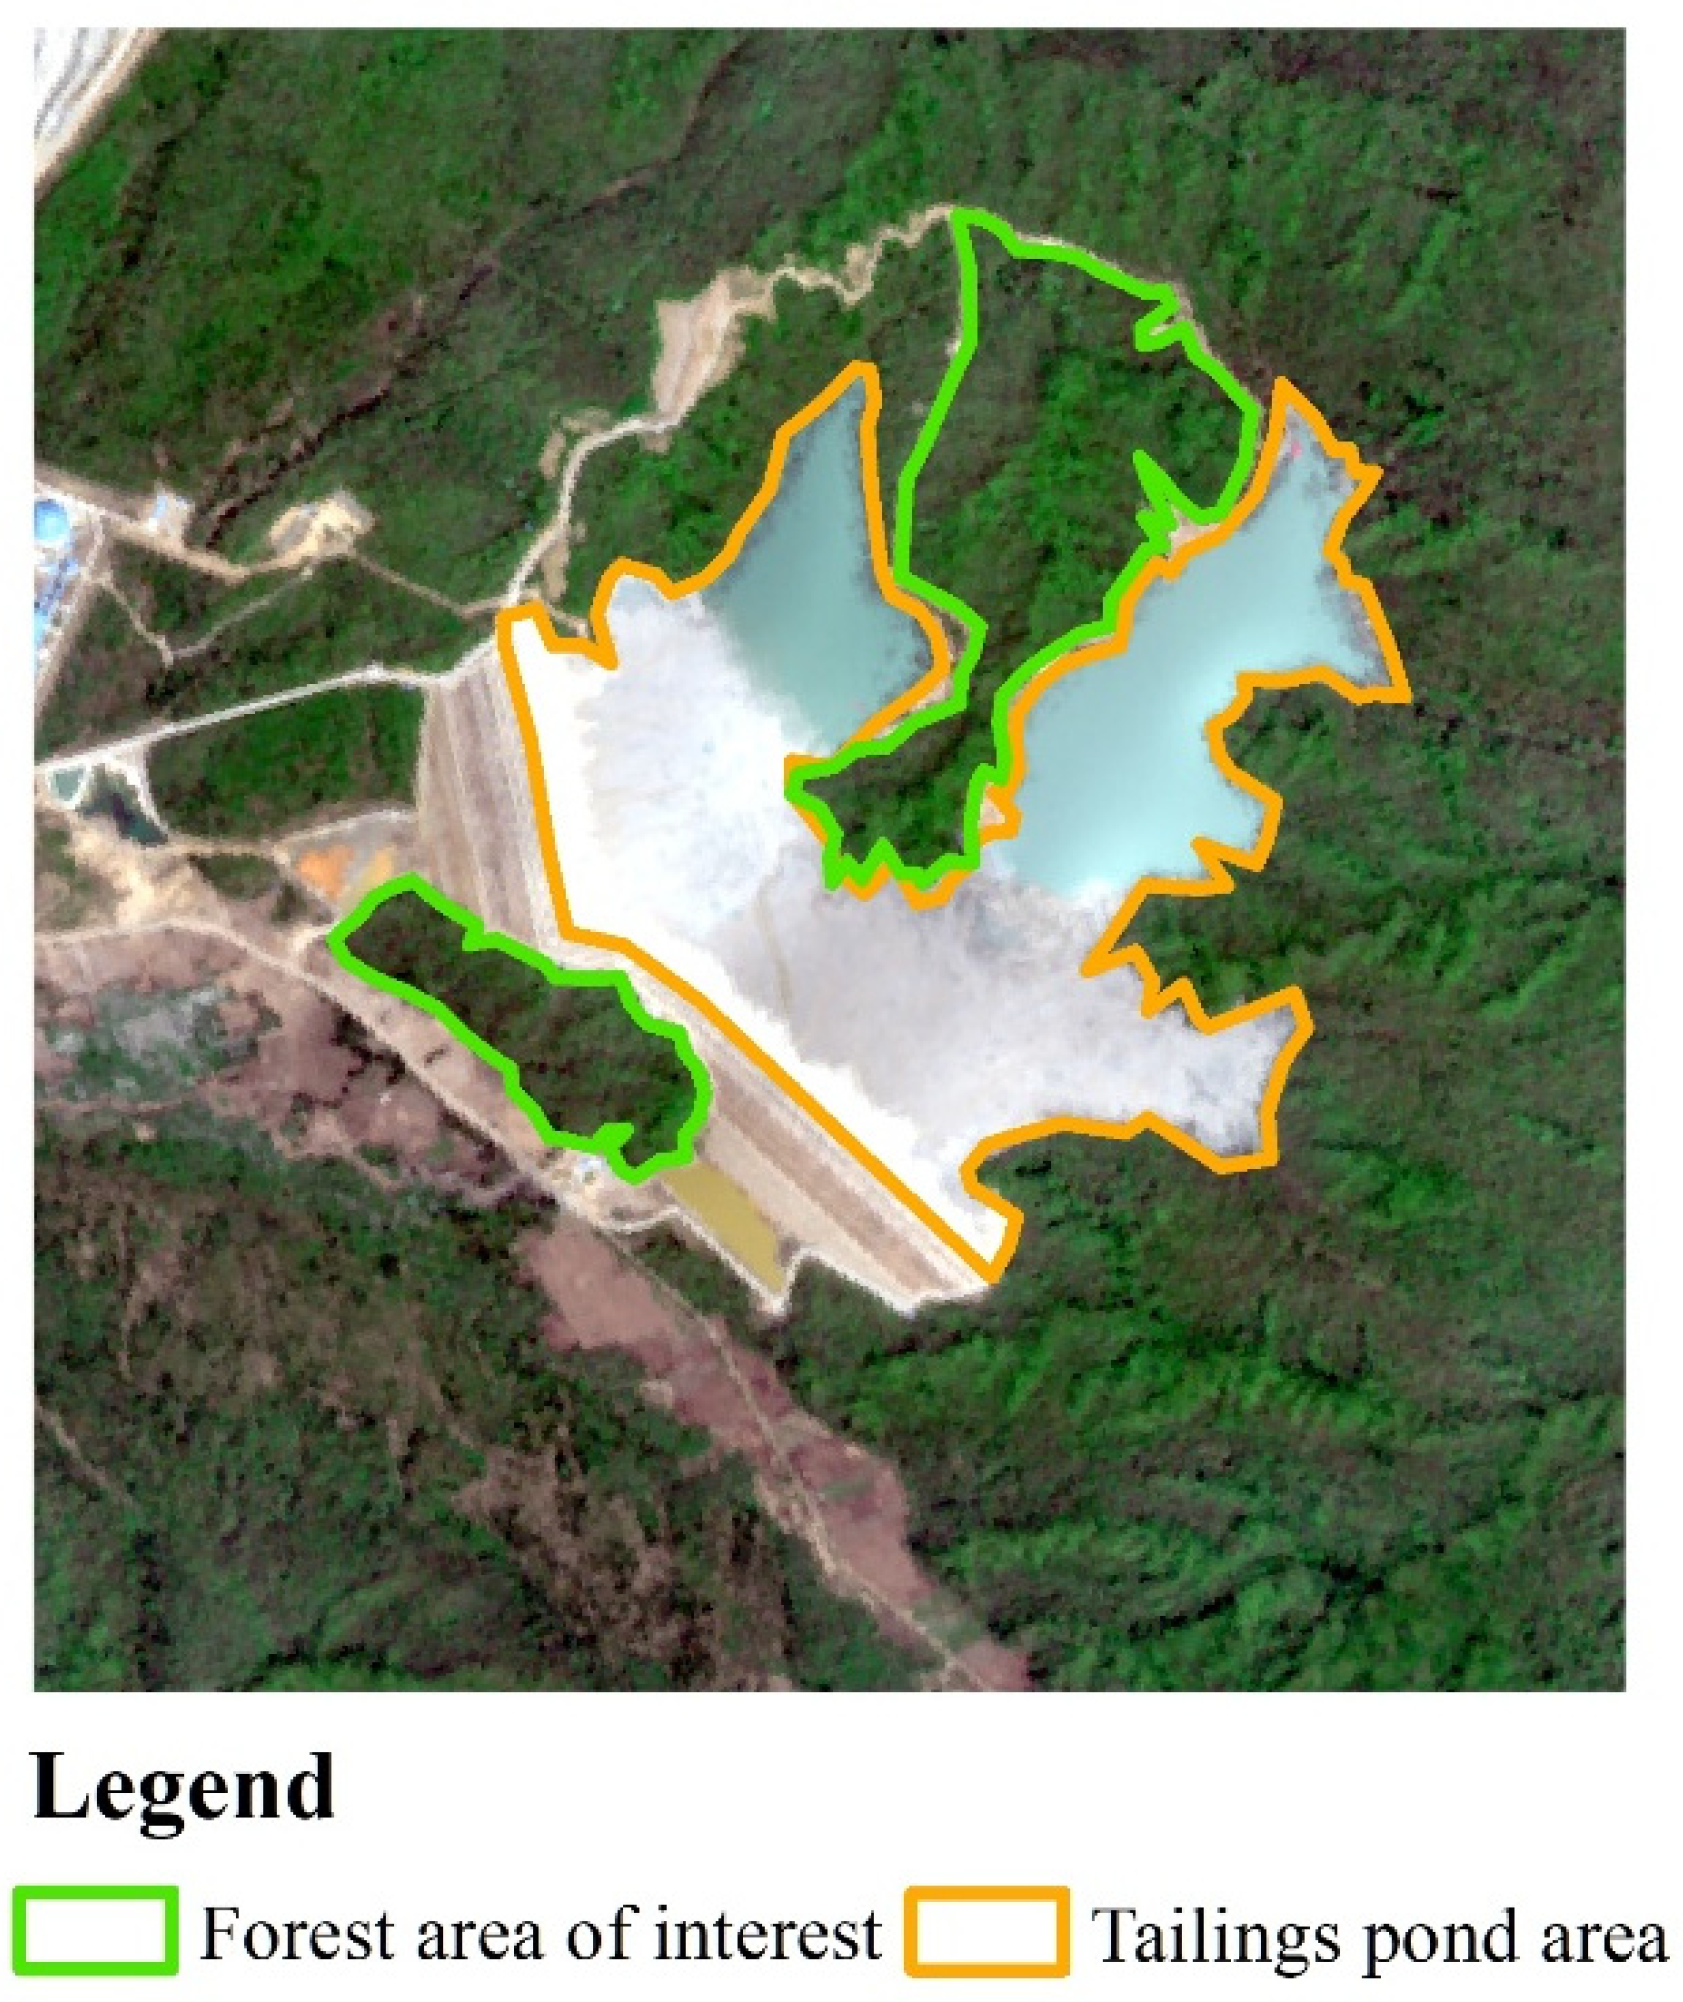
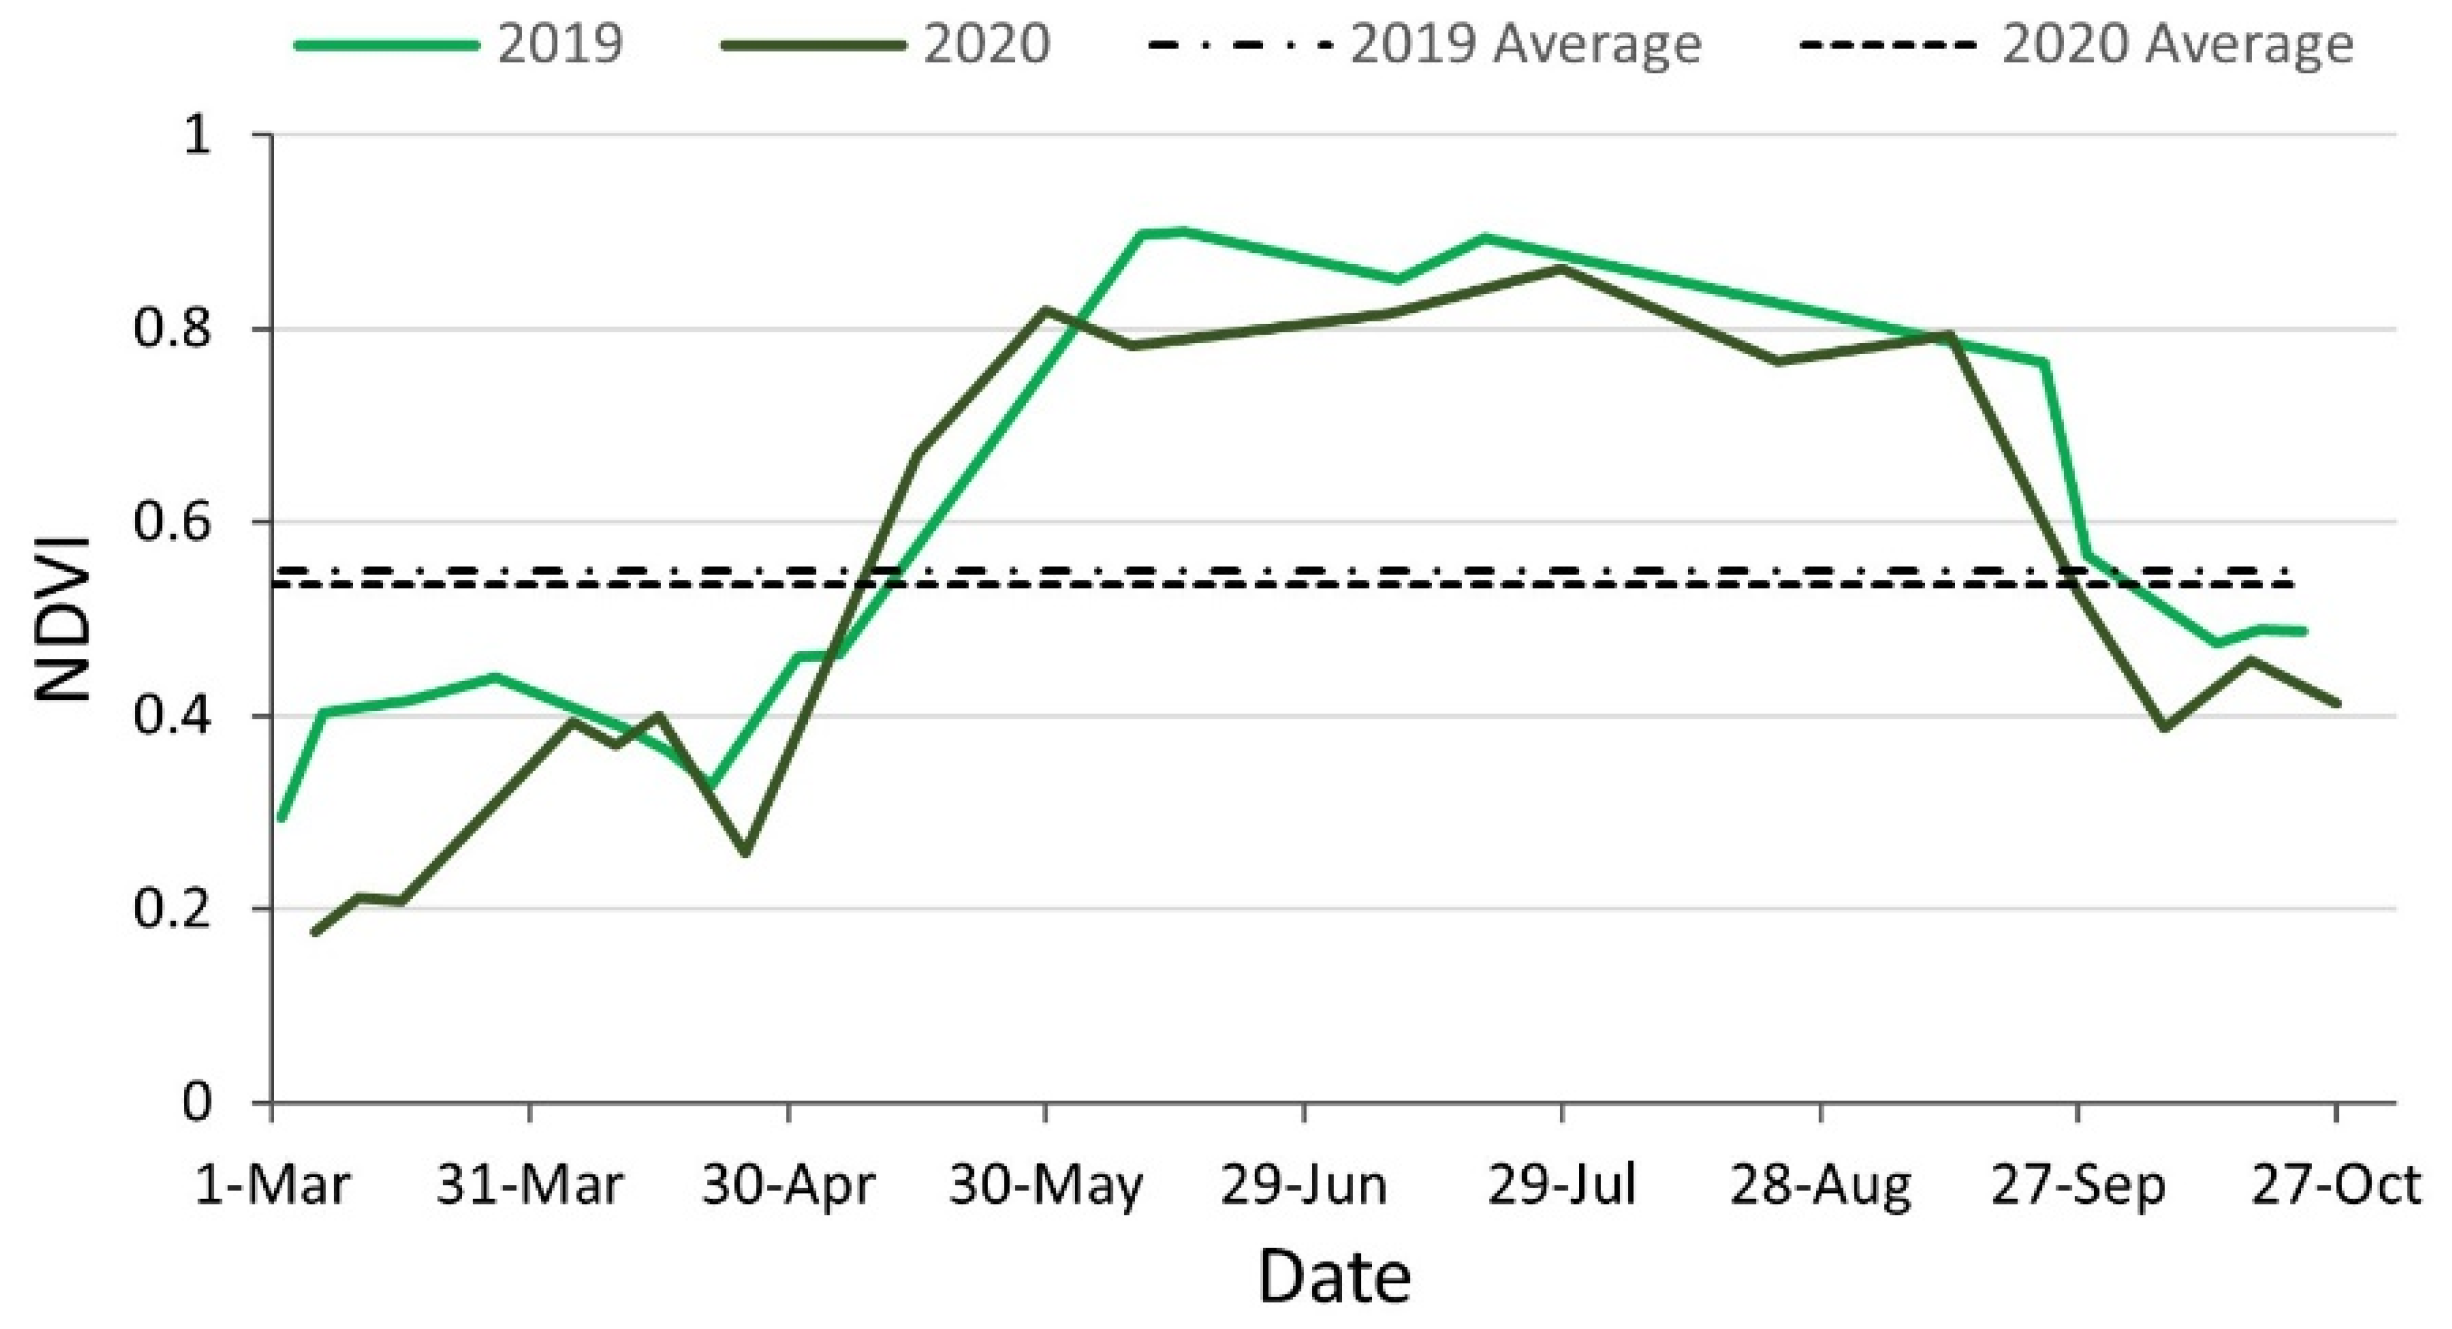
The dam break of the tailings pond had a certain degree of impact on the surrounding vegetation, resulting in a small decrease in NDVI, and after the dam break accident, the water content of the tailings ponds decreased, indicating that remedial measures such as pumping water were taken after the accident, and production was paused for a certain period of time after the accident.

Author Contributions

Conceptualization, H.Z. (Hengqian Zhao) and Z.Y.; methodology, H.Z. (Hengqian Zhao) and Z.Y.; software, Z.Y. and H.Z. (Hongwei Zhang); validation, J.M., Q.J. and S.M.; formal analysis, J.M.; investigation, H.Z. (Hengqian Zhao); resources, H.Z. (Hengqian Zhao); data curation, Z.Y. and Q.J.; writing—original draft preparation, H.Z. (Hongwei Zhang) and Z.Y.; writing—review and editing, H.Z. (Hengqian Zhao) and Z.Y.; visualization, Z.Y.; supervision, H.Z. (Hengqian Zhao); project administration, H.Z. (Hengqian Zhao); funding acquisition, H.Z. (Hengqian Zhao). All authors have read and agreed to the published version of the manuscript.

Funding

This research was funded by the State Key Laboratory of Coal Resources and Safe Mining Open Research Project (Grant No.SKLCRSM20KFA09), the Geological Research Project of the Hebei Bureau of Geology and Mineral Resources (Grant No.454-0601-YBN-DONH), the Yueqi Young Scholar of China University of Mining and Technology (Beijing) (Grant No.2020QN07), and the Fundamental Research Funds for the Central Universities (Grant No.2022JCCXDC01).

Data Availability Statement

Not applicable.

Conflicts of Interest

The authors declare no conflict of interest.

References

  1. Zhang, J.; Liu, J. The statistics and causes of dam break and leakage in chinese tailings pond. China Molybdenum Ind. 2019, 43, 10–14. [Google Scholar] [CrossRef]
  2. HJ 740-2015; Technical Guidelines for Environmental Risk Assessment of Tailings Ponds (Trial). Ministry of Environment Protection: Beijing, China, 2015.
  3. Wo, T.S. Tailings Pond Handbook; Metallurgical Industry Press: Beijing, China, 2013. [Google Scholar]
  4. Ding, L.; Fang, X.; Cheng, S.; Zeng, K.; Liu, C. Study of Tailings Ponds’ Environmental Impact Region in Chengui Town, Daye based on Watershed Analysis. In Advanced Materials Research, Proceedings of the 3rd International Conference on Energy, Environment and Sustainable Development (EESD 2013), Shanghai, China, 12–13 November 2013; Trans Tech Publications Ltd.: Freienbach, Switzerland, 2014; pp. 2772–2776. [Google Scholar]
  5. Wang, Y.B.; Xue, L.Y.; Liu, J.; Wang, J.X. Measures and application of environmental emergency treatment for sudden water polution incidents in tailing pond. Environ. Pollut. Prev. 2022, 44, 541–545. [Google Scholar] [CrossRef]
  6. Jha, A.; Tukkaraja, P. Monitoring and assessment of underground climatic conditions using sensors and GIS tools. Int. J. Min. Sci. Technol. 2020, 30, 495–499. [Google Scholar] [CrossRef]
  7. Xiao, R.; Shen, W.; Fu, Z.; Shi, Y.; Xiong, W.; Cao, F. The application of remote sensing in the environmental risk monitoring of tailings pond—A case study in Zhangjiakou area of China. In Proceedings of the Conference on Earth Resources and Environmental Remote Sensing/GIS Applications III, Edinburgh, UK, 24–26 September 2012. [Google Scholar]
  8. Zhang, C.; Xing, J.; Li, J.; Sang, X. Spatial range recognition of tailings Pond based on U-NET network and GF-6 image. Remote Sens. Nat. Resour. 2021, 33, 252–257. [Google Scholar] [CrossRef]
  9. Song, S.; Chu, J.; Zhang, H. Study on Environmental Risk Assessment and Control Countermeasures of Tailings pond in a Mountainous Area of North China. In Proceedings of the 6th International Conference on Energy, Environment and Materials Science (EEMS), Hulun Buir, China, 28–30 August 2020. [Google Scholar]
  10. Zhao, H.; Zhao, X.; Zhang, L.; Jia, L.; Jiang, J.; Wang, L.; Yin, Z.; Zhu, X. A mineral feature extraction method based on virtual band simulation. Remote Sens. Lett. 2017, 8, 547–556. [Google Scholar] [CrossRef]
  11. Huang, H.B.; Chen, Y.L.; Clinton, N.; Wang, J.; Wang, X.Y.; Liu, C.X.; Gong, P.; Yang, J.; Bai, Y.Q.; Zheng, Y.M.; et al. Mapping major land cover dynamics in Beijing using all Landsat images in Google Earth Engine. Remote Sens. Environ. 2017, 202, 166–176. [Google Scholar] [CrossRef]
  12. Lobell, D.; Thau, D.; Seifert, C.; Engle, E.; Littl, B. A scalable satellite-based crop yield mapper. Remote Sens. Environ. 2015, 164, 324–333. [Google Scholar] [CrossRef]
  13. Hao., B.; Han, X.; Ma, M.; Liu, Y.; Li, S. Application of Google Earth engine in Earth Science and Environmental Science. Remote Sens. Technol. Appl. 2018, 33, 600–611. [Google Scholar] [CrossRef]
  14. He, T.; Xiao, W.; Zhao, Y.L.; Deng, X.; Hu, Z. Identification of waterlogging in Eastern China induced by mining subsidence: A case study of Google Earth Engine time-series analysis applied to the Huainan coal field. Remote Sens. Environ. 2020, 242, 111742. [Google Scholar] [CrossRef]
  15. Sun, G.; Chen, F.; Wang, N. Landslide change and its influence factors in central Nepal from 2001 to 2017. J. Univ. Chin. Acad. Sci. 2020, 37, 308–316. [Google Scholar] [CrossRef]
  16. Ma, H.; Zhang, Y.; Li, J. Analysis on research status about physical model tests of tailings pond in China. J. Saf. Sci. Technol. 2020, 16, 61–66. [Google Scholar] [CrossRef]
  17. Jensen, J.R. Remote Sensing of the Environment: An Earth Resource Perspective, 2nd ed.; Pearson Prentice Hall: Hoboken, NJ, USA, 2007. [Google Scholar]
  18. Wang, C.-J.; Zhou, B.; Zheng, Y.-Y.; Yu, Z.-F. Navigation Observation of Reflectance Spectrum of Water Surface in Inland Rivers. Spectrosc. Spect. Anal. 2022, 42, 878–883. [Google Scholar] [CrossRef]
  19. Huang, S.; Tang, L.; Hupy, J.P.; Wang, Y.; Shao, G. Commentary review on the use of normalized difference vegetation index (NDVI) in the era of popular remote sensing. J. For. Res. 2021, 32, 2719. [Google Scholar] [CrossRef]
  20. Yu, M.L.; Liu, S.J.; Song, L.; Huang, J.W.; Li, T.Z.; Wang, D. Spectral Characteristics and Remote Sensing Model of Tailings with Different Water Contents. Spectrosc. Spect. Anal. 2019, 39, 3096–3101. [Google Scholar] [CrossRef]
  21. Chen, S.; Chang, S.; Huang, D. Development and application of emergency treatment process for polluted river water caused by leakage of tailing pond of Luming mining in Heilongjiang Province on March 28. Chin. J. Environ. Eng. 2021, 15, 2895–2903. [Google Scholar]
  22. Kossoff, D.; Dubbin, W.E.; Alfredsson, M.; Edwards, S.J.; Macklin, M.G.; Hudson-Edwards, K.A. Mine tailings dams: Characteristics, failure, environmental impacts, and remediation. Appl. Geochem. 2014, 51, 229–245. [Google Scholar] [CrossRef] [Green Version]
  23. Penman, A. Tailings Dams: Risk of Dangerous Occurrences. In Geoenvironmental Engineering: Geoenvironmental Impact Management: Proceedings of the Third Conference Organized by the British Geotechnical Association and Cardiff School of Engineering, Cardiff University, Edinburgh, UK, 17–19 September 2001; Thomas Telford Publishing: London, UK, 2001. [Google Scholar]
  24. Wang, X.; Tian, J.; Li, X.; Wang, L.; Gong, H.; Chen, B.; Li, X.; Guo, J. Benefits of Google Earth Engine in remote sensing. J. Remote Sens. 2022, 26, 299–309. [Google Scholar]
  25. Wang, L.; Xu, M.; Liu, Y.; Liu, H.; Beck, R.; Reif, M.; Emery, E.; Young, J.; Wu, Q. Mapping Freshwater Chlorophyll-a Concentrations at a Regional Scale Integrating Multi-Sensor Satellite Observations with Google Earth Engine. Remote Sens. 2020, 12, 3278. [Google Scholar] [CrossRef]
  26. Gorelick, N.; Hancher, M.; Dixon, M.; Ilyushchenko, S.; Thau, D.; Moore, R. Google Earth Engine: Planetary-scale geospatial analysis for everyone. Remote Sens. Environ. 2017, 202, 18–27. [Google Scholar] [CrossRef]
  27. Cheng, W.; Qian, X.; Li, S.; Ma, H.; Liu, D.; Liu, F.; Liang, J.; Ju, H. Research and application of PIE-Engine Studio for spatiotemporal remote sensing cloud computing platform. J. Remote Sens. 2022, 26, 347–355. [Google Scholar]
Figure 1. Map of (a) China showing (b) the counties and rivers around the leakage tailings pond and (c) the true color image of the leakage tailings pond.
Sustainability 14 08558 g001
Figure 2. Distribution map of pollution monitoring points.
Sustainability 14 08558 g002
Figure 3. Forest area of interest and tailings pond area.
Sustainability 14 08558 g003
Figure 4. Average spectral curve of the pollution monitoring points on (a) 31 March 2020, (b) 5 April 2020, (c) 10 April 2020, and (d) 13 April 2020.
Sustainability 14 08558 g004
Figure 5. (a) Map of source and end point of polluted river course and polluted counties; (b) flow direction of tailings pond dam-break sewage map.
Sustainability 14 08558 g005
Figure 6. Standard false color composite image map around tailings pond before and after accident: (a) before the accident; (b) during the accident; (c) after the accident.
Sustainability 14 08558 g006
Figure 7. NDVI changes in the forest area of interest in 2019 and 2020.
Sustainability 14 08558 g007
Figure 8. NDTI changes in the tailings pond area in 2019 and 2020.
Sustainability 14 08558 g008
Table 1. Sentinel-2 band information.
NameDescriptionResolutionWavelength
B1Aerosols60 m443.9 nm (S2A)/442.3 nm (S2B)
B2Blue10 m496.6 nm (S2A)/492.1 nm (S2B)
B3Green10 m560 nm (S2A)/559 nm (S2B)
B4Red10 m664.5 nm (S2A)/665 nm (S2B)
B5Red Edge120 m703.9 nm (S2A)/703.8 nm (S2B)
B6Red Edge220 m740.2 nm (S2A)/739.1 nm (S2B)
B7Red Edge320 m782.5 nm (S2A)/779.7 nm (S2B)
B8NIR10 m835.1 nm (S2A)/833 nm (S2B)
B8ARed Edge420 m864.8 nm (S2A)/864 nm (S2B)
B9Water Vapor60 m945 nm (S2A)/943.2 nm (S2B)
B10Cirrus60 m1373.5 nm (S2A)/1376.9 nm (S2B)
B11SWIR 120 m1613.7 nm (S2A)/1610.4 nm (S2B)
B12SWIR 220 m2202.4 nm (S2A)/2185.7 nm (S2B)
Publisher’s Note: MDPI stays neutral with regard to jurisdictional claims in published maps and institutional affiliations.

