
Temporal and Spatial Changes in Vegetation Ecological Quality and Driving Mechanism in Kökyar Project Area from 2000 to 2021

 , ,
, ,
Abstract
:1. Introduction
2. Study Area and Data
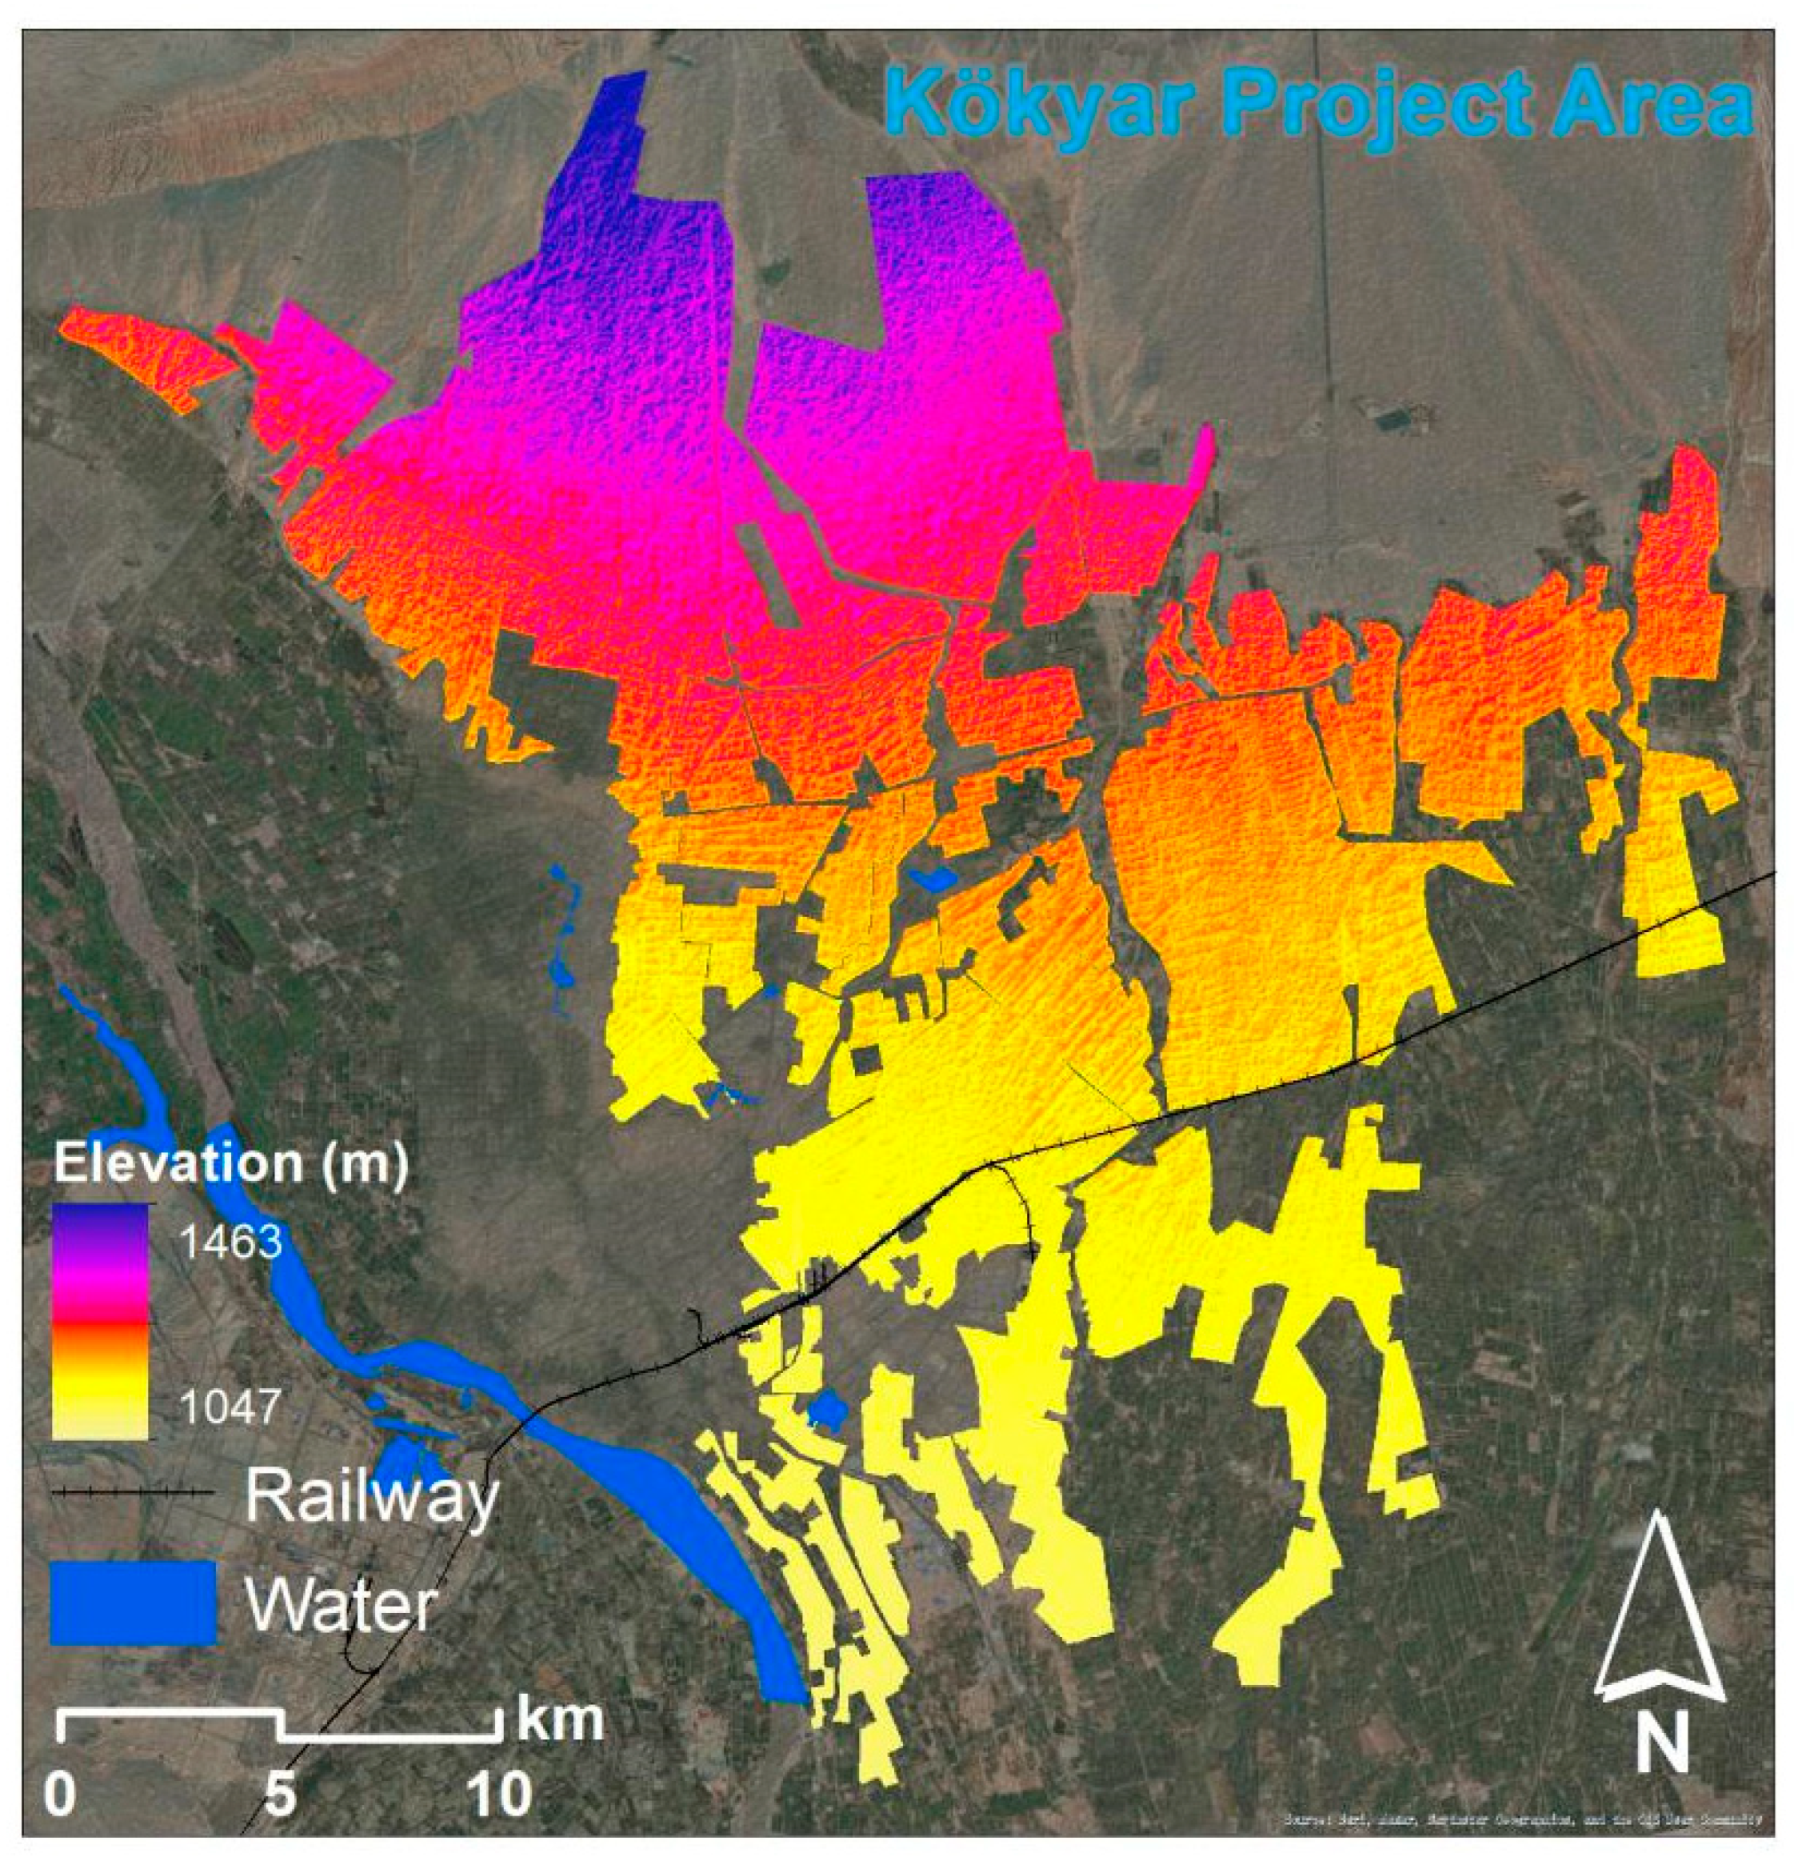
2.1. Study Area
2.2. Data
3. Methods
3.1. Estimation of Net Primary Productivity
3.2. Estimation of Fractional Vegetation Cover
3.3. Estimation of VEQI
3.4. Estimation of RSEI
3.5. Land Use and Land Cover Classification
3.6. Driving Analysis
3.6.1. Theil–Sen Median
3.6.2. TSS-RESTREND
4. Results
4.1. Temporal and Spatial Changes
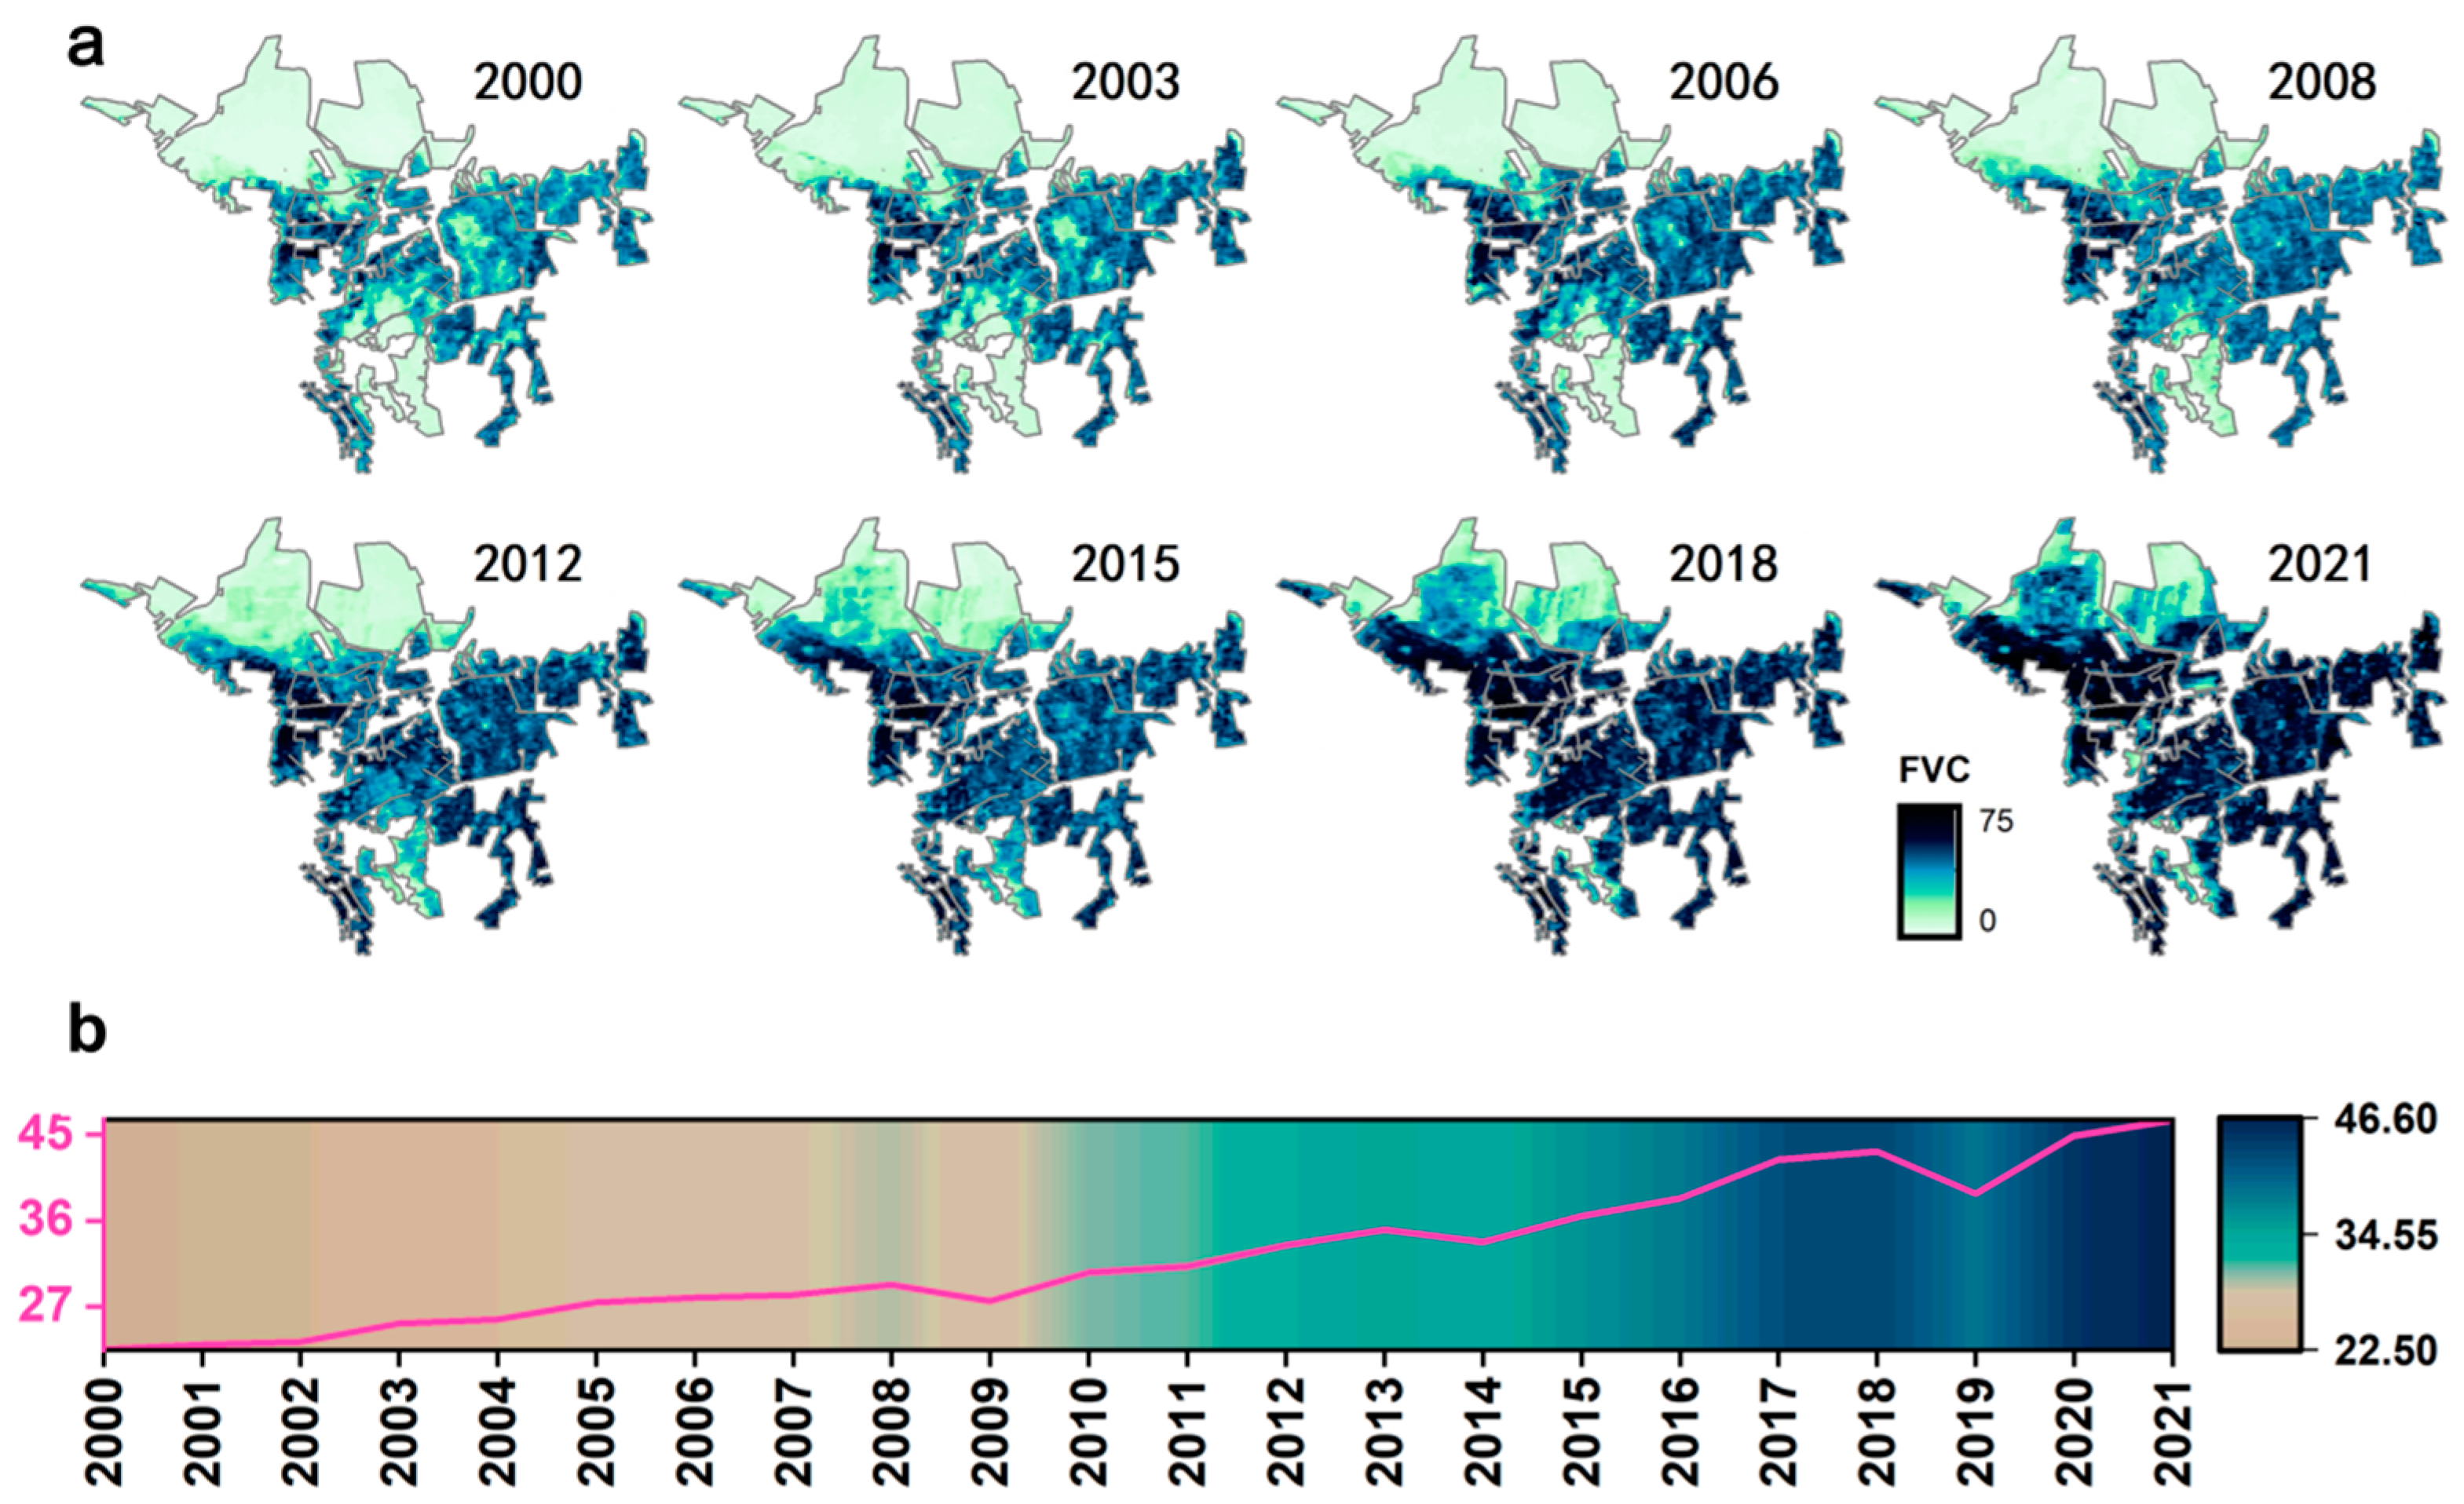
4.1.1. FVC
4.1.2. NPP
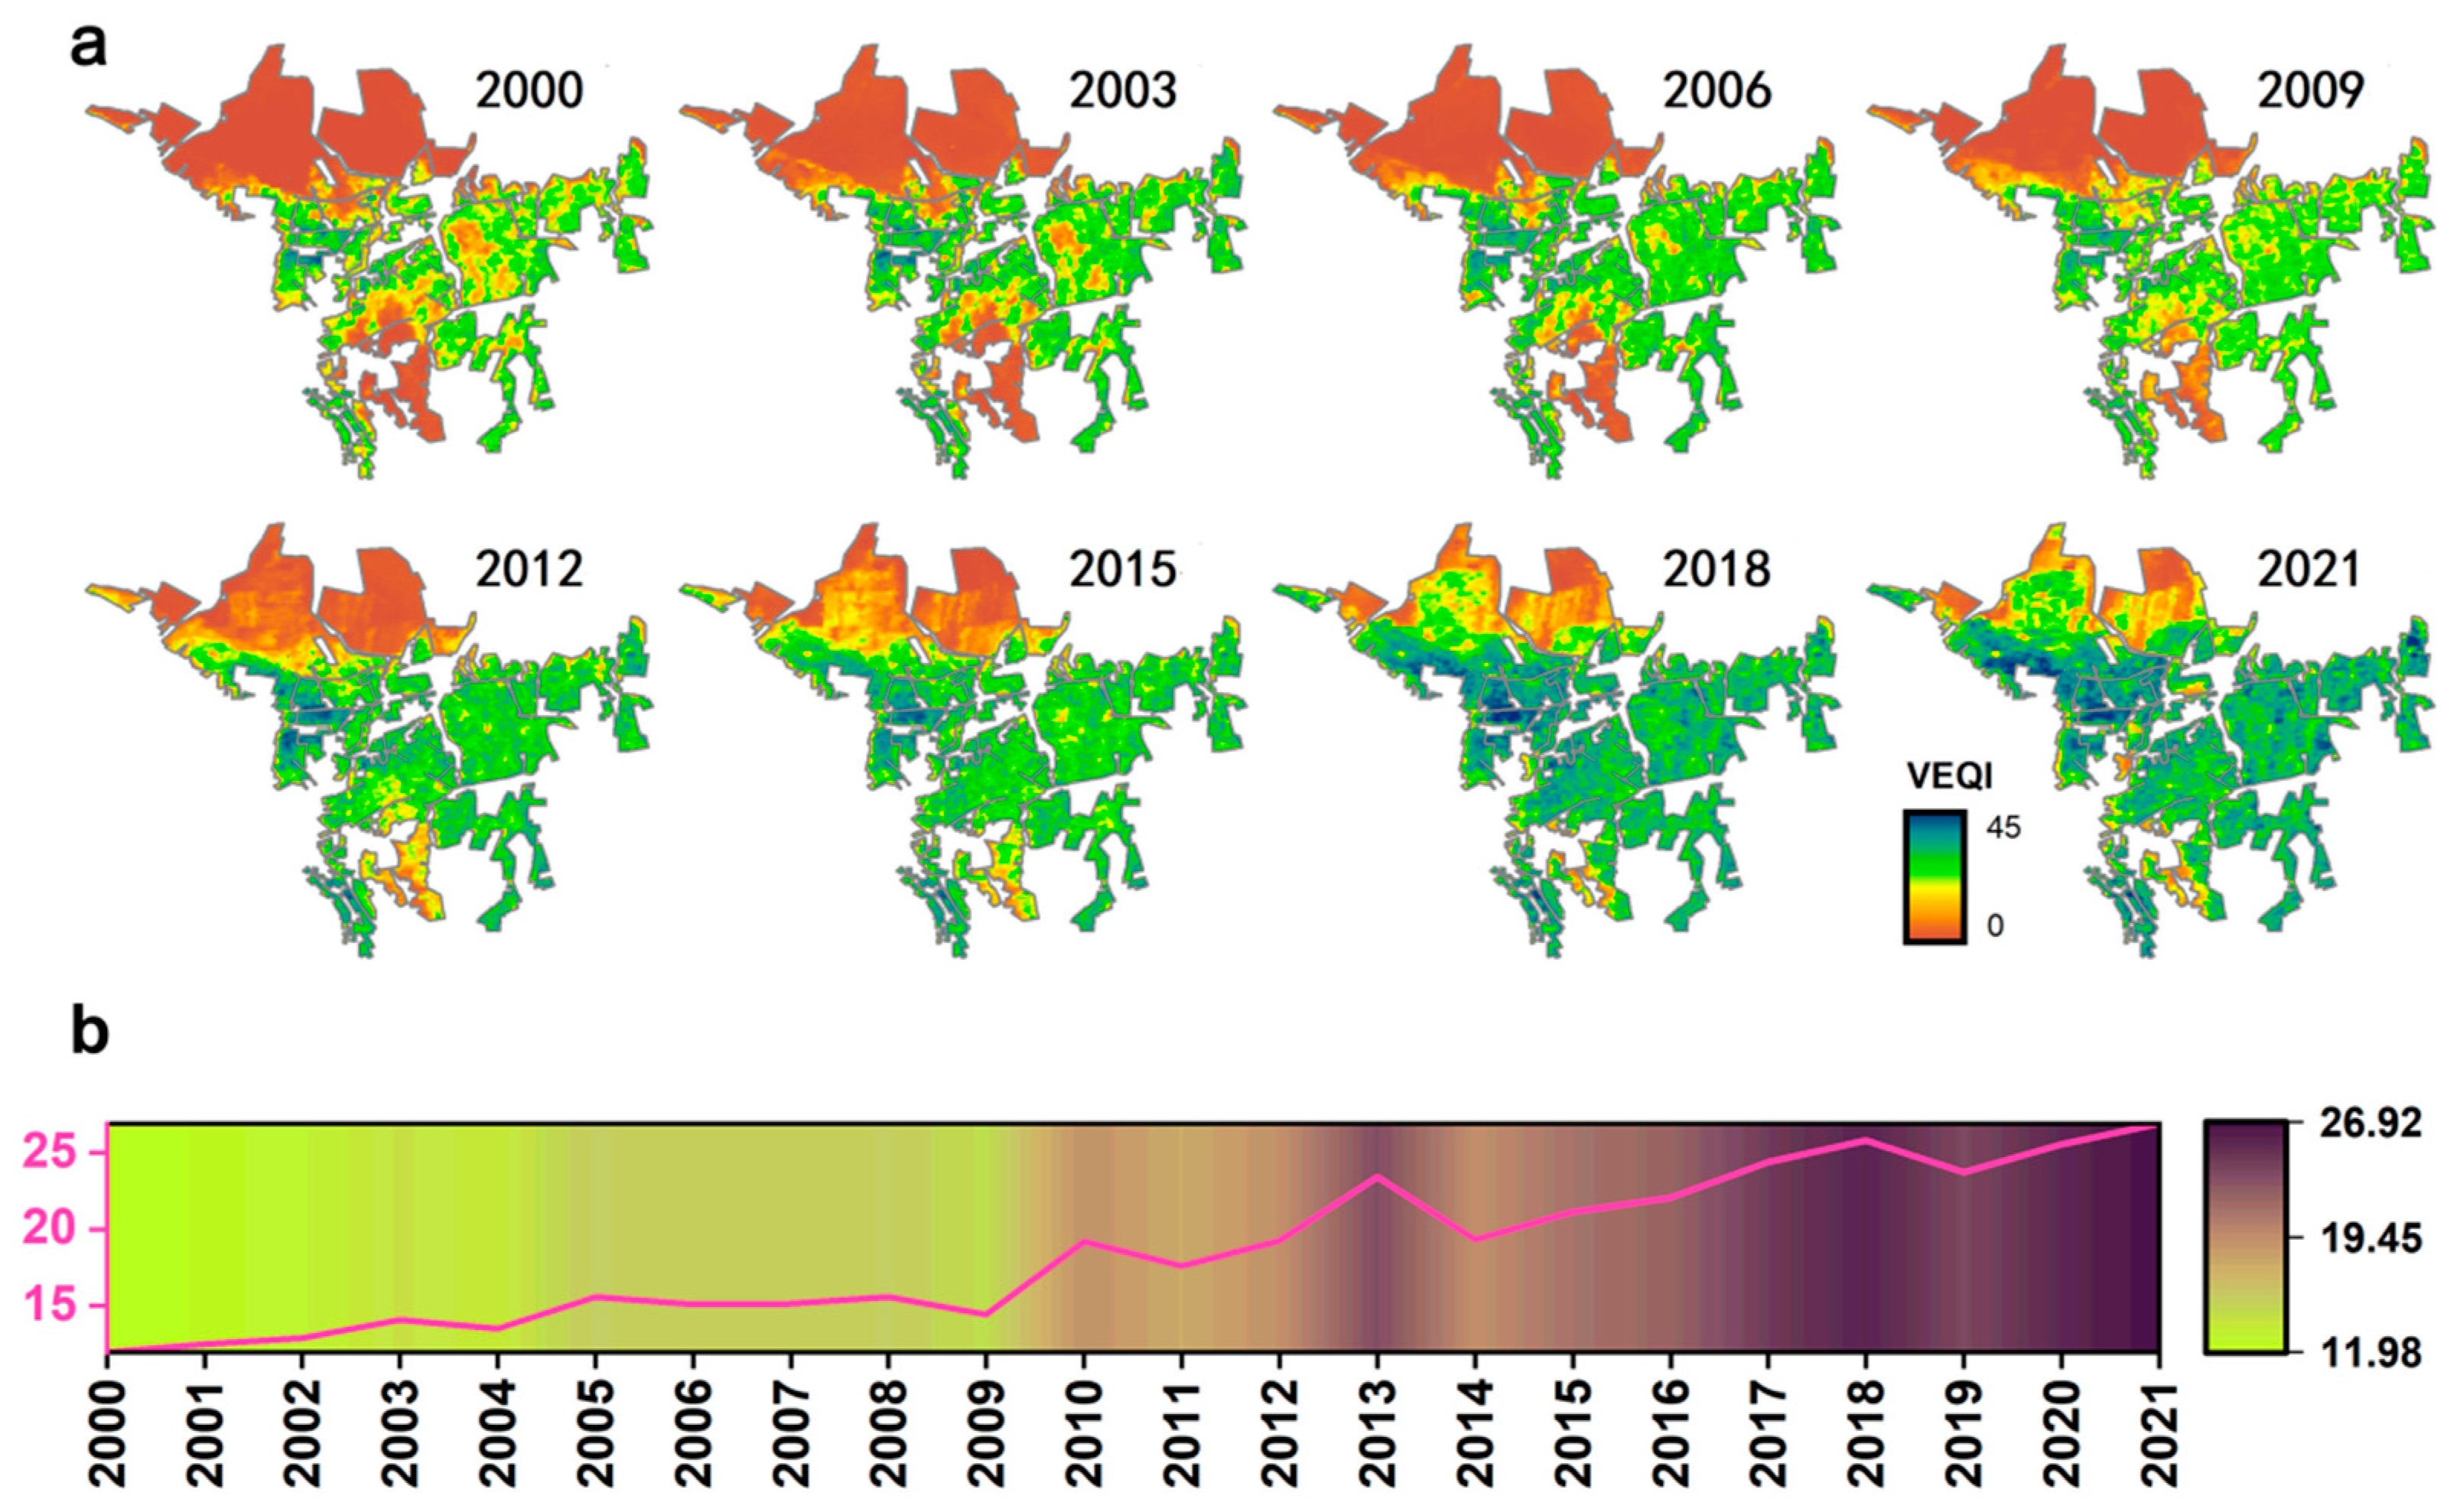
4.1.3. VEQI
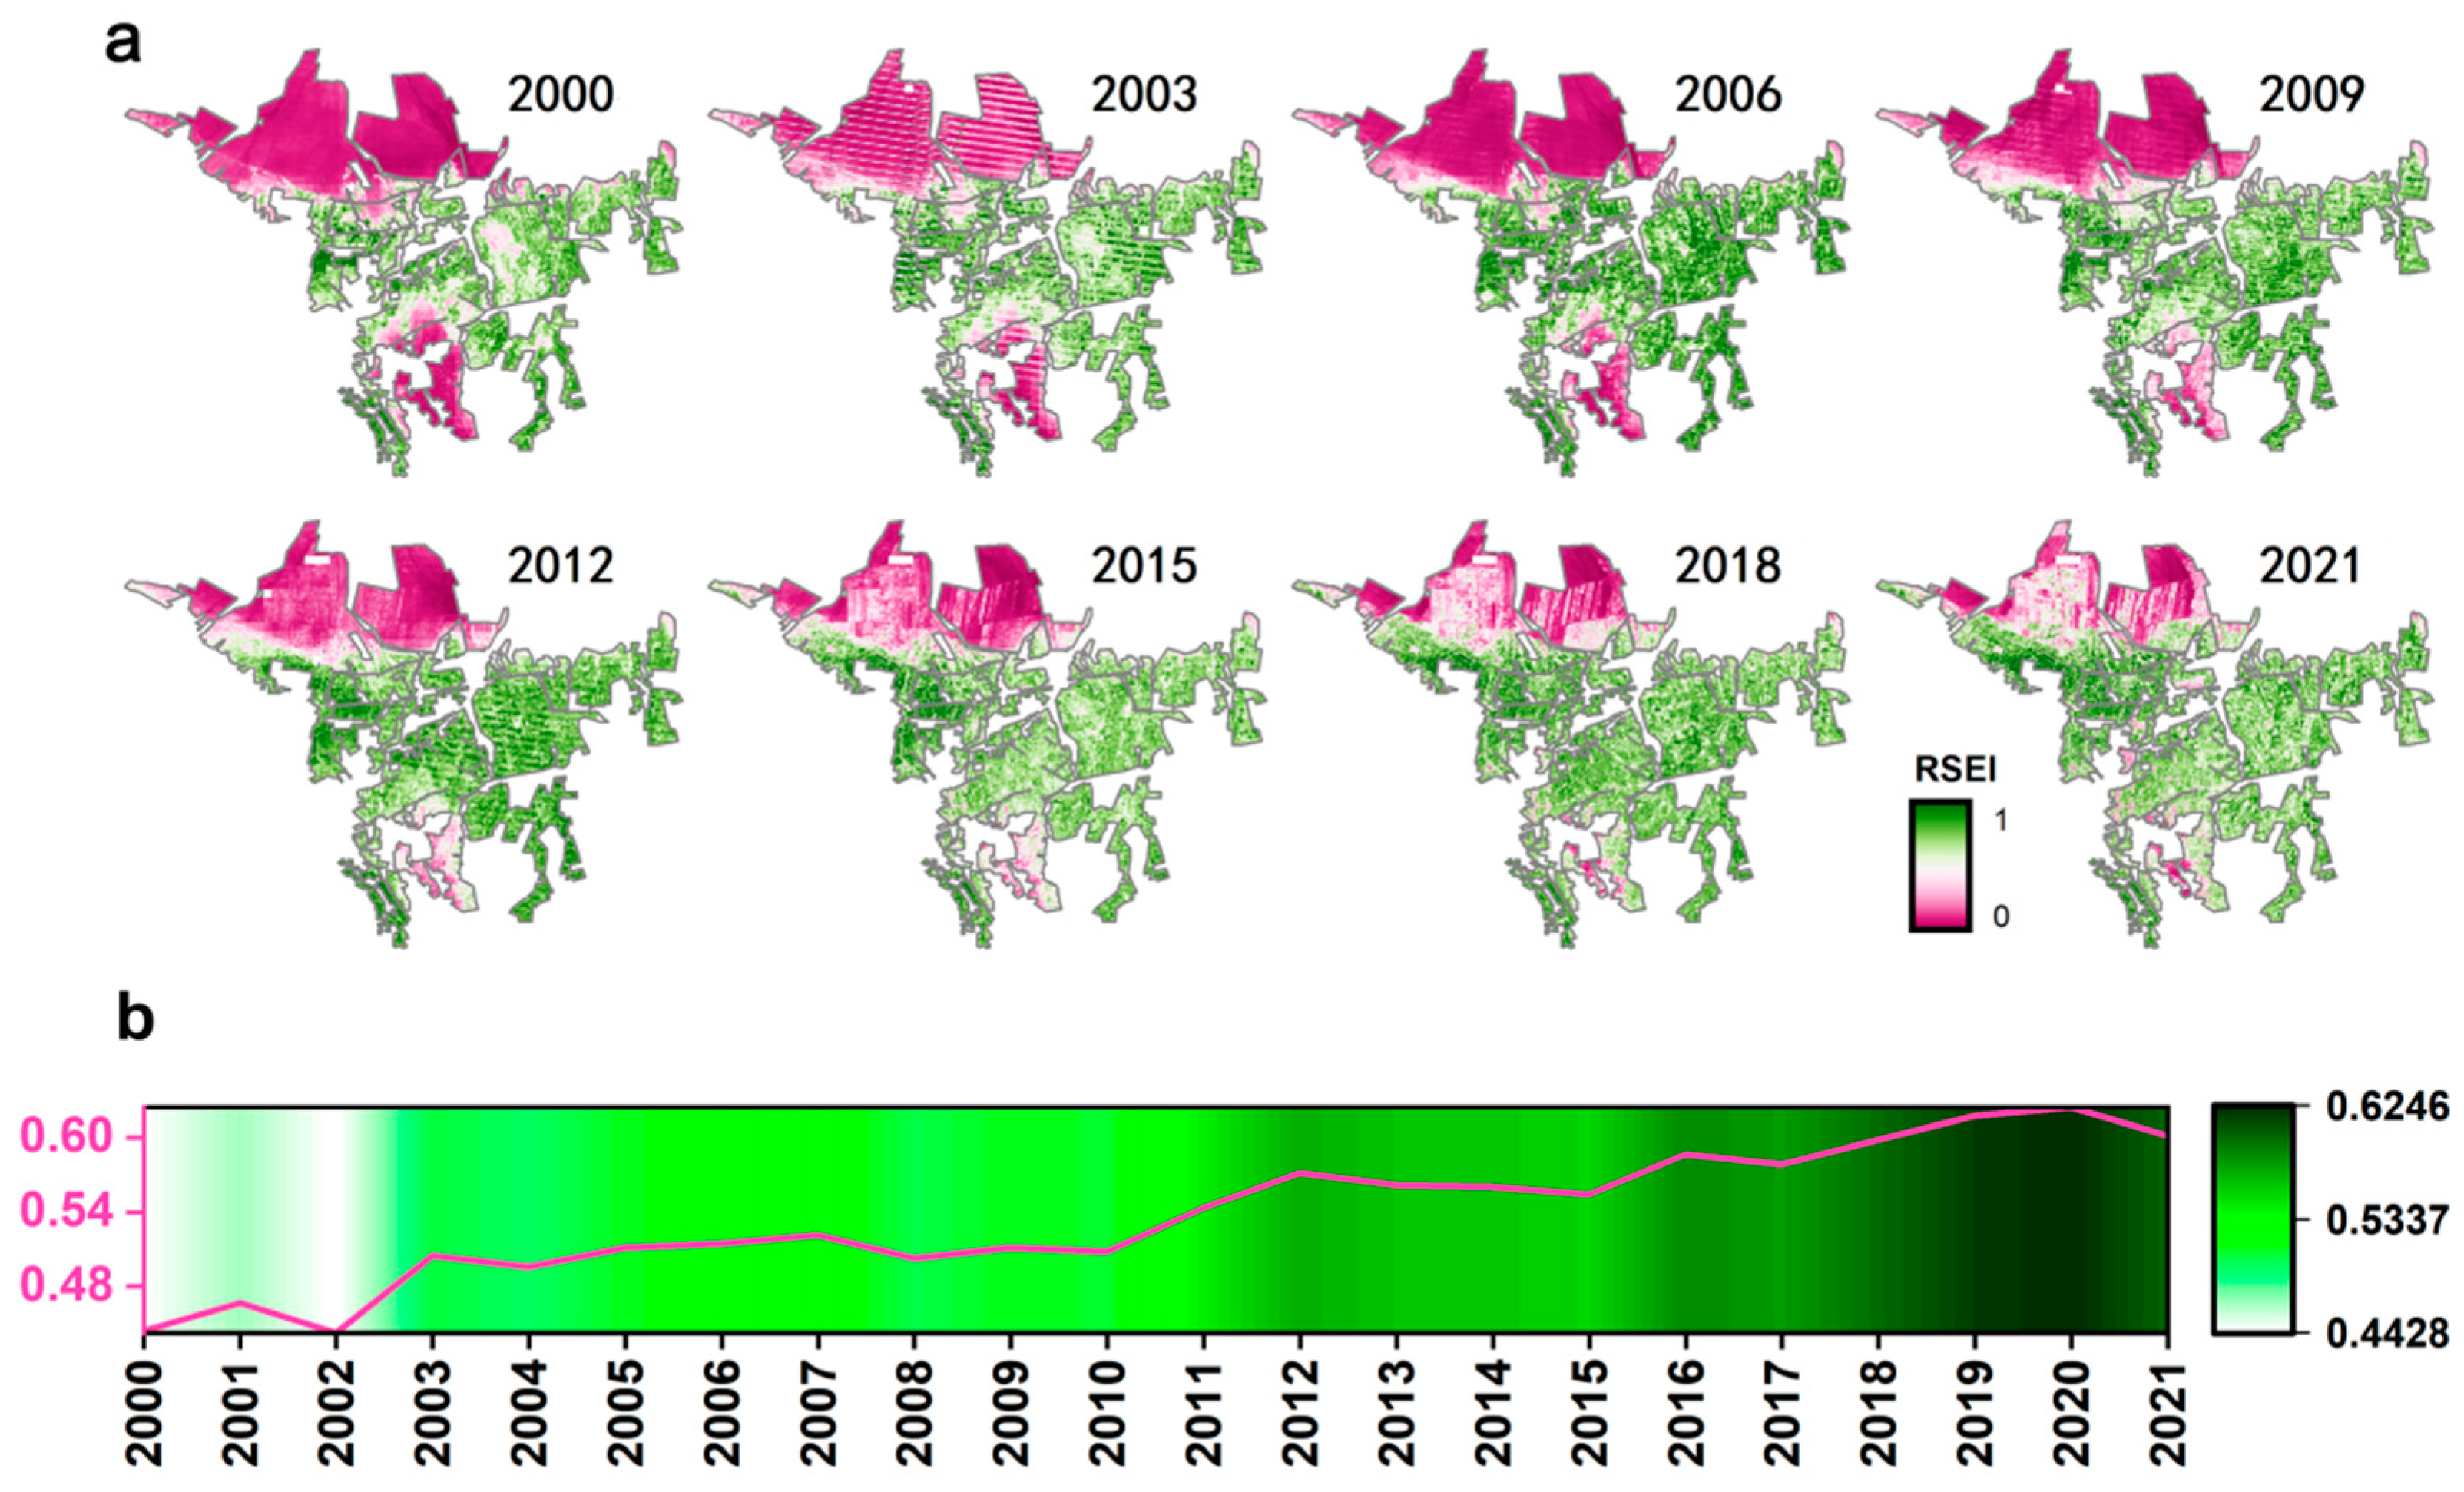
4.1.4. Remote-Sensing Ecological Index
4.2. Driving Analysis
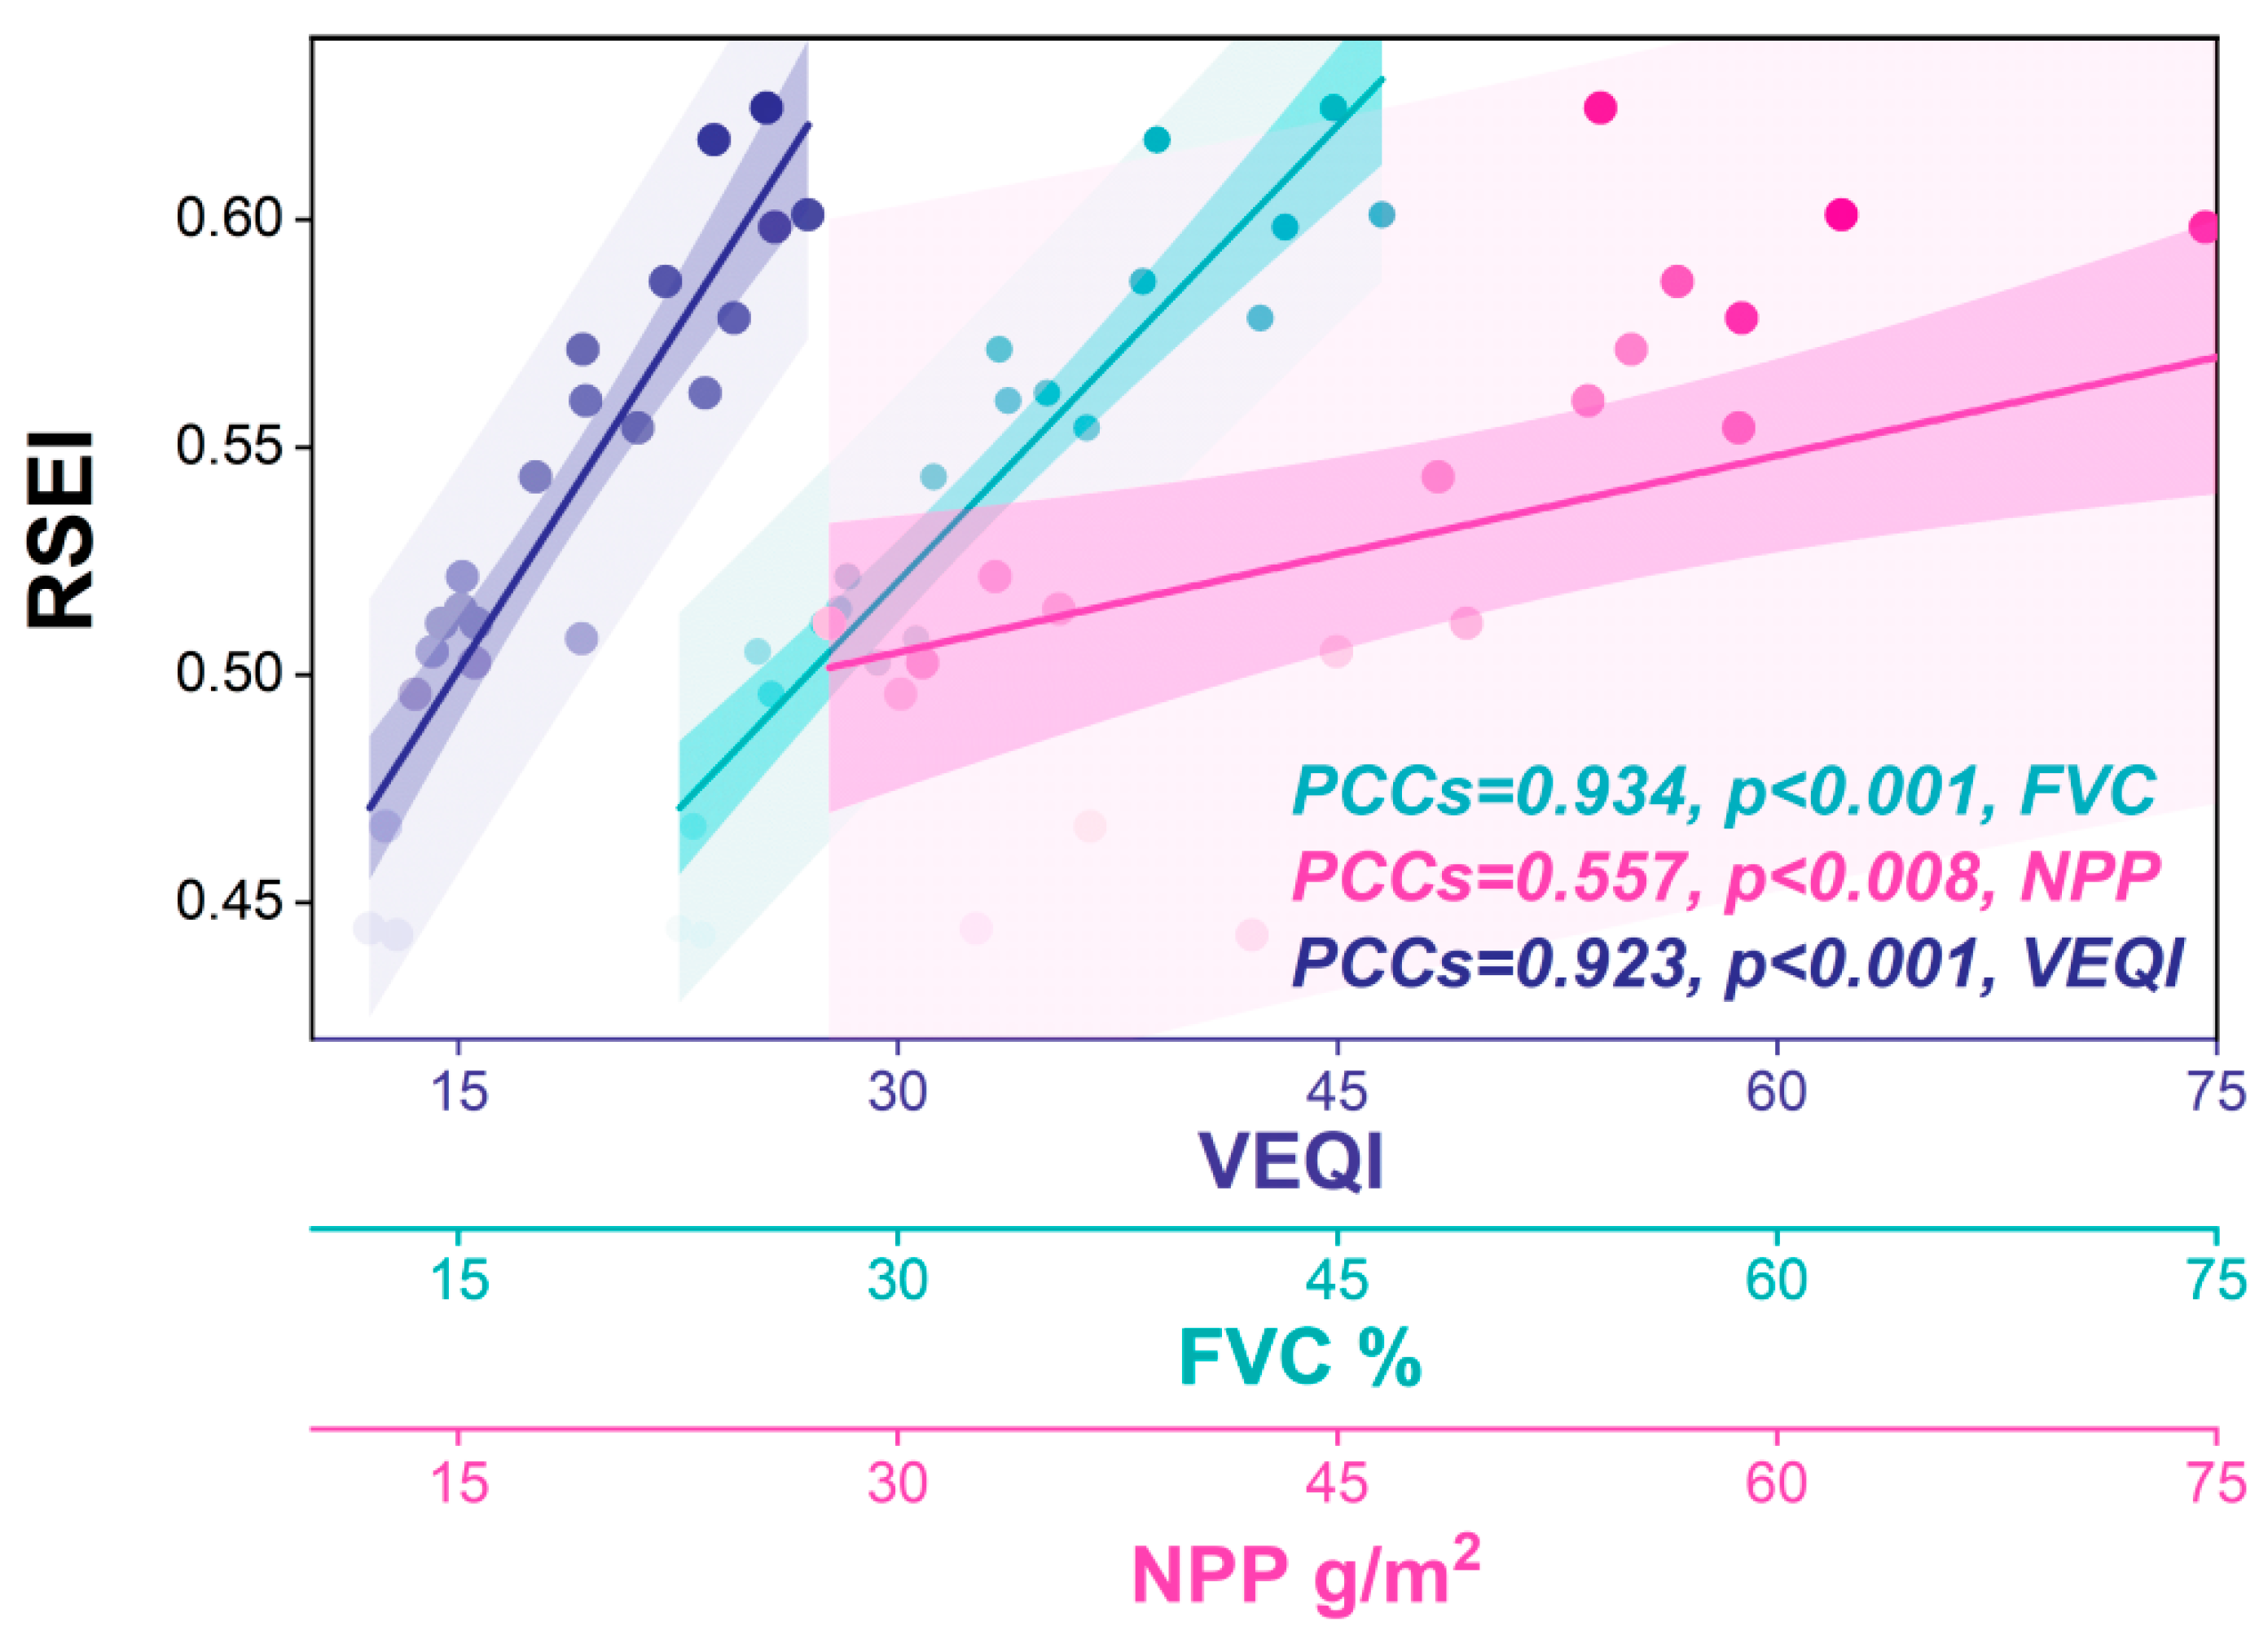
4.2.1. Regional Scale
4.2.2. Pixel Scale
Theil–Sen Median
TSS-RESTREND
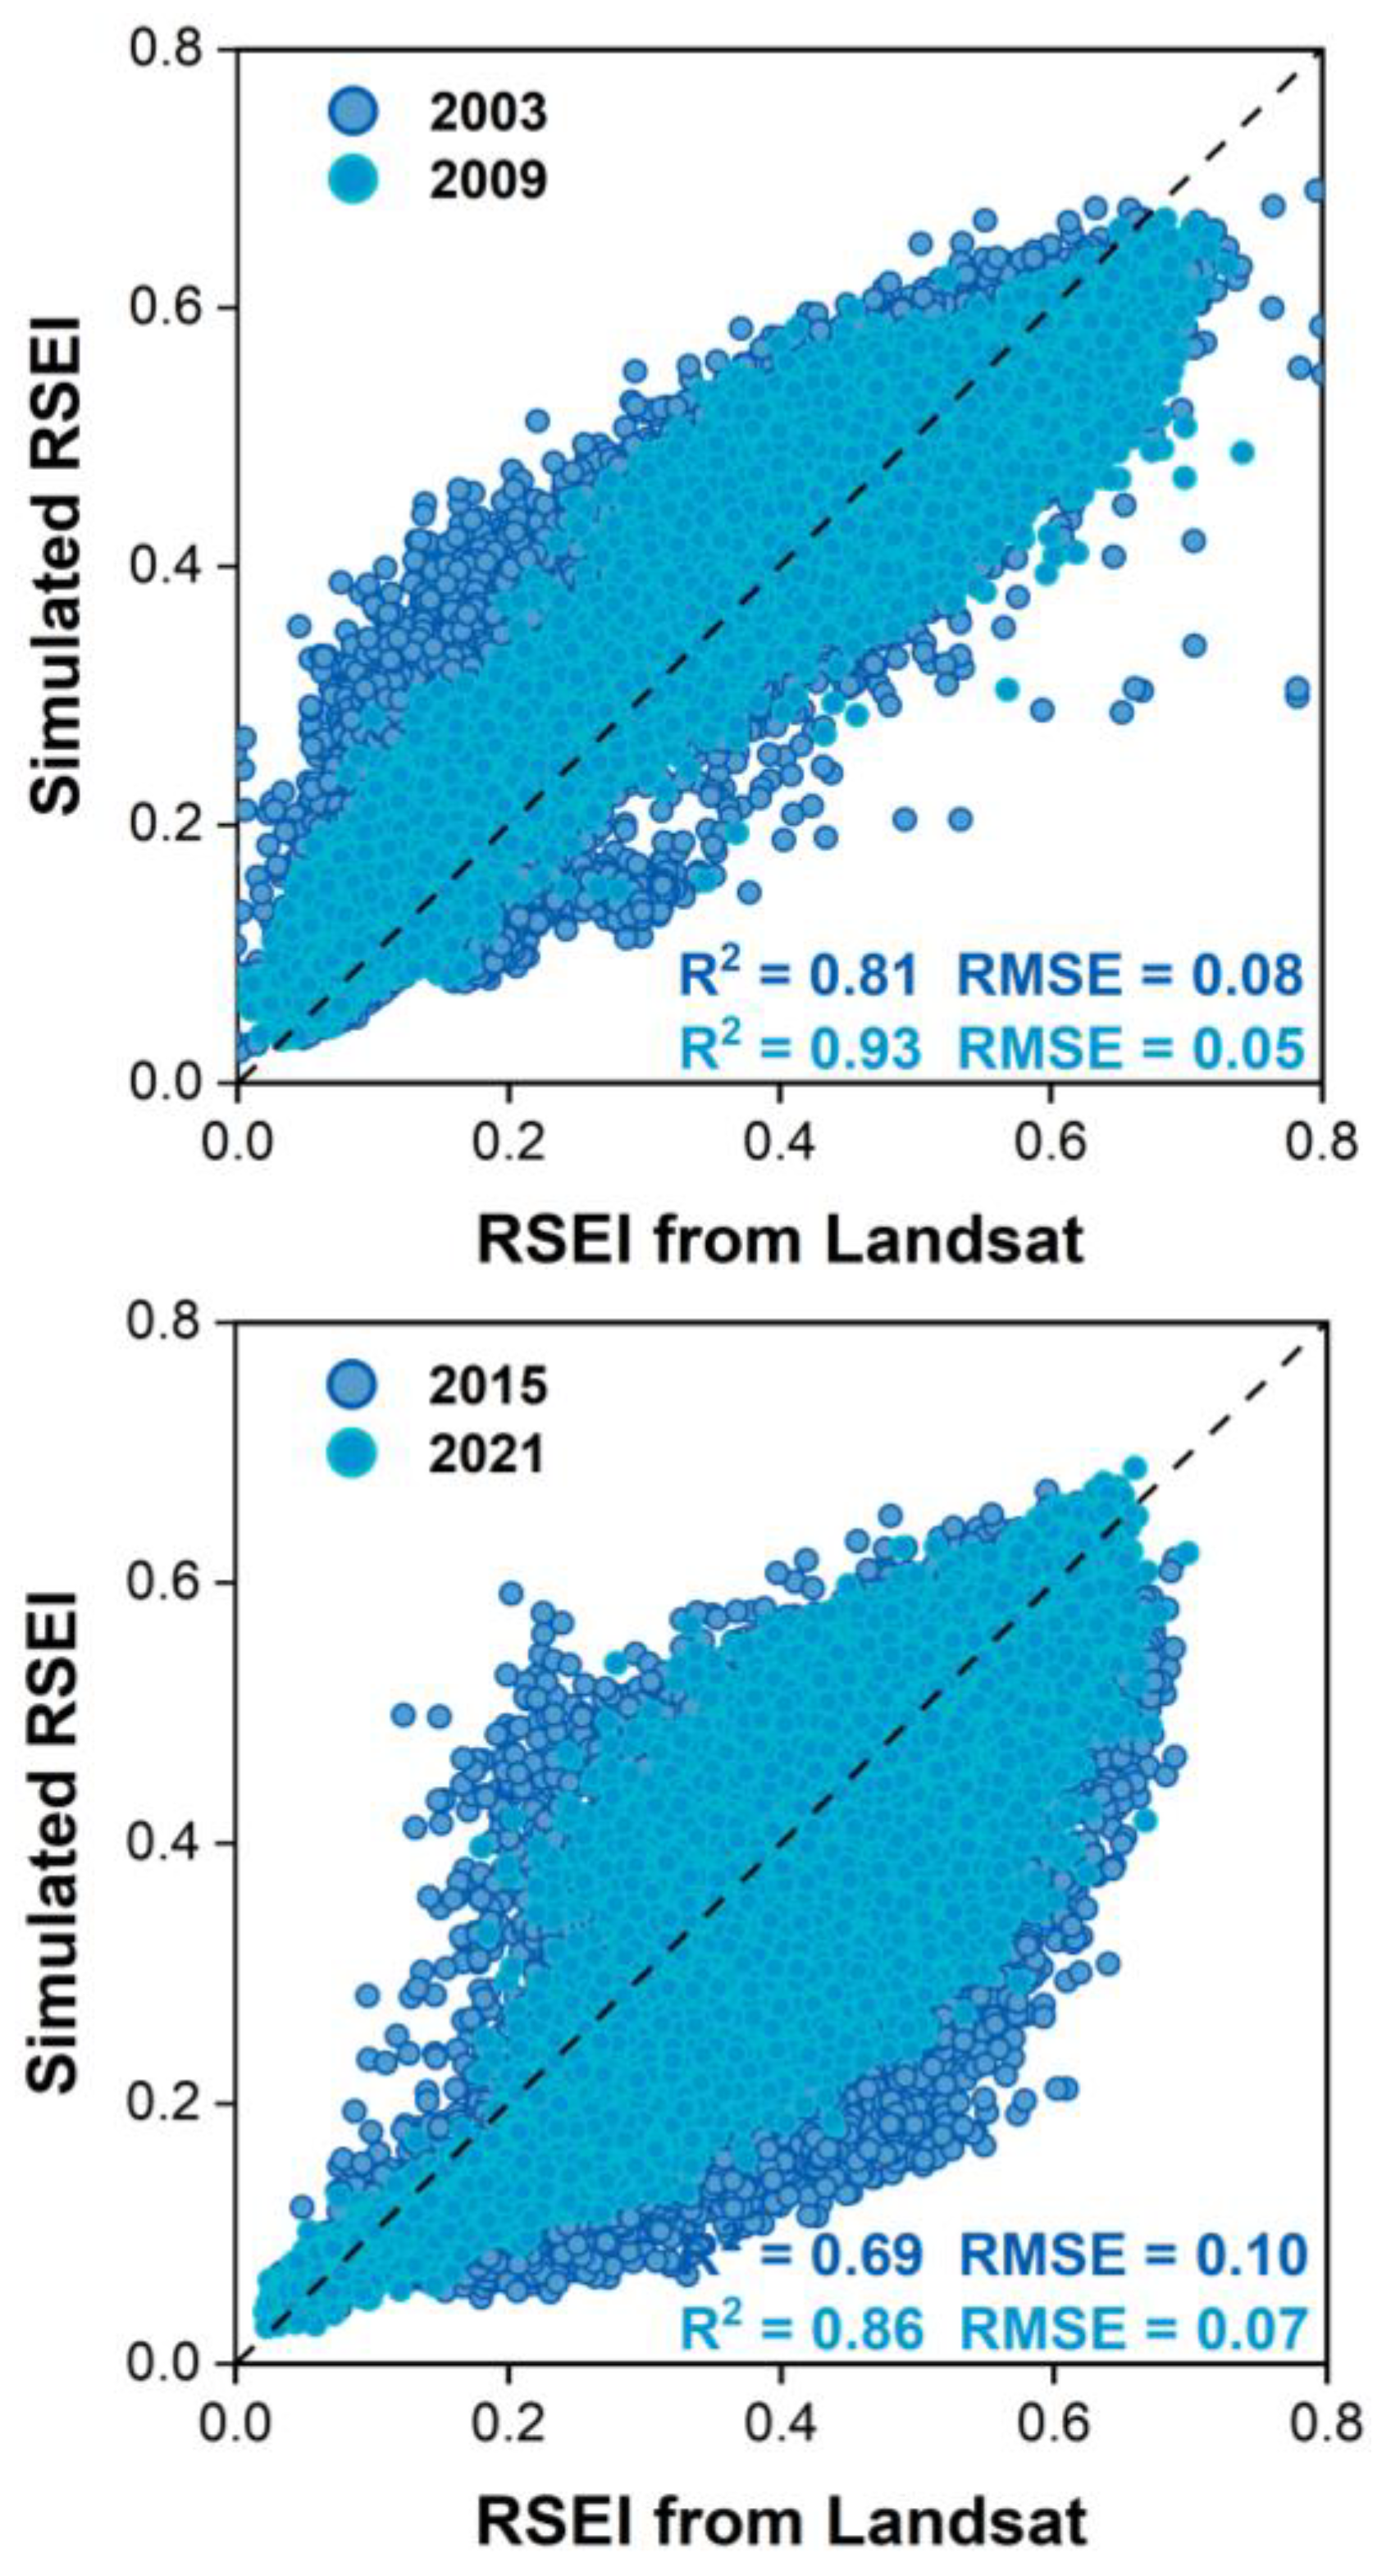
Applicability of TEE-RESTREND
4.3. Spatiotemporal Evolution of LULC
5. Limitations
6. Conclusions
- (1)
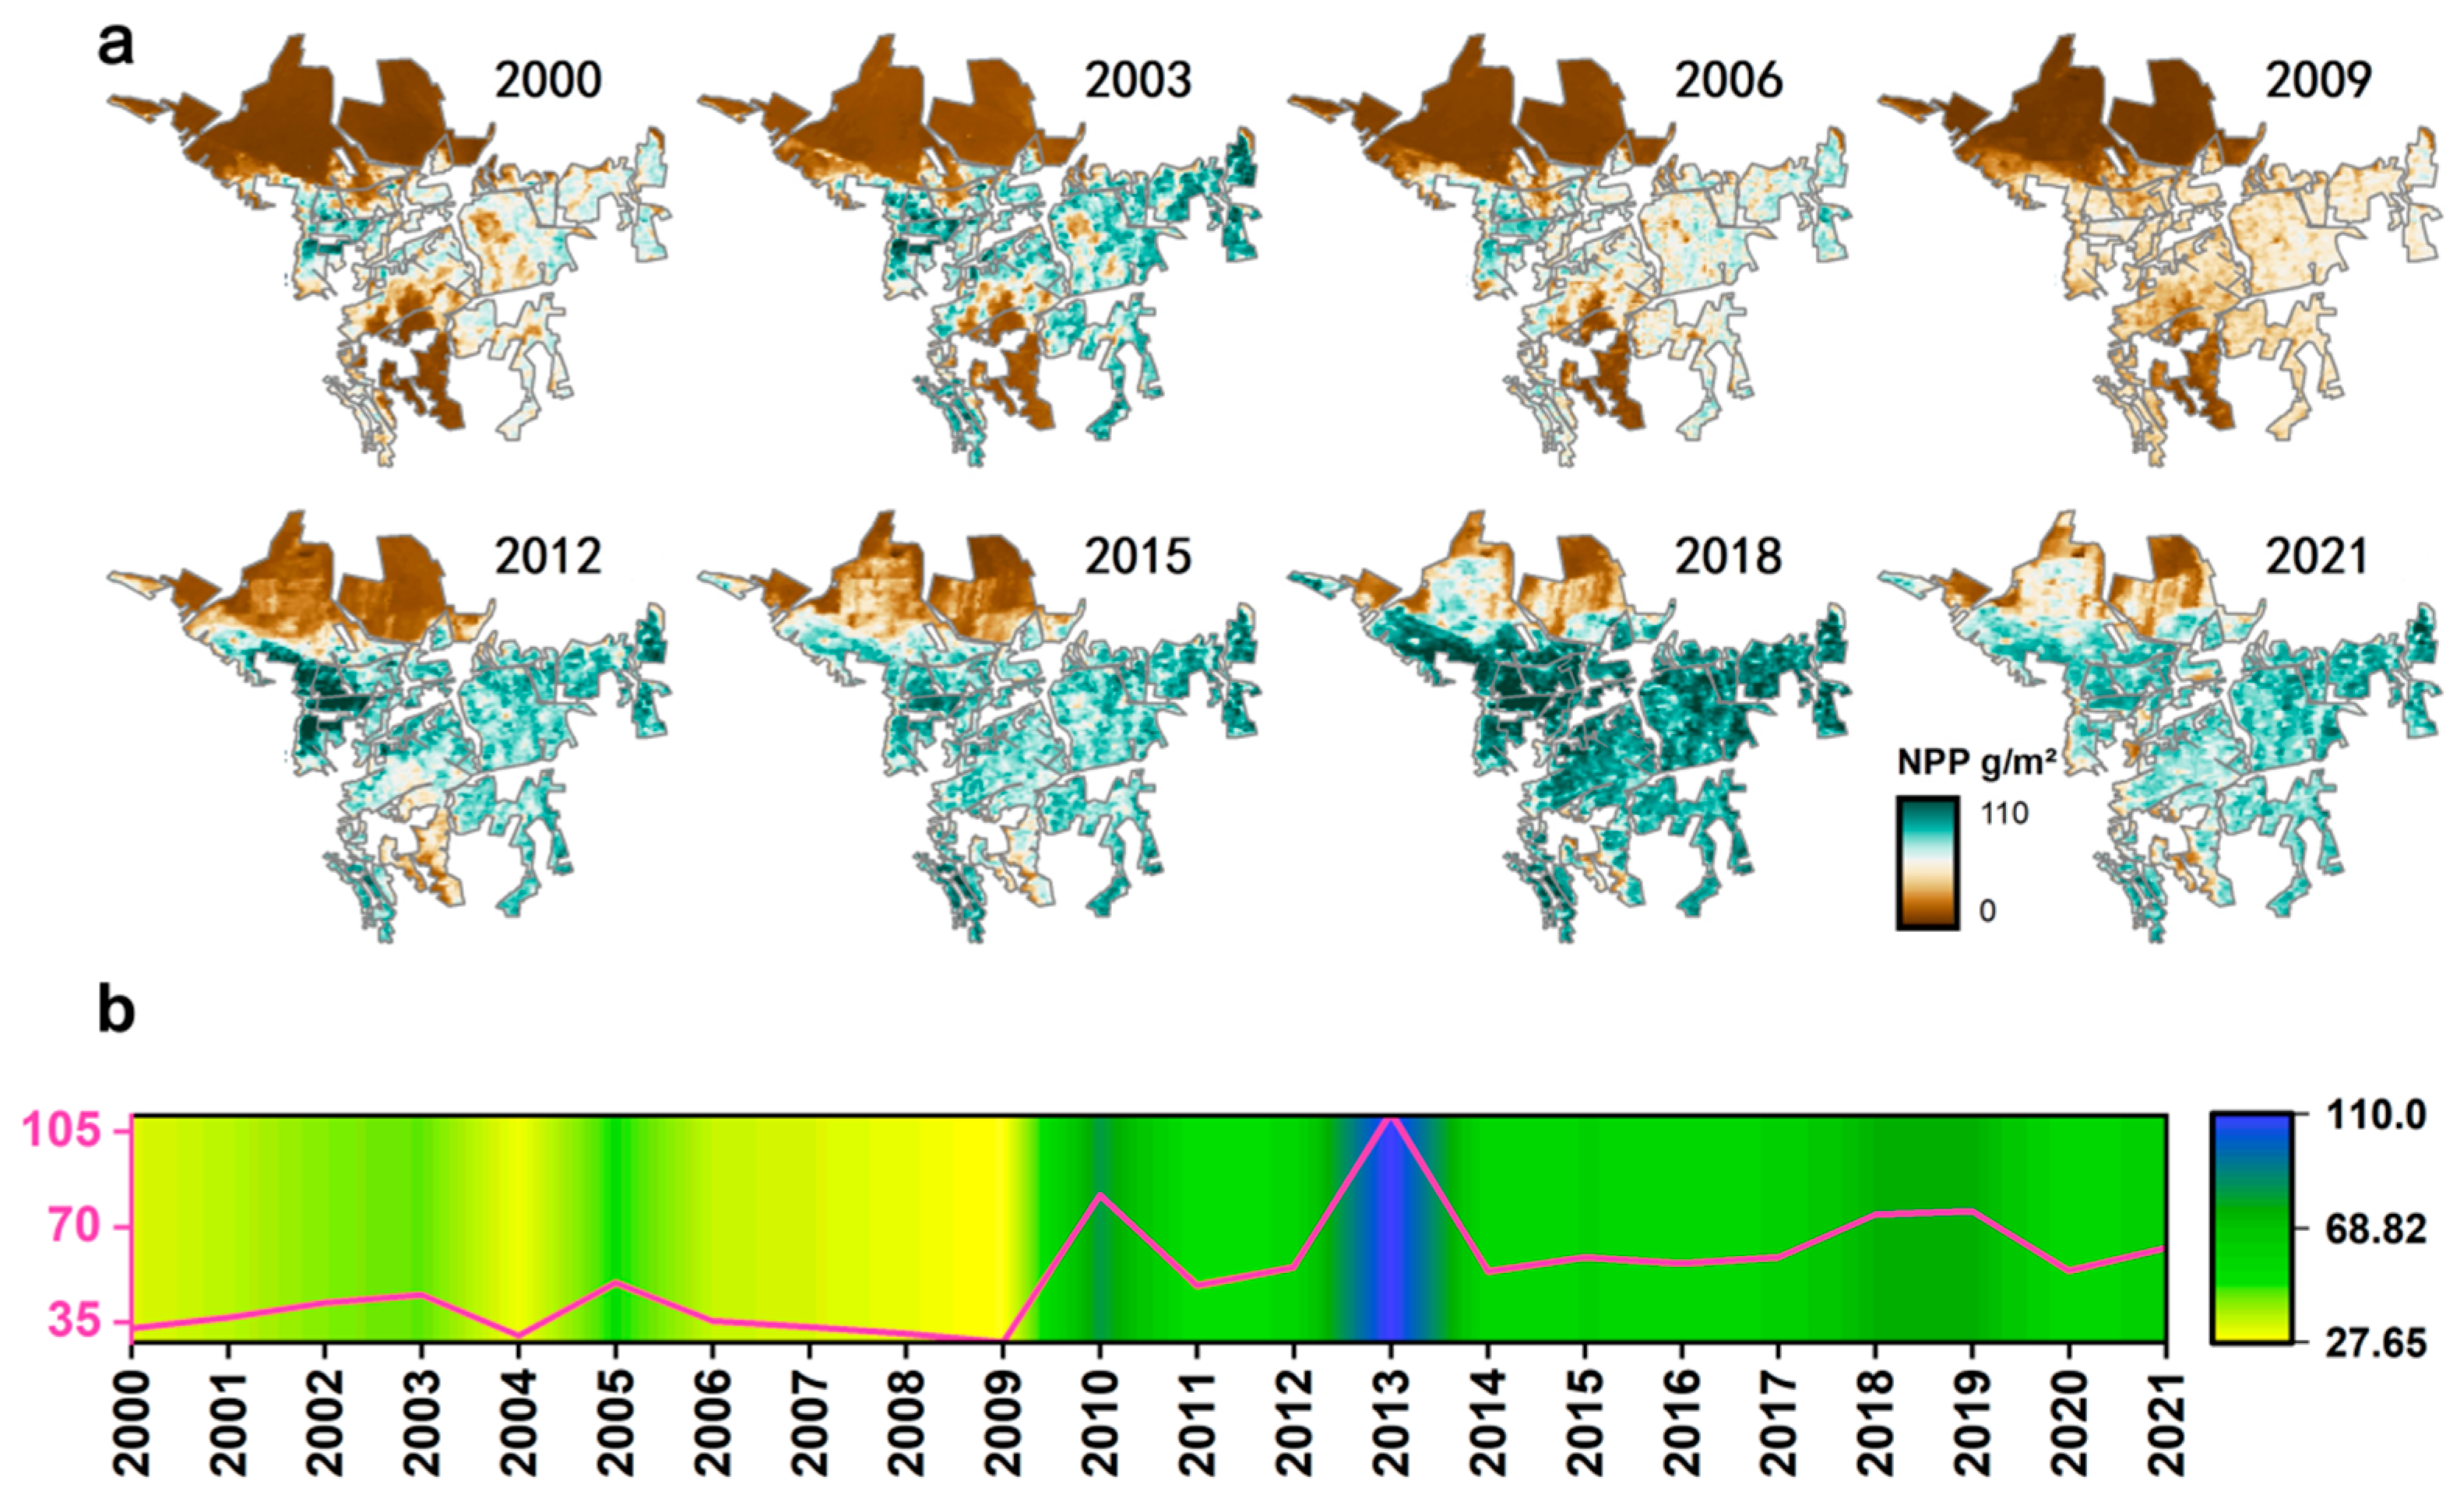
- From 2000 to 2021, the FVC, NPP, VEQI, and RSEI in the Kökyar Project Area showed a significant upward trend and the spatial distribution characteristics of “high in the south and low in the north”. Over the past 22 years, the average annual increase in the FVC has been about 1.09, with an increase of nearly 107.11% compared with that in 2000. The average annual growth of the NPP was about 1.34 gC/m2, which was 90.39% higher than that in 2000 (32.67 gC/m2). On average, the RSEI has increased by 0.02 every 10 years.
- (2)
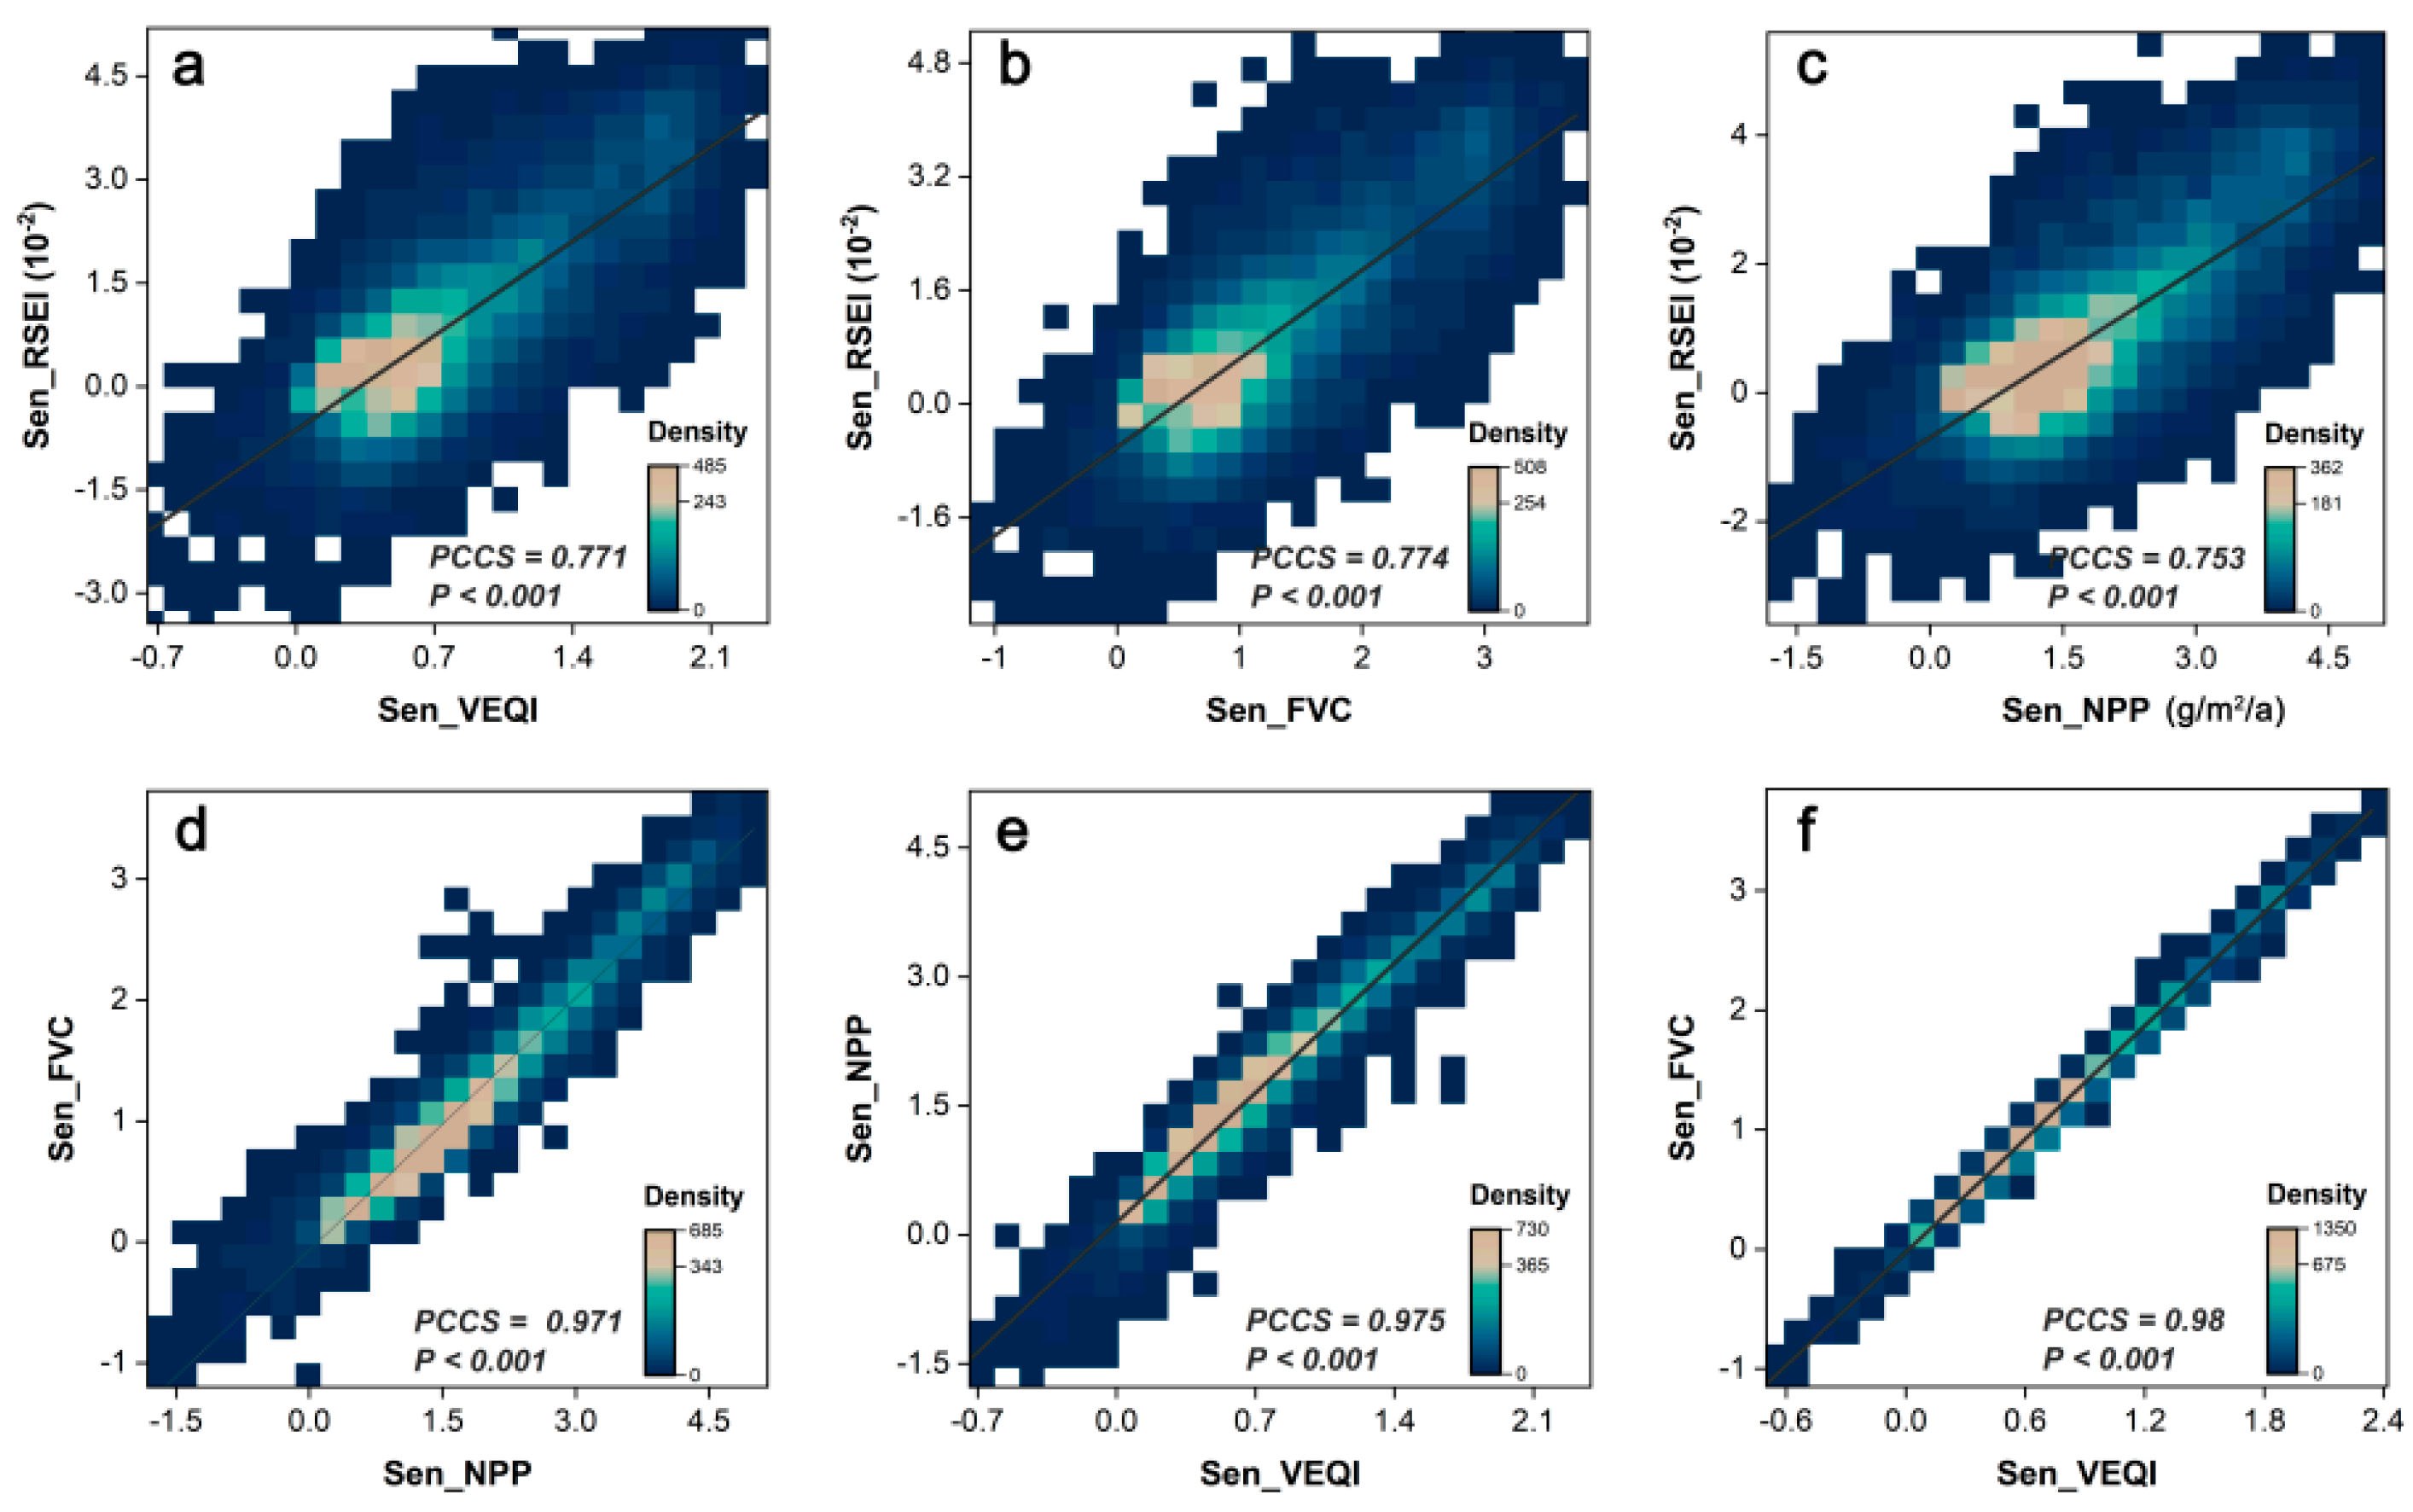
- Over the past 22 years, the ecological quality has been significantly promoted according to the FVC, NPP, and VEQI (p < 0.001), indicating that the “Kökyar Greening Project” has achieved significant ecological and environmental benefits.
- (3)
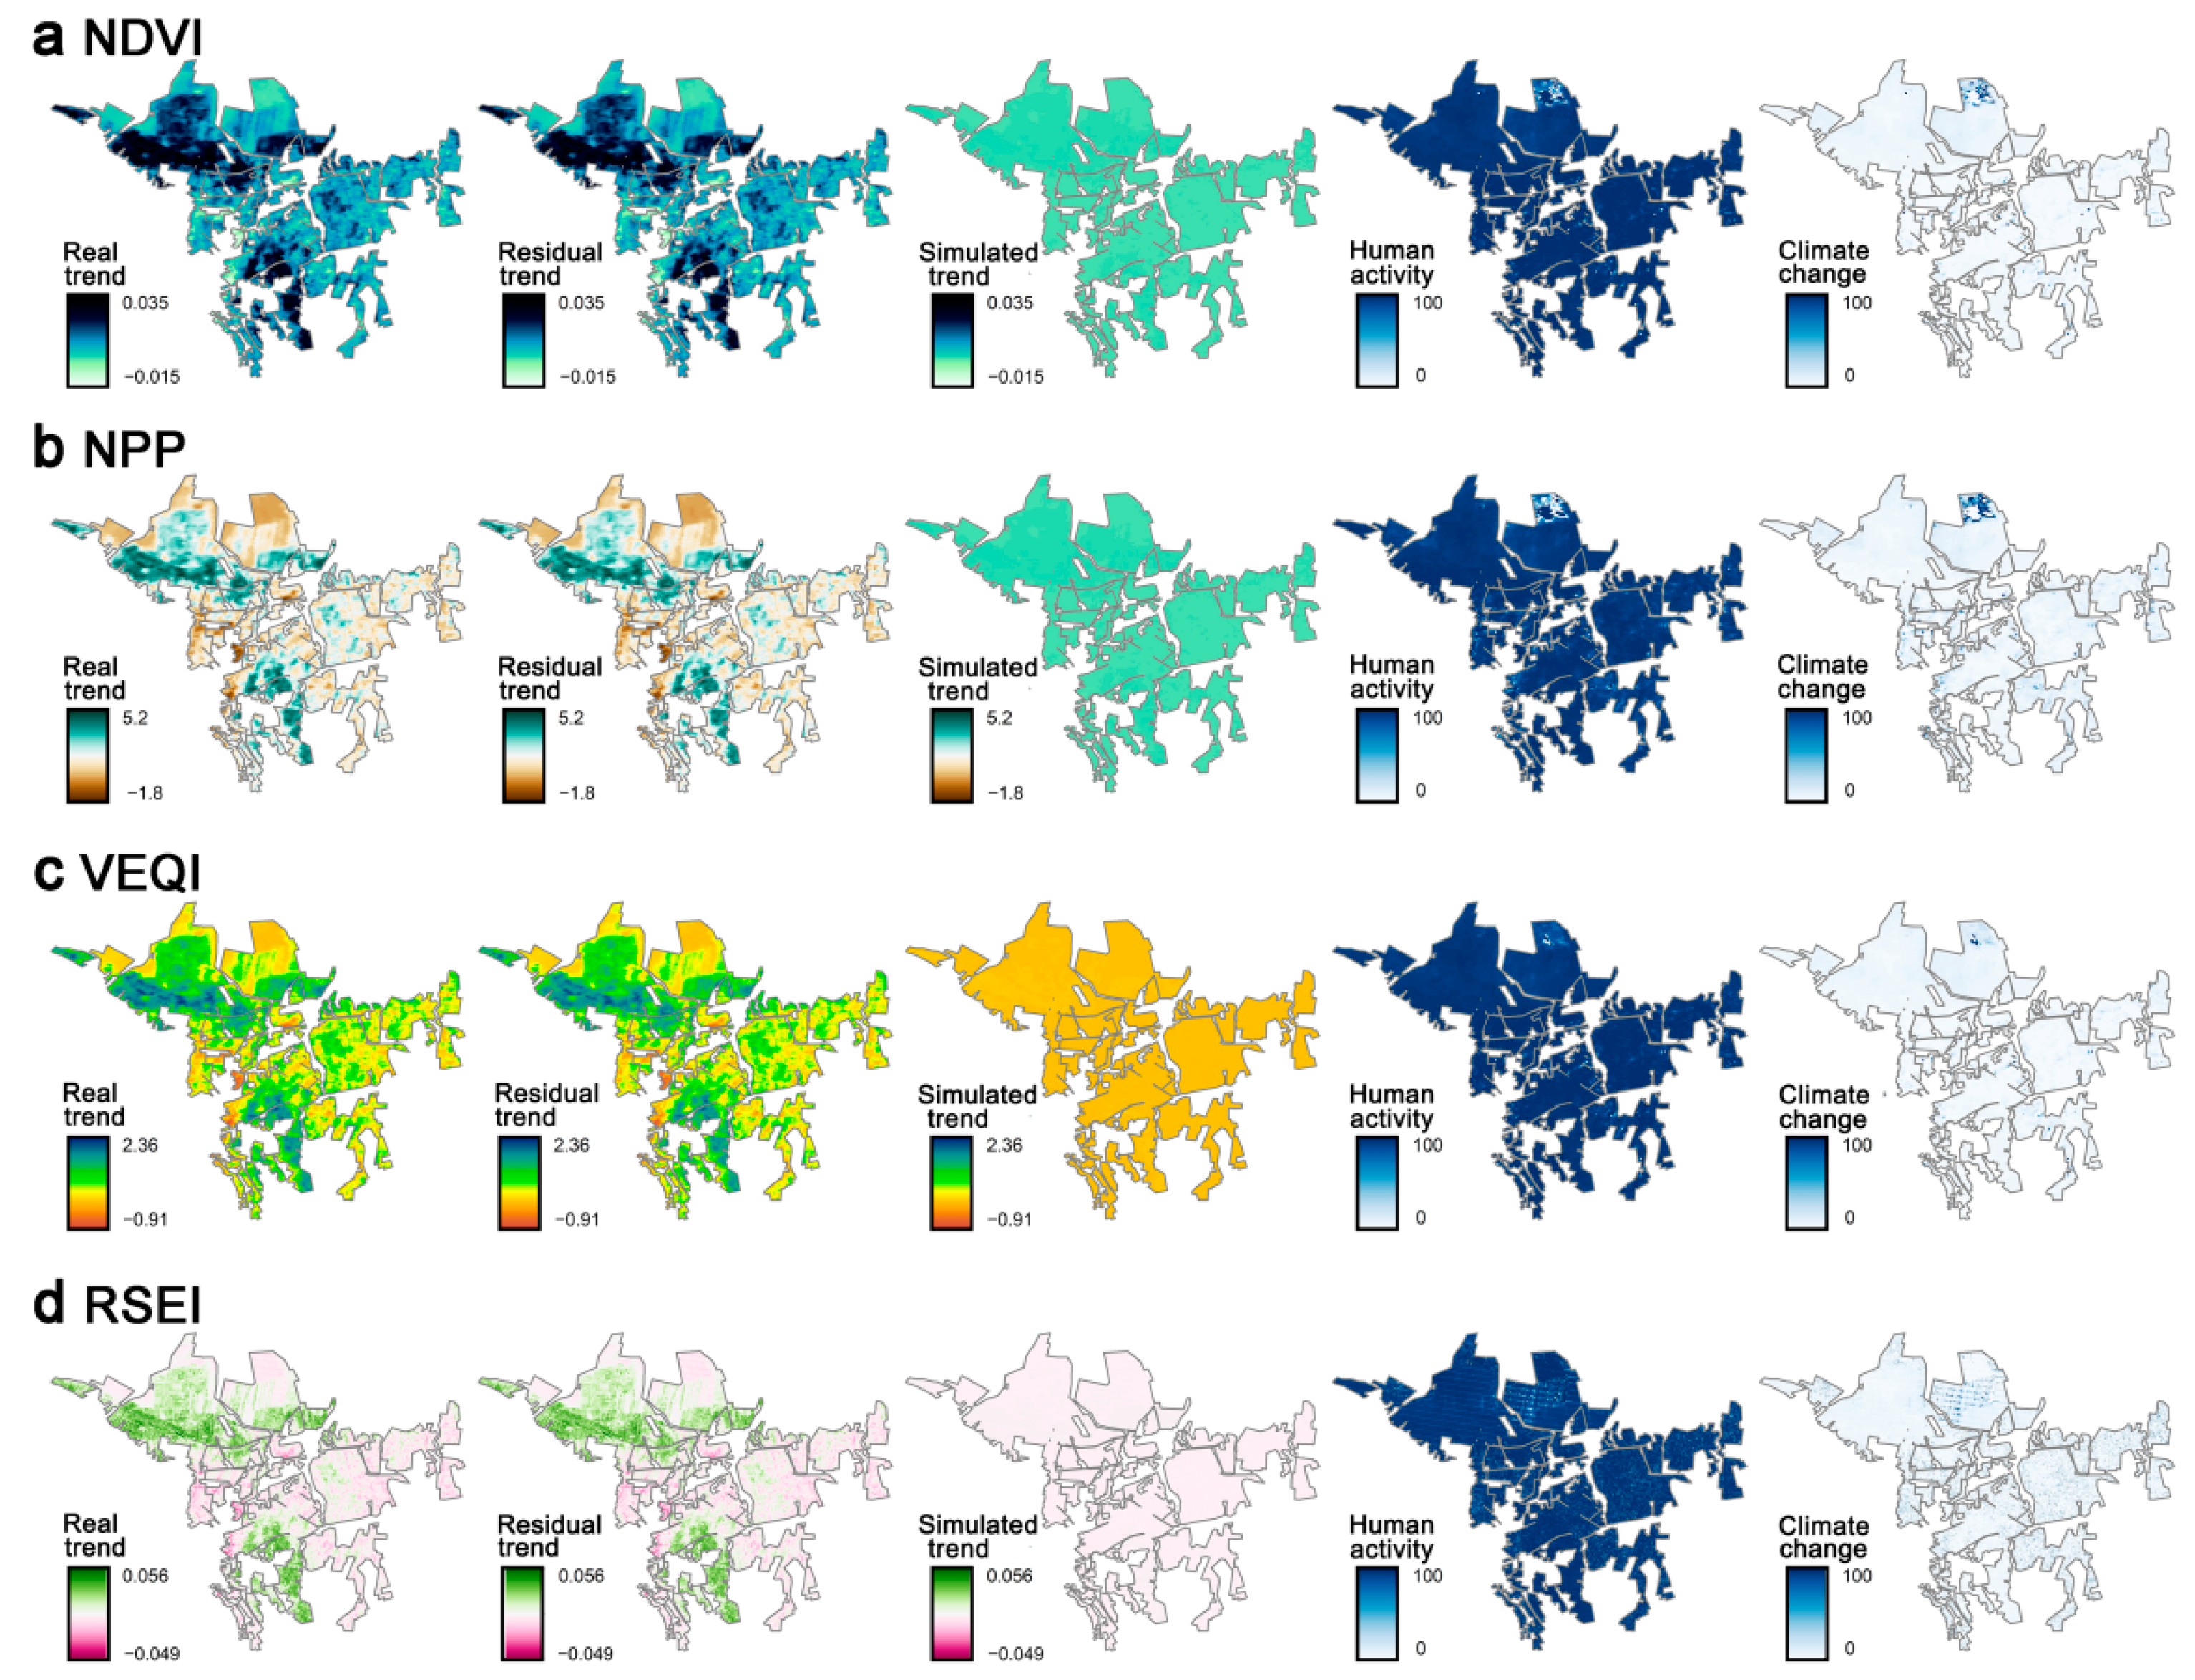
- From 2000 to 2021, the changes in the vegetation parameters and ecological quality in the Kökyar Project Area were dominated by human activities.
- (4)
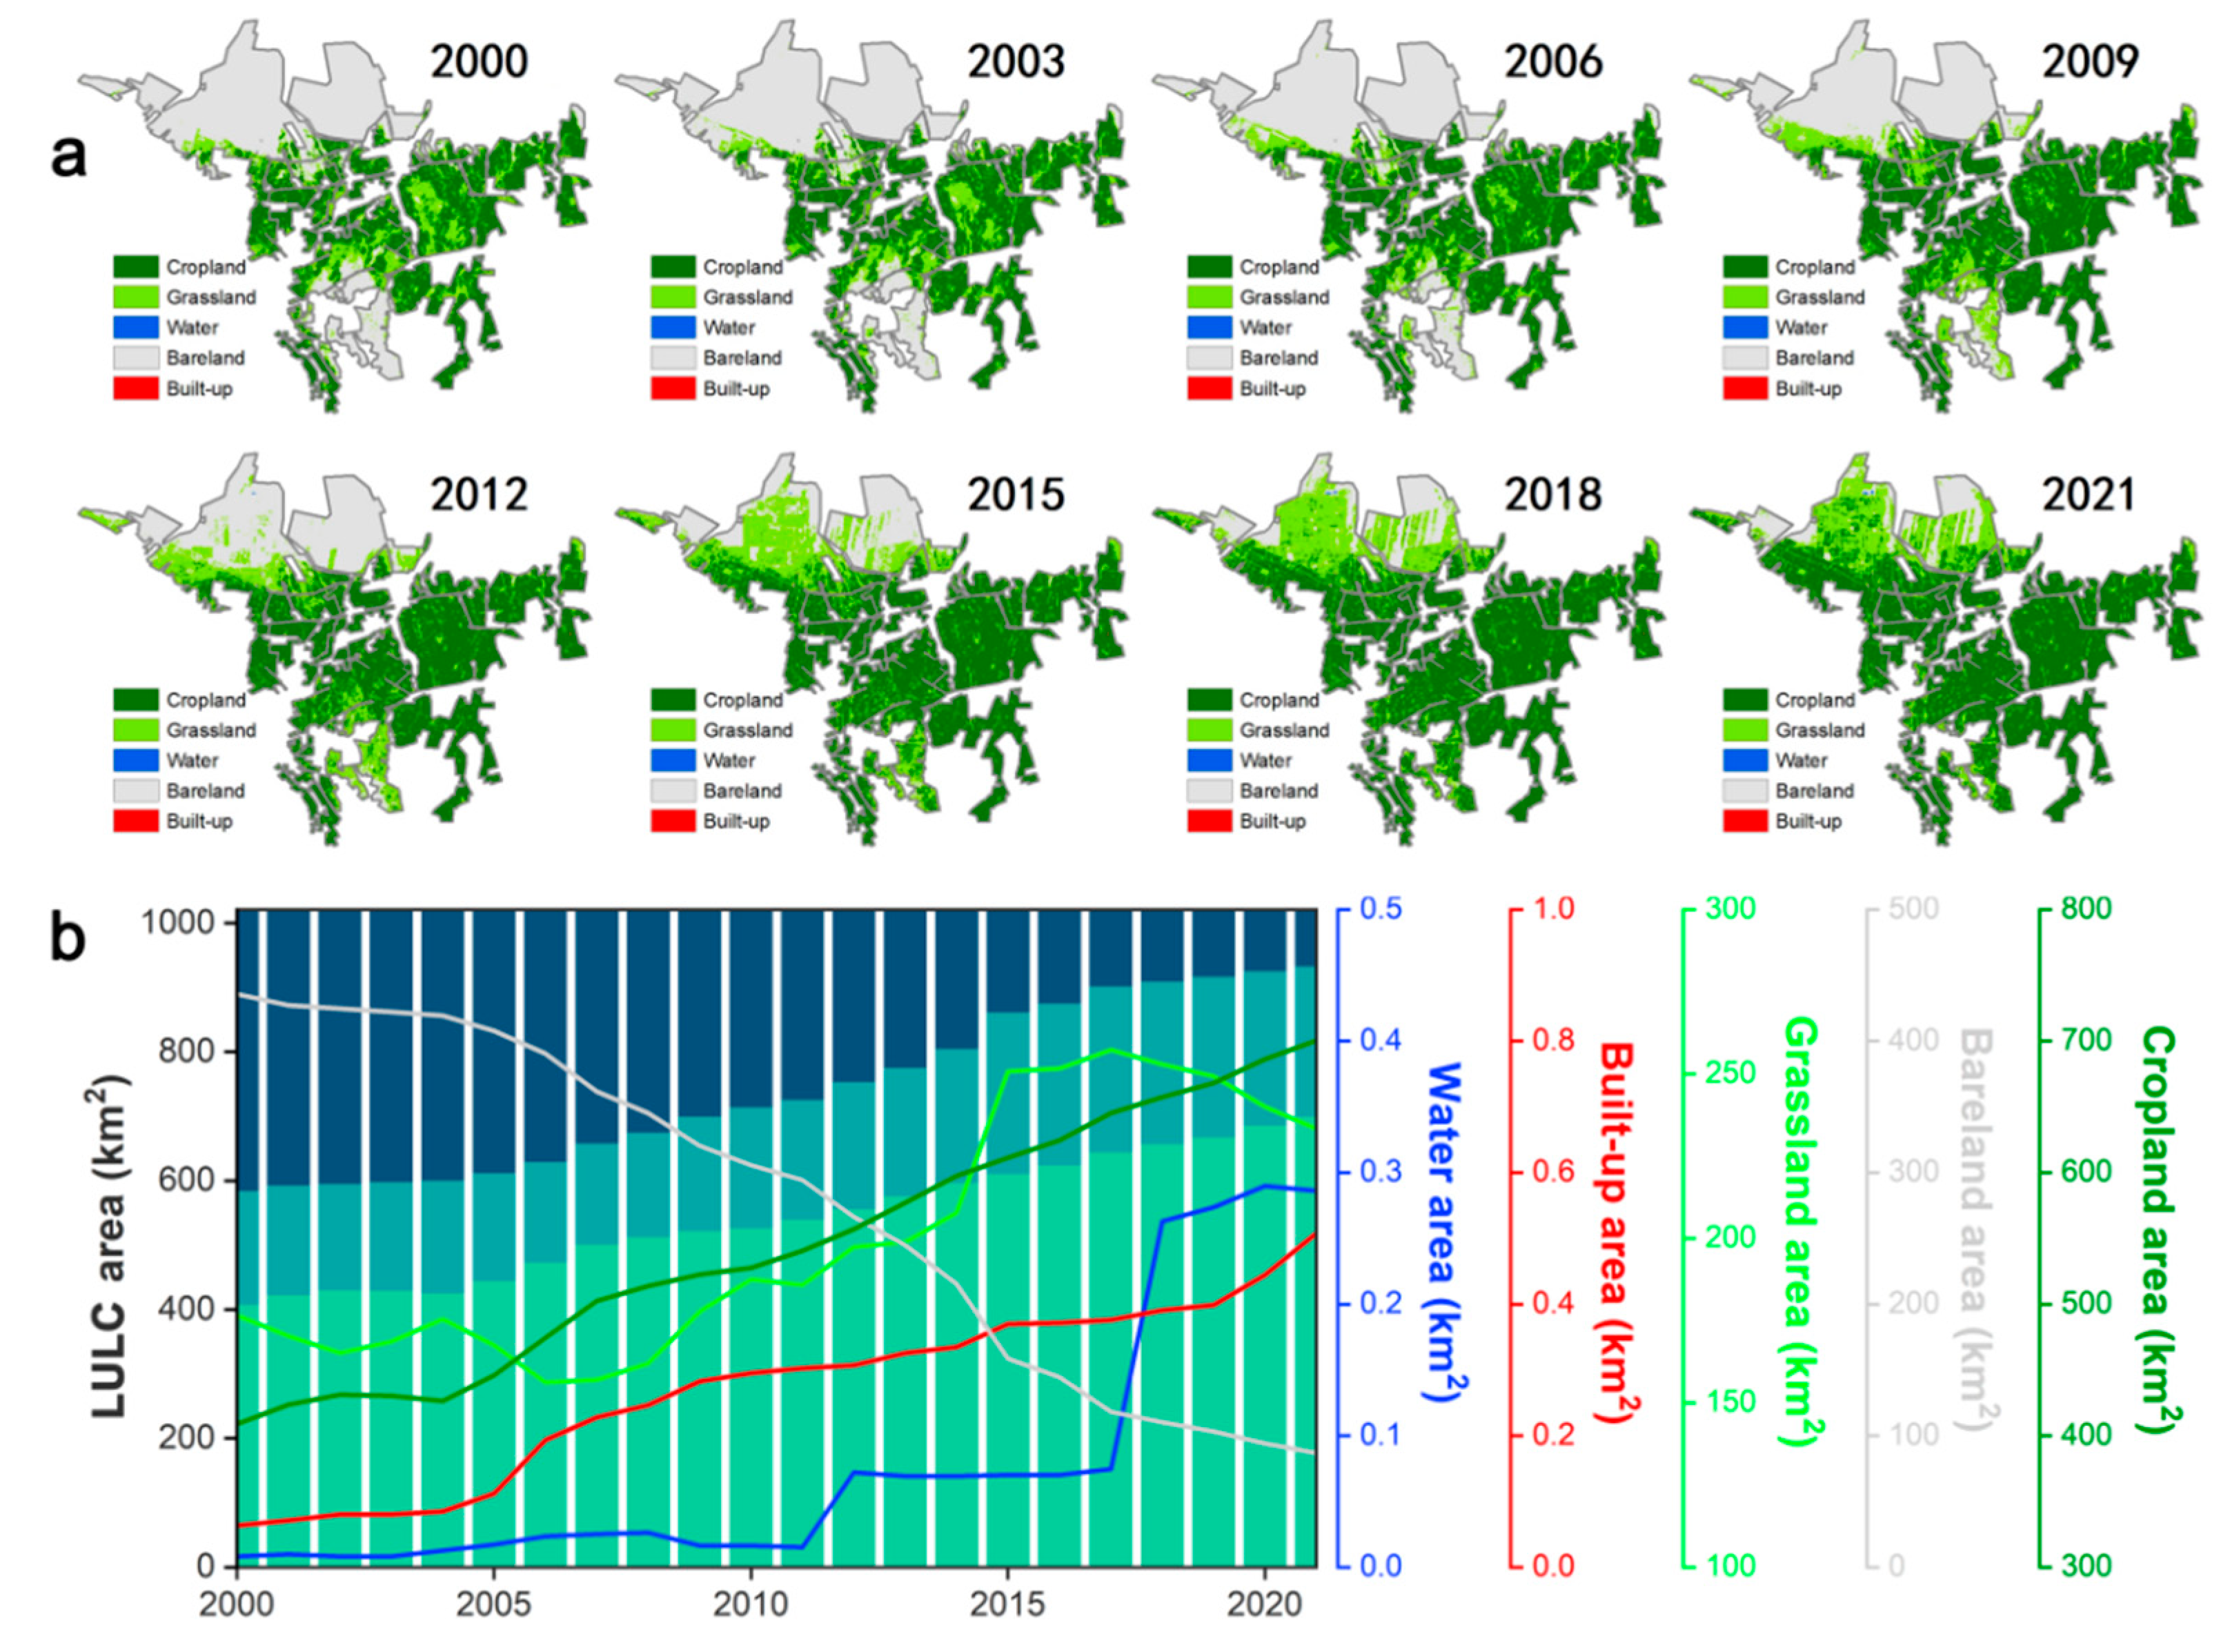
- Over the past 22 years, the Kökyar Project Area has brought great changes to the ecosystem pattern of the region. The bare land was reduced in a large area (348.83 km2), while the cropland (291.41 km2) and grassland (56.71 km2) showed a significant growth trend, indicating that the vegetation parameters (FVC, NPP, and VEQI) and the RSEI in the Kökyar Project Area have increased mainly in the form of cropland and grassland expansion.
- (5)
- This study used a variety of vegetation ecological parameters to comprehensively demonstrate the ecological and environmental effects of the greening projects in the Kökyar area over more than 20 years, with different scales, methods, and models. It can provide strong data support for ecological environmental protection in this region.
Author Contributions
Funding
Institutional Review Board Statement
Informed Consent Statement
Data Availability Statement
Acknowledgments
Conflicts of Interest
Abbreviations
| FVC | fractional vegetation cover |
| NPP | net primary productivity |
| VEQI | vegetation ecological quality index |
| RSEI | remote-sensing ecological index |
| TEC | terrestrial ecosystem carbon |
| LULC | land use and land cover |
References
- Foley, J.A.; Prentice, I.C.; Ramankutty, N.; Levis, S.; Pollard, D.; Sitch, S.; Haxeltine, A. An integrated biosphere model of land surface processes, terrestrial carbon balance, and vegetation dynamics. Glob. Biogeochem. Cycles 1996, 10, 603–628. [Google Scholar] [CrossRef]
- Cowling, S.A.; Field, C.B. Environmental control of leaf area production: Implications for vegetation and land-surface modeling. Glob. Biogeochem. Cycles 2003, 17, 7-1–7-14. [Google Scholar] [CrossRef]
- Herrmann, S.M.; Anyamba, A.; Tucker, C.J. Recent trends in vegetation dynamics in the African Sahel and their relationship to climate. Glob. Environ. Chang. 2005, 15, 394–404. [Google Scholar] [CrossRef]
- Huang, S.; Zheng, X.; Ma, L.; Wang, H.; Huang, Q.; Leng, G.; Meng, E.; Guo, E. Quantitative contriution of climate change and human activities to vegetation cover variations based on GA-SVM model. J. Hydrol. 2020, 584, 124687. [Google Scholar] [CrossRef]
- Chen, C.; Park, T.; Wang, X.; Piao, S.; Xu, B.; Chaturvedi, R.K.; Fuchs, R.; Brovkin, V.; Ciais, P.; Fensholt, R.; et al. China and India lead in greening of the world through land-use management. Nat. Sustain. 2019, 2, 122–129. [Google Scholar] [CrossRef] [PubMed]
- Zhang, Z.; Huisingh, D. Combating desertification in China: Monitoring, control, management and revegetation. J. Clean. Prod. 2018, 182, 765–775. [Google Scholar] [CrossRef]
- Liou, J.G.; Graham, S.A.; Maruyama, S.; Zhang, R.Y. Characteristics and tectonic significance of the Late Proterozoic Aksu blueschists and diabasic dikes, Northwest Xinjiang, China. Int. Geol. Rev. 1996, 38, 228–244. [Google Scholar] [CrossRef]
- Missall, S.; Welp, M.; Thevs, N.; Abliz, A.; Halik, Ü. Establishment and maintenance of regulating ecosystem services in a dryland area of central Asia, illustrated using the Kökyar Protection Forest, Aksu, NW China, as an example. Earth Syst. Dyn. 2015, 6, 359–373. [Google Scholar] [CrossRef] [Green Version]
- Welp, M.; Ward, N.; Missall, S.; Abliz, A.; Halik, Ü.; Abliz, A.; Halik, Ü. Providing Urban Ecosystem Services for Human Well-Being: A Comparison of Exemplary Institutional Arrangements in China and Germany. In Urbanization and Locality; Springer: Berlin/Heidelberg, Germany, 2016; pp. 229–247. [Google Scholar]
- Sanderson, E.W.; Jaiteh, M.; Levy, M.A.; Redford, K.H.; Wannebo, A.V.; Woolmer, G. The human footprint and the last of the wild: The human footprint is a global map of human influence on the land surface, which suggests that human beings are stewards of nature, whether we like it or not. BioScience 2002, 52, 891–904. [Google Scholar] [CrossRef]
- Carlson, T.N.; Ripley, D.A. On the relation between NDVI, fractional vegetation cover, and leaf area index. Remote Sens. Environ. 1997, 62, 241–252. [Google Scholar] [CrossRef]
- Jiang, Z.; Huete, A.R.; Didan, K.; Miura, T. Development of a two-band enhanced vegetation index without a blue band. Remote Sens. Environ. 2008, 112, 3833–3845. [Google Scholar] [CrossRef]
- Cramer, W.; Kicklighter, D.W.; Bondeau, A.; Iii, B.M.; Churkina, G.; Nemry, B.; Ruimy, A.; Schloss, A.L.; Intercomparison, T.P.O.T.P.N.M. Comparing global models of terrestrial net primary productivity (NPP): Overview and key results. Glob. Chang. Biol. 1999, 5 (Suppl. S1), 1–15. [Google Scholar] [CrossRef]
- Anderson, J.R. A Land Use and Land Cover Classification System for Use with Remote Sensor Data; US Government Printing Office: Arlington, TX, USA, 1976.
- Xu, H.; Wang, M.; Shi, T.; Guan, H.; Fang, C.; Lin, Z. Prediction of ecological effects of potential population and impervious surface increases using a remote sensing based ecological index (RSEI). Ecol. Indic. 2018, 93, 730–740. [Google Scholar] [CrossRef]
- Pettorelli, N.; Bühne, H.S.T.; Tulloch, A.; Dubois, G.; Macinnis-Ng, C.; Queirós, A.M.; Keith, D.A.; Wegmann, M.; Schrodt, F.; Stellmes, M.; et al. Satellite remote sensing of ecosystem functions: Opportunities, challenges and way forward. Remote Sens. Ecol. Conserv. 2018, 4, 71–93. [Google Scholar] [CrossRef]
- Wang, Z.; Liu, X.; Jia, F.; Nie, Y. Temporal and spatial evolution characteristics and influencing factors of vegetation cover in Aksu basin in recent 10 years. J. Chang. Acad. Sci. 2017, 34, 24. [Google Scholar]
- Du, J.Q.; Jiaerheng, A.; Zhao, C.; Fang, G.-L.; Yin, J.-Q.; Xiang, B.; Yuan, X.-J.; Fang, S.-F. Dynamic changes of NDVI of vegetation in Xinjiang from 1982 to 2012 and its response to climate change and human activities. Yingyong Shengtai Xuebao 2015, 26, 3567–3578. [Google Scholar]
- Cui, C.; Guo, Y.; Shen, Y. Temporal and spatial distribution and driving factors of desert vegetation in Xinjiang. Chin. J. Ecol. Agric. Chin. Engl. 2021, 29, 1668–1678. [Google Scholar]
- Li, C.; Li, X.; Luo, D.; He, Y.; Chen, F.; Zhang, B.; Qin, Q. Spatiotemporal Pattern of Vegetation Ecology Quality and Its Response to Climate Change between 2000–2017 in China. Sustainability 2021, 13, 1419. [Google Scholar] [CrossRef]
- Gorelick, N.; Hancher, M.; Dixon, M.; Ilyushchenko, S.; Thau, D.; Moore, R. Google Earth Engine: Planetary-scale geospatial analysis for everyone. Remote Sens. Environ. 2017, 202, 18–27. [Google Scholar] [CrossRef]
- Fernandes, R.; Leblanc, S.G. Parametric (modified least squares) and non-parametric (Theil–Sen) linear regressions for predicting biophysical parameters in the presence of measurement errors. Remote Sens. Environ. 2005, 95, 303–316. [Google Scholar] [CrossRef]
- Burrell, A.L.; Evans, J.P.; De Kauwe, M.G. Anthropogenic climate change has driven over 5 million km2 of drylands towards desertification. Nat. Commun. 2020, 11, 1–11. [Google Scholar] [CrossRef] [PubMed]
- Sun, J.; Liu, T. The age of the Taklimakan Desert. Science 2006, 312, 1621. [Google Scholar] [CrossRef] [PubMed] [Green Version]
- Peng, S.; Ding, Y.; Liu, W.; Li, Z. 1 km monthly temperature and precipitation dataset for China from 1901 to 2017. Earth Syst. Sci. Data 2019, 11, 1931–1946. [Google Scholar] [CrossRef] [Green Version]
- Didan, K. MOD13A3 MODIS/Terra vegetation Indices Monthly L3 Global 1km SIN Grid V006 [Data set]. NASA EOSDIS Land Processes DAAC. Available online: https://lpdaac.usgs.gov/products/mod13a3v006/ (accessed on 12 May 2022).
- Rodriguez, E.; Morris, C.S.; Belz, J.E. A global assessment of the SRTM performance. Photogramm. Eng. Remote Sens. 2006, 72, 249–260. [Google Scholar] [CrossRef] [Green Version]
- Woodcock, C.E.; Allen, R.; Anderson, M.; Belward, A.; Bindschadler, R.; Cohen, W.; Gao, F.; Goward, S.N.; Helder, D.; Helmer, E.; et al. Free access to Landsat imagery. Science 2008, 320, 1011. [Google Scholar] [CrossRef]
- Christopher, P.; Steven, K.; Vanessa, G.; Cyrus, H.; Shyam, B.; Vipin, K.; Varun, M.; Ashish, G. Terrestrial Ecosystem Carbon Fluxes Predicted from MODIS Satellite Data and Large-Scale Disturbance Modeling. Int. J. Geosci. 2012, 2012, 21214. [Google Scholar]
- Johnson, B.; Tateishi, R.; Kobayashi, T. Remote sensing of fractional green vegetation cover using spatially-interpolated endmembers. Remote Sens. 2012, 4, 2619–2634. [Google Scholar] [CrossRef] [Green Version]
- Xu, D.; Yang, F.; Yu, L.; Zhou, Y.; Li, H.; Ma, J.; Huang, J.; Wei, J.; Xu, Y.; Zhang, C.; et al. Quantization of the coupling mechanism between eco-environmental quality and urbanization from multisource remote sensing data. J. Clean. Prod. 2021, 321, 128948. [Google Scholar] [CrossRef]
- Xu, H.Q. A remote sensing urban ecological index and its application. Acta Ecol. Sin. 2013, 33, 7853–7862. [Google Scholar]
- Ermida, S.L.; Soares, P.; Mantas, V.; Göttsche, F.-M.; Trigo, I.F. Google Earth Engine Open-Source Code for Land Surface Temperature Estimation from the Landsat Series. Remote Sens. 2020, 12, 1471. [Google Scholar] [CrossRef]
- Soenen, S.A.; Peddle, D.R.; Coburn, C.A. SCS + C: A Modified Sun-Canopy-Sensor Topographic Correction in Forested Terrain. IEEE Trans. Geosci. Remote Sens. 2005, 43, 2148–2159. [Google Scholar] [CrossRef]
- Roy, D.P.; Zhang, H.K.; Ju, J.; Gomez-Dans, J.L.; Lewis, P.E.; Schaaf, C.B.; Sun, Q.; Li, J.; Huang, H.; Kovalskyy, V. A General Method to Normalize Landsat Reflectance Data to Nadir BRDF Adjusted Reflectance. Remote Sens. Environ. 2016, 176, 255–271. [Google Scholar] [CrossRef] [Green Version]
- Dubertret, F.; Le Tourneau, F.-M.; Villarreal, M.L.; Norman, L.M. Monitoring Annual Land Use/Land Cover Change in the Tucson Metropolitan Area with Google Earth Engine (1986–2020). Remote Sens. 2022, 14, 2127. [Google Scholar] [CrossRef]
- Tucker, C.J. Red and photographic infrared linear combinations for monitoring vegetation. Remote Sens. Environ. 1979, 8, 127–150. [Google Scholar] [CrossRef] [Green Version]
- Gao, B.C. NDWI—A normalized difference water index for remote sensing of vegetation liquid water from space. Remote Sens. Environ. 1996, 58, 257–266. [Google Scholar] [CrossRef]
- Bramhe, V.S.; Ghosh, S.K.; Garg, P.K. Extraction of built-up area by combining textural features and spectral indices from landsat-8 multispectral image. Int. Arch. Photogramm. Remote Sens. Spat. Inf. Sci. 2018, 42, 727–733. [Google Scholar] [CrossRef] [Green Version]
- Rasul, A.; Balzter, H.; Ibrahim, G.R.F.; Hameed, H.M.; Wheeler, J.; Adamu, B.; Ibrahim, S.; Najmaddin, P.M. Applying built-up and bare-soil indices from Landsat 8 to cities in dry climates. Land 2018, 7, 81. [Google Scholar] [CrossRef] [Green Version]
- Guisan, A.; Weiss, S.B.; Weiss, A.D. GLM versus CCA spatial modeling of plant species distribution. Plant Ecol. 1999, 143, 107–122. [Google Scholar] [CrossRef]
- Weiss, A. Topographic position and landforms analysis. In Proceedings of the Poster Presentation, ESRI User Conference, San Diego, CA, USA, 9–13 July 2001; Volume 200. [Google Scholar]
- De Reu, J.; Bourgeois, J.; Bats, M.; Zwertvaegher, A.; Gelorini, V.; De Smedt, P.; Chu, W.; Antrop, M.; De Maeyer, P.; Finke, P.; et al. Application of the topographic position index to heterogeneous landscapes. Geomorphology 2013, 186, 39–49. [Google Scholar] [CrossRef]
- Jin, K.; Wang, F.; Han, C.; Shi, S.; Ding, W. Impacts of climate change and human activities on NDVI change of vegetation in China from 1982 to 2015. J. Geogr. 2020, 75, 961–974. [Google Scholar]
- Li, H.; Liu, G.; Fu, B. Response of vegetation growth to climate change and human activities in the Three-River Headwaters based on NDVI. Chin. J. Ecol. 2011, 31, 5495–5504. [Google Scholar]
- Zhang, Y.; Fu, B.; Feng, X.; Pan, N. Response of ecohydrological variables to meteorological drought under climate change. Remote Sens. 2022, 14, 1920. [Google Scholar] [CrossRef]
- Yuan, W.; Zheng, Y.; Piao, S.; Ciais, P.; Lombardozzi, D.; Wang, Y.; Ryu, Y.; Chen, G.; Dong, W.; Hu, Z.; et al. Increased atmospheric vapor pressure deficit reduces global vegetation growth. Sci. Adv. 2019, 5, eaax1396. [Google Scholar] [CrossRef] [PubMed] [Green Version]
- Li, P.; Wang, J.; Liu, M.; Xue, Z.; Bagherzadeh, A.; Liu, M. Spatio-temporal variation characteristics of NDVI and its response to climate on the Loess Plateau from 1985 to 2015. Catena 2021, 203, 105331. [Google Scholar] [CrossRef]
- Salinas-Zavala, C.A.; Douglas, A.V.; Diaz, H.F. Interannual variability of NDVI in northwest Mexico. Associated climatic mechanisms and ecological implications. Remote Sens. Environ. 2002, 82, 417–430. [Google Scholar] [CrossRef]
- Yu, W.; Li, J.; Liu, Q.; Zhao, J.; Dong, Y.; Zhu, X.; Lin, S.; Zhang, H.; Zhang, Z. Gap Filling for Historical Landsat NDVI Time Series by Integrating Climate Data. Remote Sens. 2021, 13, 484. [Google Scholar] [CrossRef]
- Bounoua, L.; Collatz, G.J.; Los, S.O.; Sellers, P.J.; Dazlich, D.A.; Tucker, C.J.; Randall, D.A. Sensitivity of climate to changes in NDVI. J. Clim. 2000, 13, 2277–2292. [Google Scholar] [CrossRef] [Green Version]
- Xu, X.; Levy, J.K.; Zhaohui, L.; Hong, C. An investigation of sand—Dust storm events and land surface characteristics in China using NOAA NDVI data. Glob. Planet. Chang. 2006, 52, 182–196. [Google Scholar] [CrossRef]
- Weishou, S.; Hui, Z.; Di, J.; Shouguang, Y.; Haidong, L.; Naifeng, L. The response relation between climate change and NDVI over the Qinghai-Tibet plateau. J. World Acad. Sci. Eng. Technol. 2011, 59, 2216–2222. [Google Scholar]


| Data Name | Format | Spatial Resolution | Time Resolution | Source |
|---|---|---|---|---|
| 2019QZKK0603-zgyjsl | NETCDF | 1000 m | Monthly | NTPDC |
| 2019QZKK0603-zgypjw | NETCDF | 1000 m | Monthly | NTPDC |
| MOD13A3 | HDF | 250 m | Monthly | NASA |
| SRTM DEM | Tiff | 250 m | — | USGS |
| Landsat 5, 7, 8 | HDF | 1000 m | Seasonal | NASA |
| Names | Formulas | References |
|---|---|---|
| Normalized Difference Vegetation Index (NDVI) | (NIR − Red)/(NIR + Red) | [37] |
| Normalized Difference Water Index (NDWI) | (NIR − SWIR)/(NIR + SWIR) | [38] |
| Normalized Difference Built-up Index (NDBI) | (SWIR − NIR)/(NIR + SWIR) | [39] |
| Built-up Area Extraction Index (BAEI) | (Red + 0.3)/(Green + SWIR) | [39] |
| Normalized Difference Bareness Index (NDBai) | (SWIR − TIR)/(TIR + SWIR) | [39] |
| Dry Built-up Index (DBI) | (Blue − TIR)/(TIR + Blue) − NDVI | [40] |
| Dry Bare-Soil Index (DBSI) | (SWIR − Green)/(Green + SWIR) − NDVI | [40] |
| Topographic Position Index (TPI) | Elevation − Mean (in 15-pixel radius) | [41,42,43] |
| Slope (VegOBS) | Driving Factors | Classification Criteria for Driving Factors | Contribution Rate of Driving Factors (%) | ||
|---|---|---|---|---|---|
| Slope (VegCC) | Slope (VegHA) | Natural Factors | Human Activities | ||
| >0 | CC and HA | >0 | >0 | Slope (VegCC)/Slope (VegOBS) | Slope (VegHA)/Slope (VegOBS) |
| CC | >0 | <0 | 100 | 0 | |
| HA | <0 | >0 | 0 | 100 | |
| <0 | CC and HA | <0 | <0 | Slope (VegCC)/Slope (VegOBS) | Slope (VegHA)/Slope (VegOBS) |
| CC | <0 | >0 | 100 | 0 | |
| HA | >0 | <0 | 0 | 100 | |
| Year | OA (%) | Kappa (Unitless) |
|---|---|---|
| 2000 | 85.16% | 0.828 |
| 2010 | 87.53% | 0.841 |
| 2020 | 84.74% | 0.816 |
Publisher’s Note: MDPI stays neutral with regard to jurisdictional claims in published maps and institutional affiliations. |
© 2022 by the authors. Licensee MDPI, Basel, Switzerland. This article is an open access article distributed under the terms and conditions of the Creative Commons Attribution (CC BY) license (https://creativecommons.org/licenses/by/4.0/).
Share and Cite
Wang, Z.; Bai, T.; Xu, D.; Kang, J.; Shi, J.; Fang, H.; Nie, C.; Zhang, Z.; Yan, P.; Wang, D. Temporal and Spatial Changes in Vegetation Ecological Quality and Driving Mechanism in Kökyar Project Area from 2000 to 2021. Sustainability 2022, 14, 7668. https://doi.org/10.3390/su14137668
Wang Z, Bai T, Xu D, Kang J, Shi J, Fang H, Nie C, Zhang Z, Yan P, Wang D. Temporal and Spatial Changes in Vegetation Ecological Quality and Driving Mechanism in Kökyar Project Area from 2000 to 2021. Sustainability. 2022; 14(13):7668. https://doi.org/10.3390/su14137668
Chicago/Turabian StyleWang, Ziyi, Tingting Bai, Dong Xu, Juan Kang, Jian Shi, He Fang, Cong Nie, Zhijun Zhang, Peiwen Yan, and Dingning Wang. 2022. "Temporal and Spatial Changes in Vegetation Ecological Quality and Driving Mechanism in Kökyar Project Area from 2000 to 2021" Sustainability 14, no. 13: 7668. https://doi.org/10.3390/su14137668
APA StyleWang, Z., Bai, T., Xu, D., Kang, J., Shi, J., Fang, H., Nie, C., Zhang, Z., Yan, P., & Wang, D. (2022). Temporal and Spatial Changes in Vegetation Ecological Quality and Driving Mechanism in Kökyar Project Area from 2000 to 2021. Sustainability, 14(13), 7668. https://doi.org/10.3390/su14137668