Article

Quality-Based Supplier Selection Model for Products with Multiple Quality Characteristics

1
Department of Industrial Engineering and Management, National Chin-Yi University of Technology, Taichung 411030, Taiwan
2
Department of Business Administration, Asia University, Taichung 413305, Taiwan
3
Department of Business Administration, Chaoyang University of Technology, Taichung 413310, Taiwan
4
Department of Industrial Education and Technology, National Changhua University of Education, Changhua 50074, Taiwan
5
Department of Industrial Engineering and Management, National Yang Ming Chiao Tung University, Hsinchu 300093, Taiwan
*
Author to whom correspondence should be addressed.
Sustainability 2022, 14(14), 8532; https://doi.org/10.3390/su14148532
Submission received: 27 April 2022 / Revised: 8 July 2022 / Accepted: 9 July 2022 / Published: 12 July 2022
(This article belongs to the Section Sustainable Engineering and Science)

Abstract

:
The concept of Industry 4.0 was first proposed by the German government in 2011. As the Internet of Things (IoT) becomes more prevalent and big data analysis technology becomes more mature, it is beneficial for the manufacturing industry to integrate and apply the related technologies to pursue the goal of smart manufacturing. Taiwan’s machine tool industry and downstream machine-tool purchasers, who are scattered around the world, have formed a machine-tool industry chain. To help the machine-tool industry and the suppliers of important components boost their process capabilities, ensure the final product quality of machine tools and improve the process capabilities of the entire industry chain, this study used radar charts to present the statistical testing information of the process capabilities of all quality characteristics, so that managers could have more complete information when evaluating and selecting appropriate suppliers. As noted in many studies, improving product quality and availability can reduce not only the rate of reworking and scrappage during production but also the frequency of maintenance or replacement of components after purchase. As a result, the loss of costs caused by reworking, scrappage, and maintenance can be diminished, carbon emissions can be lowered, and environmental pollution can be reduced as well, which will help to achieve sustainable operation in the entire machine tool industry chain.

1. Introduction

According to many studies, Industry 4.0 was proposed by the German government in 2011, aiming to link information, communication technologies, and digital manufacturing technologies to promote a fully networked production environment for smart manufacturing [1,2,3]. In addition, the machine-tool industry is a cornerstone of the manufacturing industry. Various machine tools are utilized to process important components for various types of manufacturing equipment. Thus, the machine tool plays a critical role in the development of the entire machinery industry. The Gardner world machine tool survey indicated that Taiwan was the world’s seventh-largest machine tool producer and the fourth-largest machine tool exporter in 2020. Chen et al. [4] and Lin et al. [5] postulated that in order to meet market demand and enhance industrial competitiveness, the quality of machine tools needs to be enhanced to reduce the impact of the international market. The process quality level of all components also needs to be improved, so as to increase the overall product quality level and the availability of better machine tools [6,7,8,9,10]. In addition, in the face of the climate change crisis, numerous studies have addressed issues related to implementing the circular economy and achieving sustainable production [11,12,13,14,15,16]. Studies have indicated that Industry 4.0 and quality are key factors in the machinery industry [17,18,19]; in the face of global warming, these factors will promote the circular economy and achieve sustainable production [20,21,22,23,24,25]. Improving process quality can decrease the ratios of reworking and scrappage during the process of production, as well as reduce the frequency of maintenance or replacement after purchase. Consequently, not only does this lessen the cost of rework, scrap, and maintenance, as well as the harm caused by environmental pollution, but it also contributes to the sustainability of enterprises and that of the environment [26,27,28,29,30].
In fact, a machine tool is assembled from hundreds or sometimes even thousands of components. The quality level of each component must meet the required quality level so that the quality or function of the final product of the machine tool can be ensured [23,31,32]. Thus, carefully selecting suppliers is apparently an important issue. According to the research of Weber et al. [33], quality, delivery time, and price are the three critical factors for supplier selection. Many studies apply process capability indices to supplier selection. For example, Chen and Chen [34] used process capability index ratios as the basis for selecting suppliers; Lin et al. [32] adopted the probability density function for the estimator ratios of process yield indicators, to perform a two-stage one-tailed hypothesis test for supplier selection. C.W. Wu et al. [9] and Y. Wu et al. [10] established a fuzzy selection model for evaluating suppliers with different process capability indices. Chen et al. [25] developed a fuzzy green supplier selection model using the Six Sigma quality indices. The abovementioned studies are all based on the quality of a single quality characteristic used to select suppliers. Nevertheless, according to numerous studies, each component usually has multiple quality characteristics. The quality of production in each quality characteristic must meet the manufacturing requirements, to ensure that the production of the components meets the required standard [29,31,32]. Therefore, this paper will propose a quality-based supplier selection model for products with multiple quality characteristics.
Some studies have pointed out that when selecting suppliers, calculating point estimates of indices directly from the sample data is a fairly convenient and easy-to-use technique in practice, but its disadvantage is that misjudgments will be caused by sampling error [35]. Therefore, some researchers have advocated that suppliers can be selected through the statistical testing method of indices to improve the punctiliousness of the selection [9,10,25,29,32,34]. In fact, performing statistical testing through the upper confidence limits of the indices ensures the reduction of producer risk [36,37,38]. Additionally, some studies have indicated that all the quality characteristics of the product must meet the requirements of the quality level so that the high standard of the final product can be guaranteed [39,40]. Many studies in the literature have stated that the radar chart is a visual evaluation tool [41,42,43]; therefore, this paper uses many radar lines as a process quality evaluation tool to assess a particular supplier’s product with multiple quality characteristics. This evaluation tool allows machine-tool manufacturers and suppliers to control the in-process quality of each quality characteristic at the same time, to ensure the quality of the final product. Meanwhile, machine tool manufacturers and their suppliers will form partnerships and grow strong together [29,44]. According to the abovementioned theory and to facilitate its application in the industry, this paper will use the upper confidence limit of the index to deduce the minimum required value ( M V ) as the evaluation standard, which not only employs a practical and easy-to-use point estimate of the index but can also reduce the risk of misjudgment caused by sampling error. Professional data analysis of the machine tool industry can assist the machining manufacturers (customers) who purchase the machine tools in the evaluation and analysis of process capability. Aiming at improving the quality characteristics affected by insufficient process precision or accuracy, process improvement is carried out to find the best machine parameter settings, formulate a more suitable system for machine repairs and maintenance, and diminish the environmental pollution and energy loss caused by scrapping and rework. Furthermore, the improvement of customers’ product process capabilities can help them increase not only their product value but also their industrial competitiveness [29,30,45,46].
In addition, according to numerous published studies, a product or a component usually contains multiple quality characteristics, including ‘smaller the better’ (STB), ‘larger the better’ (LTB), and ‘nominally the best’ (NTB), all at the same time. Each quality characteristic needs to meet the required quality level, so that the high standard of the final product can be guaranteed [47,48,49]. It is a convenient way for the machine tool industry to grasp the process capabilities of all the quality characteristics of the products purchased from the suppliers that can meet the required quality level. However, it is difficult to see the whole picture of the product if we examine whether all the quality characteristics meet the required standard of quality from the statistical testing results of their process capabilities. Many studies have suggested that the radar chart is a visualized two-dimensional diagram, a practical graphical tool for analysis and management [41,42,43]. Accordingly, this study uses radar charts to present the statistical testing information of the process capabilities for all quality characteristics, so that managers can have more complete information when evaluating and selecting the appropriate suppliers.
We organize the rest of the paper as follows. In Section 2, this study proposes a 6-Sigma quality index, which evaluates all quality characteristics for a product; meanwhile, according to the definition of the 6-Sigma quality level, the relational expression for the required value of the product quality level and that of the individual quality characteristic is derived. In Section 3, the mathematical programming method is adopted, to deduce the upper confidence limit for the 6-Sigma quality index. The minimum required value ( M V ) of the index estimator is also deduced by means of the upper confidence limit and the required value of the quality level. Then, based on the minimum required value ( M V ) and the point estimate of each evaluation index, a product quality radar evaluation chart is established, and evaluation rules are established at the same time. Subsequently, we establish the radar quality evaluation chart and supplier evaluation and selection rules, as well as explain the method for products with multiple quality characteristics in Section 4. In Section 5, a discussion of our findings is offered. Finally, our conclusions and the study’s limitations are presented in Section 6.

2. Research Methodology

This section contains two parts. In the first part, the required value for the quality level of the quality characteristic h is determined based on Boole’s inequality and DeMorgan’s laws. In the second part, the minimum value M V of quality characteristic h is established, and the supplier selection rules are established by a radar quality evaluation chart. The estimated value of the index is the most basic and commonly used statistic regarding the manufacturing site. Directly comparing the estimated value of the index with the minimum value M V , to judge whether the quality level meets the requirements is more in line with practical use. In addition, the radar quality evaluation chart allows machine tool manufacturers and suppliers to grasp the standard of all quality characteristics at the same time, so that they can make improvements in their manufacturing processes to address those characteristics with poor quality levels. The research method of this paper was proposed based on this consideration. Figure 1 displays the flow chart of the methodology process and the mathematical approach adopted in this paper.

2.1. Determination of the Required Value of Quality Level for Quality Characteristic h

As noted above, usually, a product or component has several quality characteristics. If we suppose that a product or component has a total of a quality characteristics, including a 1 unilateral specification quality characteristics and a 2 bilateral specification quality characteristics, then a = a 1 + a 2 . Under the conditions of a normal process, we suppose that the process of quality characteristic h is X h ~ N ( μ h , σ h 2 ) , where μ h is the process mean and σ h is the process standard deviation. As noted by Chang et al. [50], if X h is of the smaller-the-better (STB) type, then 0 < X h U S L h , the target is zero, and d h = U S L h 0 = U S L h . Similarly, if X h is of the larger-the-better (LTB) type, then L S L h X h , the target is 2 L S L h , and d h = 2 L S L h L S L h = L S L h . Moreover, if X h is of the nominally-the-best (NTB) type, then L S L h X h U S L h , the target is T h = ( U S L h + L S L h ) / 2 , and d h = ( U S L h L S L h ) / 2 , where U S L h is the upper specification limit and L S L h is the lower specification limit. According to Chen et al. [4]:
Y h = X h T h d h .
Then, Y h ~ N ( δ h , γ h 2 ) and the 6-Sigma quality indices for quality characteristic h are displayed as follows:
Q p h = { 1 δ h γ h + 1.5 ,   f o r   S T B 1 + δ h γ h + 1.5 ,   f o r L T B m i n ( 1 δ h γ h + 1.5 , 1 + δ h γ h + 1.5 ) ,   f o r N T B ,
where δ h = ( μ h T h ) / d h and γ h = σ h / d h , h = 1 , 2 , , a . As noted by Chen et al. [4], the process reaches k σ quality level if | δ h | 1.5 σ h and γ h = 1 / k ; then, the value of the index is at least equal to k. Let event E h be the event representing the situation where the quality of the quality characteristic is qualified, and its complementary set E h c be the event representing the situation where the quality of the quality characteristic is unqualified; then, the yield of quality characteristic h is p h , p ( E h ) p h = 2 Φ ( Q p h 1.5 ) 1 , and p ( E h c ) q h = 2 2 Φ ( Q p h 1.5 ) , where Φ ( · ) is the cumulative function of the standard normal distribution. Only when the process quality for each quality characteristic meets the quality level required by customers can the resulting products be considered fit for purpose. Thus, E T = E h . Based on Boole’s inequality and DeMorgan’s law, we have:
p ( E T ) = p ( E h ) 1 p ( E h c ) = 1 2 h = 1 a [ 1 Φ ( Q p h 1.5 ) ] .
Many studies have claimed that if the required product quality level is k σ , then the quality level of each quality characteristic must be higher than k σ . In other words, when the quality level of each quality characteristic reaches k σ ( Q p h = k ) , then k must be larger than or equal to k ( k k ), so that the product quality level will have the chance to reach k σ [29,30]. As noted above, if the process reaches the k σ quality level ( | δ h | 1.5 σ h and γ h = 1 / k ), then:
p ( E T ) p ( k ) = Φ ( k 1.5 ) + Φ ( k + 1.5 ) 1 .
Based on Equations (3) and (4), we have:
Φ ( k 1.5 ) + Φ ( k + 1.5 ) 1 = 1 2 a [ 1 Φ ( k 1.5 ) ] .
Equivalently,
k = Φ 1 { 1 2 Φ ( k 1.5 ) Φ ( k + 1.5 ) 2 a } + 1.5 .
For example, we assume that a product has 5 quality characteristics in total. If the quality level of the product is required to reach 6 Sigma, then we can follow Equation (6) to calculate that the quality level of each important quality characteristic must reach 6.467 Sigma, in order to ensure that the product reaches the quality level target of 6 Sigma.

2.2. Establishing Supplier Selection Rules, Based on MV and the Radar Quality Evaluation Chart

As far as Taiwan’s machine tool industry chain is concerned, machine tool manufacturers will start to manufacture a product after receiving orders, and a high proportion of components will be outsourced or purchased from suppliers [51]. In order not to lose generality, this study assumes that there are s suppliers of a component to be selected, and there is a total of a quality characteristics for the component as described above. Let random variable Y m , h denote the process of quality characteristic h for supplier m, where m = 1 , 2 , , s . Thus, under normal conditions, the random variable Y m , h is distributed as N ( δ m h , γ m h 2 ) . Let ( Y m , h , 1 , , Y m , h , j , , Y m , h , n ) be a set of sample data of the quality characteristic h for the supplier m with a sample size of n. Then, the maximum likelihood estimations (MLEs) of δ m h and γ m h are expressed, respectively, as follows:
δ m h * = 1 n j = 1 n Y m , h , j
and
γ m h * = 1 n j = 1 n ( Y m , h , j δ m h * ) 2 .
Thus, the estimators of the 6-Sigma quality indices of the quality characteristic h for supplier m are presented below:
Q p m h * = { 1 δ m h * γ m h * + 1.5   f o r   S T B 1 + δ m h * γ m h * + 1.5   f o r L T B m i n ( 1 δ m h * γ m h * + 1.5 , 1 + δ m h * γ m h * + 1.5 )   f o r N T B .
Where the random variables are T = n ( δ m h * δ m h ) / γ m h * and K = n γ m h * 2 / γ m h 2 , then T and K are distributed as t n 1 and χ n 1 2 , respectively. Thus:
p { t α / 4 ; n 1 T t α / 4 ; n 1 } = 1 α / 2
and
p { χ α / 4 ; n 1 2 K χ 1 α / 4 ; n 1 2 } = 1 α / 2 .
Equivalently,
p { δ h * t α / 4 ; n 1 n γ h * δ h δ h * + t α / 4 ; n 1 n γ h * } = 1 α / 2
and
p { n χ 1 α / 4 ; n 1 2 γ h * γ h n χ α / 4 ; n 1 2 γ h * } = 1 α / 2 ,
where t α / 4 ; n 1 is the upper α / 4 quantile of t n 1 , and χ ; n 1 2 is the lower quantile of χ n 1 2 . To derive the ( 1 α ) × 100 % lower confidence limits of index Q p m h , this study defines event A m h and event B m h as follows:
A m h = { δ m h * t α / 4 ; n 1 n γ m h * δ m h δ m h * + t α / 4 ; n 1 n γ m h * }
and
B m h = { n χ 1 α / 4 ; n 1 2 γ m h * γ m h n χ α / 4 ; n 1 2 γ m h * } .
Then, p ( A m h ) = 1 α / 2 and p ( B m h ) = 1 α / 2 . Obviously, p ( A m h C ) = p ( B m h C ) = α / 2 ; based on Boole’s inequality and DeMorgan’s theorem, we have:
B m h p ( A m h B m h ) 1 p ( A m h C ) p ( B m h C ) = 1 α .
Equivalently,
p { δ m h * t α / 4 ; n 1 n γ m h * δ m h δ m h * + t α / 4 ; n 1 n γ m h * , n χ 1 α / 4 ; n 1 2 γ m h * γ m h n χ α / 4 ; n 1 2 γ m h * } = 1 α .
Let ( y m , h , 1 , , y m , h , j , , y m , h , n ) be the observed value of ( Y m , h , 1 , , Y m , h , j , , Y m , h , n ) , where the observed values of δ m h * and γ m h * are expressed, respectively, as follows:
δ m h 0 * = 1 n j = 1 n y m , h , j
and
γ m h 0 * = 1 n j = 1 n ( y m h j δ m h 0 * ) 2 .
Thus, the confidence region CR can be denoted as:
C R = { δ m h 0 * t α / 4 ; n 1 n γ m h 0 * δ m h δ m h 0 * + t α / 4 ; n 1 n γ m h 0 * , n χ 1 α / 4 ; n 1 2 γ m h 0 * γ m h n χ α / 4 ; n 1 2 γ m h 0 * } .
Obviously, this confidence region is a rectangle, and the coordinates of the four corners can be displayed as follows:
Upper   left   corner :   ( δ m h L , γ m h U ) = ( δ m h 0 * t α / 4 ; n 1 n γ m h 0 * , n χ α / 4 ; n 1 2 γ m h 0 * ) ;
Upper   right   corner :   ( δ m h R , γ m h U ) = ( δ m h 0 * + t α / 4 ; n 1 n γ m h 0 * , n χ α / 4 ; n 1 2 γ m h 0 * ) ;
Lower   left   corner :   ( δ m h L , γ m h D ) = ( δ m h * t α / 4 ; n 1 n γ m h * , n χ 1 α / 4 ; n 1 2 γ m h * ) ;
Lower   right   corner :   ( δ m h R , γ m h D ) = ( δ m h * + t α / 4 ; n 1 n γ m h * , n χ 1 α / 4 ; n 1 2 γ m h * ) .
Based on Chen et al. [4], the mathematical programming (MP) method is employed to find the upper confidence limit U Q p m h for Q p m h . The method takes Q p m h as the objective function and the confidence region (CR) as the feasible solution region, as follows:
{ U Q p m h = M a x   Q p m h s .   t .   ( δ m h , γ m h ) C R .
Next, this study solves the upper confident limit, U Q p m h , based on three case studies: (1) δ h L > 0 , (2) 0 ∈ ( δ h L , δ h R ) , and (3) δ h R < 0 . Meanwhile, according to the value of k in Equation (6), the minimum value M V of quality characteristic h is deduced as follows.
(1)
Case 1: δ m h L > 0
In Case 1, we can conclude that δ m h > 0 and Q p m h = ( 1 δ m h ) / γ m h + 1.5 ; then, the MP model can be rewritten as follows:
{ U Q p m h = M a x   ( 1 δ m h ) / γ m h + 1.5 s u b j e c t   t o                δ m h L δ m h δ m h R                γ m h D γ m h γ m h U .
Apparently, the maximum value occurs in the lower left-hand corner of the feasible solution region. Thus, when ( δ m h , γ m h ) = ( δ m h L , γ m h D ) , then an upper confidence limit U Q p m h of index Q p m h is obtained, as follows:
U Q p m h = 1 δ m h L γ m h D + 1.5 = ( 1 δ m h 0 * γ m h 0 * + t α / 4 ; n 1 n ) χ 1 α / 4 ; n 1 2 n + 1.5 .
Based on the value of k and the minimum value M V of quality characteristic h, we have:
( 1 δ m h 0 * γ m h 0 * + t α / 4 ; n 1 n ) χ 1 α / 4 ; n 1 2 n + 1.5 k .
Equivalently, Q p m h * = ( 1 δ m h 0 * ) / γ m h 0 * M V , and:
M V = ( k 1.5 ) n χ 1 α / 4 ; n 1 2 t α / 4 ; n 1 n + 1.5 .
(2)
Case 2: 0 ∈ ( δ m h L , δ m h R )
In Case 2, we can conclude that δ m h = 0 and Q p m h = 1 / γ m h + 1.5 ; then, the MP model can be rewritten as follows:
{ U Q p m h = M a x   1 / γ m h + 1.5 s u b j e c t   t o                γ m h D γ m h γ m h U
Obviously, when ( δ m h , γ m h ) = ( 0 , γ m h D ) , then the upper confidence limit U Q p m h of index Q p m h is received as follows:
U Q p m h = 1 γ m h D + 1.5 = ( 1 γ m h 0 * + t α / 4 ; n 1 n ) χ 1 α / 4 ; n 1 2 n + 1.5 .
Based on the value of k and the minimum value M V of quality characteristic h, we have:
( 1 γ m h 0 * + t α / 4 ; n 1 n ) χ 1 α / 4 ; n 1 2 n + 1.5 k .
Equivalently, Q p m h * = 1 / γ m h 0 * M V , and:
M V = ( k 1.5 ) n χ 1 α / 4 ; n 1 2 t α / 4 ; n 1 n + 1.5 .
(3)
Case 3: δ m h R < 0
In this case, we can conclude that δ m h < 0 and Q p m h = ( 1 + δ m h ) / γ m h + 1.5 ; then, the MP model can be rewritten, as follows:
{ U Q p m h = M a x   ( 1 + δ m h ) / γ m h + 1.5 s u b j e c t   t o                δ m h L δ m h δ m h R                γ m h D γ m h γ m h U .
Obviously, the maximum value occurs in the lower right-hand corner of the feasible solution region. Therefore, when ( δ m h , γ m h ) = ( δ m h R , γ m h D ) , then the upper confidence limit U Q p m h of index Q p m h is obtained, as follows:
U Q p m h = 1 + δ m h L γ m h D + 1.5 = ( 1 + δ m h 0 * γ m h 0 * + t α / 4 ; n 1 n ) χ 1 α / 4 ; n 1 2 n + 1.5 .
Based on the value of k and the minimum value M V of quality characteristic h, we have:
( 1 + δ m h 0 * γ m h 0 * + t α / 4 ; n 1 n ) χ 1 α / 4 ; n 1 2 n + 1.5 k .
Equivalently, Q p m h * = ( 1 + δ m h 0 * ) / γ m h 0 * + 1.5 M V , and:
M V = ( k 1.5 ) n χ 1 α / 4 ; n 1 2 t α / 4 ; n 1 n + 1.5 .
Based on the above, the observed value of Q p m h * is:
Q p m h 0 * = { 1 δ m h 0 * γ m h 0 * + 1.5 , δ m h L > 0 1 γ m h 0 * + 1.5 , δ m h L 0 δ m h R 1 + δ m h 0 * γ m h 0 * + 1.5 , δ m h R < 0 .
The minimum value, M V , of quality characteristic h is:
M V = ( k 1.5 ) n χ 1 α / 4 ; n 1 2 t α / 4 ; n 1 n + 1.5 .
As mentioned earlier, we assume that a total of s suppliers of a component will need to be evaluated and selected, and the component has a total of a quality characteristics. If the required quality level of the product reaches k-Sigma, then it is calculated that the quality level of each important quality characteristic must reach k -Sigma, based on Equation (6). Thus, it can be ensured that the product reaches the target level of k-Sigma quality. Then, the null hypothesis and alternative hypothesis can be defined, as follows:
H 0 :   Q p m h k ;
H 1 :   Q p m h < k .
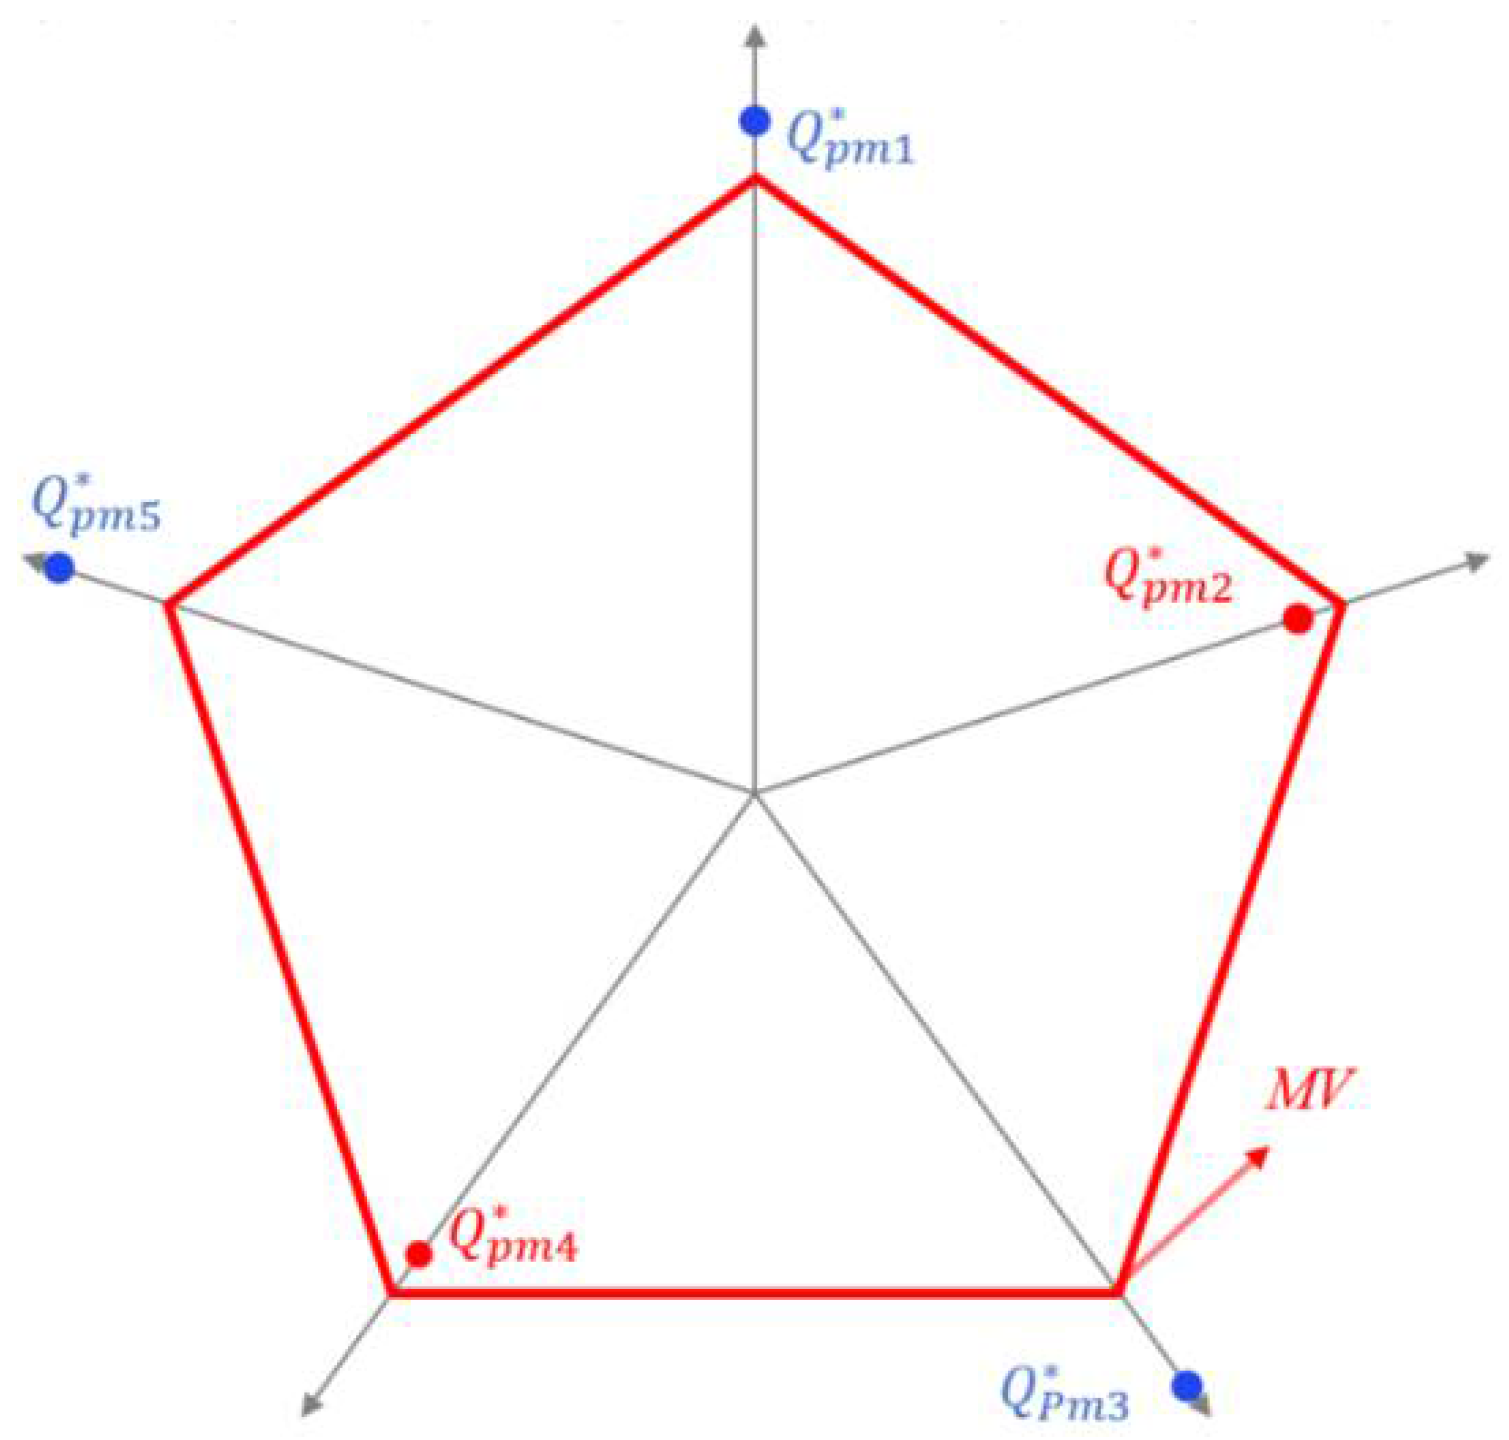
This study used a radar chart, with an a number of radar lines, to evaluate whether the standards of the five quality characteristics could reach the k -Sigma quality level. First, we added marks to the a radar lines at the position of M V units away from the center of the circle, and connected these a-punctuated points to form a pentagonal radar chart control block. Based on the sample data and Equation (38), we calculated a Q p m h 0 * of the s suppliers and marked them on the pentagonal radar chart with a = 5 , as follows.
As can be observed from Figure 2, and based on Equations (38) and (39), the statistical testing rules can be stated with the following conditions:
(1)
If Q p m h 0 * M V , then do not reject H 0 and conclude that Q p m h k .
(2)
If Q p m h 0 * < M V , then reject H 0 and conclude that Q p m h < k .
Obviously, when more quality characteristics reach the k -Sigma quality level, this means that the product of supplier m is of better quality. Based on this concept, the supplier evaluation index can be defined as follows:
E I m = h = 1 a I m h a ,
where:
I m h = { 1 ,   Q p m h 0 * M V 0 ,   Q p m h 0 * < M V .
Apparently, when the observed values for all quality characteristics are greater than k , the evaluation index of supplier m can be depicted as E I m = 1 , showing that the component provided by supplier m reaches the quality level of k-Sigma; therefore, the machine tool manufacturer should consider purchasing the component from that supplier. If the supply of the manufacturer whose quality level reaches k-Sigma is insufficient, we can help another supplier whose partial quality characteristics do not meet the required quality level to improve their product quality and then form a partnership.

3. An Application Example

As mentioned earlier, the radar chart is a visual and practical graphical tool for analysis and management. Next, based on the above statistical testing rules, this study has established a radar quality evaluation chart to evaluate suppliers’ products with multiple quality characteristics. Using the evaluation results of the radar quality evaluation chart, several supplier selection rules were set. First, the minimum required value ( M V ) was placed on each radar line. Meanwhile, all the values were connected to form a regular a-shaped quality-control block. Based on the statistical testing rules, when the point estimate of the indicator falls into the radar chart control block ( Q p m h 0 * < M V ), this means that the quality of quality characteristic h for supplier m does not reach the required quality level. As a result, improvements need to be made. When the point estimate of the indicator does not fall into the radar chart control block ( Q p m h 0 * M V ), this means that the standard of quality characteristic h for supplier m meets the required quality level. Then, based on Equation (6), we can solve it for the value of k . After developing this model, the current study took a machine tool company in central Taiwan as an example, in which a bearing was a common, standardized, and important component that the company must purchase from a supplier. There were three suppliers ( s = 3 ) that the company wanted to evaluate, and the desired component had 5 important quality characteristics (a = 5). The observed value of ( Y m , h , 1 , , Y m , h , j , , Y m , h , 25 ) was ( y m , h , 1 , , y m , h , j , , y m , h , 25 ) , with a sample size of n = 25 for m = 1 , 2 , 3 and h = 1 , 2 , 3 , 4 , 5 . Since the standard for procurement was that the process quality of the component should reach 6-Sigma quality level ( k = 6 ), then:
k = Φ 1 { 1 2 Φ ( k 1.5 ) Φ ( k + 1.5 ) 2 a } + 1.5 = Φ 1 { 1 2 Φ ( 4.5 ) Φ ( 7.5 ) 10 } + 1.5 = 6.47
Similarly, based on Equation (39), we solve it to establish the value of M V , as follows:
M V = ( k 1.5 ) n χ 1 α / 4 ; n 1 2 t α / 4 ; n 1 n + 1.5 = ( 6.47 1.5 ) 25 42.12 2.70 25 + 1.5 = 4.79 .
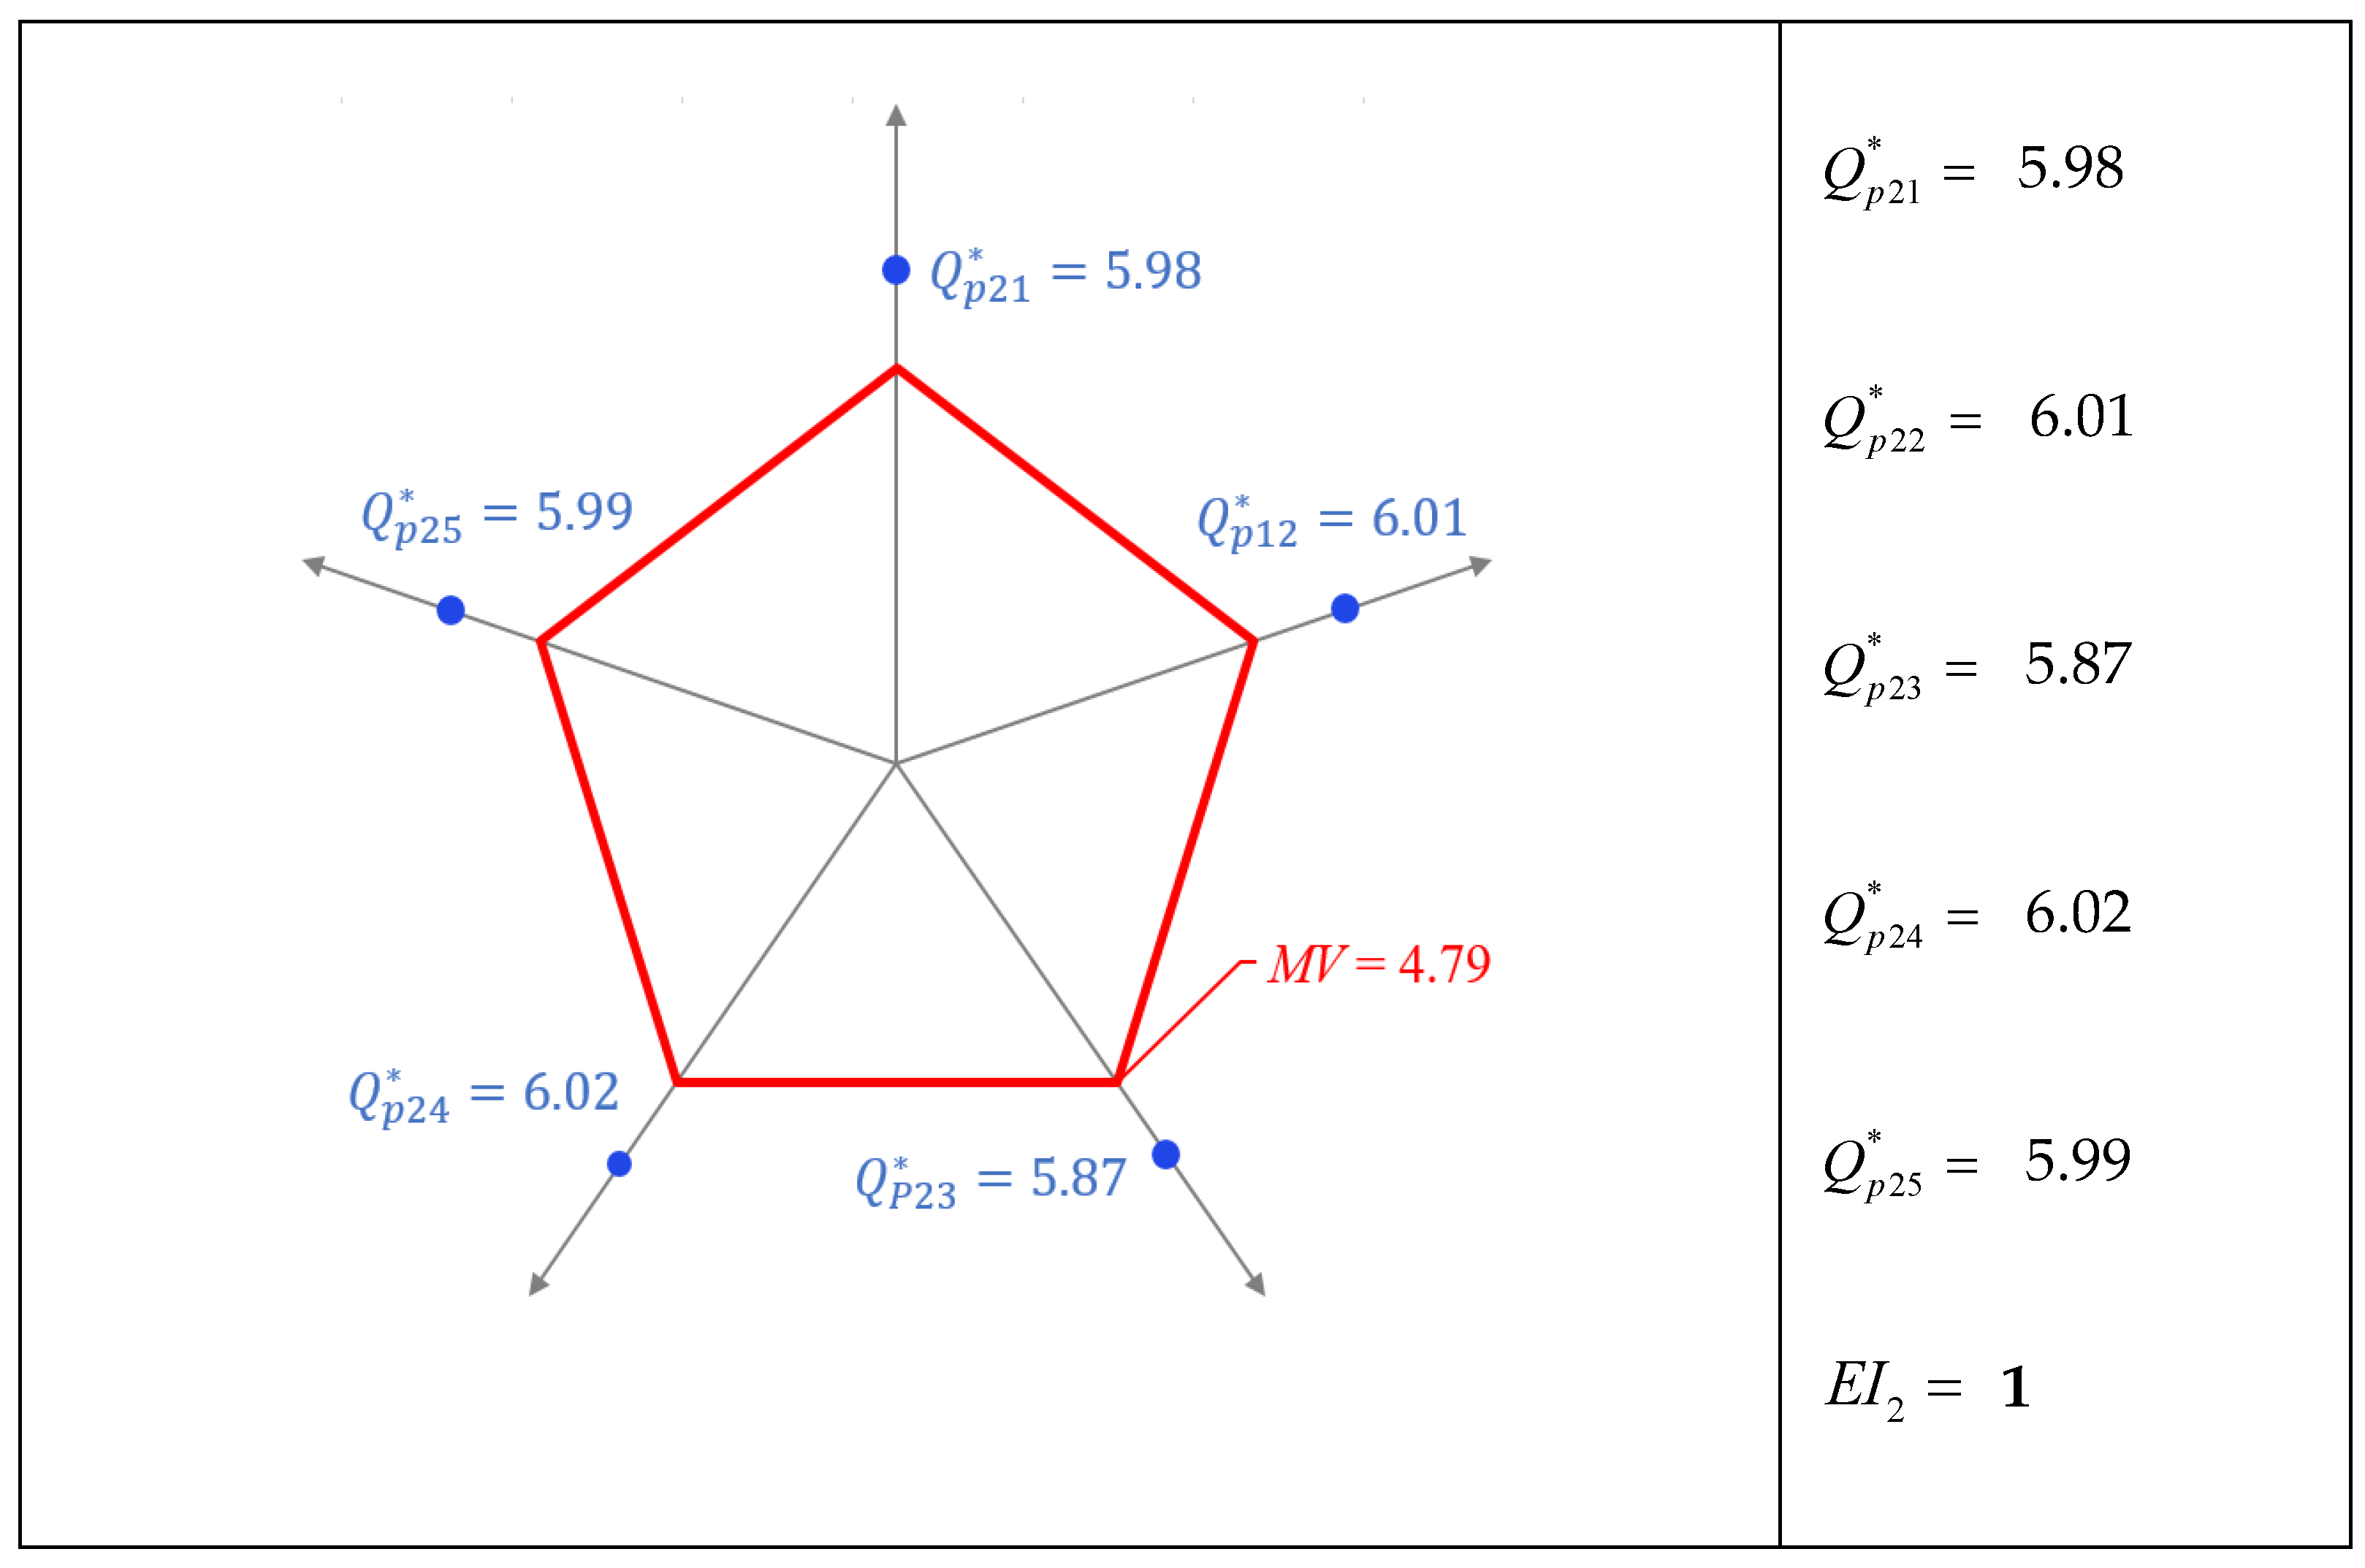
Based on the above, the radar chart with five radar lines evaluates whether the quality of the five quality characteristics could reach the 6.47-Sigma quality level. First, we punctuated the five radar lines at the position of 4.79 units away from the center of the circle ( M V = 4.79) and connected these five punctuated points to form a pentagonal radar chart control block. Based on the sample data and Equation (38), we calculated 5 Q p m h 0 * and the value of the supplier evaluation index of the three suppliers, and marked them on the pentagonal radar chart (Figure 3, Figure 4 and Figure 5) as follows:
Supplier 1 ( m = 1):
According to the sample data ( y 1 , h , 1 , , y 1 , h , j , , y 1 , h , 25 ) and Equations (18), (19) and (38), we calculated the values of δ 1 h 0 * , γ 1 h 0 * , and Q p 1 h 0 * , h = 1 , 2 , 3 , 4 , 5 as follows:
Quality characteristic 1: δ 110 * = 0.238, r 110 * = 0.195, Q p 110 * = 5.41;
Quality characteristic 2: δ 120 * = 0.177, r 120 * = 0.223, Q p 120 * = 5.19;
Quality characteristic 3: δ 130 * = 0.270, r 130 * = 0.191, Q p 130 * = 5.32;
Quality characteristic 4: δ 140 * = 0.209, r 140 * = 0.251, Q p 140 * = 4.65;
Quality characteristic 5: δ 150 * = 0.207, r 150 * = 0.221, Q p 150 * = 5.09;
EI 1 = ( I 11 + I 12 + I 13 + I 14 + I 15 ) / 5 = ( 1 + 1 + 1 + 0 + 1 ) / 5 = 4 / 5 .
Figure 3. The quality evaluation radar chart for the five quality characteristics of supplier 1.
Sustainability 14 08532 g003
Supplier 2 (m = 2):
According to the sample data ( y 2 , h , 1 , , y 2 , h , j , , y 2 , h , 25 ) and Equations (18), (19), and (38), we calculated the values of δ 2 h 0 * , γ 2 h 0 * , and Q p 2 h 0 * , h = 1 , 2 , 3 , 4 , 5 , as follows:
Quality characteristic 1: δ 210 * = 0.274, r 210 * = 0.162, Q p 210 * = 5.98;
Quality characteristic 2: δ 220 * = 0.287, r 220 * = 0.158, Q p 220 * = 6.01;
Quality characteristic 3: δ 230 * = 0.218, r 230 * = 0.179, Q p 230 * = 5.87;
Quality characteristic 4: δ 240 * = 0.313, r 240 * = 0.152, Q p 240 * = 6.02;
Quality characteristic 5: δ 250 * = 0.304, r 250 * = 0.155, Q p 250 * = 5.99;
E I 2 = ( I 21 + I 22 + I 23 + I 24 + I 25 ) / 5 = ( 1 + 1 + 1 + 1 + 1 ) / 5 = 1 .
Figure 4. The quality evaluation radar chart for five quality characteristics of supplier 2.
Sustainability 14 08532 g004
Supplier 3 (m = 3):
According to the sample data ( y 3 , h , 1 , , y 3 , h , j , , y 3 , h , 25 ) and Equations (18), (19), and (38), we calculated the values of δ 3 h 0 * , γ 3 h 0 * , and Q p 3 h 0 * , h = 1 , 2 , 3 , 4 , 5 as follows:
Quality characteristic 1: δ 310 * = 0.191, r 310 * = 0.221, Q p 310 * = 5.16;
Quality characteristic 2: δ 320 * = 0.218, r 320 * = 0.253, Q p 320 * = 4.59;
Quality characteristic 3: δ 330 * = 0.277, r 330 * = 0.164, Q p 330 * = 5.91;
Quality characteristic 4: δ 340 * = 0.208, r 340 * = 0.253, Q p 340 * = 4.63;
Quality characteristic 5: δ 350 * = 0.283, r 350 * = 0.166, Q p 350 * = 5.82;
E I 3 = ( I 31 + I 32 + I 33 + I 34 + I 35 ) / 5 = ( 1 + 0 + 1 + 0 + 1 ) / 5 = 3 / 5 .
Figure 5. The quality evaluation radar chart for the five quality characteristics of supplier 3.
Sustainability 14 08532 g005

4. Results

Based on the quality evaluation radar chart and according to the evaluation data of the above three suppliers, we carried out the quality evaluation and analysis of the suppliers’ products and calculated the supplier evaluation index values of the three suppliers, as follows:
Supplier 1:
Only Q p 14 * = 4.65 of Supplier 1 falls into the radar chart control block, which means that the quality of this quality characteristic has not reached the 6.47-Sigma quality level and must be improved. Since the index observation value of the only quality characteristic falls into the radar chart control block, the supplier evaluation index is E I 1 = 4 / 5 .
Supplier 2:
The index observation values of all the quality characteristics of Supplier 2 do not fall into the radar chart control block, which means that the quality of all quality characteristics has reached the 6.47-Sigma quality level, and the supplier evaluation index is E I 2 = 1.
Supplier 3:
The values Q p 32 * = 4.59 and Q p 34 * = 4.63 of the supplier fall into the radar chart control block, which means that the quality of these two quality characteristics does not reach the 6.502-Sigma quality level and must be improved. The index observation values of the two quality characteristics fall into the radar chart control block; therefore, the supplier evaluation index is E I 3 = 3/5.
Based on the above, Supplier 2 was selected as the supplier since all quality characteristics meet the quality requirements. In terms of the quality of Supplier 1’s product, only quality characteristic 4 does not meet the requirements. The machine tool manufacturer can further assist Supplier 1 in improving quality characteristic 4 and can build a supplier partnership with Supplier 1. In this way, the machine tool manufacturer can have two suppliers to ensure the quality and quantity of supply. As the suppliers of all the components that make up a machine tool ensure the quality and quantity of the supply, the quality level of the entire machine tool industry chain is ensured.

5. Discussion

A quality-based supplier selection model that is based on the circular economy approach can help the entire machine-tool industry chain to enhance process quality, as well as lower process losses and carbon emissions. These aims are individually discussed below, in terms of (1) suppliers, (2) the machining manufacturers who purchase the machine tools, and (3) the machine tool manufacturers themselves, in the industry chain.
(1) Suppliers
The quality evaluation radar chart above for supplier selection can identify the quality level of all the quality characteristics of the products that are produced by the company’s suppliers. Suppliers can make process improvements to improve the quality characteristics of products with poor quality levels, to enhance product quality levels overall [50]. When the process quality of the supplier is raised from 3-Sigma to 6-Sigma, the defect rate drops from 6.6811% to 0.0003%; the difference between these two numbers is 6.6808%. That is to say, for every 100,000 products produced, there will be 6681 fewer reworked or scrapped products. The carbon emissions of each reworked or scrapped product are multiplied by that percentage so that the number of saved carbon emissions can be converted and calculated. In addition to lessening carbon emissions, this process can lower the cost of loss caused by reworking or scrappage and increase the value of the product [23,28].
(2) Machining manufacturers who purchase machine tools
The machining manufacturers who purchase machine tools adopt the quality evaluation radar chart to control the quality of the processed products because of the resulting improvement of the quality and product reliability of the machine tool produced. This application can help the machining manufacturers (customers) that purchase the machine tools to carry out an evaluation and analysis of process capability to improve the processes in terms of the quality characteristics found with insufficient process quality, find out the best machine parameter settings, formulate a more suitable machine repair and maintenance system, and reduce environmental pollution and the carbon dioxide emissions caused by scrappage and rework. The calculation of carbon emissions is similar to the way in which the suppliers calculate their company’s carbon emissions. More importantly, it can help machining manufacturers to enhance their product value and industrial competitiveness, due to an improvement in their product process capabilities [5].
(3) Machine tool manufacturers
When the quality levels of all components that comprise machine tools are enhanced, the availability and product reliability of the resulting machine tools can be improved as well. In addition to increasing the product life, the amount of maintenance after purchase can be lowered, thereby reducing the cost of losses in terms of maintenance and carbon dioxide emissions. The process costs include labor, transportation, materials, and other costs for repairs. The carbon footprint of a company during the repair process is also affected by transportation and the replacement materials. In addition, the machine tool industry can collect all the available improvement information of the machining manufacturers who purchase the machine tools to create a knowledge base of improvement, as well as to analyze the feedback information. If a problem occurs due to the poor design of particular machine tools, then the design of the next generation of those machine tools can be improved. However, if the problem is caused by the poor quality of some important components of the machine tool, the supplier selection model must be re-examined or revised [5].
In addition, in the machine-tool industry chain, machine tool manufacturers receive orders and then design the machine tools according to customized requirements. As mentioned, due to this specialization of production, most of the components comprising a machine tool are purchased from other suppliers. Therefore, the quality of these components needs to be carefully evaluated to ensure the quality of the final product [6,7,8,9,10]. It is common for customers to send their own engineers to the machining manufacturers’ factories to observe and evaluate the relevant manufacturing and quality control processes before placing their orders. For example, many machining manufacturers in Taiwan have undergone this supplier evaluation to obtain orders from well-known international manufacturers and machine tool makers. The quality-based supplier selection model proposed in this paper is well-matched to such a business model. Its advantages can be listed as follows:
(1)
Statistical testing is performed through the upper confidence limit of the index, which can reduce the probability of a misjudgment caused by a sampling error [29,36,37,38].
(2)
The quality evaluation radar chart offers a quality evaluation method for products with multiple quality characteristics and a selection tool for suppliers. It allows machine-tool manufacturers and suppliers to evaluate the standard of all quality characteristics at the same time and make process improvements in quality characteristics with poor quality levels [39,40].
(3)
When directly comparing the estimated value of the index with the minimum value, M V is employed to determine whether the quality level meets the requirements, which is more in line with its practical use [35].

6. Conclusions and Limitations

In the environment of Industry 4.0, enterprises should promote smart manufacturing and innovation management. From this premise, this study proposed a supplier quality evaluation and analysis model based on the circular economy approach, developed a supplier evaluation index based on the subsequent evaluation results and set out the evaluation rules. Through this model, we can form partnerships with cooperative suppliers and help suppliers to improve their process quality, in order to ensure the final product quality of machine tools. As stated above, using the approach of the circular economy, improving product quality can diminish the cost of losses caused by reworking, scrappage, and maintenance, reduce carbon emissions, and decrease environmental pollution, which is beneficial to achieving sustainable operation in the entire machine-tool industry chain. Meanwhile, this improvement can also ensure the sustainable development of the environment. We examined the evaluation and analysis model proposed by this study and listed its advantages as follows:
(1)
The radar quality evaluation chart assessing a supplier’s product with multiple quality characteristics was used to evaluate the standard for each quality characteristic of the supplier’s product. At a glance, we can see whether each index observation value falls into the radar chart control block and, thence, we can determine whether to carry out improvements.
(2)
The basis of this evaluation is to perform statistical testing using the upper confidence limit of the index, which can control the risk of rejecting otherwise excellent suppliers (producers).
(3)
It is possible to directly judge whether the quality for each quality characteristic has reached the required standard by comparing the point estimate of the index with M V , so that the opportunity for improvement can be grasped.
(4)
The value of M V was derived from the upper confidence limit and the required value of the index, which can lower the risk of misjudgments resulting from sampling error.
(5)
According to the evaluation results of the radar quality evaluation charts of suppliers’ products that display multiple quality characteristics, supplier evaluation indicators and selection rules were set that can help the cooperating suppliers to improve their product quality and form partnerships to ensure the quality of the final product, the machine tools.
As stated above, the proposed supplier evaluation model is ideal for resident inspectors to evaluate their suppliers. Orders will be placed only when the suppliers under consideration meet the quality requirements. However, if we were to apply the supplier selection model in this paper to a business model different from the one described above, it would probably function in much the same way as a supplier selection model that only focuses on the value of the product quality index; the functions, described above, that can help improve the machine tool industry chain cannot be achieved. In addition, if the process distribution is not in a normal distribution, there is a relatively large error in the statistical tests. This issue could, therefore, be a focus of future research.

Author Contributions

Conceptualization, K.-S.C., M.-C.H. and C.-M.Y.; methodology, K.-S.C. and C.-M.Y.; software, H.-Y.C.; validation, M.-C.H.; formal analysis, K.-S.C. and C.-M.Y.; investigation, M.-C.H.; resources, M.-C.H.; data curation, H.-Y.C.; writing—original draft preparation, K.-S.C., M.-C.H., C.-M.Y. and H.-Y.C.; writing—review and editing, K.-S.C. and C.-M.Y.; visualization, M.-C.H. and H.-Y.C.; supervision, K.-S.C.; project administration, C.-M.Y.; All authors have read and agreed to the published version of the manuscript.

Funding

This research received no external funding.

Institutional Review Board Statement

Not applicable.

Informed Consent Statement

Not applicable.

Data Availability Statement

Not applicable.

Conflicts of Interest

The authors declare no conflict of interest.

References

  1. Kang, H.S.; Lee, J.Y.; Choi, S.; Kim, H.; Park, J.H.; Son, J.Y.; Kim, B.H.; Noh, S.D. Smart manufacturing: Past research, present findings, and future directions. Int. J. Precis. Eng. Manuf.-Green Technol. 2016, 3, 111–128. [Google Scholar] [CrossRef]
  2. Xu, L.D.; Xu, E.L.; Li, L. Industry 4.0: State of the art and future trends. Int. J. Prod. Res. 2018, 56, 2941–2962. [Google Scholar] [CrossRef] [Green Version]
  3. Huang, C.T.; Lai, K.K. Process Quality Evaluation Model with Taguchi Cost Loss Index. Appl. Sci. 2021, 11, 10182. [Google Scholar] [CrossRef]
  4. Chen, K.S.; Chen, H.T.; Chang, T.C. The construction and application of Six Sigma quality indices. Int. J. Prod. Res. 2017, 55, 2365–2384. [Google Scholar] [CrossRef]
  5. Lin, K.P.; Yu, C.M.; Chen, K.S. Production data analysis system using novel process capability indices-based circular economy. Ind. Manag. Data Syst. 2019, 119, 1655–1668. [Google Scholar] [CrossRef]
  6. Chen, K.S.; Yang, S.L.; Chen, H.T. Process improvement capability index with cost—A modeling method of mathematical programming. Appl. Math. Model. 2015, 39, 1577–1586. [Google Scholar] [CrossRef]
  7. Lei, D.; Hitt, M.A. Strategic restructuring and outsourcing: The effect of mergers and acquisitions and LBOs on building firm skills and capabilities. J. Manag. Stud. 1995, 21, 835–859. [Google Scholar] [CrossRef]
  8. Pearn, W.L.; Liao, M.Y.; Wu, C.W.; Chu, Y.T. Two tests for supplier selection based on process yield. J. Test. Eval. 2011, 39, 126–133. [Google Scholar] [CrossRef]
  9. Wu, C.W.; Liao, M.Y.; Yang, T.T. Efficient methods for comparing two process yields—Strategies on supplier selection. Int. J. Prod. Res. 2013, 51, 1587–1602. [Google Scholar] [CrossRef]
  10. Wu, Y.; Chen, K.; Zeng, B.; Xu, H.; Yang, Y. Supplier selection in nuclear power industry with extended VIKOR method under linguistic information. Appl. Soft Comput. 2016, 48, 444–457. [Google Scholar] [CrossRef]
  11. Acerbi, F.; Sassanelli, C.; Terzi, S.; Taisch, M. A Systematic Literature Review on Data and Information Required for Circular Manufacturing Strategies Adoption. Sustainability 2021, 13, 2047. [Google Scholar] [CrossRef]
  12. Rosa, P.; Sassanelli, C.; Urbinati, A.; Chiaroni, D.; Terzi, S. Assessing relations between Circular Economy and Industry 4.0: A systematic literature review. Int. J. Prod. Res. 2020, 58, 1662–1687. [Google Scholar] [CrossRef] [Green Version]
  13. Sassanelli, C.; Rosa, P.; Terzi, S. Supporting disassembly processes through simulation tools: A systematic literature review with a focus on printed circuit boards. J. Manuf. Syst. 2021, 60, 429–448. [Google Scholar] [CrossRef]
  14. Walzberg, J.; Lonca, G.; Hanes, R.J.; Eberle, A.L.; Carpenter, A.; Heath, G.A. Do We Need a New Sustainability Assessment Method for the Circular Economy? A Critical Literature Review. Front. Sustain. 2021, 1, 620047. [Google Scholar] [CrossRef]
  15. Sridhar, A.; Kapoor, A.; Senthil Kumar, P.; Ponnuchamy, M.; Balasubramanian, S.; Prabhakar, S. Conversion of food waste to energy: A focus on sustainability and life cycle assessment. Fuel 2021, 302, 121069. [Google Scholar] [CrossRef]
  16. Rajput, S.; Singh, S.P. Connecting circular economy and industry 4.0. Int. J. Inf. Manag. 2019, 49, 98–113. [Google Scholar] [CrossRef]
  17. Sassanelli, C.; Rossi, M.; Terzi, S. Evaluating the smart maturity of manufacturing companies along the product development process to set a PLM project roadmap. Int. J. Prod. Lifecycle Manag. 2020, 12, 185–209. [Google Scholar] [CrossRef]
  18. Sassanelli, C.; De Carolis, A.; Terzi, S. Initiating an industrial machinery producer to digital servitization: A case study. In Proceedings of the 18th IFIP WG 5.1 International Conference, PLM 2021, Curitiba, Brazil, 11–14 July 2021; IFIP Advances in Information and Communication Technology Virtual, Online. Springer: Cham, Switzerland, 2021; pp. 483–493. [Google Scholar] [CrossRef]
  19. Sassanelli, C.; De Carolis, A.; Terzi, S. Integrating Failure Mode, Effect and Criticality Analysis in the Overall Equipment Effectiveness Framework to Set a Digital Servitized Machinery: An Application Case. In Proceedings of the IFIP WG 5.7 International Conference, APMS 2021, Nantes, France, 5–9 September 2021; IFIP International Federation for Information Processing. Dolgui, A., Ed.; Springer: Cham, Switzerland, 2021; pp. 143–152. [Google Scholar] [CrossRef]
  20. Appolloni, A.; Chiappetta Jabbour, C.J.; D’Adamo, I.; Gastaldi, M.; Settembre-Blundo, D. Green recovery in the mature manufacturing industry: The role of the green-circular premium and sustainability certification in innovative efforts. Ecol. Econ. 2022, 193, 107311. [Google Scholar] [CrossRef]
  21. Chiappetta Jabbour, C.J.; Fiorini, P.D.C.; Ndubisi, N.O.; Queiroz, M.M.; Piato, É.L. Digitallyenabled sustainable supply chains in the 21st century: A review and a research agenda. Sci. Total Environ. 2020, 725, 138177. [Google Scholar] [CrossRef]
  22. Sharma, R.; Jabbour, C.J.C.; Lopes de Sousa Jabbour, A.B. Sustainable manufacturing and industry 4.0: What we know and what we don’t. J. Enterp. Inf. Manag. 2020, 34, 230–266. [Google Scholar] [CrossRef]
  23. Chang, T.C.; Chen, K.S.; Yu, C.M. Process quality assessment model of hand tools: A case study on the handle of ratchet torque wrench. Int. J. Reliab. Qual. Saf. Eng. 2016, 23, 1650017. [Google Scholar] [CrossRef]
  24. Yu, K.T.; Chen, K.S. Testing and analysing capability performance for products with multiple characteristics. Int. J. Prod. Res. 2016, 54, 6633–6643. [Google Scholar] [CrossRef]
  25. Chen, K.S.; Wang, C.H.; Tan, K.H. Developing a fuzzy green supplier selection model using Six Sigma quality indices. Int. J. Prod. Econ. 2019, 212, 1–7. [Google Scholar] [CrossRef]
  26. Chen, K.S.; Wang, C.H.; Tan, K.H.; Chiu, S.F. Developing one-sided specification Six-Sigma fuzzy quality index and testing model to measure the process performance of fuzzy information. Int. J. Prod. Econ. 2019, 208, 560–565. [Google Scholar] [CrossRef]
  27. Chiou, K.C.; Chen, K.S. Lifetime performance evaluation model based on quick response thinking. Eksploat. Niezawodn.-Maint. Reliab. 2022, 24, 1–6. [Google Scholar] [CrossRef]
  28. Nguyen, T.T.; Duong, Q.D.; Mia, M. Multi-response optimization of the actively driven rotary turning for energy efficiency, carbon emissions, and machining quality. Proc. Inst. Mech. Eng. Part B J. Eng. Manuf. 2021, 235, 2155–2173. [Google Scholar] [CrossRef]
  29. Chen, K.S.; Yu, C.M. Dual dimensional fuzzy testing based on the upper confidence limits for supplier selection. J. Intell. Fuzzy Syst. 2021, 40, 11145–11158. [Google Scholar] [CrossRef]
  30. Chen, K.S.; Yu, C.M. Fuzzy decision-making model for process quality improvement of machine tool industry chain. J. Intell. Fuzzy Syst. 2022, 42, 1547–1558. [Google Scholar] [CrossRef]
  31. Wu, M.F.; Chen, H.Y.; Chang, T.C.; Wu, C.F. Quality evaluation of internal cylindrical grinding process with multiple quality characteristics for gear products. Int. J. Prod. Res. 2019, 57, 6687–6701. [Google Scholar] [CrossRef]
  32. Lin, C.J.; Pearn, W.L.; Huang, J.Y.; Chen, Y.H. Group selection for processes with multiple quality characteristics. Commun. Stat. Theory Methods 2018, 47, 3923–3934. [Google Scholar] [CrossRef]
  33. Weber, C.A.; Current, J.R.; Benton, W.C. Vendor selection criteria and methods. Eur. J. Oper. Res. 1991, 50, 2–18. [Google Scholar] [CrossRef]
  34. Chen, J.P.; Chen, K.S. Comparing the capability of two process using Cpm. J. Qual. Technol. 2004, 36, 329–335. [Google Scholar] [CrossRef]
  35. Li, M.; Lin, L.Y.; Chen, K.S.; Hsu, T.H. Novel service efficiency evaluation and management model. Appl. Sci. 2021, 11, 9395. [Google Scholar] [CrossRef]
  36. Chang, T.C.; Chen, K.S. Testing process quality of wire bonding with multiple gold wires from viewpoint of producers. Int. J. Prod. Res. 2019, 57, 5400–5413. [Google Scholar] [CrossRef]
  37. Chen, K.S.; Chang, T.C.; Guo, Y.Y. Selecting an optimal contractor for production outsourcing: A case study of gear grinding. J. Chin. Inst. Eng. 2020, 43, 415–424. [Google Scholar] [CrossRef]
  38. Yang, C.M.; Chen, K.S. Two-phase selection framework that considers production costs of suppliers and quality requirements of buyers. Int. J. Prod. Res. 2019, 57, 6351–6368. [Google Scholar] [CrossRef]
  39. Lo, W.; Yang, C.M.; Lai, K.K.; Li, S.Y.; Chen, C.H. Developing a novel fuzzy evaluation model by one-sided specification capability indices. Mathematics 2021, 9, 1076. [Google Scholar] [CrossRef]
  40. Yu, C.M.; Lai, K.K.; Chen, K.S.; Chang, T.C. Process-quality evaluation for wire bonding with multiple gold wires. IEEE Access 2020, 8, 106075–106082. [Google Scholar] [CrossRef]
  41. Bai, C.; Kusi-Sarpong, S.; Khan, S.A.; Vazquez-Brust, D. Sustainable buyer–supplier relationship capability development: A relational framework and visualization methodology. Ann. Oper. Res. 2021, 304, 1–34. [Google Scholar] [CrossRef]
  42. Wan, Y.; Cheng, K.; Liu, Z.; Ye, H. An investigation on machinability assessment of difficult-to-cut materials based on radar charts. Proc. Inst. Mech. Eng. Part B-J. Eng. Manuf. 2013, 227, 1916–1920. [Google Scholar] [CrossRef]
  43. Zhang, H.; Hou, Y.; Zhang, J.; Qi, X.; Wang, F. A new method for nondestructive quality evaluation of the resistance spot welding based on the radar chart method and the decision tree classifier. Int. J. Adv. Manuf. Technol. 2015, 78, 841–851. [Google Scholar] [CrossRef]
  44. Chen, K.S.; Chen, K.L. Supplier selection by testing the process incapability index. Int. J. Prod. Res. 2006, 44, 589–600. [Google Scholar] [CrossRef]
  45. Gopalakrishnan, S.; Kumaran, M.S. Iiot framework based ml model to improve automobile industry product. Intell. Autom. Soft Comput. 2022, 31, 1435–1449. [Google Scholar] [CrossRef]
  46. Liu, J.; Ma, C.; Gui, H.; Wang, S. A four-terminal-architecture cloud-edge-based digital twin system for thermal error control of key machining equipment in production lines. Mech. Syst. Signal Process. 2022, 166, 108488. [Google Scholar] [CrossRef]
  47. Chen, K.S.; Huang, M.L.; Li, R.K. Process capability analysis for an entire product. Int. J. Prod. Res. 2001, 39, 4077–4087. [Google Scholar] [CrossRef]
  48. Pearn, W.L.; Cheng, Y.C. Measuring production yield for processes with multiple characteristics. Int. J. Prod. Res. 2010, 48, 4519–4536. [Google Scholar] [CrossRef]
  49. Wang, F.K. Quality evaluation of a manufactured product with multiple characteristics. Qual. Reliab. Eng. Int. 2006, 22, 225–236. [Google Scholar] [CrossRef]
  50. Chang, T.C.; Wang, K.J.; Chen, K.S. Sputtering process assessment of ITO film for multiple quality characteristics with one-sided and two-sided specifications. J. Test. Eval. 2014, 42, 196–203. [Google Scholar] [CrossRef]
  51. Yu, C.M.; Chen, K.S.; Lai, K.K.; Hsu, C.H. Fuzzy supplier selection method based on smaller-the-better quality characteristic. Appl. Sci. 2020, 10, 3635. [Google Scholar] [CrossRef]
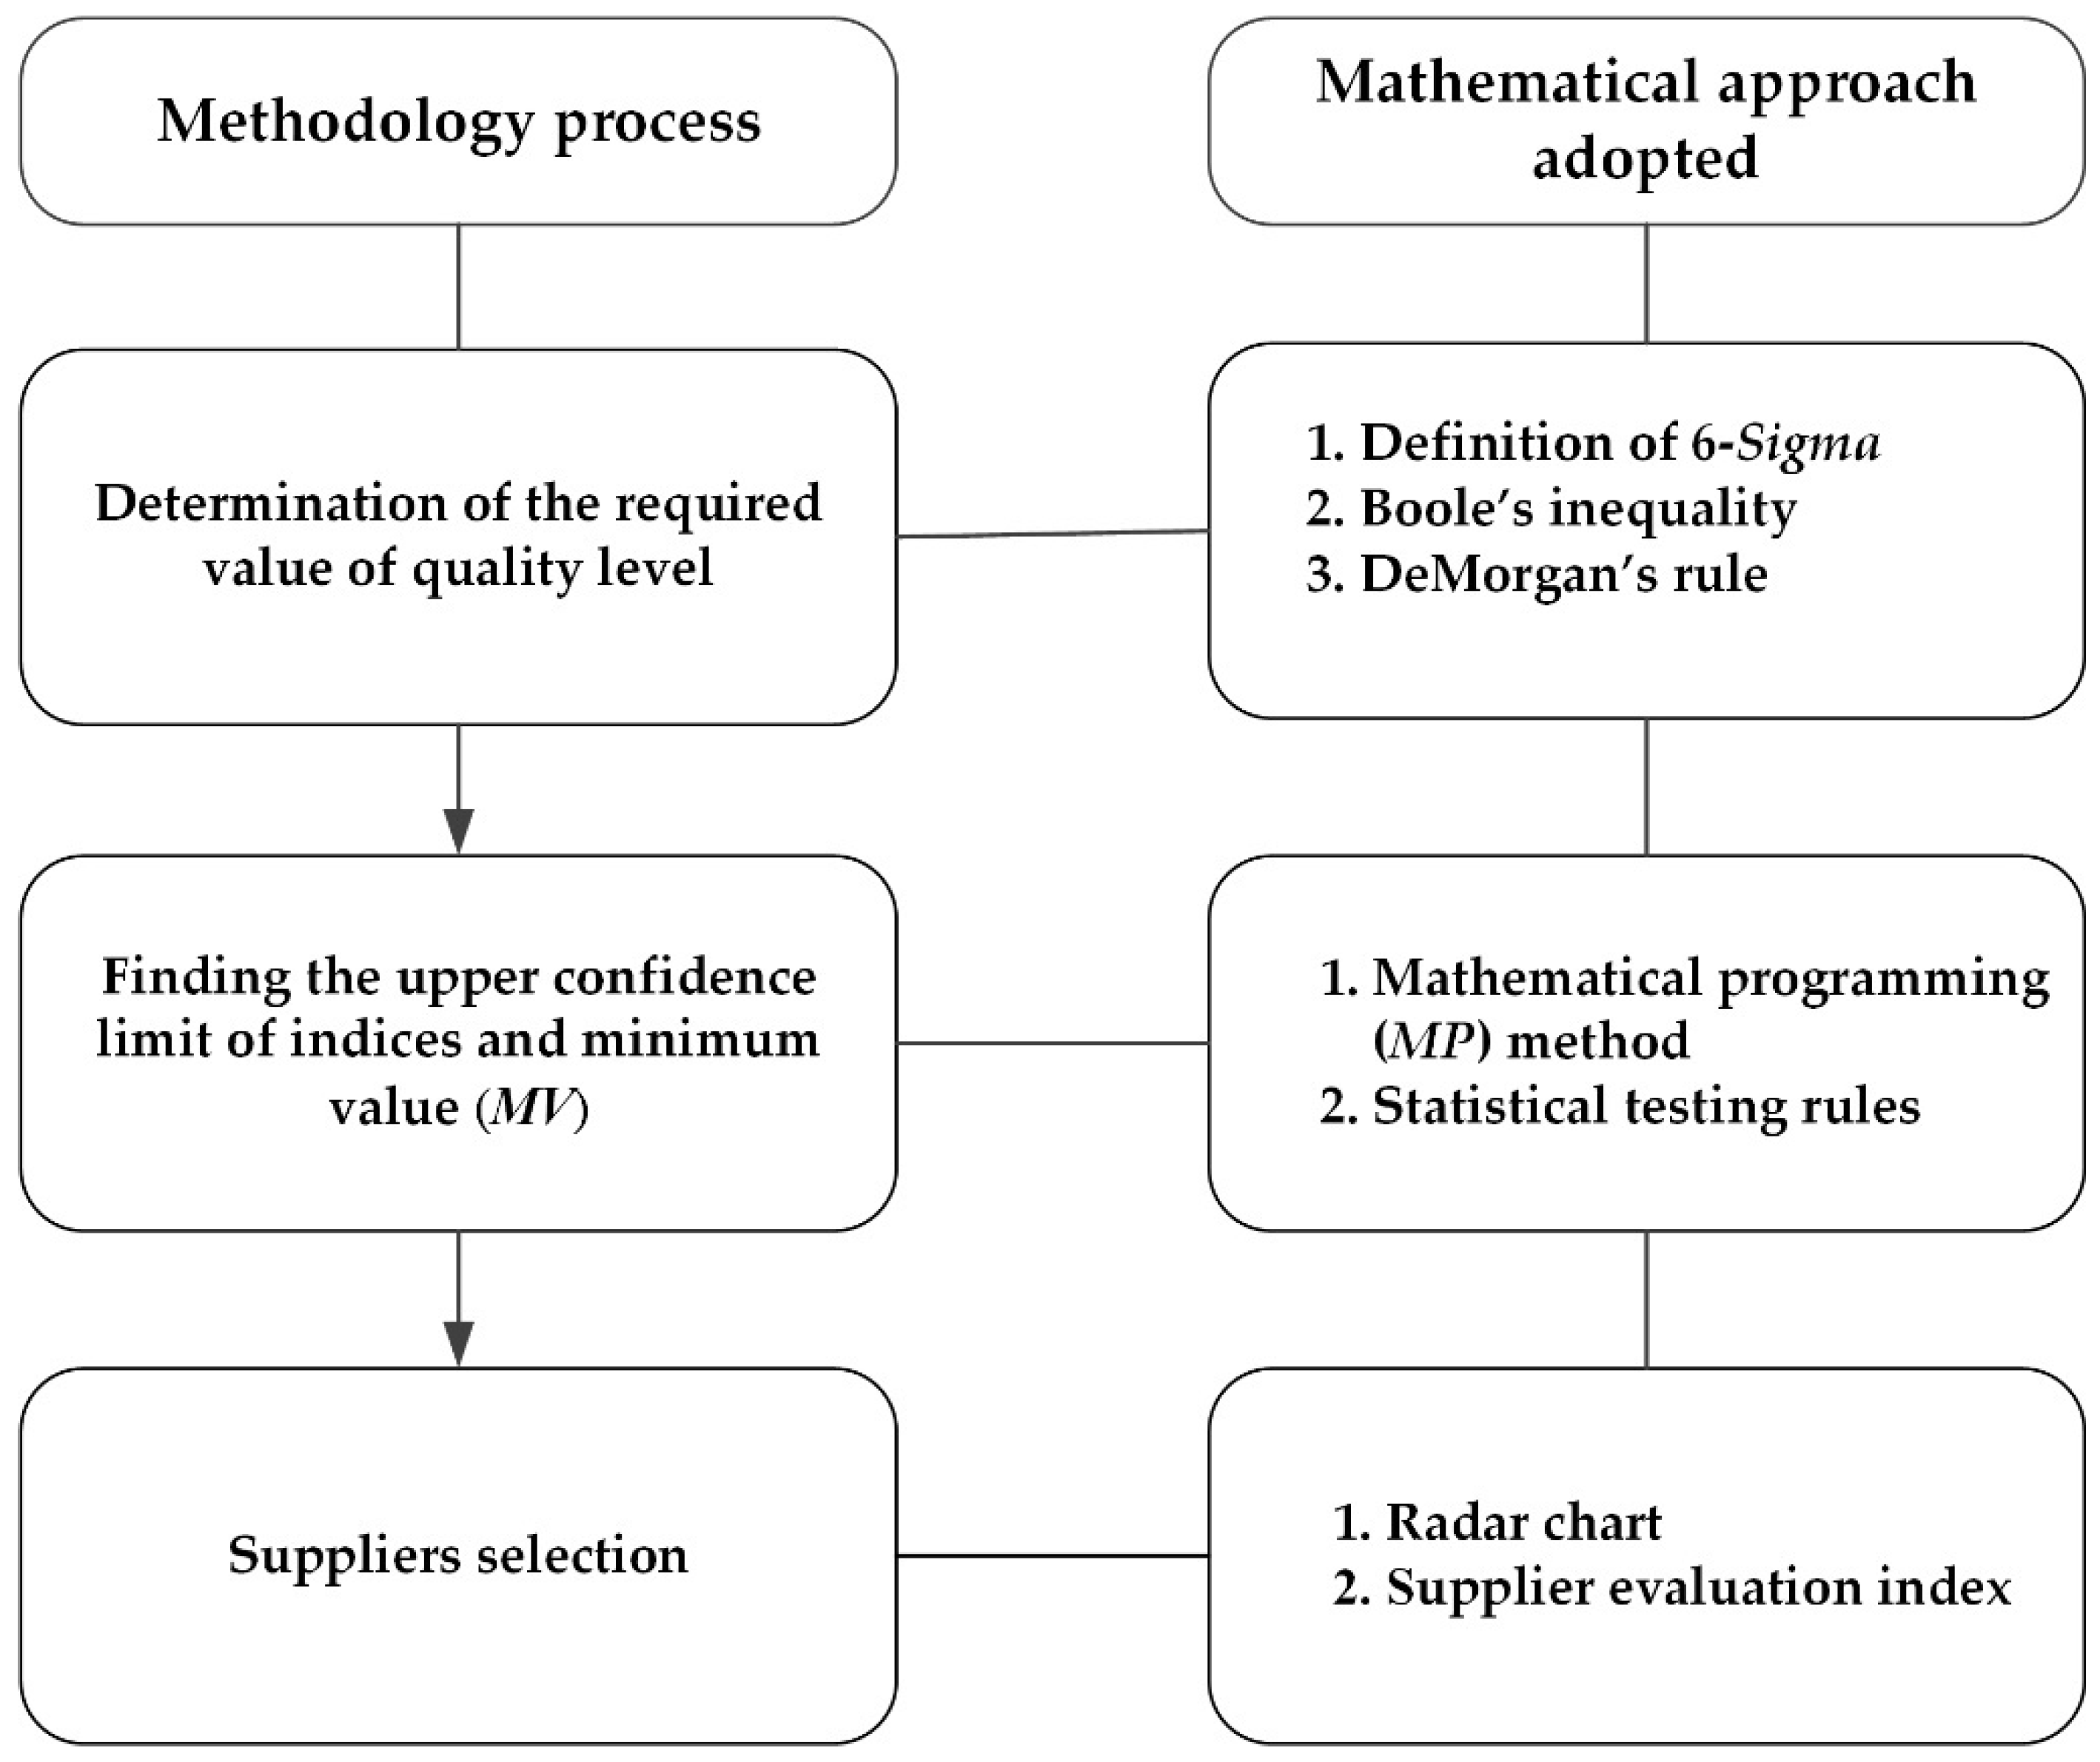
Figure 1. Flow chart of the methodology process and the mathematical approach.
Sustainability 14 08532 g001
Figure 2. Quality evaluation radar chart for the multiple quality characteristics of suppliers’ products.
Sustainability 14 08532 g002
Publisher’s Note: MDPI stays neutral with regard to jurisdictional claims in published maps and institutional affiliations.