Article

Synergistic Influence of Rainstorm and Waterlogging on Drivers’ Driving Behavior—An Experimental Study Based on High-Fidelity Driving Simulator

1
School of National Safety and Emergency Management, Beijing Normal University at Zhuhai, Zhuhai 519087, China
2
Institute of Public Safety Research, Department of Engineering Physics, Tsinghua University, Beijing 100084, China
3
Academy of Disaster Reduction and Emergency Management, Ministry of Emergency Management & Ministry of Education, Beijing Normal University, Beijing 100875, China
4
School of Public Administration and Emergency Management, Jinan University, Guangzhou 510632, China
*
Author to whom correspondence should be addressed.
Sustainability 2022, 14(14), 8517; https://doi.org/10.3390/su14148517
Submission received: 26 May 2022 / Revised: 28 June 2022 / Accepted: 9 July 2022 / Published: 12 July 2022
(This article belongs to the Section Sustainable Transportation)

Abstract

:
Drivers are vulnerable to inclement weather such as heavy rainstorms and severe rain-induced waterlogging. A thorough investigation of drivers’ driving behavior during rainstorms and waterlogging is a strong basis on which characteristics of traffic flow in such circumstances could be thoroughly studied; however, relevant studies from the individual perspective are very rare. In this paper, an experiment based on a driving simulator investigates the synergistic influence of rainstorm and waterlogging on drivers’ driving behavior, where a total of 47 drivers are recruited, and 30 circumstances with diverse rainfall intensities or water depth are included. The dataset of drivers’ driving behavior obtained from the experiment is furtherly analyzed using two-way analysis of variance (two-way ANOVA) and statistical analysis. The results show that rainfall, waterlogging, and their synergistic influence significantly reduce vehicles’ speed, acceleration, and deceleration, and increase headway distance generally. This indicates that the drivers tend to adopt a more conservative driving strategy when encountering stronger rainfall and more severe waterlogging. Moreover, waterlogging was found to have a much more significant impact on vehicles’ motion parameters than rainfall, and should be viewed with more importance. This study quantitatively analyzes drivers’ driving behavior from the individual perspective in circumstances of rainstorm and waterlogging, and the findings in turn strengthen our understanding of the impacts on driving behavior.

1. Introduction

Rapid urbanization has been observed in many countries over the last decade, especially in developing countries. Urbanization increases the impervious surface area, which has been proven to have a significantly adverse impact on the urban hydrological processes and further increases the risk of urban waterlogging [1]. The situation is much more serious during rainstorms, when rainfall intensity can be significant and create severe waterlogging. At the same time, poor design and construction of city drainage systems further aggravates the problems of waterlogging. As some scholars have pointed out, the problem of rainstorms and subsequent waterlogging has been a dilemma for many cities [2,3], and rainstorms and waterlogging have had a huge impact on traffic operations [4,5]. For example, Beijing suffered from an extremely heavy rainstorm on 21 July 2012, when the biggest local rainfall intensity reached 357 mm/24 h, leading to serious urban waterlogging. The inclement weather caused at least 30 ponding zones with water depths bigger than 30 cm and 31 road collapses in the city; this disaster resulted in a completely paralyzed road traffic situation in Beijing for a long time.
Many studies have been conducted to investigate the impact of rainstorms and waterlogging on the characteristics of road traffic, although most of them are from a perspective of “traffic flow” analysis [6]. Scholars used mainly two categories of traffic detectors to collect ground-truth traffic data, including pave based vehicle detection (PBVD) and ground based vehicle detection (GBVD). PBVD includes pneumatic tube, loop detectors, and magnetometer detectors, etc., while GBVD includes remote traffic microwave sensors (RTMS), screen line surveys, and video image processing detectors, etc. The characteristics of traffic flow can be analyzed after coupling traffic data with meteorological data. In terms of the impact of rainfall on traffic flow, it can be seen that rainfall creates decreased vehicle speeds, and the speed reduction effect increases when the rainfall intensity is larger [7,8,9,10,11]. Similar effects still apply to traffic capacity when faced with rainfall, in that the traffic capacity is also inversely correlated with rainfall intensity [12,13,14,15]. Some scholars, such as Li et al., studied the effects of rainfall intensity coupled with traffic flow density on the stability of drivers’ driving speeds, and found that rainfall intensity reduces the speed stability when vehicle density is low, while rainfall intensity strengthens the speed stability when vehicle density is high [16]. In terms of the effect of waterlogging on traffic flow, Hu et al. found that the existence of waterlogging on the road will greatly reduce the vehicle speed and traffic capacity, with reduction rates equaling 21.5–24.3%, and 25.8–31.2%, respectively. The reduction rates are both much bigger than the reduction rates caused by rainfall, which are 1.2–18.4%, and 1.1–16.5%, respectively, indicating that the impact of waterlogging on traffic flow is more significant than rainfall [17]. Furthermore, Hussain et al. found that the average vehicle speed was significantly smaller in circumstances with greater water depths [18]. In addition to direct traffic data analysis based on classic statistical theories, some studies were also conducted based on traffic flow model fitting. In these studies, traffic flow data and meteorological data were collected and then the parameters in traffic flow models were calibrated in order to ensure that the calibrated traffic flow model could profile the characteristics of traffic flow under circumstances of rainfall. The Van Aerde model [19], the Greenshields model [20], and the Exponential model [21] were usually selected by scholars. The findings from these studies are similar to those based on classic statistical theories that the free-flow speed, critical speed, and traffic capacity all diminish with increased rainfall intensity.
Despite various relevant studies on the effects of rainfall and waterlogging on traffic flow, the current studies are still incomplete, mainly due to the following two issues:
  • Heavy rainstorms, whose impact on traffic flow is undoubtedly much more prominent than normal rainfall or rainfall with intensity below normal, are rarely examined in the relevant research mentioned above. The main reason is that most relevant research is extremely dependent on real traffic data and meteorological data, while rainstorms and heavy rainstorms seldom happen in daily life;
  • Besides rainfall and waterlogging, drivers’ driving behavior is associated with a variety of other factors, both external and internal. External factors consist mainly of road properties, traffic flow patterns, and other weather conditions, such as whether thunder and lightning are present. Internal factors consist mainly of drivers’ ages, genders, health levels, degrees of fatigue/drowsiness, reaction capability, disposition, mood, etc. It is hard to keep all of these potential factors uniform in different studies, causing a significant problem because the quantitative results from separate studies conducted in different blocks, cities, or countries (even under a similar weather conditions) may vary greatly, despite the qualitative results from different studies being very close.
This current research status inspired the authors to look for a novel technical roadmap through which they could explore the influence of rainfall and waterlogging on traffic flow more deeply, when it was realized that looking into the influence of rainfall as well as waterlogging on drivers’ driving behavior from an “individual” perspective based on experiments could be a credible route. The first reason for this is that the most basic and direct impact of rainstorms and waterlogging on urban road traffic is thought by many scholars to be the impact on the drivers’ driving behavior, since the vehicles driven by the drivers are the most micro elements forming the traffic flow on urban road sections [22]. The second reason is that if an experimental method could be used, instead of the ground-truth data analysis method, then various circumstances could be set up in the experiments according to the actual demands, and other potential impact factors could be controlled as constants in the experiments. The two shortcomings mentioned above could be overcome if the circumstances of rainstorm and heavy rainstorm are considered. However, relevant research from “individual” perspectives is seriously insufficient and far less than the research from “traffic flow” perspectives. Zhao et al. may be the only ones to carry out the relevant research based on an AutoSim platform using experimental methods where they studied the influence of rainfall on drivers’ driving behavior, including acceleration, headway distance, velocity difference, etc. [23]. Nevertheless, the factor of waterlogging was not considered at all in Zhao et al.’s study.
This paper focuses on exploring whether and how the factors of rainstorm and waterlogging influence drivers’ driving behavior. A driving experiment in dozens of circumstances of rainfall coupled with waterlogging was implemented based on UC-win/road and Forum 8 driving simulators. To the best of the authors’ knowledge, this study based on driving simulators is the first attempt to consider simultaneously the impact of rainstorm and waterlogging on drivers’ driving behavior, which is the main contribution of this paper. Section 2 introduces the experiment. Section 3 presents the methodology. Section 4 reports and discusses the results. Section 5 introduces the validation work for this study. Section 6 discusses the limitations of this study. Finally, Section 7 concludes the paper with a summary of the main findings.

2. Experiment

2.1. Hardware and Software

A custom-built high-fidelity driving simulator developed by Forum 8 Company (Japan) was selected as the cockpit for the experiment. This driving simulator consists of a cockpit itself as well as a three-degree of freedom (DOF) motion platform, as shown in Figure 1a. The cockpit includes the key components of a real vehicle: an accelerator pedal, brake pedal, steering wheel, handbrake, gear control device, and seat, etc. A data acquisition module for input/output signal control, power control module, and a loudspeaker box were also embedded in the cockpit system. The three-DOF motion platform includes the rod end bearing, three-axis servo driver, and servo control device, etc. The three-DOF motion platform can reproduce the feeling of vibration and apply inertia forces to the driver according to the acceleration rate of the simulator. The three-DOF motion platform can also adjust the friction coefficient between the vehicle and the road surface dynamically according to the waterlogging situation on the road. When the vehicles are located at ponding road sections, the friction coefficient could be set as “Rainfall” state corresponding to the road surface condition of waterlogging. When the vehicles are located at road sections without waterlogging, the friction coefficient could be set as “Dry” state corresponding to the normal road surface condition. The specific friction coefficient values under the “Rainfall” and “Dry” states have been encapsulated by Forum 8 and could be obtained by engineering consultation if necessary.
UC-win/road is probably one of the most advanced real-time virtual reality software systems and it has been widely used in 3-D urban scene modeling and driving simulations. UC-win/road is manipulated in these experiments to build the virtual scenes of cities and various circumstances of rainfall and waterlogging.
The virtual scenes supported by UC-win/road are displayed by a set of monitors, as shown in Figure 1b. The driving simulator is also equipped with an audio device that can produce realistic ambient sounds that mimic actual rainstorm scenes. The simulated driver is an open body. In order to create a more realistic driving atmosphere for the drivers, the side and rear of the driving simulator are separated by curtains.

2.2. Subjects

This study does not focus on the influence of gender or age on drivers’ driving behavior, which means that drivers of different ages and genders are considered to have close driving abilities. Altogether, 41 males and 6 females were recruited as the subjects, with a mean age of 24 years old. All of these subjects have driver licenses in China and all were in good health.

2.3. Circumstance Design in the Experiment

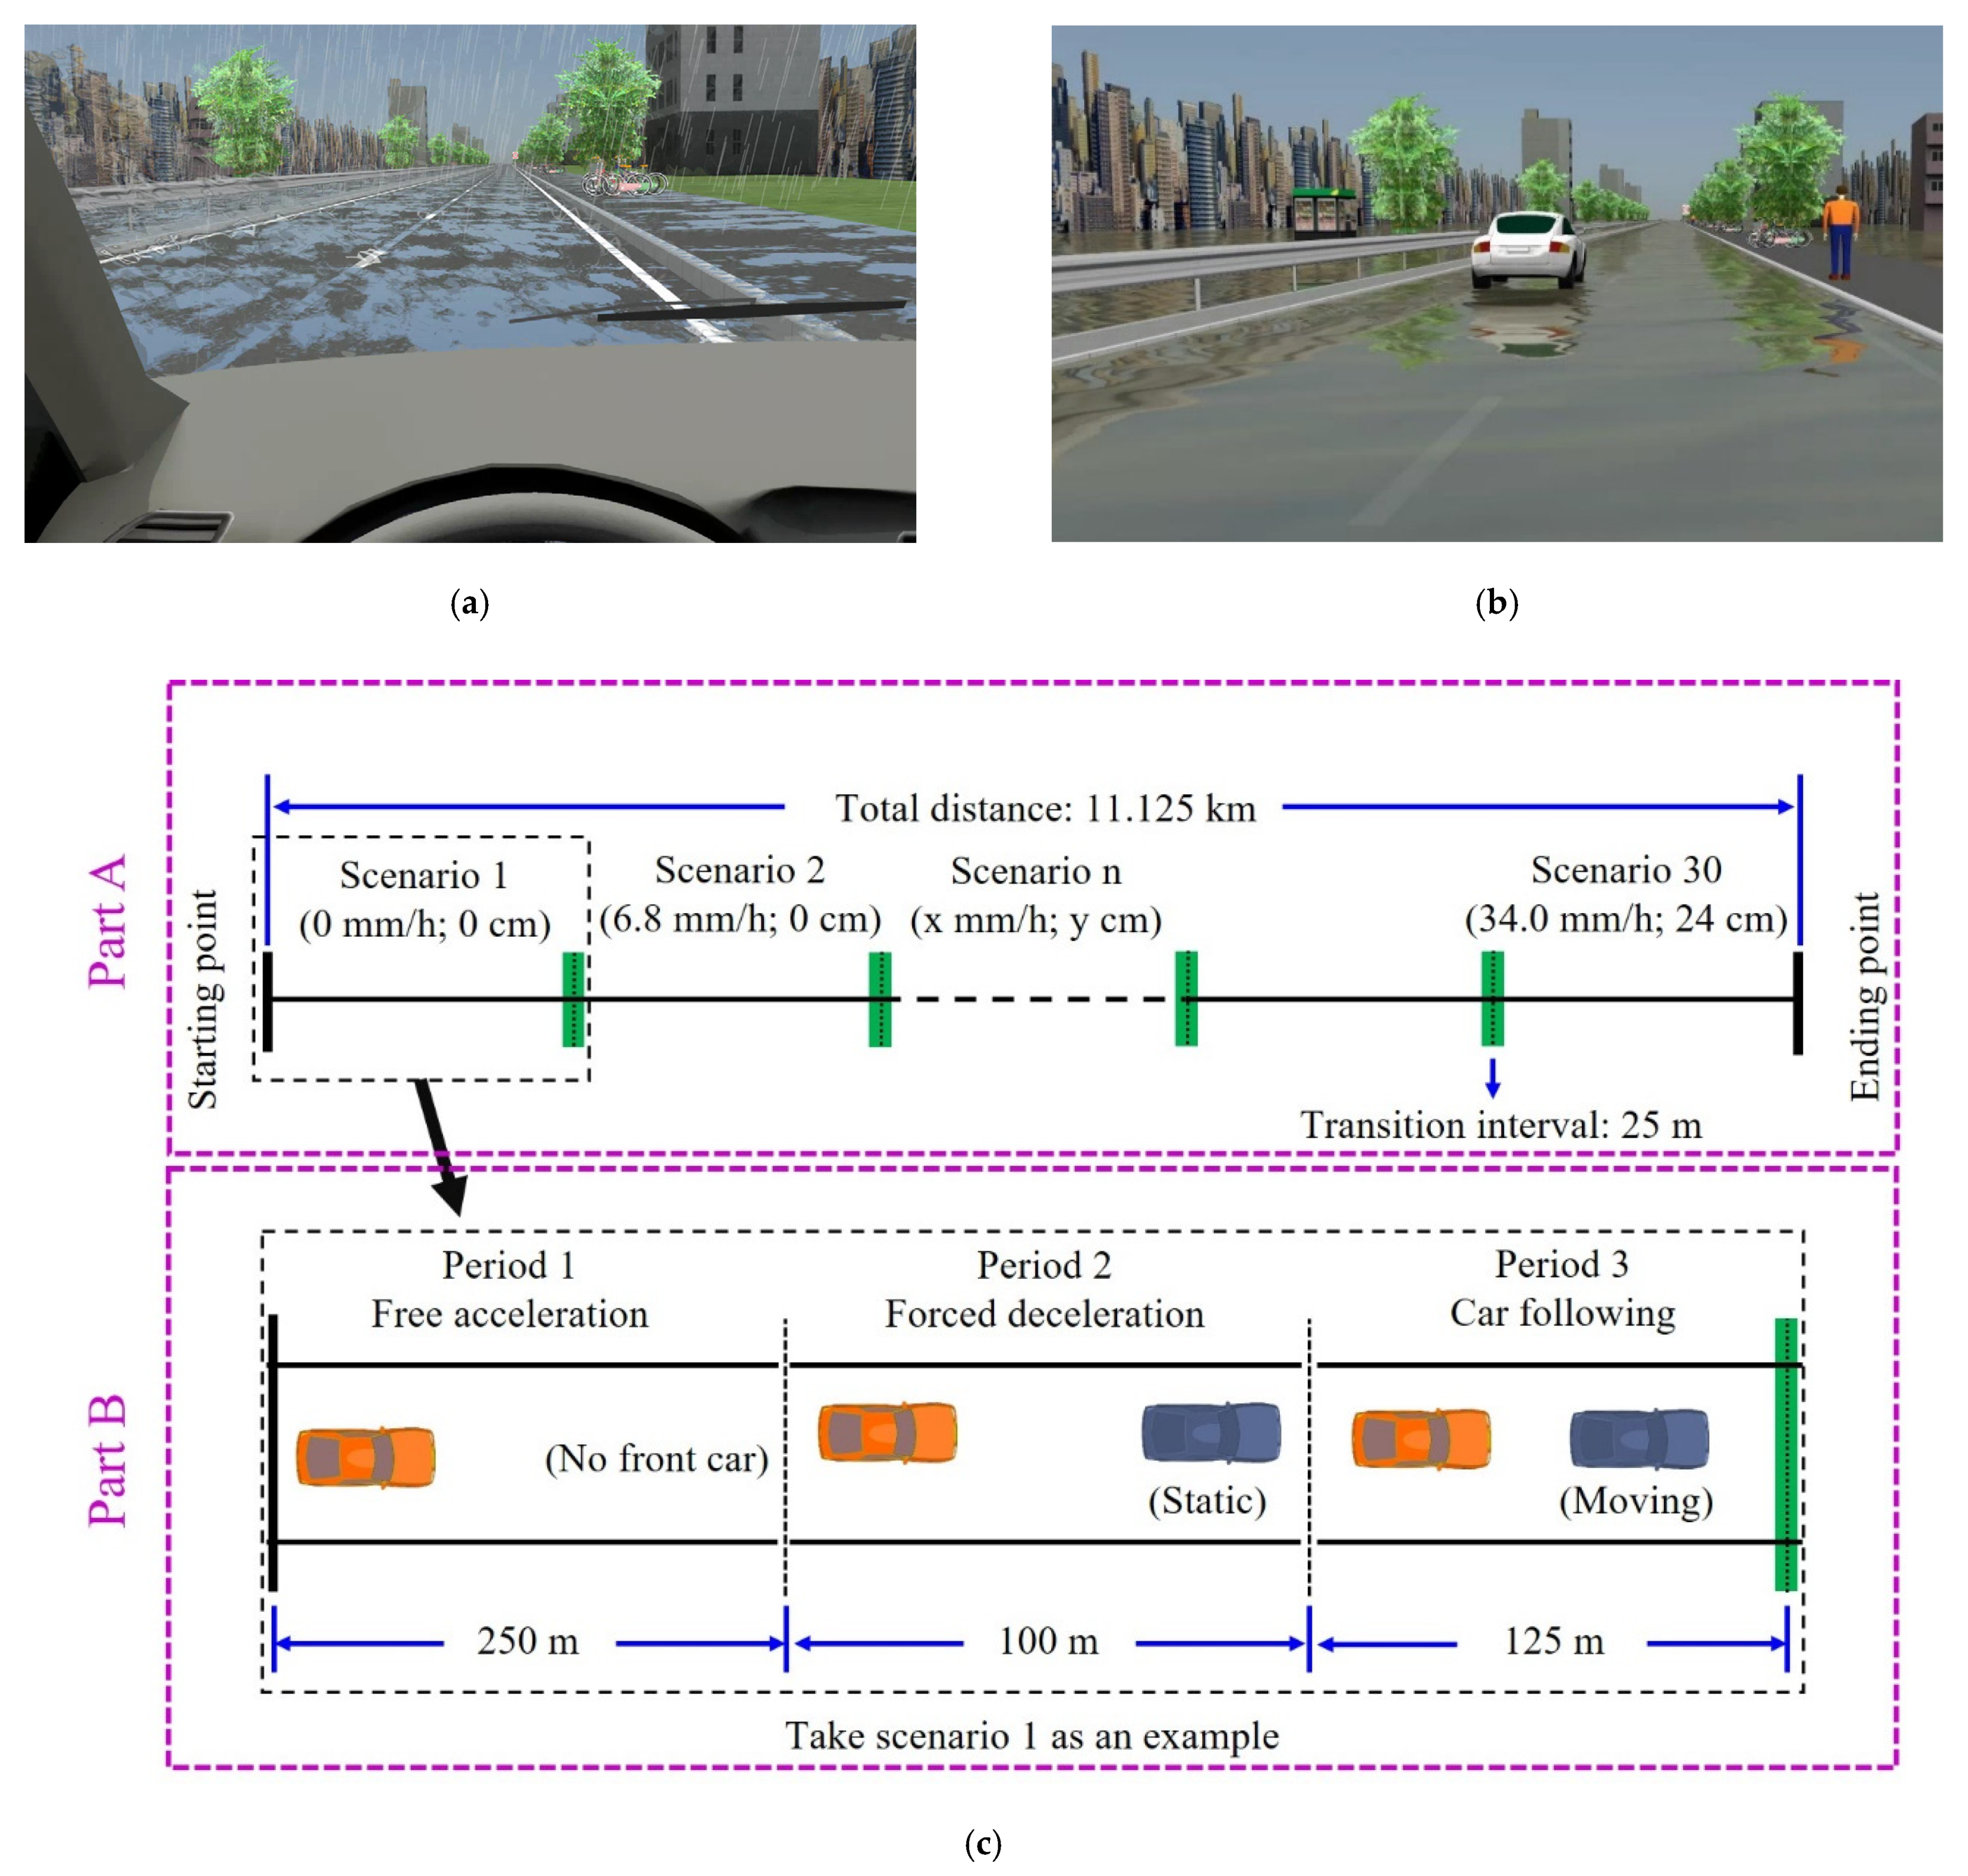
The maximum rainfall intensity that UC-win/road is capable of supporting is 34.0 mm/h. The rainfall events with intensities below moderate level are not the focus of this paper, thus the following six levels of rainfall intensities are considered using the equal interval partition method: 0 mm/h corresponding to “no rain”; 6.8 mm/h corresponding to “heavy rain”; 13.6 mm/h corresponding to “rainstorm”; and 20.4 mm/h, 27.2 mm/h and 34.0 mm/h corresponding to “heavy rainstorm”. The correlation between the description of the rainfall intensity and the numerical value is based on the rainfall grade standard in China [24]. Considering that the water will nearly submerge the cars’ wheels with a depth of 25~30 cm, the maximum water depth in this study was set to 24 cm. Five levels of water depth were considered using the equal interval partition method: 0 cm, 6 cm, 12 cm, 18 cm, and 24 cm. Examples of rainfall and waterlogging circumstances reproduced by UC-win/road are respectively given in Figure 2a,b.
By combining different levels of rainfall intensities and water depths, each subject is required to experience 30 circumstances where the lengths are in the range of [350, 500] m to finish the experiment. When the circumstances change, drivers often need a reaction time; therefore, a 25 m-long transition interval is set between two neighboring circumstances (see Part A in Figure 2c). Drivers’ driving data produced during this transition interval are not involved in data analysis, so that some inappropriate data could be automatically filtered out. In order to fully and comprehensively understand the impact of rainfall and waterlogging on drivers’ behavior, three separate driving periods are designed in each circumstance, including free acceleration, forced deceleration, and car-following (see Part B in Figure 2c). The overall driving length for every subject is 11.125 km.

2.4. Output Data from the Experiment

A set of data records reflecting the drivers’ driving behavior is exported by the data acquisition module embedded in the system at a frequency. The interval between two adjacent data records depends on the real-time computation speed of CPU; therefore, the intervals between two adjacent data records are not a constant, but most of them are in the range of 0.01 s to 0.02 s. A set of data records includes time, the subject or the virtual vehicle IDs, locations of the virtual vehicles, and the vehicles’ directions, speeds, acceleration, etc. The total number of the data recording files was 4230 (=47 subjects × 30 circumstances × 3 driving periods). Drivers’ driving behavior in circumstances of rainstorm and waterlogging could be thoroughly analyzed based on these data recording files.

3. Methods of Data Processing

In this paper, two methods are used to analyze the characteristics of drivers’ driving behavior in circumstances of rainstorm and waterlogging. One is two-way ANOVA, which is commonly used for qualitative analysis of whether or not the impact of some factors on the investigation object exists. The other is a narrowly defined statistical analysis, which is used for exploring the specific impact mode of some factors on the investigation object.
Before introducing the main methods used in this paper, the key kinematic parameters reflecting the characteristics of drivers’ driving behavior need to be defined. These parameters for one vehicle include speed v i , acceleration in free acceleration period a ¯ 1 i , deceleration in forced deceleration period b ¯ 2 i , and headway distance in the car-following period S H ¯ i . In all of these variables, v i could be directly recorded during the experiment, while the calculation formulas for other parameters are listed from Equations (1)–(3):
a ¯ 1 i = v i | t = t e 1 i v i | t = t s 1 i t e 1 i t s 1 i
b ¯ 2 i = v i | t = t e 2 i v i | t = t s 2 i t e 2 i t s 2 i
S H ¯ i = t s 3 i t e 3 i ( L f L i L veh ) | t = x d x t e 3 i t s 3 i
where t s j i and t e j i , respectively, denote the beginning time and end time of the period j for the experimental vehicle i ; v i | t = t s j i and v i | t = t e j i , respectively, denote the vehicle’s speed at the start and end times of the period j for the experimental vehicle i ; L f denotes the location of the experimental vehicle i ;   L i denotes the location of the front vehicle of vehicle i ; L veh denotes the length of the vehicle. In this study, the lengths of the experimental vehicle and the surrounding vehicles are all the same, equaling four meters. Among the equations above, i = 1 ,   2 ,   ,   47 , j = 1 ,   2 ,   3 .
Suppose that the rainfall intensity is denoted by Q and the water depth is denoted by D , the level numbers for Q and D are respectively denoted by q and d . Obviously, q = 6 and d = 5 in this study and the specific numerical value of D and Q could be denoted by D i and Q j ( i = 1 , 2 , 3 , 4 , 5 ; j = 1 , 2 , 3 , 4 , 5 , 6 ). The number of repeated experiments in the circumstance D i Q j is denoted by r . Obviously, r = 47 in this study. For a particular kinematic parameter x that we are interested in, x i j k denotes the k th driver’s kinematic parameter in the circumstance of D i Q j ( k = 1 , 2 , , 47 ). Here, x could be any of the parameters mentioned above, including the vehicle’s speed, acceleration, deceleration, or headway distance. The following notations on the basis of x i j k are defined for later use in this paper:
x i j · = 1 r k = 1 r x i j k
x i · · = 1 q r j = 1 q k = 1 r x i j k
x · j · = 1 d r i = 1 d k = 1 r x i j k
x ¯ = 1 d q r i = 1 d j = 1 q k = 1 r x i j k

3.1. Two-Way ANOVA

The function of two-way ANOVA is to qualitatively investigate whether rainfall intensity, water depth, or their interaction effects have influence on drivers’ driving behavior. The detailed steps of two-way ANOVA can be found in any of the classic textbooks about variance analysis, thus this is not the focus of the paper. The ANOVA tables, as the final presentation of the results from two-way ANOVA, are introduced in this paper briefly (Table 1).
In Table 1, D × Q denotes the interaction effect of rainfall intensity and water depth. The calculation methods for the variables in Table 1 are listed from Equations (8)–(17):
S D = q r i ( x i · · x ¯ ) 2
S Q = d r i ( x · j · x ¯ ) 2
S D × Q = r i j ( x i j · x i · · x · j · + x ¯ ) 2
S e = i j k ( x i j k x i j · ) 2
S M = S D + S Q + S D × Q + S e
v D = d 1
v Q = q 1
v D × Q = d q ( d + q 1 ) = v D · v Q
v e = d q ( r 1 )
V # = S # v #     ( #   could   be   D ,   Q , D × Q ,   or   e )

3.2. Narrowly Defined Statistical Analysis

There were 47 subjects involved in the experiment, but the length of this paper would be excessive if the datasets produced by all of the subjects were analyzed one by one. The mean values of most kinematic parameters are calculated mainly based on Equation (4) and serve as quantitative results, showing the specific ways and extents that rainfall intensity and water depth influence the kinematic parameters. As mentioned above, these kinematic parameters characterize the drivers’ driving behavior so that the results reflect quantitatively how rainfall intensity and water depth influence the drivers’ driving behavior. This method is called narrowly defined statistical analysis (Equation (4)):
When the kinematic parameters are discussed in the following Results section, they actually refer to the mean values of v i , a ¯ 1 i , b ¯ 2 i , and S H ¯ i .

4. Results

4.1. Effects of Rainstorms and Waterlogging on Vehicles’ Speed

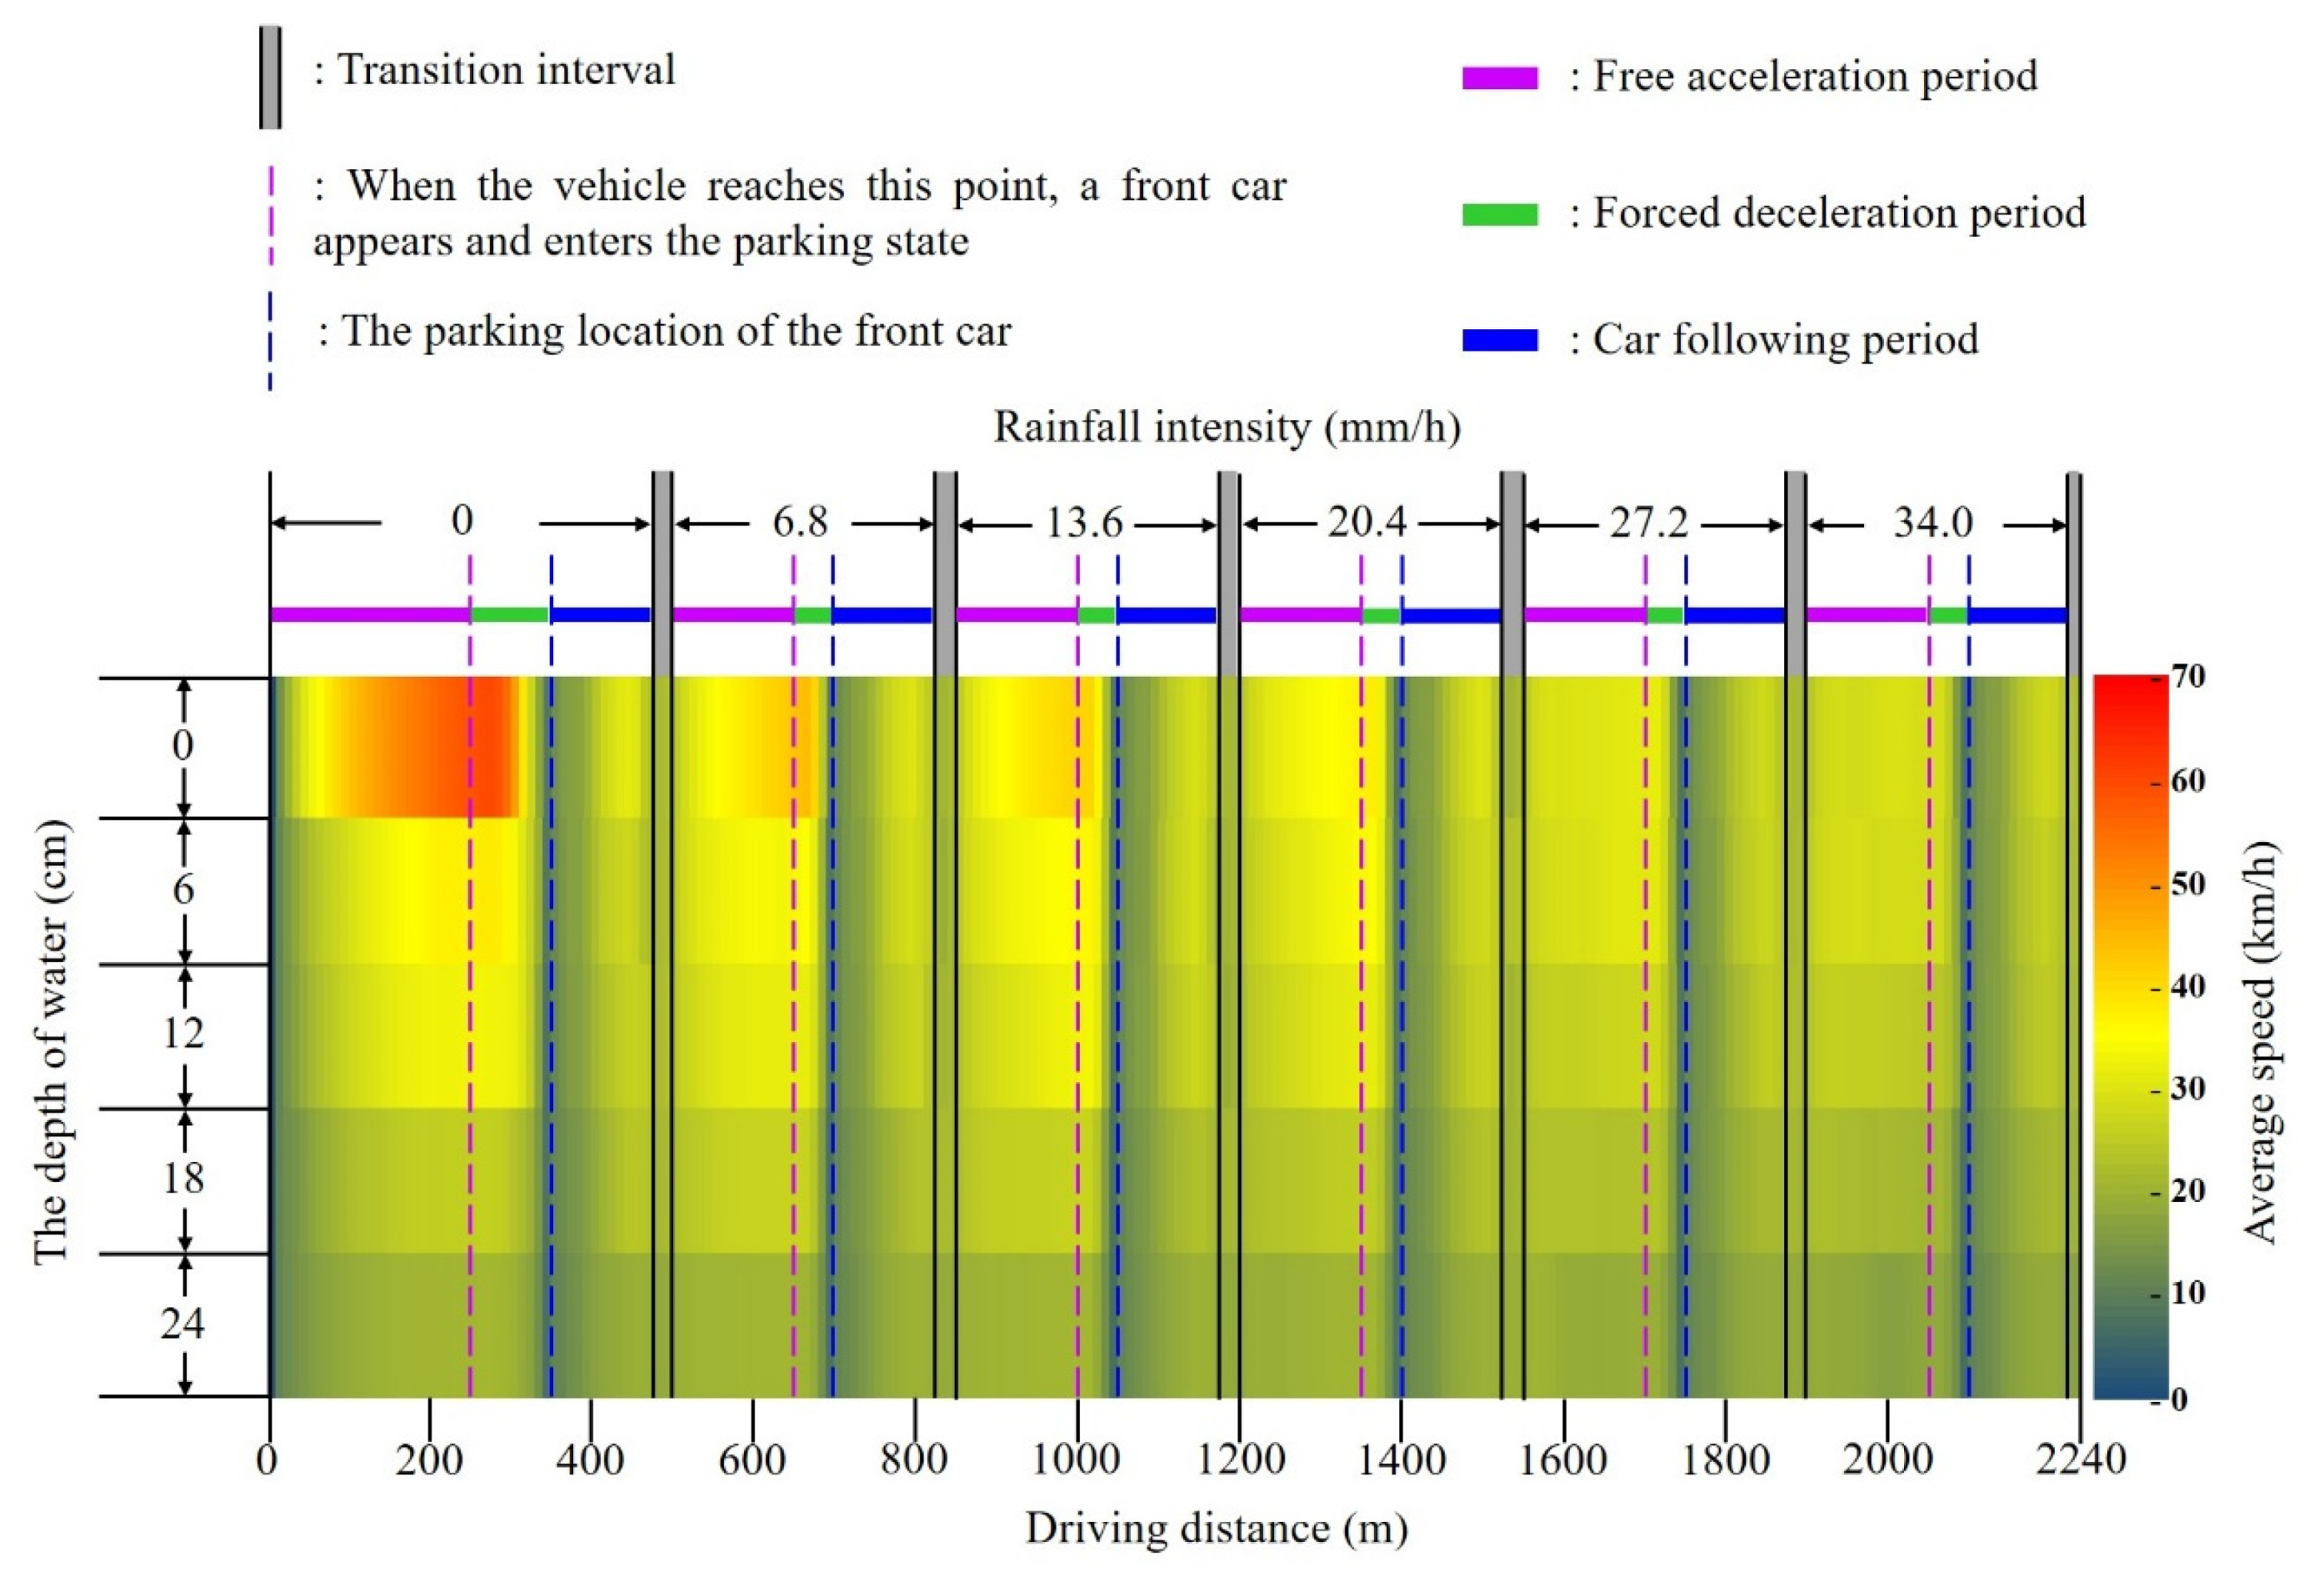
As stated in Section 3, vehicles’ speeds are directly recorded and treated as a process variety in the whole experiment. This means that two-way ANOVA is not applicable for speed analysis, since the latter changes dynamically during the whole experiment. Consequently, only narrowly defined statistical analysis is used to analyze the characteristics of vehicles’ speeds in the experiment. The mean speed of all the vehicles throughout the entire experiment is shown in Figure 3, which shows that the mean speed of the experimental vehicles in the three types of driving periods (free acceleration, forced deceleration, and car-following) has decreased when rainfall intensity (water depth) increases under the condition of the same water depth (rainfall intensity). This preliminary result shown in Figure 3 demonstrates that both rainfall and waterlogging have significant weakening effects on vehicles’ speeds.
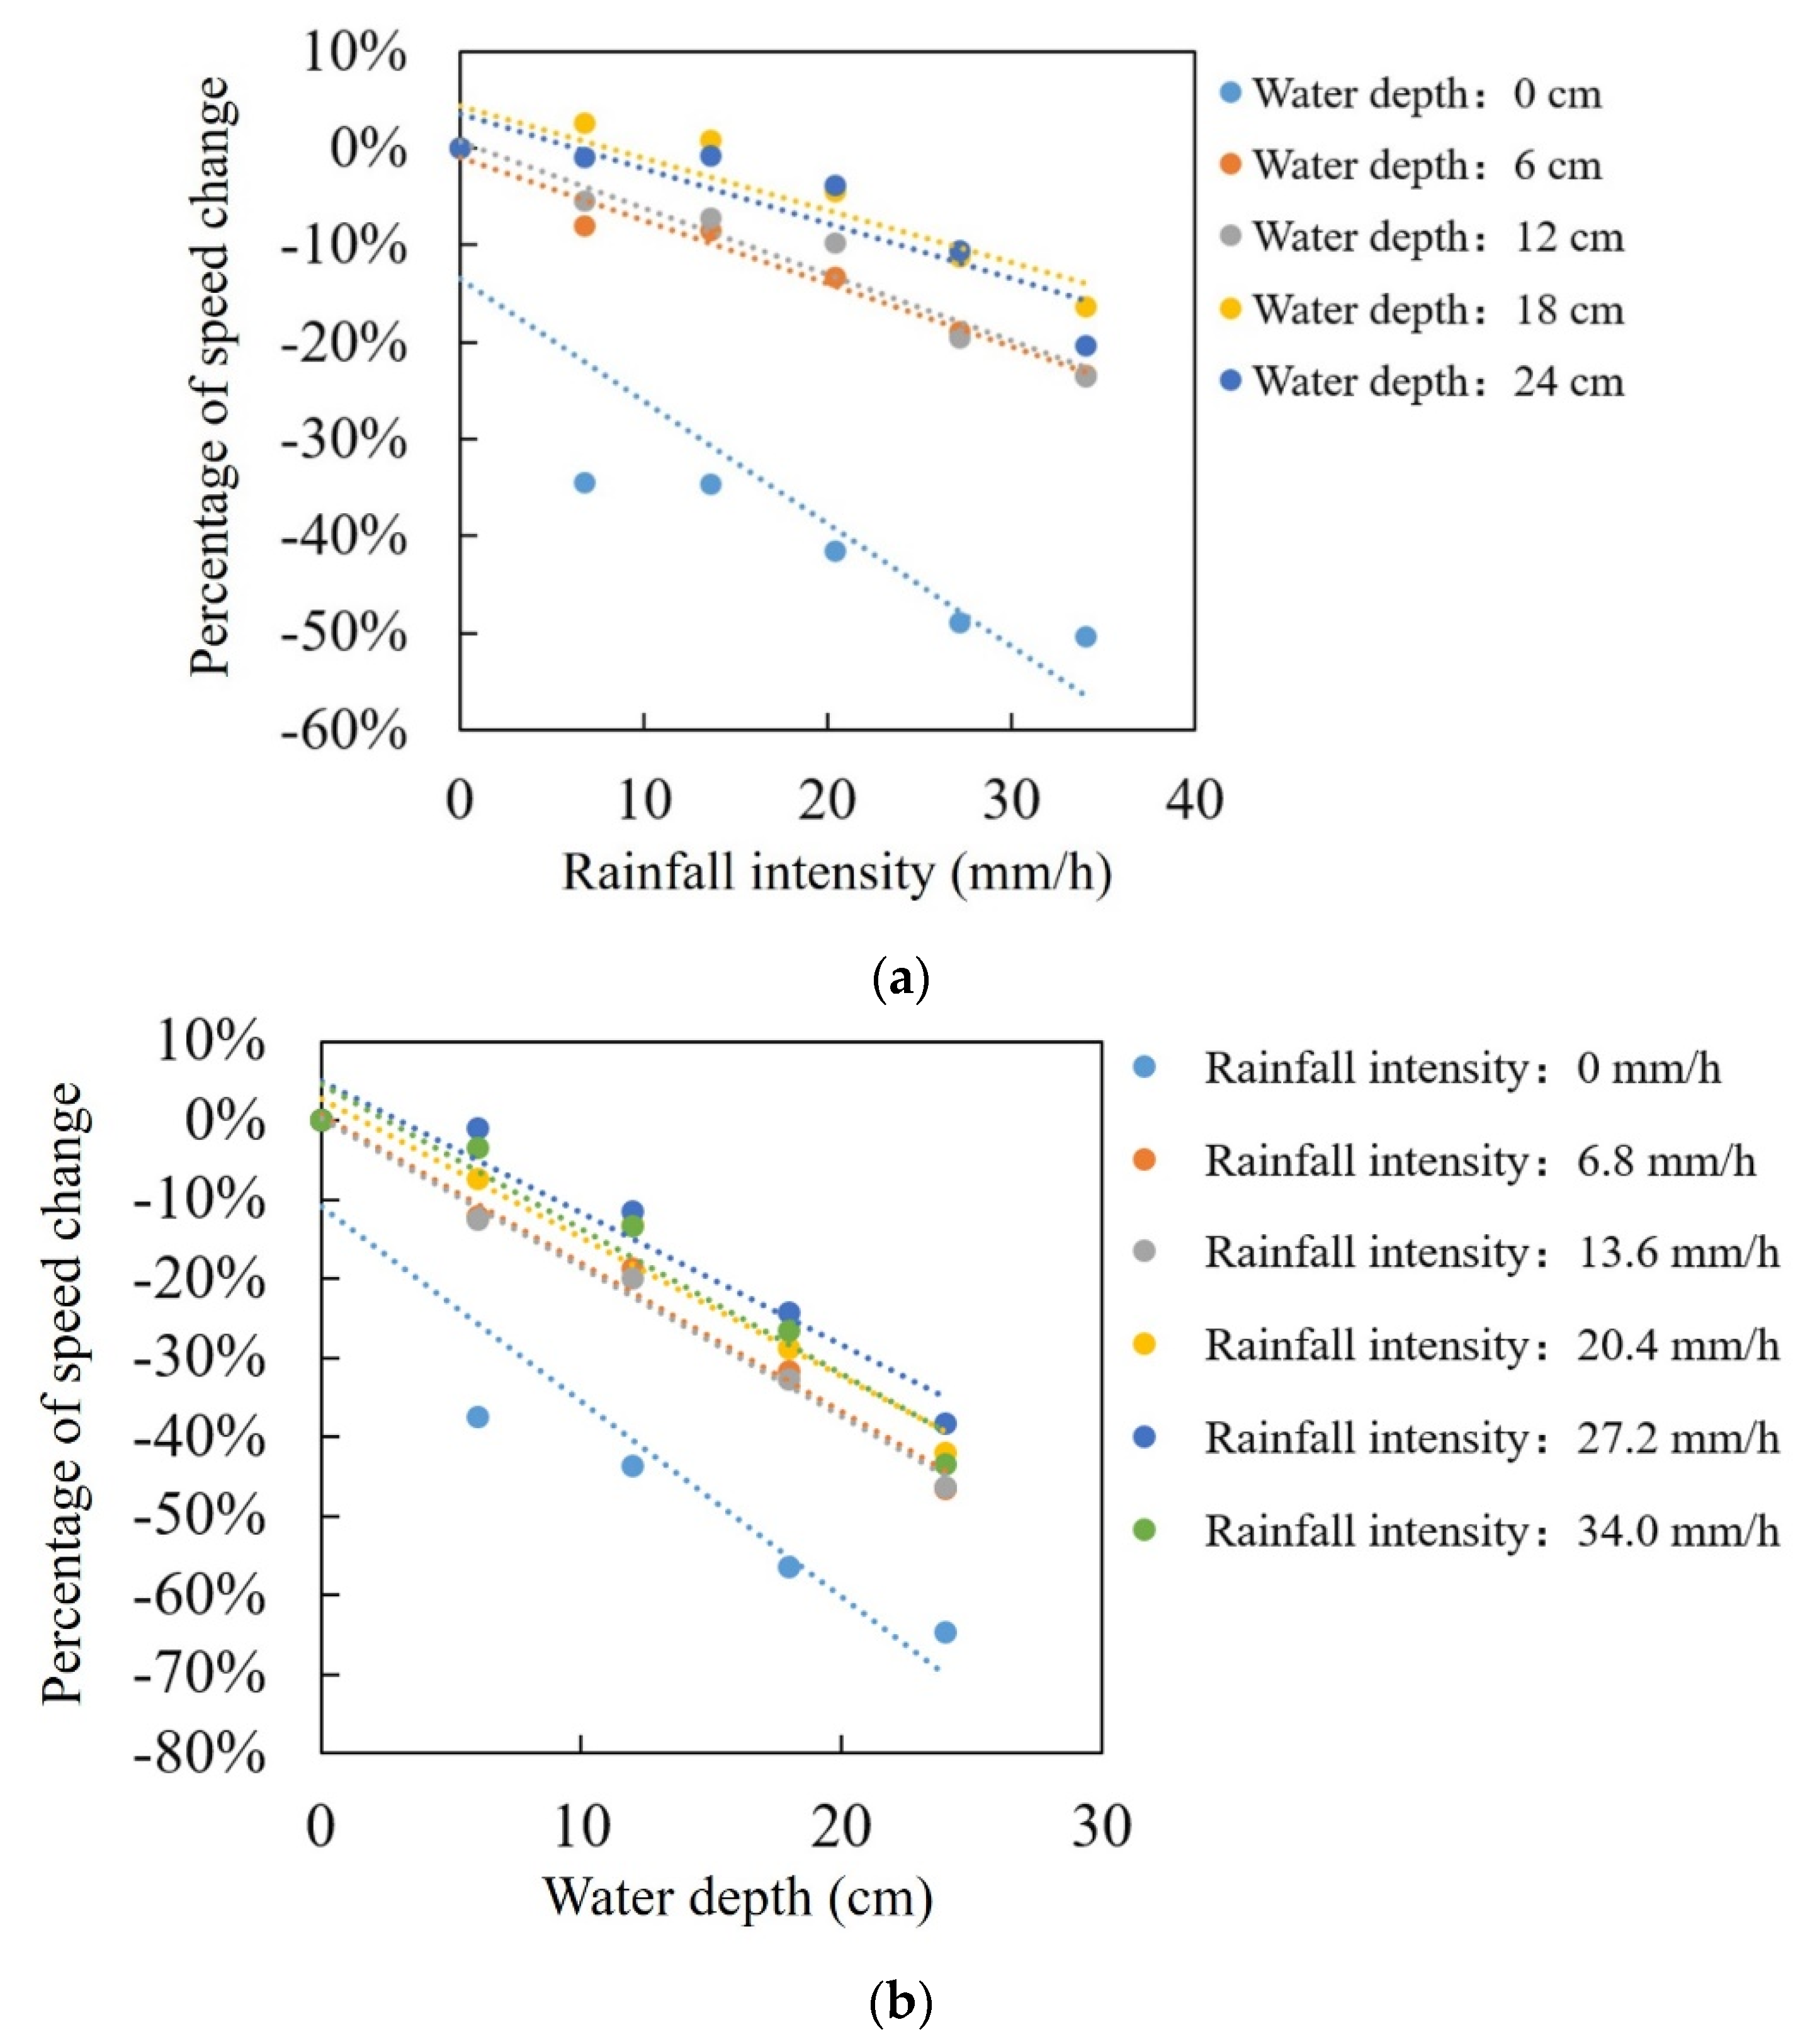
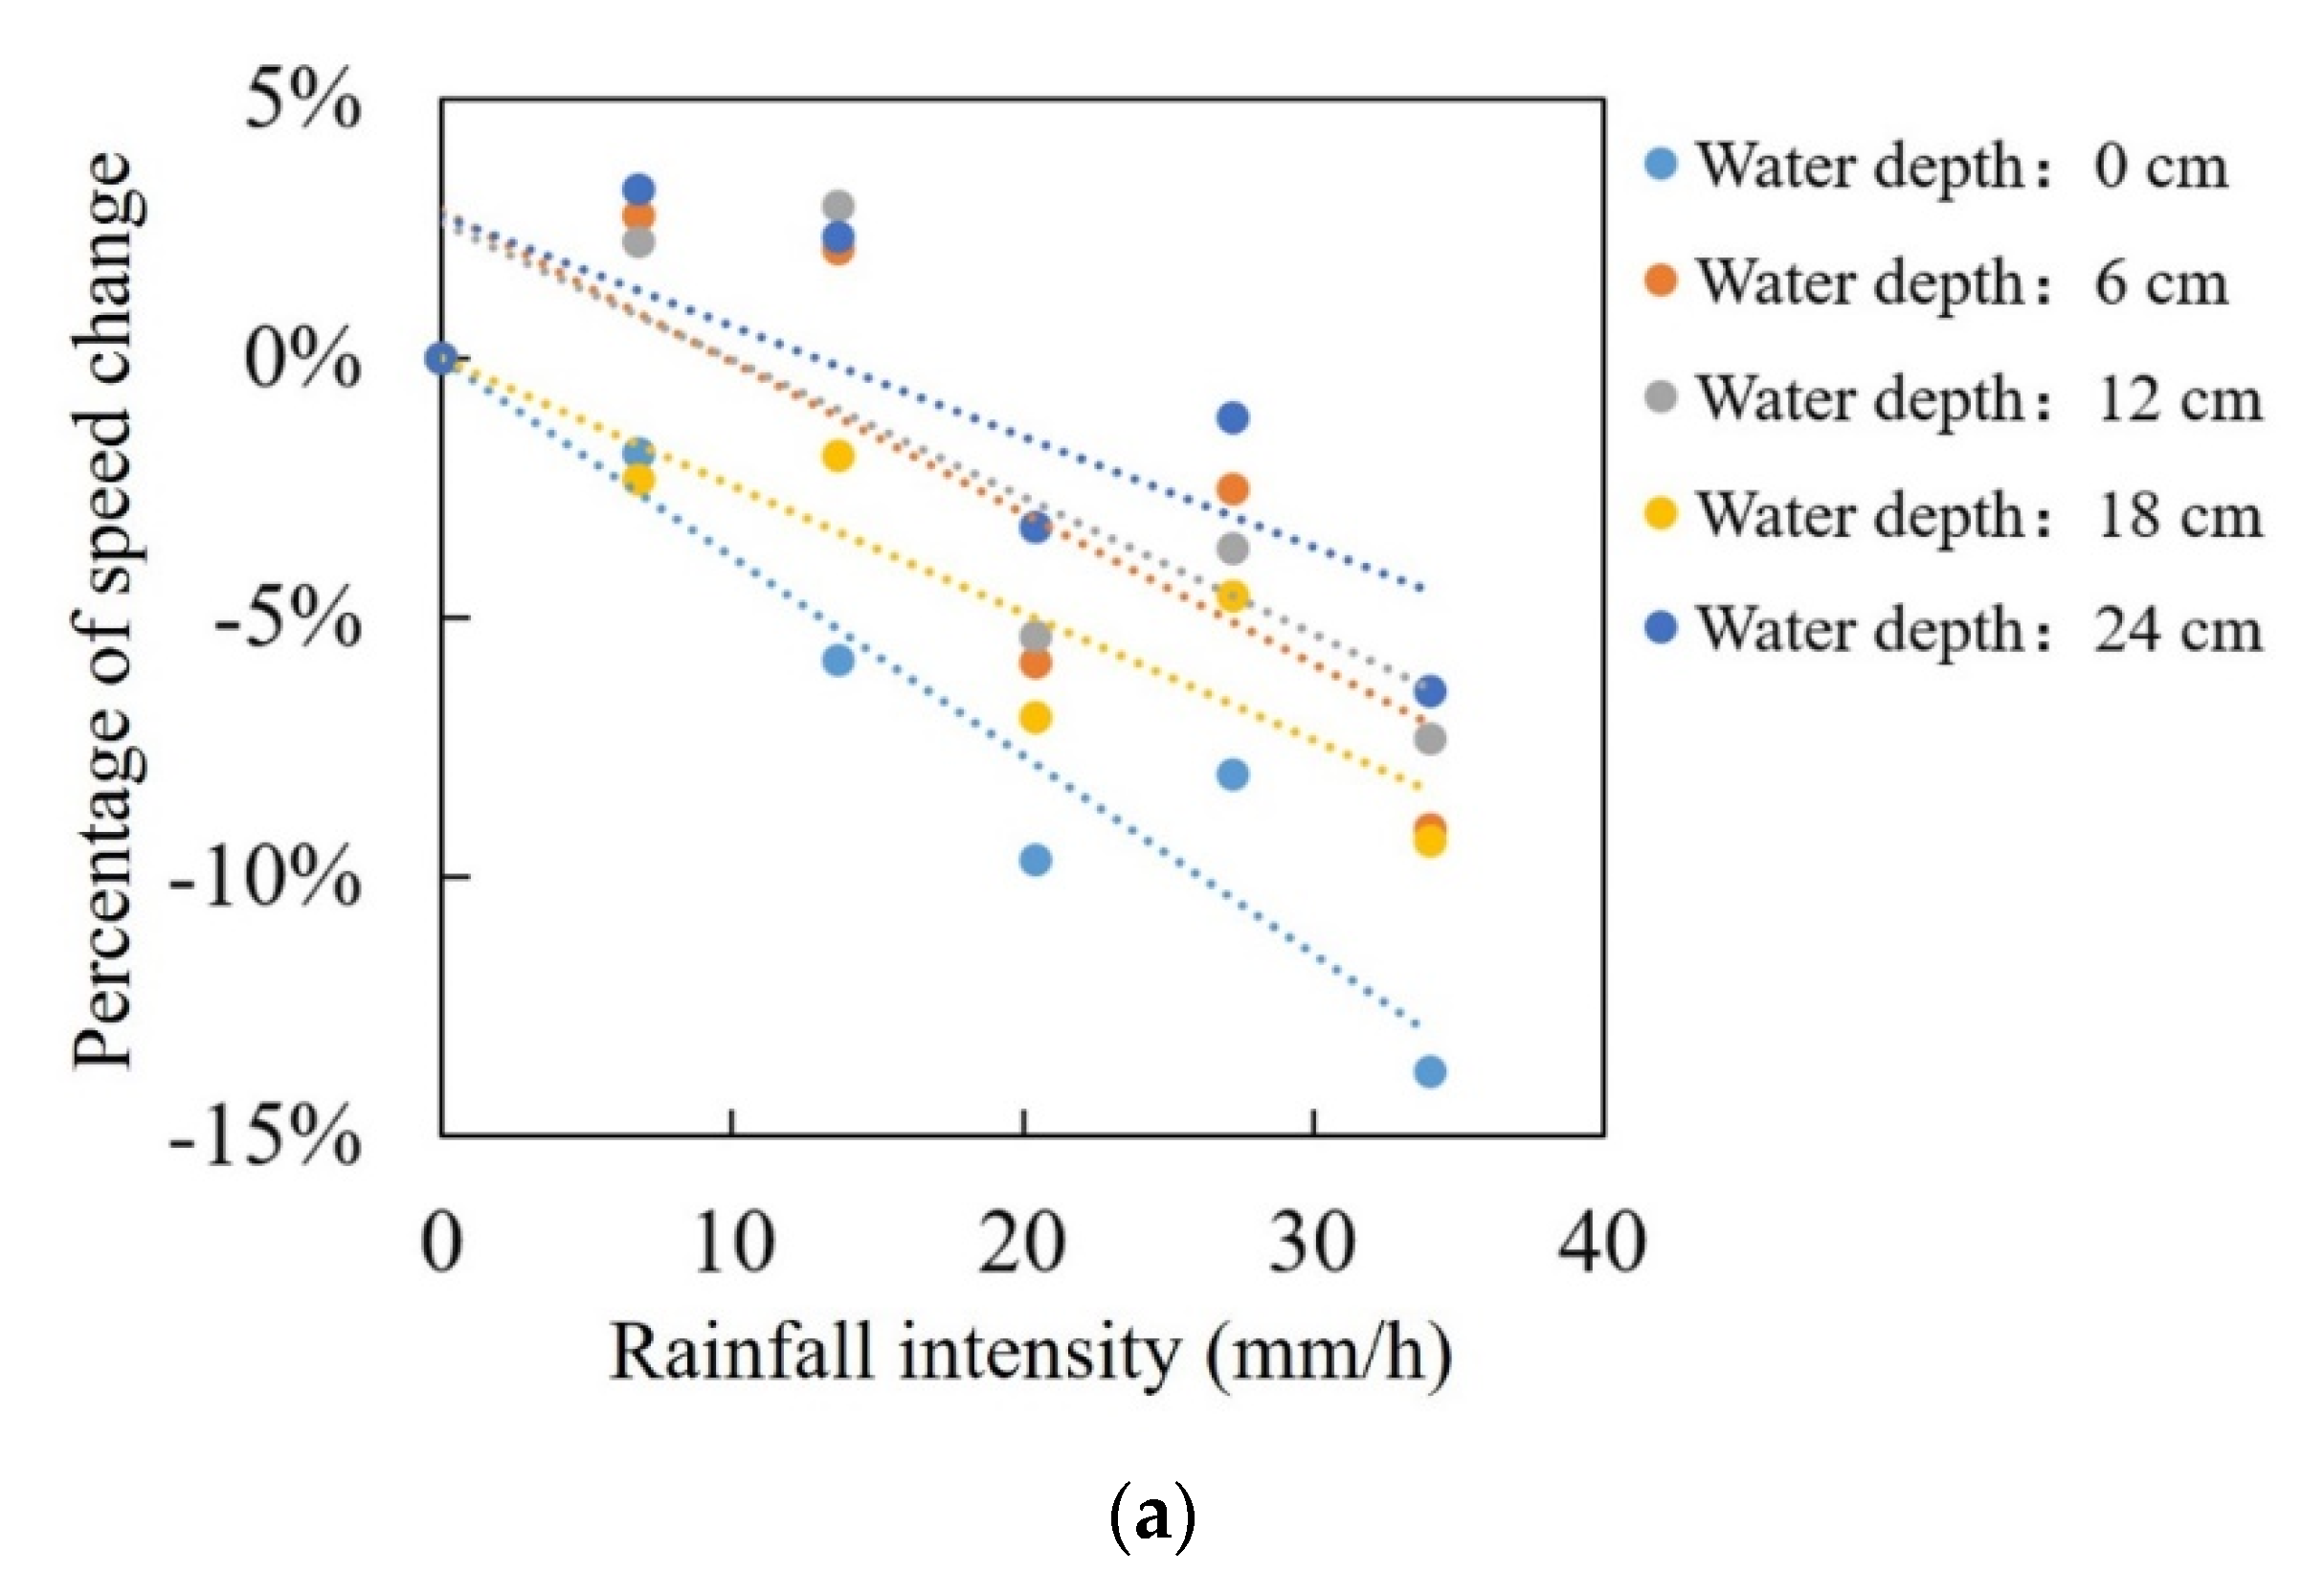
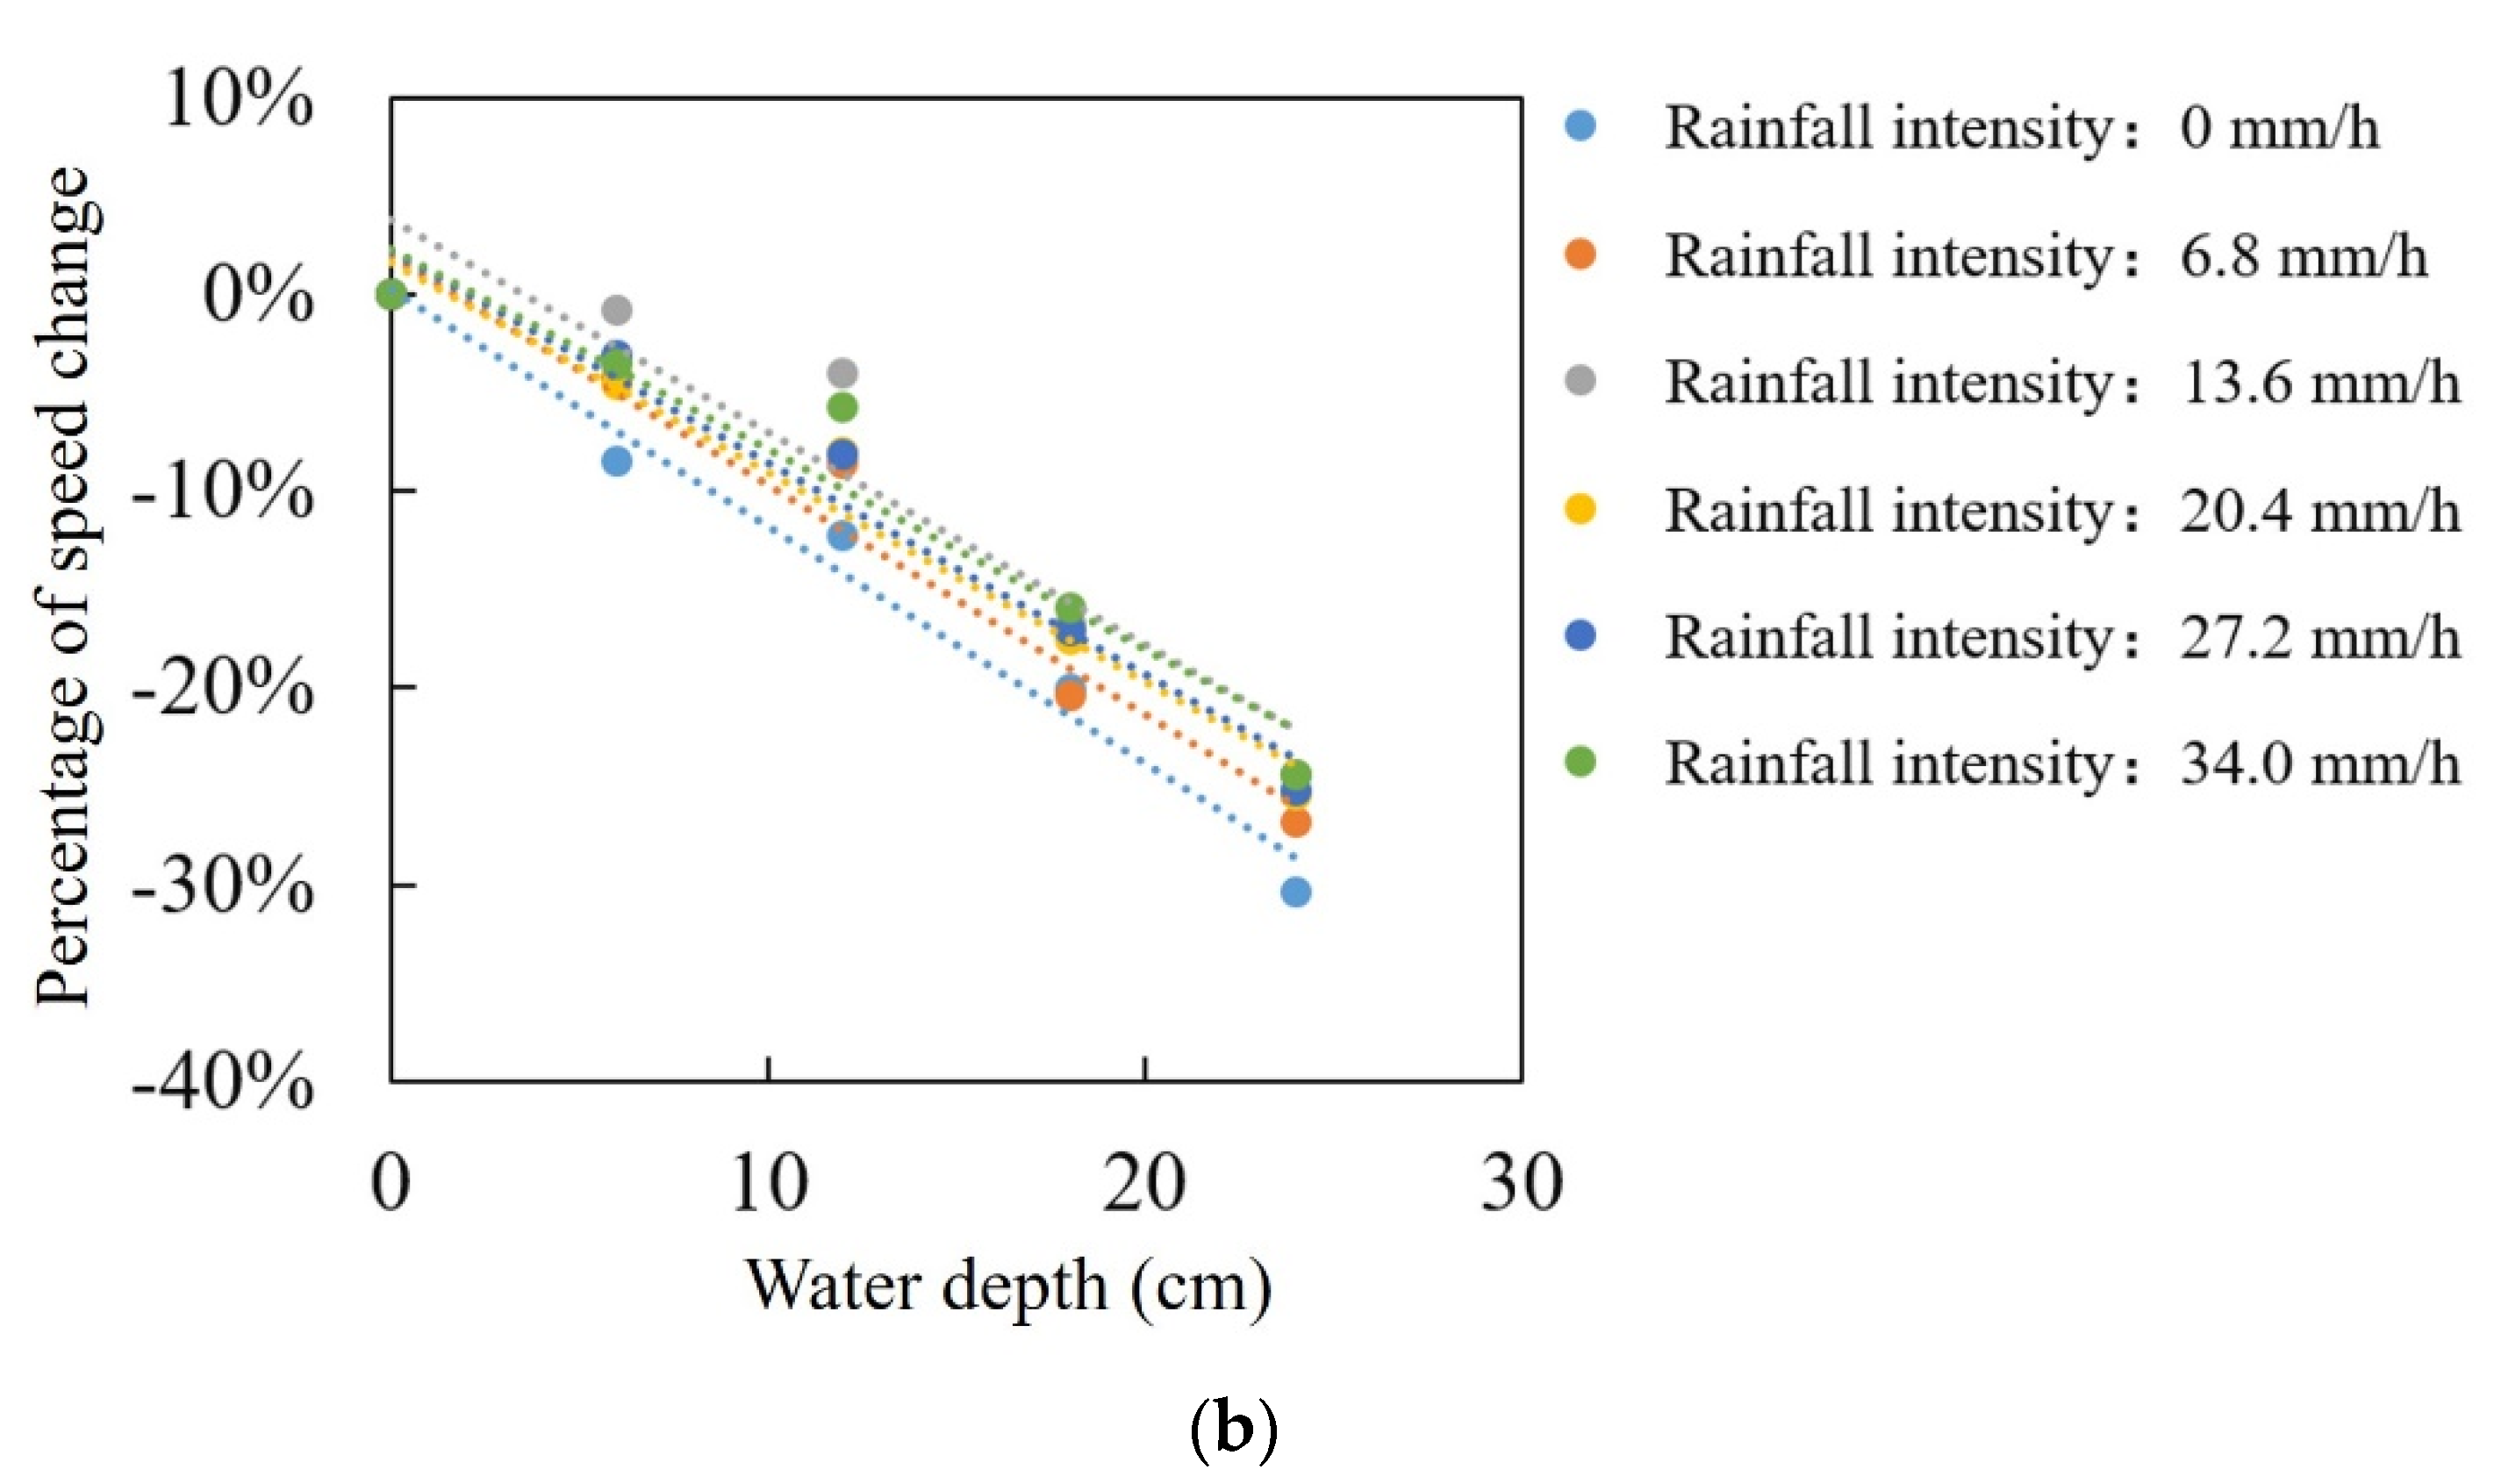
Further quantitative results could be obtained based on the preliminary results shown in Figure 3. The following two qualities are taken as the characterizing qualities describing the specific impact degree of rainfall intensity and water depth on vehicles’ speeds, including the maximum speeds of all the experimental vehicles in the free acceleration period, and the average speed of all the experimental vehicles in the car-following period. Relevant quantitative results regarding the maximum speed of all the experimental vehicles in the free acceleration period are shown in Figure 4. Relevant quantitative results regarding the average speeds of all the experimental vehicles in the car-following period are shown in Figure 5. The results in Figure 4 and Figure 5 furtherly corroborate the results in Figure 3 that both rainfall and waterlogging induce decreased vehicle speeds. At the same time, two main pieces of important new information could be obtained from Figure 4 and Figure 5:
Firstly, whether an influencing factor (rainfall or waterlogging) exists could have more significant influence on vehicles’ speeds than how big the specific numerical value of the influencing factor is (≠zero). If waterlogging does not exist, then the rainfall intensity has a more significant influence on vehicles’ speeds, and vice versa. This rule is evident in both Figure 4 and Figure 5 and is extremely important because it could help to support actual urban road-traffic management. When a rainstorm suddenly occurs on a sunny day (of course without waterlogging), traffic jams may form in a very short time, resulting from the rapidly decreased vehicles’ speeds. When it has already been raining and waterlogging has formed in some areas, the traffic state will obviously get worse when the rainfall intensity increases, but the extent should be inferior to the one when rainfall develops from nothing;
Secondly, the factor of waterlogging has a much more significant impact on vehicles’ speeds than rainfall. This occurrence is neatly illustrated by the specific percentage value of speed change when comparing Figure 4a,b, or Figure 5a,b. This finding is also important and gives a solid reason why the traffic condition of waterlogging-prone areas deserves the first attention in circumstances of rainstorm and waterlogging.

4.2. Effect of Rainstorm and Waterlogging on Vehicles’ Acceleration

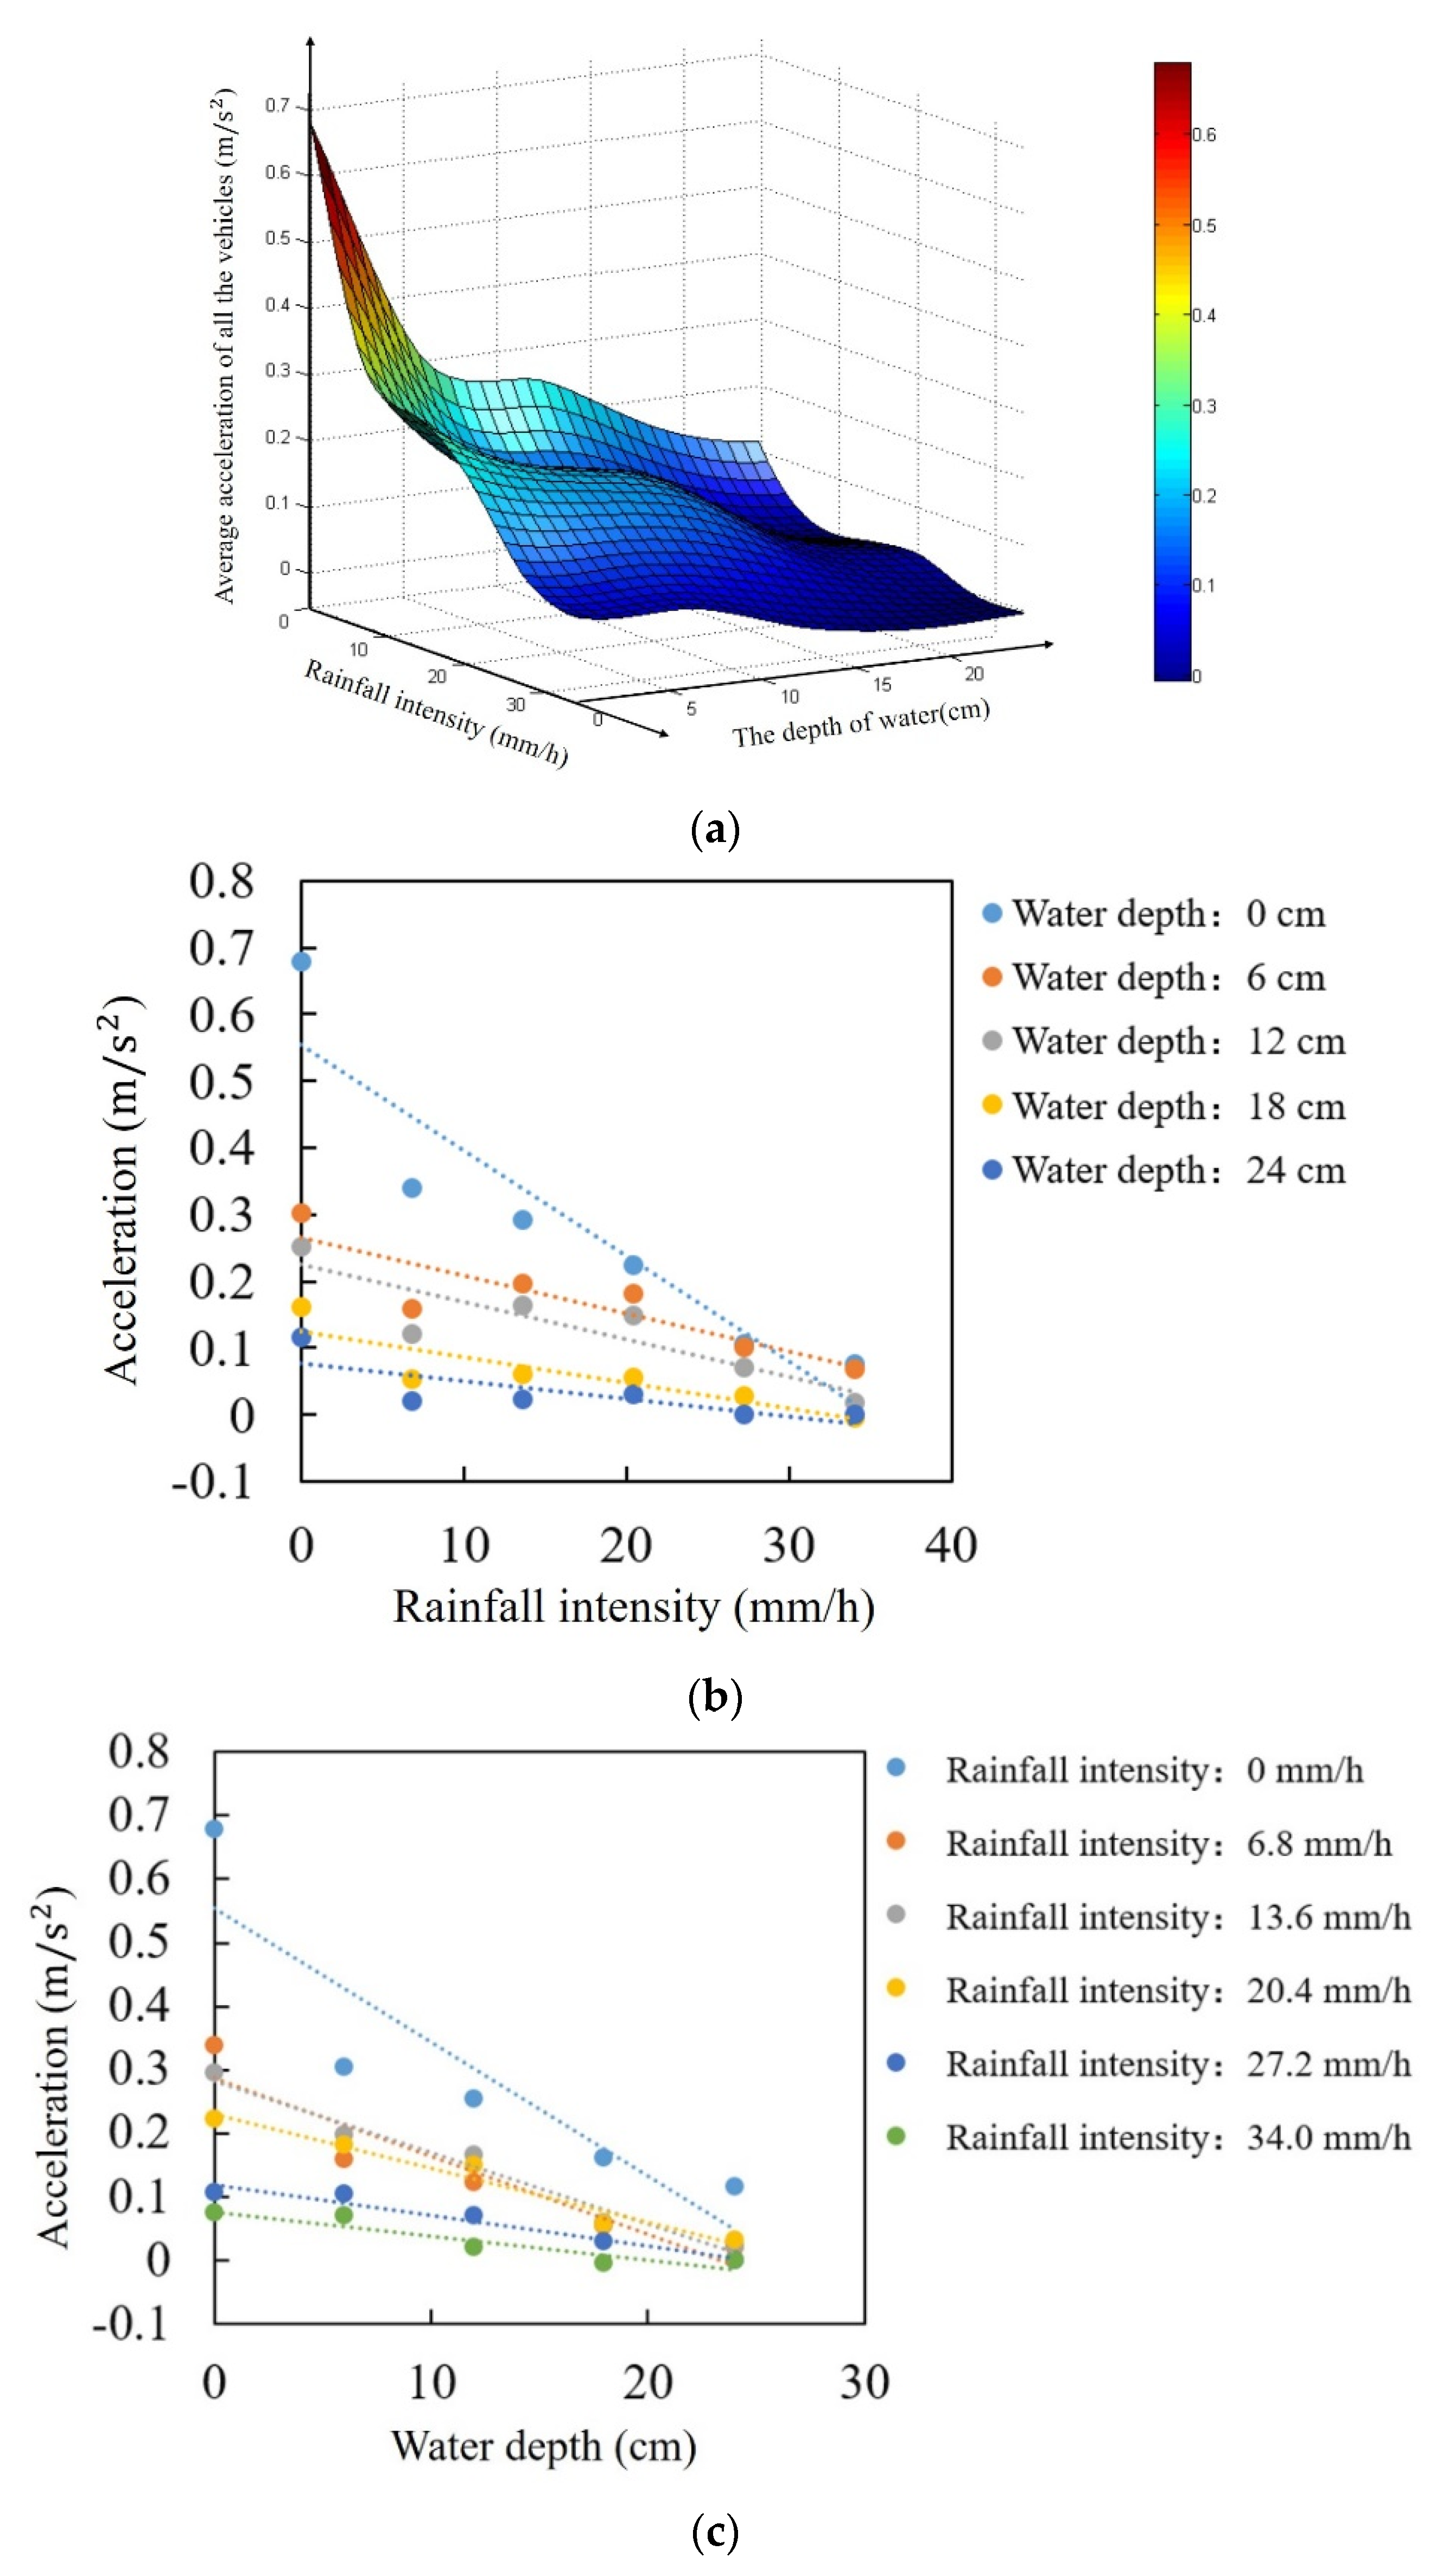
Table 2 shows the two-way ANOVA table regarding the influence of rainfall intensity and water depth on the mean acceleration of all the vehicles in the free acceleration period. In terms of water depth D and rainfall intensity Q , both of the p-values are smaller than the significant level, which means that the vehicles’ accelerations in the free acceleration period have significant differences in the conditions of different water depths and rainfall intensities. In terms of the potential influencing factor of the interaction effect D × Q , the p-value is also smaller than the significant level, which means that the interaction and synergistic effect of rainfall and waterlogging on vehicles’ acceleration should not be neglected.
The 3-D fitting curve of the average acceleration of all the vehicles in the free acceleration period is shown in Figure 6a. It can be seen from Figure 6a that the average acceleration of all the vehicles in the free acceleration period decreases with the increase in the rainfall intensity and water depth, indicating that the drivers tend to adopt a more conservative acceleration strategy when encountering stronger rainfall and more severe waterlogging.
Further quantitative results based on Figure 6a are shown in Figure 6b,c. A clear monotonicity can be found in trend curves in Figure 6b,c, also indicating that the increase in rainfall intensity and water depth induces decreased acceleration. The trend curves in light blue color in both Figure 6b,c look slightly different from other trend curves by having a much bigger slope. It can be seen from Figure 6b that when the water depth is 0 cm, the difference between the accelerations when rainfall intensity is 0 mm/h and 6.8 mm/h is quite large. The same rule can also be found in Figure 6c, that when the rainfall intensity is 0 mm/h the difference between the accelerations when water depth is 0 cm and 6 cm is quite large. This finding is similar to the one in Section 4.1, indicating that a sudden rainfall or waterlogging scene has much more significant influence on drivers’ acceleration or deceleration behavior from when they are driving in a normal weather scenario.

4.3. Effect of Rainstorm and Waterlogging on Vehicles’ Deceleration

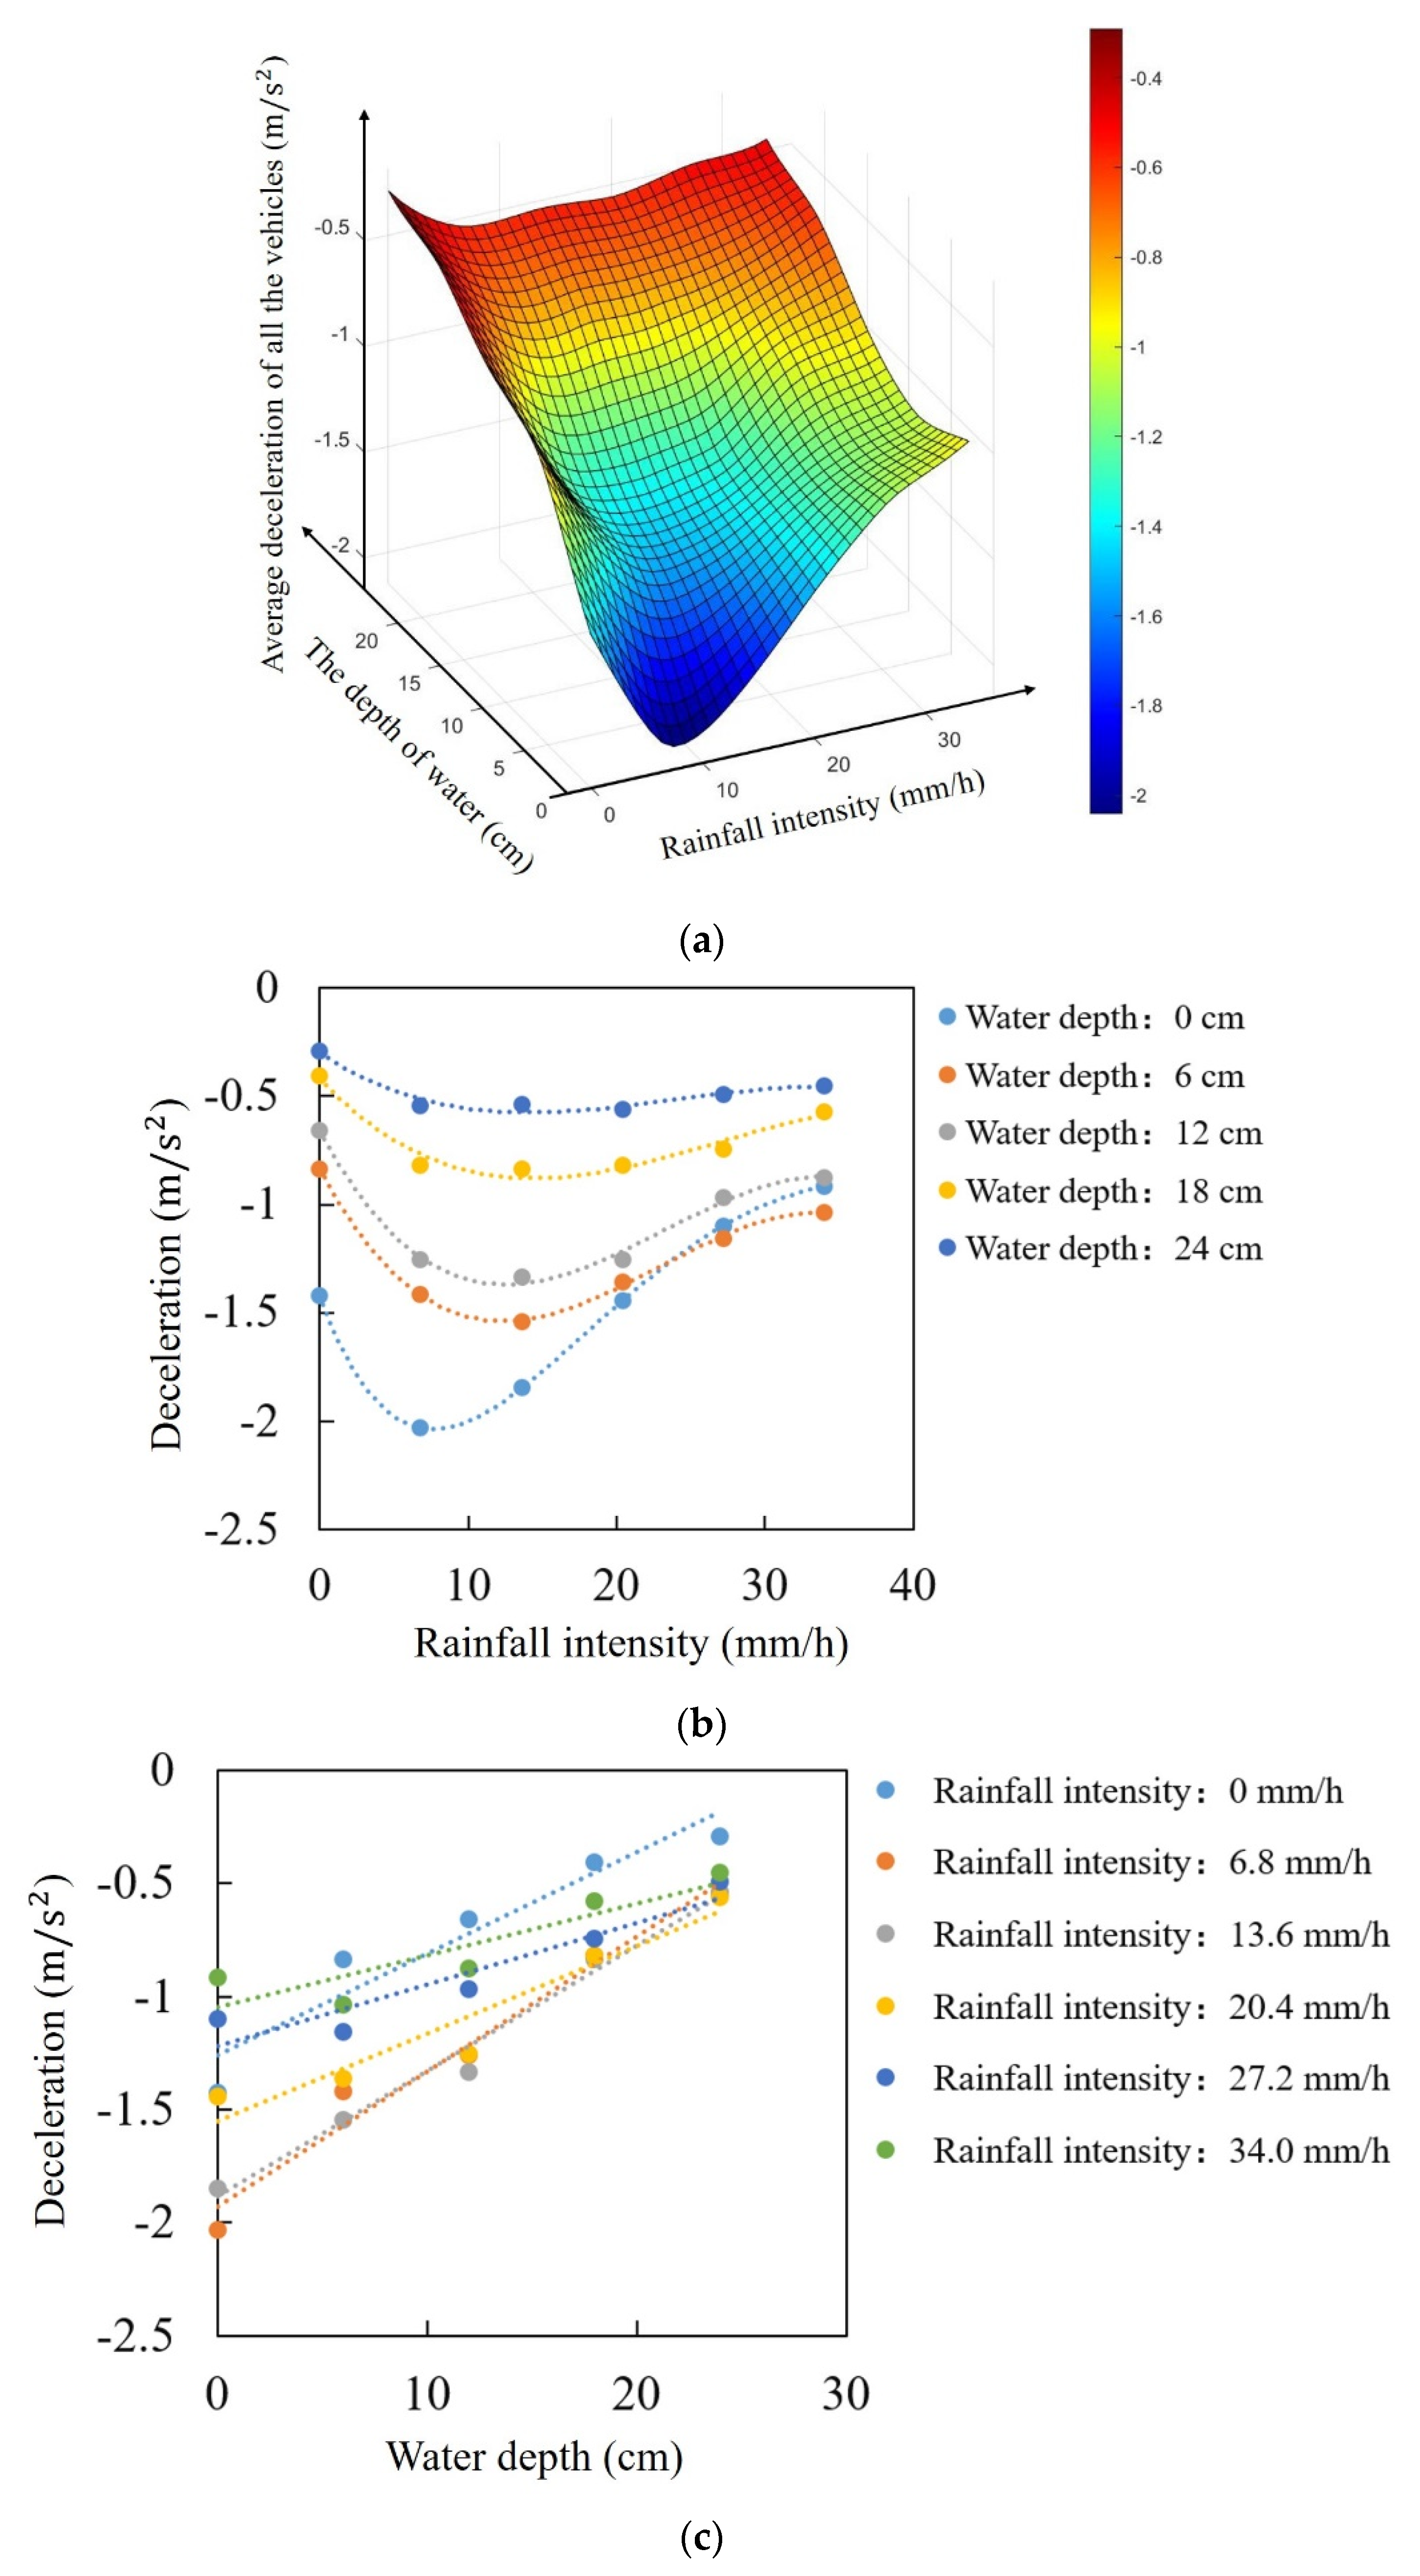
Table 3 shows the two-way ANOVA table regarding the influence of rainfall intensity and water depth on the average deceleration of all the vehicles in the forced deceleration period. In terms of water depth D and rainfall intensity Q , both of the p-values are smaller than the significant level, which means that the vehicles’ decelerations in the forced deceleration period have significant differences in the conditions of different water depths and rainfall intensities. In terms of the potential influencing factor of the interaction effect D × Q , the p-value is also smaller than the significant level, which means the interaction and synergistic effects of rainfall and waterlogging on vehicles’ deceleration should not be neglected.
The 3-D fitting surface of the average deceleration of all the vehicles in the forced deceleration period is shown in Figure 7a. This shows that the fitting curve describing the effect of rainfall intensity on vehicles’ deceleration seems to be non-monotonic, and that the absolute value of deceleration first increases and then decreases with the increase in the rainfall intensity. It is an interesting phenomenon and an important new finding in this study. A possible reason for this is that the drivers are still driving at a relatively high speed when encountering heavy rainfall (for example, Q = 6.8   mm / h ), while they tend to stop cars more quickly for security reasons with a relatively bigger deceleration when they have to stop in a rainfall scenario. In contrast, when encountering rainstorms or even heavy rainstorms with huge rainfall intensities, the drivers have already driven at a low speed and there is no need for emergency braking, thus a more conservative deceleration strategy could be found. Another possible reason can be seen in Figure 7a, where the fitting curve describing the effect of water depth on vehicles’ deceleration seems to be generally monotonic, and the absolute value of deceleration always decreases with the increase in water depth. It is also an interesting phenomenon. The possible reason for this could be that the drivers usually have stronger feelings of insecurity when faced with deeper ponding water, for example, as they have to keep worrying about the vehicle flameout problem for the vehicle’s engine caused by ponding water. This induces a phenomenon that no matter what the rainfall intensity is, the absolute value of deceleration always decreases when water depth increases. The findings from Figure 7a could be further confirmed by Figure 7b,c.

4.4. Effects of Rainstorm and Waterlogging on Vehicles’ Headway Distance

Table 4 is the two-way ANOVA table regarding the influence of rainfall intensity and water depth on the headway distance to the front vehicle of all the experimental vehicles in the car-following period. In terms of water depth D and rainfall intensity Q , both of the p-values are smaller than the significant level, which means that the vehicles’ headway distances in the car-following period have significant differences in conditions of different water depth and rainfall intensity. In terms of the potential influencing factor of the interaction effect D × Q , the p-value is bigger than the significant level, which is totally different from the results regarding acceleration and deceleration; it means that the interaction and synergistic effect of rainfall and waterlogging on vehicles’ headway distance should be neglected.
The 2-D and 3-D fitting surfaces of the headway distance to the front car of all the experimental vehicles in the car-following period are shown in Figure 8a. It can be seen from this figure that the correlation between the headway distance and the water depth is stronger than the correlation between the headway distance and the rainfall intensity. When the water depth is relatively small, the headway distance increases a little with the increase in rainfall intensity; when the water depth is relatively big, the headway distance seems to be only significantly affected by the water depth. These results are consistent with our experience. When the water depth is relatively small, the greater the rainfall intensity is, as the vision of drivers is increasingly blurred and usually the drivers’ sense of danger is stronger; in this situation, the drivers tend to adopt a larger headway distance in the car-following period. When the water depth is relatively deep, drivers’ sense of danger could be mostly affected by waterlogging as it could directly cause the vehicles to break down; in this situation, different levels of rainfall intensity seem to have no significant influence on the drivers’ headway distance choice.
It can be seen from Figure 8b,c that the influence of water depth on the vehicles’ headway distance is much more significant than the influence of rainfall intensity on the vehicles’ headway distance; the curve slopes in Figure 8c are much bigger than the curve slopes in Figure 8b after they are treated as dimensionless coefficients.

5. Validation

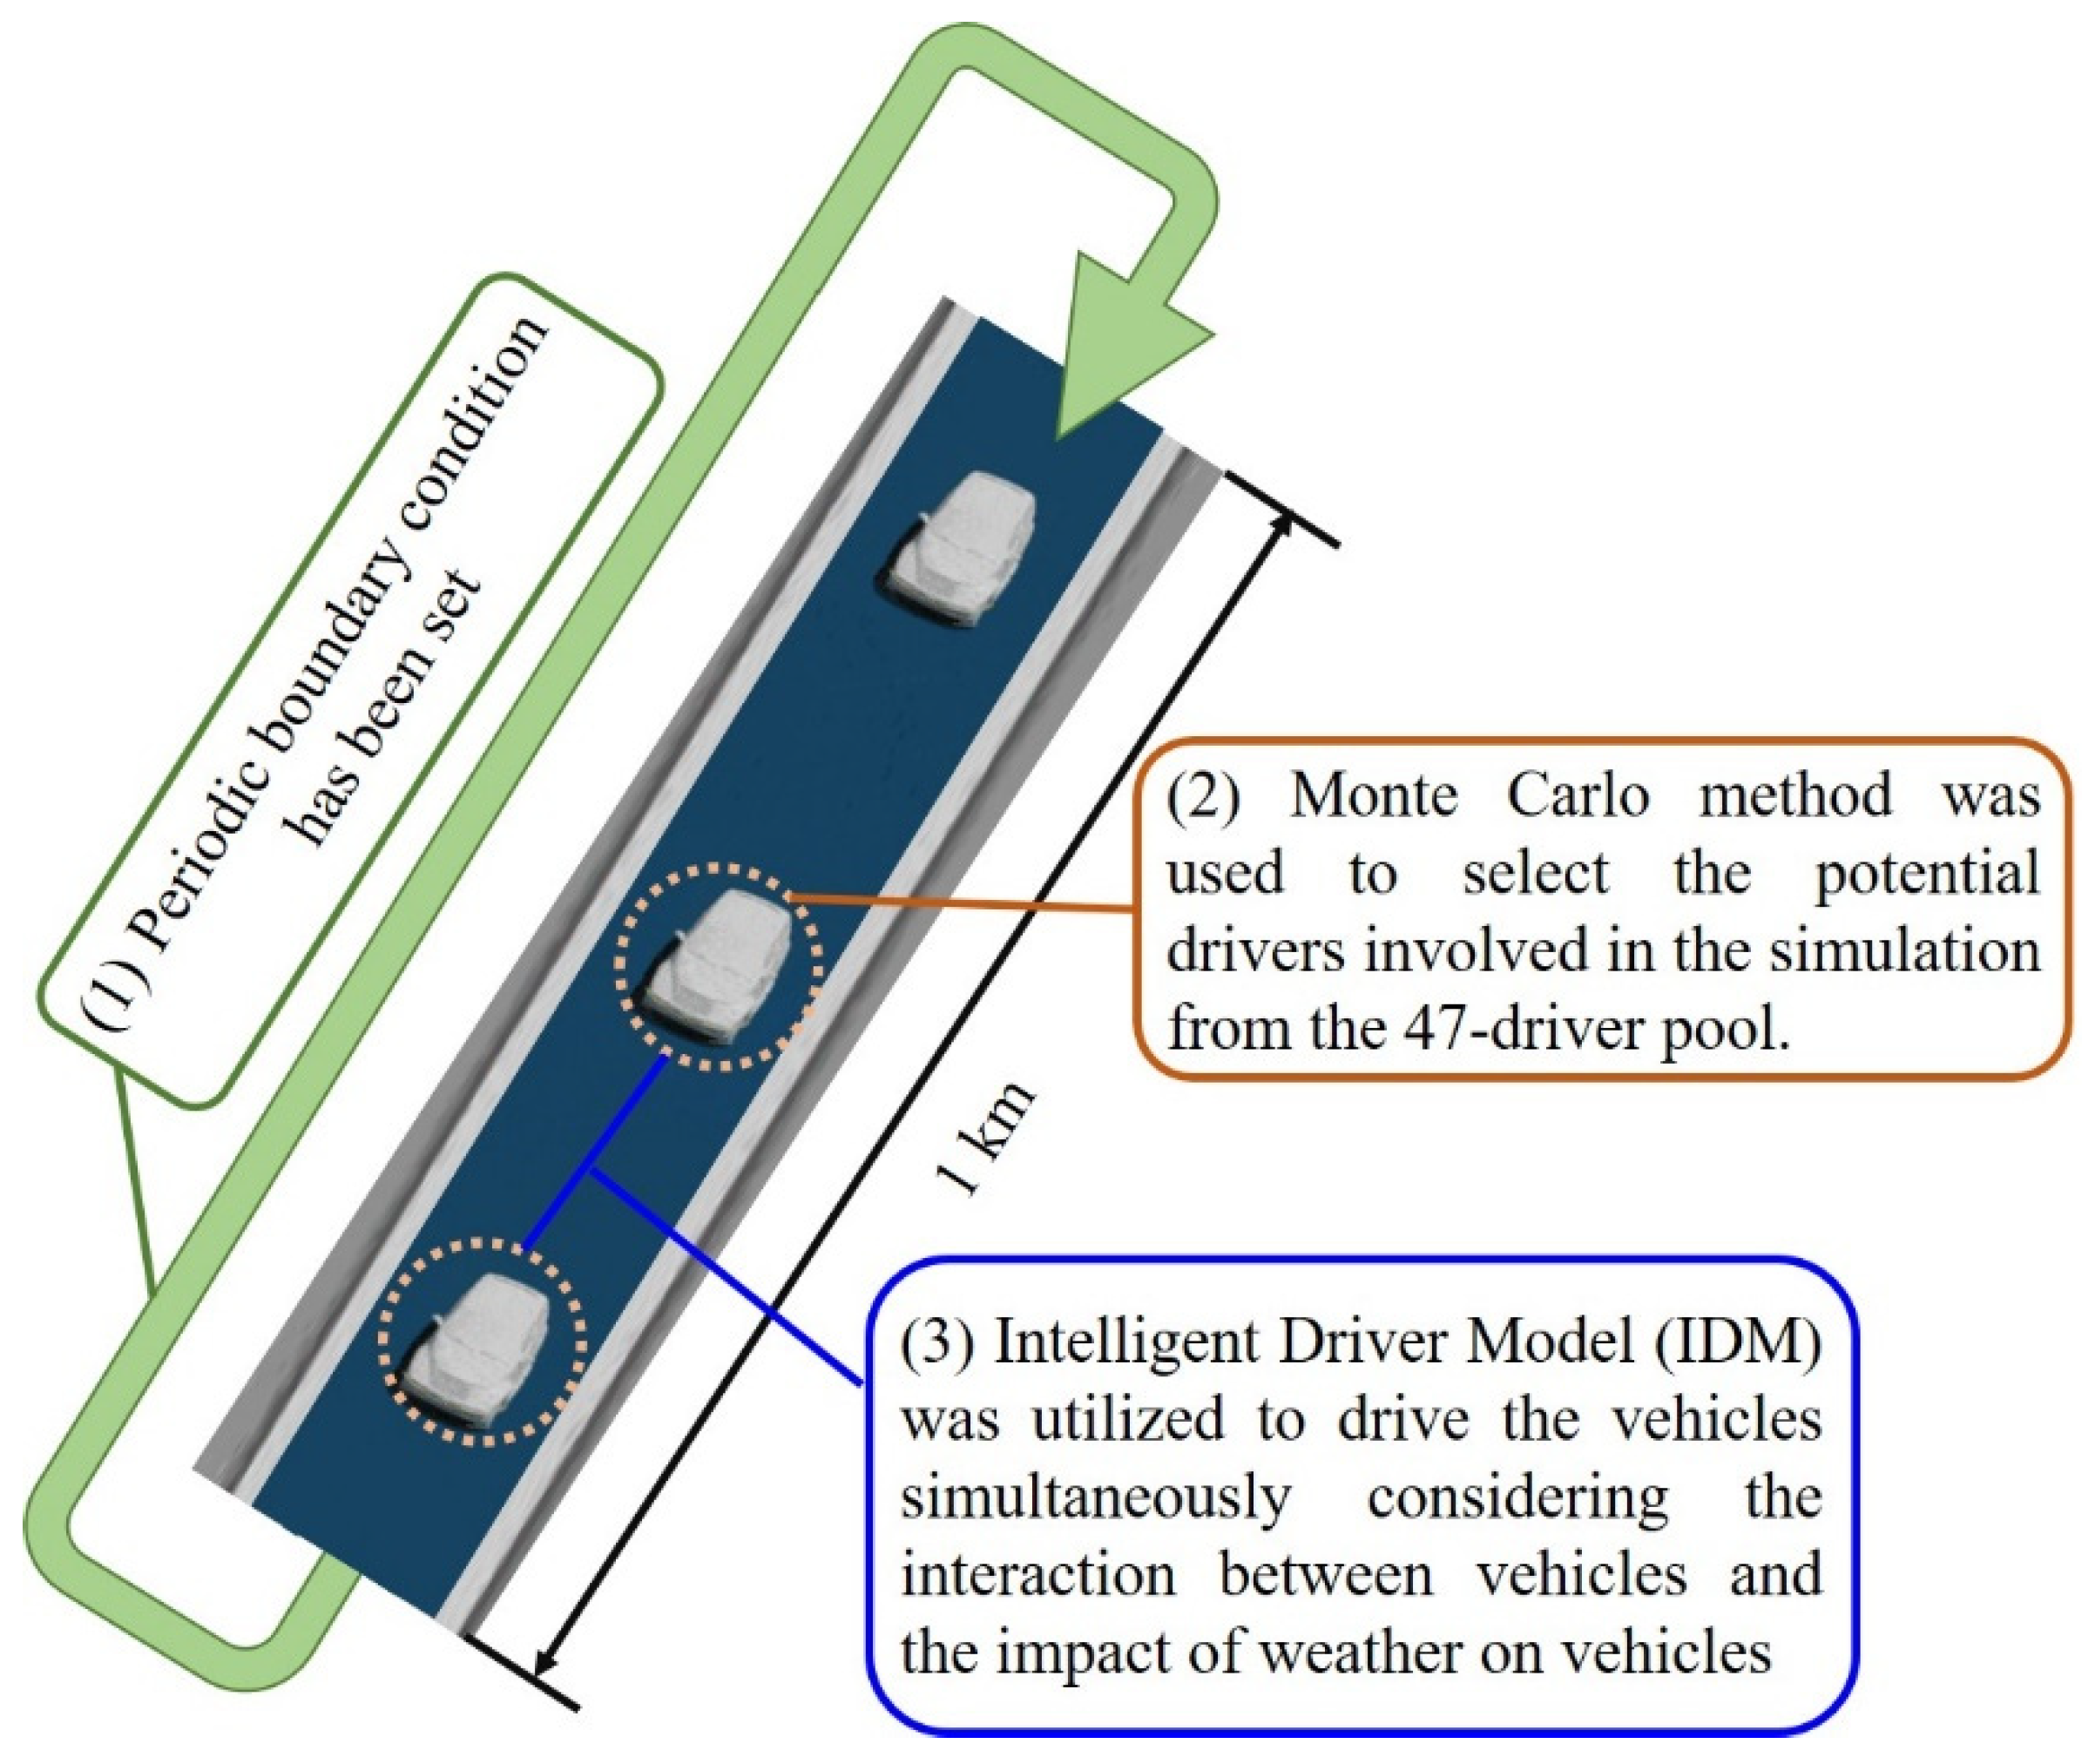
Despite the experiments based on driving simulators having the advantages of rich customized scenes, high controllability, and real-time driving data recording capability [25], direct result validation from the individual perspective has always been a huge difficulty for all the studies based on driving simulators. The reason is that the individual driving data in disaster scenarios produced by driving simulators are easy to record, while the individual driving data in disaster scenarios in real life are difficult to obtain. Therefore, an indirect result validation has been completed by the authors, where the drivers’ driving data obtained from the experiment was used to simulate the traffic flow in circumstances of rainstorm based on the Monte Carlo method and Intelligent Driver Model (IDM) car-following model (as shown in Figure 9).
From an individual point of view, drivers’ driving behavior may vary a lot. In order to diminish the impact of drivers’ heterogeneity on the simulation results, the Monte Carlo method is implemented here to select the potential drivers involved in the simulation from a 47-driver pool. Taking a certain simulation where the vehicles’ density is m veh/km as an example, only m drivers from 47 drivers are picked out to take part in that simulation. These m drivers are selected from 47 drivers by the “sampling with replacement” method. The key traffic characteristics, including capacity and jam density, could then be obtained from that simulation. Next, more than eight groups of simulations were conducted repeatedly, while the drivers involved in the following simulations could be different since in each simulation the drivers are reselected by the “sampling with replacement” method. After all the simulations were completed, the average value of traffic flow parameters could be obtained.
For each simulation, after the drivers had been determined by the mentioned “sampling with replacement” method, the Intelligent Driver Model (IDM) was then used to drive the vehicles. The expression for the selected car-following model IDM is shown in Equation (18):
{ a n ( t ) = a ( n ) [ 1 ( v n ( t ) v n d ) δ ( s n * ( v n ( t ) , v n ( t ) ) s n ( t ) ) 2 ] s n * ( v n ( t ) , v n ( t ) ) = s n ( 0 ) + s n ( 1 ) v n ( t ) v n d + v n ( t ) T s + v n ( t ) v n ( t ) 2 a ( n ) b 2 ( n )
where a n ( t ) denotes the acceleration of the experimental vehicle ( n ) at time t ; v n ( t ) and v n 1 ( t ) , respectively, denote the velocity of the experimental vehicle ( n ) and the front vehicle ( n 1 ) at time t ; δ is a free acceleration index, which depends on the driver’s urgency to reach the desired speed and varies from person to person; v n ( t )   ( = v n ( t ) v n 1 ( t ) ) denotes the velocity difference between vehicle ( n ) and vehicle ( n 1 ); s n ( 0 ) denotes a parameter related to static safety distance; s n ( 1 ) denotes a parameter related to the vehicle’s velocity; v n d denotes the desired velocity of vehicle ( n ); T s denotes a parameter related to safe interval; a ( n ) denotes the maximum acceleration rate of vehicle ( n ) that the driver is willing to adopt ;   and   b 2 ( n ) denotes the desired deceleration rate or comfortable deceleration rate of vehicle ( n ). Here, the parameters of δ , s n ( 0 ) , s n ( 1 ) ,   v n d , T s ,   a ( n ) , b 2 ( n ) for different drivers in different circumstances of rainfall and waterlogging can all be calibrated when the drivers’ driving data from the experiments are treated as the benchmark.
The results from the simulations were then compared with findings from previous studies, as shown in Table 5. Despite the use of a totally novel technical roadmap, it was found that the simulation results are highly consistent with the previous studies, indicating the validity of the methods and results from this study.

6. Limitations

Driving behavior could be affected by many potential impact factors, while it is almost impossible to study all the impact factors in just one experiment. In this paper, rainfall intensity and waterlogging depth were selected as the main impact factors for study. However, less attention was paid to the other environmental factors such as lightning, wind, ambient light conditions, and the attributes of the subjects such as drivers’ occupations, driving experience, ages, genders, mental status, etc.; this is, of course, a limitation of this study, but this issue can be studied further in the near future.
In reality, the resistance force of rainwater to vehicles could be non-ignorable when the water depth is very large, which should be taken into consideration in the experiment. Despite the driving simulator and UC-win/road developed by Forum 8 Company being the most advanced platforms in this field, the factor of the resistance force from rainwater to vehicles still cannot be considered fully for technical reasons. This is another limitation in this study which might affect the experimental results. This technical bottleneck is expected to be solved by the engineers in Forum 8 in the next few years.

7. Conclusions

A driving experiment was conducted involving various circumstances of rainstorm coupling with waterlogging, based on a high-fidelity driving simulator. A total of 47 subjects was recruited and 30 groups of circumstances with different rainfall intensities and water depths were designed in the experiment. Kinematic parameters including the vehicles’ speeds during the whole period, vehicles’ acceleration in the free acceleration period, vehicles’ deceleration in the forced deceleration period, and the headway distance in the car-following period were chosen to profile the drivers’ driving behavior. Two-way ANOVA and narrowly defined statistical analysis were used to analyze the characteristics of the above driving parameters in different circumstances of rainstorm and waterlogging.
A variety of important findings were obtained from the experiments that:
  • Both rainfall and waterlogging have significant weakening effects on drivers’ driving speed and acceleration, indicating that the drivers tend to adopt more conservative driving and acceleration strategies when encountering stronger rainfall and more severe waterlogging;
  • The influence of rainfall on drivers’ deceleration performance is relatively complex and the absolute value of drivers’ deceleration first increases and then decreases with increased rainfall intensity. In contrast, the absolute value of drivers’ deceleration always decreases with increased water depth;
  • The influence of water depth on the vehicles’ headway distance when drivers are in the car-following state is much more significant than the influence of rainfall intensity on vehicles’ headway distance, indicating that waterlogging may be the main factor affecting traffic flow in daily urban road traffic if considering that car-following is the principal state in urban road traffic.
This work is believed to be the first study regarding the influence of both the rainfall and waterlogging on drivers’ driving behavior from an individual perspective, and it provides a deeper understanding of the impact of rainfall and waterlogging on drivers’ driving behavior. It should also be noted that the drivers’ driving behavior may also be affected by the pavement conditions or the complex urban road environment. It creates a dilemma that the traffic conditions in different countries or cities under similar weather conditions may vary greatly, and it shows the difficulty of generating uniform and applicable safe driving guidelines for drivers from different countries or cities when encountering inclement weather. The study indicates that a driving simulator has a broader prospect to be applied in the research on safe driving behavior in inclement weather and could be popularized in different countries and cities. The findings from these studies could provide solid support for traffic emergency disposal planning.

Author Contributions

Conceptualization, X.N. and H.H.; methodology, X.N., H.H. and H.X.; software, Y.L. and H.X.; validation, X.N. and H.X.; formal analysis, X.N.; investigation, X.N., R.L. and A.C.; resources, Y.L.; data curation, X.N.; writing—original draft preparation, X.N.; writing—review and editing, H.H., A.C., K.L. and M.W.; visualization, X.N.; supervision, H.H., K.L. and M.W.; project administration, H.H.; funding acquisition, H.H. All authors have read and agreed to the published version of the manuscript.

Funding

This research was funded by the National Natural Science Foundation of China, grant nos. 72091512, 71774093; National Key R&D Program of China, grant no. 2018YFC0809900.

Institutional Review Board Statement

Not applicable.

Informed Consent Statement

Informed consent was obtained from all subjects involved in the study.

Data Availability Statement

Some or all data, models, or code that support the findings of this study are available from the corresponding author upon reasonable request.

Conflicts of Interest

The authors declare no conflict of interest.

References

  1. Chen, Y.; Zhou, H.; Zhang, H.; Du, G.; Zhou, J. Urban flood risk warning under rapid urbanization. Environ. Res. 2015, 139, 3–10. [Google Scholar] [CrossRef] [PubMed]
  2. Cheng, M.; Qin, H.; Fu, G.; He, K. Performance evaluation of time-sharing utilization of multi-function sponge space to reduce waterlogging in a highly urbanizing area. J. Environ. Manag. 2020, 269, 110760. [Google Scholar] [CrossRef] [PubMed]
  3. Meng, X.; Zhang, M.; Wen, J.; Du, S.; Xu, H.; Wang, L.; Yang, Y. A simple GIS-based model for urban rainstorm inundation simulation. Sustainability 2019, 11, 2830. [Google Scholar] [CrossRef] [Green Version]
  4. Liu, H.; Jia, Y.; Niu, C. “Sponge city” concept helps solve China’s urban water problems. Environ. Earth Sci. 2017, 76, 473. [Google Scholar] [CrossRef]
  5. Mitra, S. Sun glare and road safety: An empirical investigation of intersection crashes. Saf. Sci. 2014, 70, 246–254. [Google Scholar] [CrossRef]
  6. Ni, X.; Huang, H.; Chen, A.; Liu, Y.; Xing, H. Effect of heavy rainstorm and rain-induced waterlogging on traffic flow on urban road sections: Integrated experiment and simulation study. J. Transp. Eng. Part A Syst. 2021, 147, 10. [Google Scholar] [CrossRef]
  7. Do, M.; Kim, M.; Oh, J. Effects of Weather Conditions on Free-Flow Speeds. Proceedings of the 5th Conference of the Eastern Asia Society for Transportation Studies. 2003, pp. 1390–1403. Available online: http://www.easts.info/2003proceedings/papers/1390.pdf#[0,{%22name%22:%22FitH%22},845 (accessed on 26 May 2022).
  8. Dhaliwal, S.S.; Wu, X.; Thai, J.; Jia, X. Effects of rain on freeway traffic in southern California. Transp. Res. Rec. J. Transp. Res. Board 2017, 2616, 69–80. [Google Scholar] [CrossRef] [Green Version]
  9. Feng, H.; Li, C.; Zhao, N.; Hu, H. Modeling the impacts of related factors on traffic operation. Procedia Eng. 2011, 12, 99–104. [Google Scholar] [CrossRef] [Green Version]
  10. Hassan, S.A.; Wong, L.; Mashros, N.; Mohammed Alhassan, H.; Abdul Sukor, N.S.; Rohani, M.; Minhans, A. Operating speed of vehicles during rainfall at night: Case study in Pontian, Johor. J. Teknol. 2016, 78, 9–18. [Google Scholar] [CrossRef] [Green Version]
  11. Kurte, K.; Ravulaparthy, S.; Berres, A.; Allen, M.; Sanyal, J. Regional-scale spatio-temporal analysis of impacts of weather on traffic speed in Chicago using probe data. Procedia Comput. Sci. 2019, 155, 551–558. [Google Scholar] [CrossRef]
  12. Mirbaha, B.; Saffarzadeh, M.; Beheshty, S.A.; Aniran, M.; Yazdani, M.; Shirini, B. Predicting average vehicle speed in two lane highways considering weather condition and traffic characteristics. In World Multidisciplinary Civil Engineering-Architecture-Urban Planning Symposium (WMCAUS); IOP: Bristol, UK, 2017. [Google Scholar] [CrossRef] [Green Version]
  13. Mukhlas, N.A.; Mashros, N.; Che Puan, O.; Hassan, S.A.; Abdul Hassan, N.; Abdullah, R.A.; Rahman, R. Effect of rainfall on traffic flow characteristics during night Time. J. Teknol. 2016, 78, 1–7. [Google Scholar] [CrossRef] [Green Version]
  14. Wang, Y.; Luo, J. Study of rainfall impacts on freeway traffic flow characteristics. Transp. Res. Procedia 2017, 25, 1533–1543. [Google Scholar] [CrossRef]
  15. Zhang, W.; Li, R.; Shang, P.; Liu, H. Impact analysis of rainfall on traffic flow characteristics in Beijing. Int. J. Intell. Transp. Syst. Res. 2018, 17, 150–160. [Google Scholar] [CrossRef]
  16. Li, J.; Lam, W.H.K.; Li, X. Modeling the effects of rainfall intensity on the heteroscedastic traffic speed dispersion on urban roads. J. Transp. Eng. 2016, 142, 05016002. [Google Scholar] [CrossRef]
  17. Hu, S.; Lin, H.; Xie, K.; Dai, J.; Qui, J. Impacts of rain and waterlogging on traffic speed and volume on urban roads. In Proceedings of the 21st International Conference on Intelligent Transportation Systems (ITSC), Maui, HI, USA, 4–7 November 2018; pp. 2943–2948. [Google Scholar]
  18. Ji, X.; Shao, C. Modeling and analyzing free-flow speed of environment traffic flow in rainstorm based on geomagnetic detector data. Ekoloji 2019, 28, 4223–4230. [Google Scholar]
  19. Jia, Y.; Wu, J.; Du, Y. Modeling and simulation of rainfall impacts on urban traffic flow: A case study in Beijing. In Proceedings of the Theory, Methodology, Tools and Applications for Modeling and Simulation of Complex Systems, Beijing, China, 8–11 October 2016; pp. 475–484. [Google Scholar] [CrossRef]
  20. Liu, X.; Wu, B.; Zhao, Y.; Zheng, L. Analysis of speed characteristics of urban expressways under rainy conditions. In Proceedings of the2017 IEEE 20th International Conference on Intelligent Transportation Systems (ITSC), Yokohama, Japan, 16–19 October 2017. [Google Scholar] [CrossRef]
  21. Hussain, E.; Ahmed, S.I.; Ali, M.S. Modeling the effects of rainfall on vehicular traffic. J. Mod. Transp. 2018, 26, 133–146. [Google Scholar] [CrossRef] [Green Version]
  22. Chen, C.; Zhao, X.; Liu, H.; Ren, G.; Zhang, Y.; Liu, X. Assessing the influence of adverse weather on traffic flow characteristics using a driving simulator and VISSIM. Sustainability 2019, 11, 830. [Google Scholar] [CrossRef] [Green Version]
  23. Zhao, X.; Ren, G.; Chen, C.; Rong, J.; Chang, X. Comprehensive effects of adverse weather on driver’s car-following behavior based on driving simulation technology. J. Chongqing Jiaotong Univ. (Nat. Sci.) 2019, 38, 90–95. (In Chinese) [Google Scholar] [CrossRef]
  24. China Meteorological Service Association. Precipitation Grade of Approaching Short-Term Rainfall in the Aspect of Meteorological Service. Available online: http://www.chinamsa.org/57850-718.html (accessed on 26 May 2022). (In Chineses).
  25. Shariff, M.; Che Puan, O.; Mashros, N. Review of traffic data collection methods for drivers’ car—following behaviour under various weather conditions. J. Teknol. 2016, 78, 37–47. [Google Scholar] [CrossRef] [Green Version]
  26. National Research Council (U.S.). Highway Capacity Manual: Metric Units; Transportation Research Board: Washington, DC, USA, 2000; pp. 22–29. [Google Scholar]
  27. Smith, B.L.; Byrne, K.G.; Copperman, R.B.; Hennessy, S.M.; Goodall, N.J. An investigation into the impact of rainfall on freeway traffic flow. In Proceedings of the 83rd Annual Meeting of The Transportation Research Board, Washington, DC, USA, 11–15 January 2004. [Google Scholar] [CrossRef]
  28. Okamoto, N.; Ishida, H.; Furuya, H.; Furukawa, K. Including weather condition factors in the analysis of the highway capacity. In Proceedings of the 83rd Annual Meeting of the Transportation Research Board, Washington, DC, USA, 11–15 January 2004. [Google Scholar]
  29. Rakha, H.; Farzaneh, M.; Arafeh, M.; Sterzin, E. Inclement weather impacts on freeway traffic stream behavior. Transp. Res. Rec. J. Transp. Res. Board 2008, 2071, 8–18. [Google Scholar] [CrossRef]
  30. Wang, X. Study on traffic flow characteristics of urban expressway under rainstorm. In Transportation Planning and Management; Beijing Jiaotong University: Beijing, China, 2015. (In Chinese) [Google Scholar]
  31. Sun, H.; Yang, J.; Wu, B. Empirical analysis of the influence of rainstorm on the speed density relationship on expressway. J. Transp. Syst. Eng. Inf. Technol. 2016, 16, 221–227. (In Chinese) [Google Scholar]
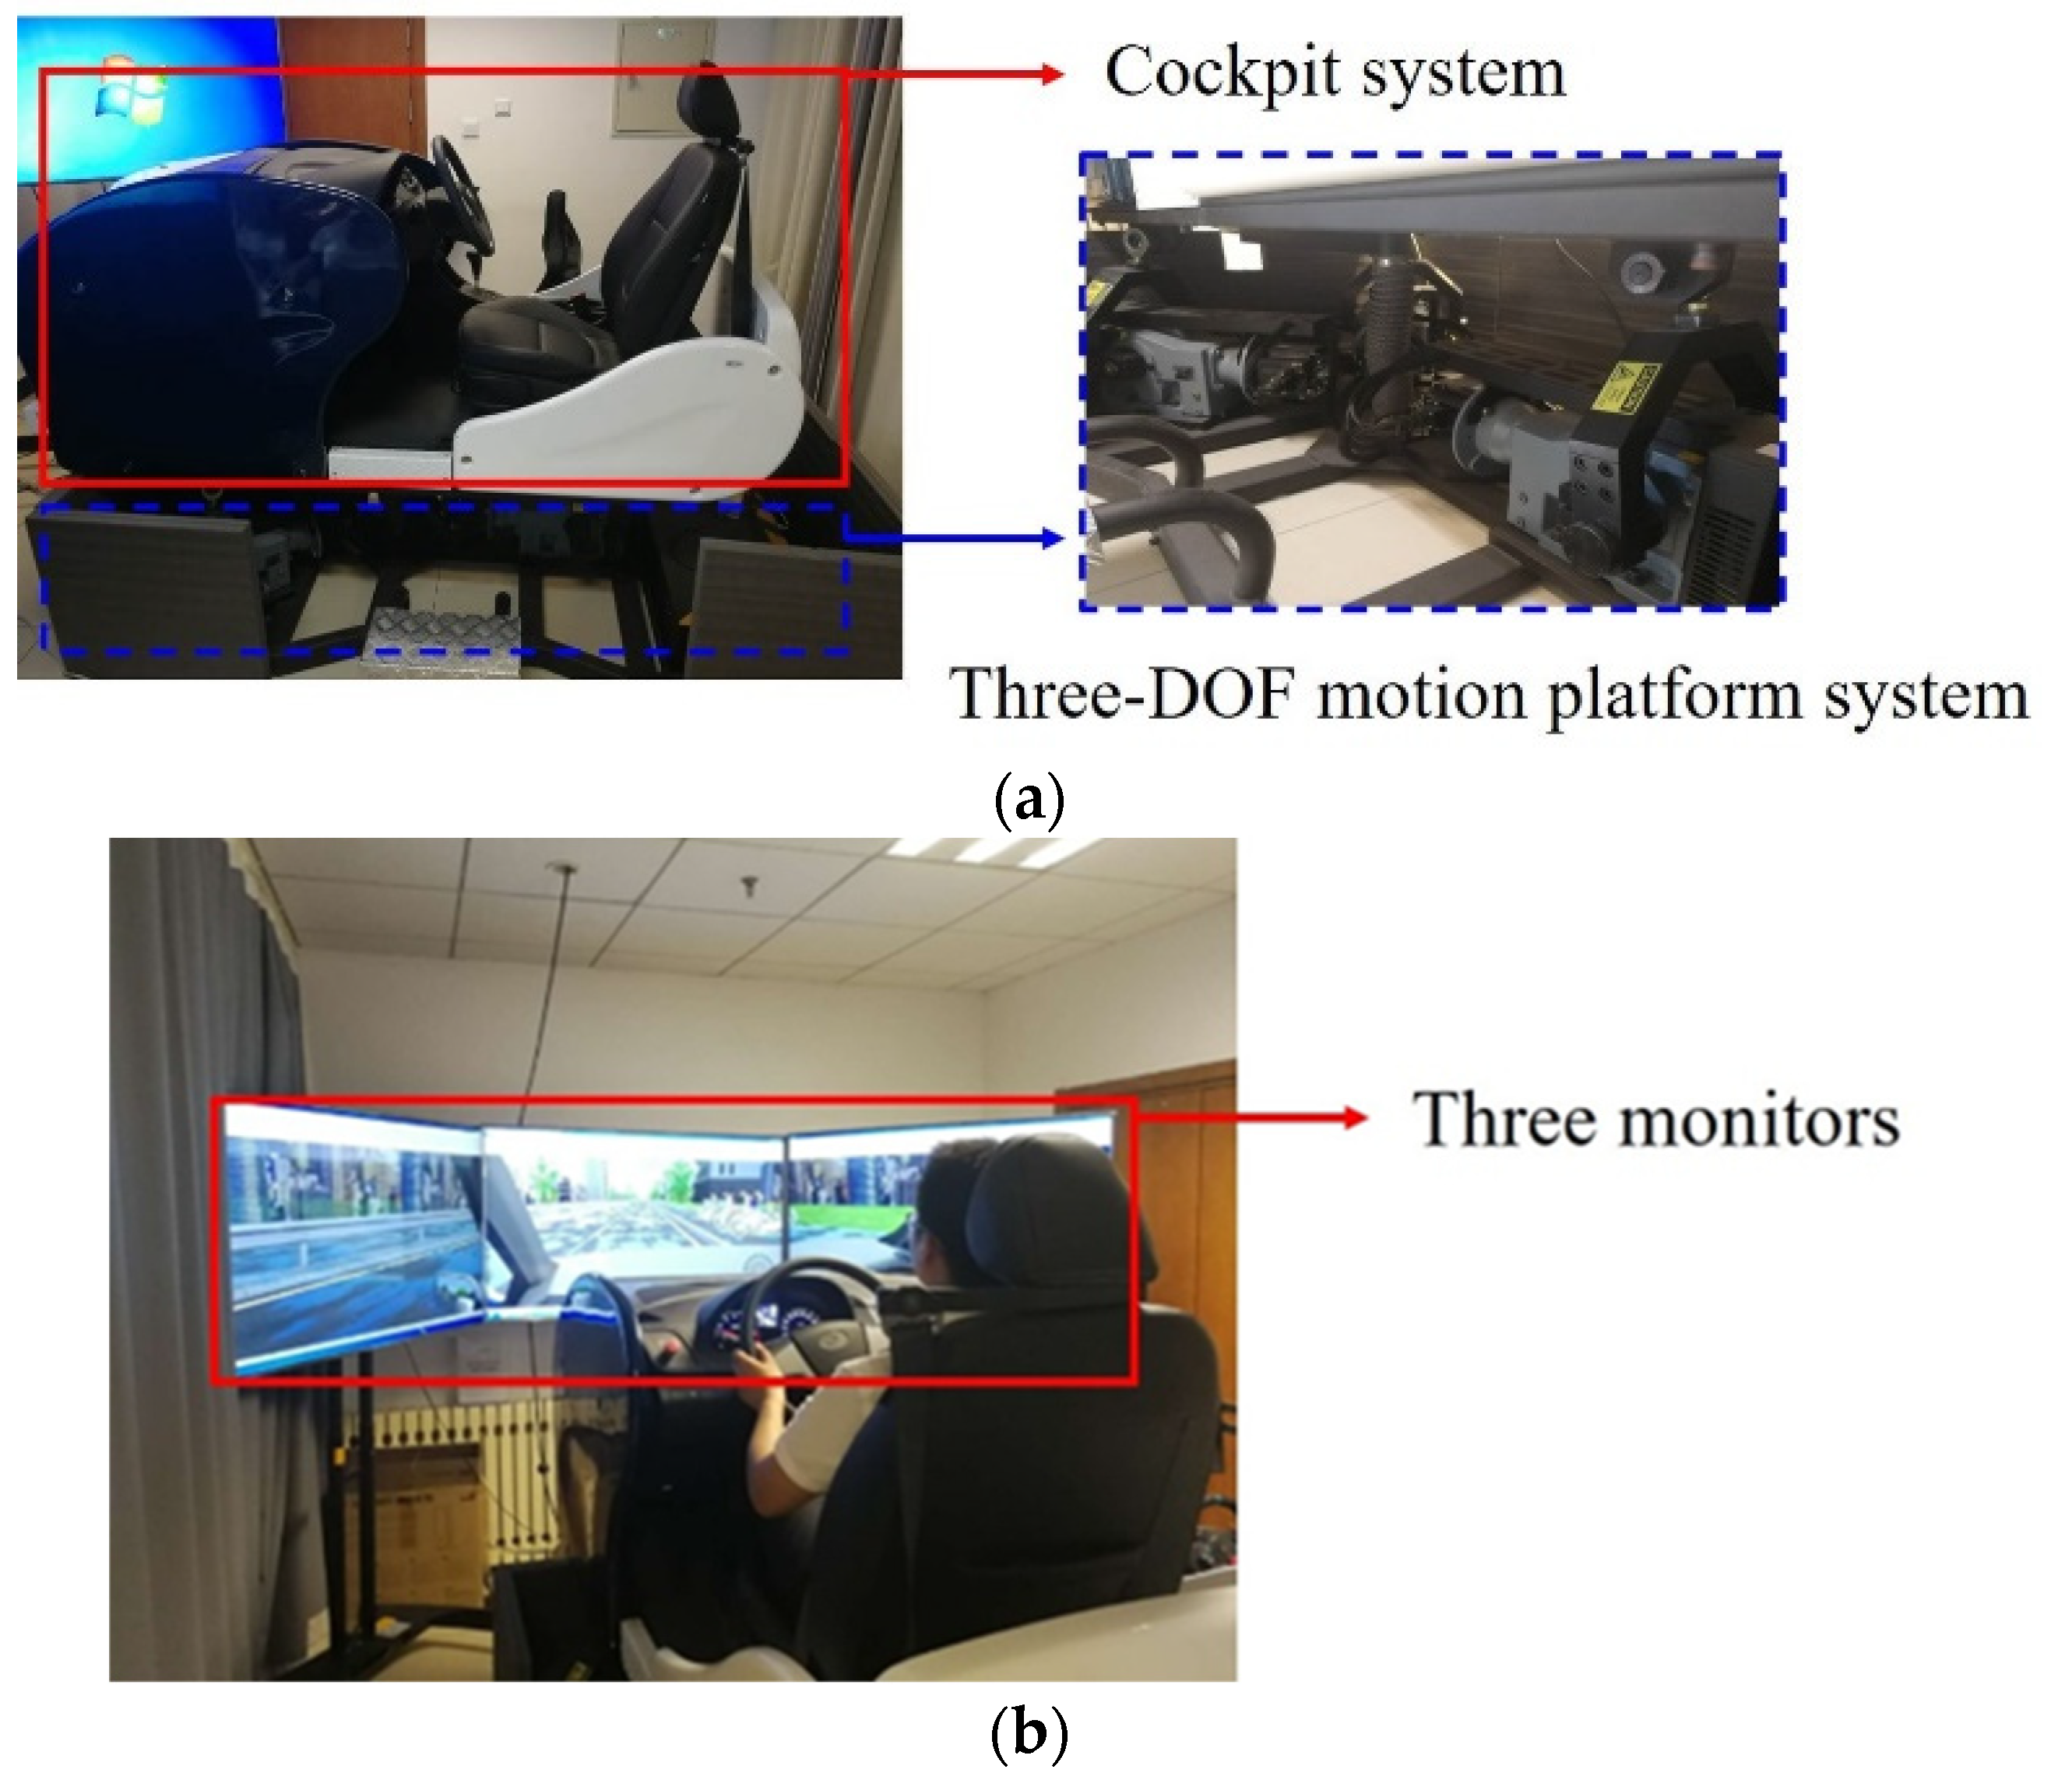
Figure 1. Overview of the hardware and software equipment in the experiment: (a) Side view of hardware equipment; (b) Rear view of hardware equipment.
Sustainability 14 08517 g001
Figure 2. Circumstance design in the experiment for one subject: (a) Example of rainfall circumstances; (b) Example of waterlogging circumstances; (c) Circumstance design of the total driving procedure.
Sustainability 14 08517 g002
Figure 3. Mean speed of all the vehicles throughout the entire experiment.
Sustainability 14 08517 g003
Figure 4. Impact of rainfall intensity and water depth on the maximum speed of all the experimental vehicles in free acceleration period: (a) Percentage of speed change caused by the change of rainfall intensity with a benchmark that rainfall intensity = 0 mm/h, under the condition of a fixed water depth; (b) Percentage of speed change caused by the change of water depth with a benchmark that water depth = 0 cm, under the condition of a fixed rainfall intensity.
Sustainability 14 08517 g004
Figure 5. Impact of rainfall intensity and water depth on the average speed of all the experimental vehicles in the car-following period: (a) Percentage of speed change caused by the change of rainfall intensity with a benchmark that rainfall intensity = 0 mm/h, under the condition of a fixed water depth; (b) Percentage of speed change caused by the change of water depth with a benchmark that water depth = 0 cm, under the condition of a fixed rainfall intensity.
Sustainability 14 08517 g005aSustainability 14 08517 g005b
Figure 6. Impact of rainfall intensity and water depth on the average acceleration of all the experimental vehicles in the free acceleration period: (a) 3-D fitting surface of the average acceleration; (b) Influence of rainfall intensity on vehicles’ acceleration under the condition of a fixed water depth; (c) Influence of water depth on vehicles’ acceleration under the condition of a fixed rainfall intensity.
Sustainability 14 08517 g006
Figure 7. Impact of rainfall intensity and water depth on the average deceleration of all the experimental vehicles in the forced deceleration period: (a) 3-D fitting surface of the average deceleration; (b) Influence of rainfall intensity on vehicles’ deceleration under the condition of a fixed water depth; (c) Influence of water depth on vehicles’ deceleration under the condition of a fixed rainfall intensity.
Sustainability 14 08517 g007
Figure 8. Impact of rainfall intensity and water depth on the average headway distance of all the experimental vehicles in the car-following period: (a) 2-D and 3-D fitting surfaces of the headway distance; (b) Influence of rainfall intensity on vehicles’ headway distance under the condition of a fixed water depth; (c) Influence of water depth on vehicles’ headway distance under the condition of a fixed rainfall intensity.
Sustainability 14 08517 g008
Figure 9. Basic scene settings and core algorithm in the simulation for validation.
Sustainability 14 08517 g009
Table 1. Two-way ANOVA table when the interaction effect is significant.
Source of the VariationSDDOFMSEStatistics F α   Sig.
S v V F
D S D v D V D F D = V D / V e F α ( v D , v e ) P D
Q S Q v Q V Q F Q = V Q / V e F α ( v D , v e ) P Q
D × Q S D × Q v D × Q V D × Q F D × Q = V D × Q / V e F α ( v D × Q , v e ) P I
Error   e S e v e V e
Sum S M v M
Table 2. Two-way ANOVA table regarding the influence of rainfall intensity and water depth on vehicles’ acceleration.
Source of the VariationSDDOFMSEStatisticsSig.
S v V F
D   ( cm ) 11.34942.837176.4370.000 *
Q   ( mm / h ) 10.39852.080129.3220.000 *
D   ( cm ) × Q ( mm / h ) 4.996200.25015.5330.000 *
Error   e 22.19213800.016
Sum48.9351409
* p-value < significant level 0.05.
Table 3. Two-way ANOVA table regarding the influence of rainfall intensity and water depth on vehicles’ deceleration.
Source of the VariationSDDOFMSEStatisticsSig.
S v V F
D   ( cm ) 176.253444.063118.3310.000 *
Q   ( mm / h ) 56.541511.30830.3680.000 *
D   ( cm ) × Q ( mm / h ) 28.359201.4183.8080.000 *
Error   e 513.87413800.372
Sum775.0271409
* p-value < significant level 0.05.
Table 4. Two-way ANOVA table regarding the influence of rainfall intensity and water depth on vehicles’ headway distance.
Source of the VariationSDDOFMSEStatisticsSig.
S v V F
D   ( cm ) 76,107.5419,026.9109.70.000 *
Q   ( mm / h ) 3240.35648.13.70.002 *
D   ( cm ) × Q ( mm / h ) 877.42043.90.31.000
Error   e 239,324.31380173.4
Sum240,201.81400171.6
* p-value < significant level 0.05.
Table 5. Comparison with previous relevant studies by other authors.
Author, Pub-YearDescription of Rainfall IntensityNumerical Value of Rainfall IntensityIndicatorRates of Change
HCM ((U.S.), 2000) [26]Heavy rainNot mentionedCapacity[−15%, −14%]
Smith et al., 2004 [27]Heavy rain>6.35 mm/hCapacity[−30%, −25%]
Okamoto et al., 2004 [28] [heavy rain, rainstorm][4.9, 9.6] mm/hCapacity−33%
Rakha et al., 2008 [29][no rain, rainstorm]0–17 mm/hCapacity[−10%, 11%]
Wang, 2015 [30]Rainstorm30–70 mm/12 h or
50–100 mm/24 h
Capacity[−19.5%, −5.7%]
Jam density[0%, +27.6%]
Sun et al., 2016 [31]Heavy rainstorm106.2–175.5 mm/24 hCapacity[−15.2%, −10.8%]
This study[heavy rain, heavy rainstorm] [6.8, 34.0] mm/hCapacity[−35.7%, +9.1%]
Jam density[+11.0%, +25.5%]
Publisher’s Note: MDPI stays neutral with regard to jurisdictional claims in published maps and institutional affiliations.