Abstract
This paper investigates the market management and modeling based on advanced artificial intelligence. The proposed model deploys the combination of the support vector machine and fuzzy set theory to provide a practical and powerful prediction model for the market price over the next day. A realistic and effective model is then introduced to model the market players, such as the renewable energy sources of solar and wind turbines, as well as the fossil-fueled sources of micro turbines and fuel cells. In order to provide an optimal management program, it introduces a stochastic framework based on the point estimate method and adaptive grey wolf optimization algorithm (GWO). The proposed optimization methods use an adaptive strategy to choose the most fitting modification for enhancing the GWO performance. A realistic scenario is simulated to demonstrate the model’s effectiveness and impression on the real market management. The results clearly show the effectiveness of the prediction and management model. The prediction results show the superiority of the proposed model by RMSE of 2.9643 compared to the 3.217 for SVR, 3.2364 for ANN and 3.0621 for the grey model. Moreover, the optimal MAPE is 2.7453 by the proposed method, which is much better than the 3.052 by SVR, 3.1552 by ANN and 2.9285 by the grey model. From point of view of optimization, the most fitting power dispatch has been attained with the total cost of 300.8632 over 24 h.
1. Introduction
The introduction of the electricity and energy, also called power, market is a system which makes power purchasing and sales possible through bids to offer [1,2]. In this way, the demand and supply regulations are deployed for clearing the market and setting the price. The market price idea would provide a competitive environment in which electricity consumers can play a more active role in deciding what to buy and how much to pay [3,4,5]. Therefore, it is clear that the price of energy would be a motivating term that would increase demand if preserved low enough [6,7]. It is proved that the power market can support the social welfare of the system by decreasing the power price and letting the cheap generation players produce more power than the expensive units [8,9,10]. Therefore, the analysis and modeling of the market is a very critical and significant task, which requires special work and focus to enhance it [11]. Figure 1 shows the way that the market is cleared and its point of common, called MCP, is determined as a tradeoff between demand and supply. One of the most significant issues for the consumer is the estimation or prediction of the next day’s market price for making clear policies and strategies. In recent years, much research has been implemented, a list of which is described in the rest of the introduction.
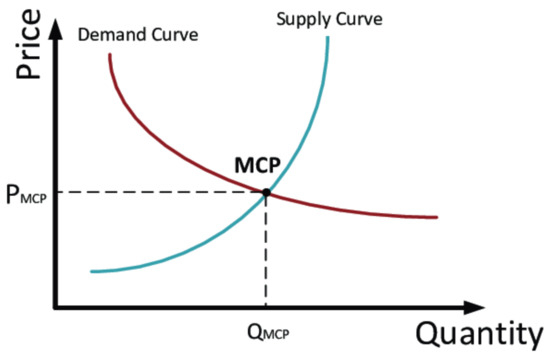
Figure 1.
The market clearing price and the way it is determined.
In [12], the market price is forecasted using a hybrid generative adversarial network model and the results are compared with the some of the most well-known algorithms in the field. It is shown in [13] that the market price and market demand both have high nonlinearity and non-stationary characteristics which, if combined with seasonality, would create a big problem for accurate prediction. In [14], a heuristic flower pollination approach is introduced in conjunction with machine learning to boost the prediction of the market price accuracy. The proposed model considers the feature selection based on a hybrid regression model. In [15], authors assess the impact of renewable units on the market price and forecasting accuracy. A novel bootstrap gradient-based architecture is deployed for the short-term market price forecasting. In [16], a two-step market price forecasting tool is developed which uses deep learning with a loss function. The loss function would penalize any loss of spike in the price and thus some oversampling might be seen. Through the spike calibration approach, the prediction accuracy is improved in the market. The Brazil market price during the years 1998 to 2004 is assessed in [17]. It proposes a theoretical formulation based on Markov, switching to predict the market price and showing how a generator entry might be affected. In [18], the generator output power is forecasted to be an indirect way for estimating the market price. It uses machine learning models and probability sampling for analyzing the Italian electricity market. It is claimed that the proposed method does need to access all market transactions. In [19], the market price over the years January 2017–March 2020 are analyzed to forecast the price. It is shown in their research that the dominant retailers can play a critical role in controling the market price and its growth over the year. In [20], a hybrid Bayesian extreme learning and minimum redundancy are combined to forecast the market price based on the sequence segmentation. Two market price datasets from Ontario, Canada and New York are used to check the accuracy of the proposed model hourly. The authors in [21] try to address the weather effects on market behavior, including on demand and supply, using the fractional Brownian motion. A temperature based stochastic prediction model is developed which can help much to control the market fluctuations.
According to the above explanations, it is well perceived that market modeling and analysis, especially prediction of the market price, are significant tasks which can benefit both the customers and the suppliers. This paper tries to provide market management and prediction based on artificial intelligence (AI) [22]. The proposed AI model uses support vector regression (SVR) [23] to avoid the possible overfitting concerns. It also suggests the fuzzy set theory to find a way for adjusting the kernel function parameters. In addition, the market price is then used as an input to a smart market, including several renewable or fossil fuel-based generators. An objective function is introduced to manage the power suppliers and minimize the cost of generation. Considering the very complex and nonlinear fluctuations in the market price, we need to make use of a novel smart optimization algorithm based on grey wolf optimization (GWO). It is a heuristic optimization method which has shown great abilities over the other algorithms in the literature [24,25]. Therefore, the main contributions of the paper can be shown as below:
- Proposing a fuzzy SVR-based prediction model for the market price
- Introducing a novel optimization algorithm called modified GWO for the optimal scheduling of units in an economic way
- Providing a comprehensive comparison with the most well-known algorithms in the area such ANN, Grey model, SVR, GA, PSO and original GWO
The analysis is implemented in a physical scenario to determine the effectiveness and influence of the proposed model. The simulation results obviously advocate the capabilities of the proposed prediction and management models.
The paper follows a structure organized as follows: Section 2 describes the fuzzy SVR for prediction of the market price. Section 3 describes the market model based on renewable sources and players. In Section 3, the GWO algorithm is explained in detail. Simulation results are then discussed in Section 4. At the end, the main conclusions are summarized.
2. Fuzzy Support Vector Regression
This section proposes a fuzzy support vector machine approach to forecast the electricity market price over the next day. The original idea of support vector machine is rooted in the nonlinear intrinsic structure of the dataset, which forces us to provide a tool for handling this nonlinearity. In this way, a support vector is able to assign a linear function on the nonlinear problem in a higher dimension. To describes this method, the sample points are shown by , wherein M represents the size of the sample. In order to make a nonlinear mapping in the higher dimension, (.) is considered to form the input limited dimension to the output space with high dimension as . This is the core idea of the SVR, which has made it a popular and successful method in machine learning. Figure 2 shows this idea from 2D to 3D conversion. As shown in Figure 2, a nonlinear relationship which is not detectable in 2D can be easily separated by a linear function in a 3D space. The linear function, also called the SVR function, may be formulated as below:
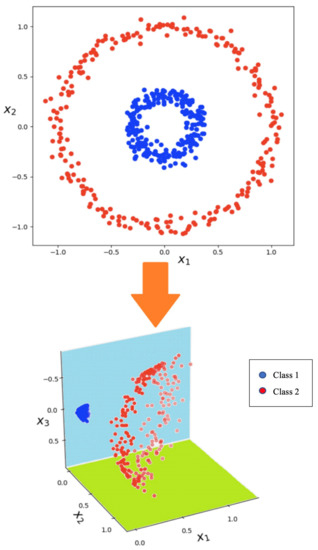
Figure 2.
The higher dimension concept in the SVR.
In the above equation, the symbols W () and b () are the model coefficients, which, if adjusted well, make the final model trustable. The training process is through optimizing the error between the real data and the simulated data y as below:
In this equation, plays the role of the ε-insensitive loss function that is interpreted as below:
Other than the training error, the SVR minimizes the structural complexity, which is shown by multiplication of weighting factors, as below:
The first item in this formulation represents the model structure’s complexity, which, if it becomes too high, the overfitting problem appears. In addition, the parameter C is the constant value employed in the model structure for balancing between the error and complexity. The variables are errors below or above the allowed values of –ε and + ε, respectively. The dual format of the objective function in the new structure may be represented by (5), which is solvable linearly:
A linear solution of the above equation would easily determine the optimal value of the weight factor, as below:
In this model, the new parameters and are called the Lagrangian multipliers. Deploying and provides the dual format of the model, as below:
In (8), the term K(xi, x) is named a kernel function. Theoretically, the kernel function meets Mercer’s condition [26].
A significant point is that the kernel function can much help the mapping process, due to its role in the connection of the input and output in the dataset. Fundamentally, the kernel function is computed by the inner multiplication of φ(xi) and φ(xj). There are different types of kernels, such as the Gaussian or RBF, which can be used. This article proposes a fuzzy model for the kernel function, which can enhance the model performance by suitably adjusting the fuzzy membership function. Figure 3 shows the trapezoidal fuzzy function considered as the kernel function in our model. The input feature of the function is the same as the kernel function in (7). The way that the output is determined instead can help us much in finding a better nonlinear mapping.
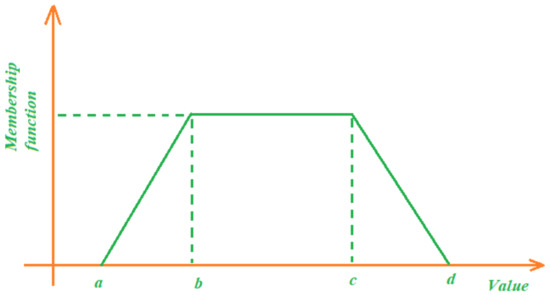
Figure 3.
Fuzzy membership function used as the kernel function.
3. Market Economic Problem Formulation
In this section, an economic model is developed for the market players, including the consumers (loads) and generators (renewable and non-renewable sources), to make sure that the analysis can mitigate the total cost which is beneficial to both players. In order to model the market players, we first try to give a cost function which focuses on the cost of generation by the private generators, utility and battery storage. Therefore, we have considered the two renewable sources of wind turbines and solar units, and two other dispatchable units, i.e., micro turbines and fuel cells. The main goal is that the total power generation would cost the customers less based on the market hourly price. Therefore, the cost function is formulated as in (9), where the first term is the generators’ power cost, the second term is the cost of On/OFF, the third term is the storage cost and the last term is the utility cost:
where T shows the time interval length (here 24 h), shows the number of generators, is the status of a generator, is the generator power output, is the bidding of the generator, is the On/Off switching cost, is the number of storages, is storage status, is the storage power value, is the storage power price, is the main utility power value, and is the grid price.
The control vector which is used for optimizing (9) contains some terms, as below:
where is the generator output power and is the storage output power.
The above cost function is optimized by meeting some operation limits which are explained in detail. Each of the limits is explained here:
- (1)
- the total demand should be provided by the generators and storage, and the utility as active suppliers, to clear the market, as below:In the above, is the load demand at time t and is the number of load levels in the system.
- (2)
- each dispatchable generator or unit is allowed to produce in its limited range, as below:In (12), the min/max indices technically show the least and highest possible values.
- (3)
- The battery storage can only charge/discharge according to its limited charging and discharging rate, as well as the energy storage limit:where is the energy stored at time t, is the charging efficiency, is the discharging efficiency, is the charging power and is the discharging value.
4. Adaptive Grey Wolf Optimization Method
In order to solve the problem formulation described in the last section, we need to make use of a suitable and reliable optimization algorithm. This paper proposes an adaptive grey wolf optimization (AGWO) to make sure that the optimization success is guaranteed. The original GWO is a heuristic method which uses the evolutionary habit of wolves in hunting prey. The GWO is a newly introduced algorithm which has some key features which make it a very powerful optimizer for nonlinear problems. Some of the main features of GWO include: being a simple concept, ease of implementation, powerful local search operators, providing an appropriate balance between local and global searches, and its sub-division ability. These animals live in a group and try to make use of the experience of leaders to make the hunt a successful process. Meanwhile, the leaders can consult with each other to obtain the most promising solution. Other than that, the leaders in some circumstances listen to the wolves to make sure that the maximum efficiency is attained. This shows a low level of democracy, which can boost the optimization process. The main leader of the group is called alpha α. This is the wolf with the smartest decisions in hunting. The next dominant wolf is called beta β, which can play the role of a leader for the group in the absence of α. Moreover, in the presence of α, beta can help him through consultation. In each group, the wolf with the least quality is called omega ω, which are assumed to be workers and need to obey the leader. The remaining wolf members in the group are called delta δ. Figure 4 provides a simple diagram showing the position of these members in the GWO.
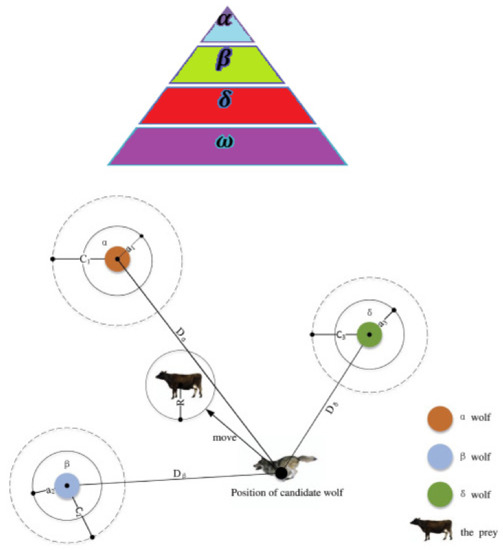
Figure 4.
GWO algorithm structure and concept.
In order to mathematically formulate the idea of grey wolf hunting, we first produce the group of wolves, control vector, in a matrix. After calculating the cost objective for them, the population is sorted in a downward order and the alpha, beta, delta and omega members are determined. In the improvization stage, the wolves hunt a prey which is simulated in a circle with dimension:
where is a random coefficient, k shows the epoch number and Xp is the prey position. The position of each wolf is updated according to (15) as below:
where is a random coefficient. The GWO suggests to update the coefficients and in a recursive way. Therefore, it suggests a recursive formulation to update it, as below:
In the above equations, the parameter a is a decreasing value in the domain (0,2). More explanations on the original GWO can be found in [19,20].
This paper proposes an adaptive formulation to enhance the search process in the GWO. The adaptive mechanism can choose the best modification in an iteration according to its success. First, the modifications are explained:
- -
- Modification 1: This modification uses an exchange mechanism to combine two optimal solutions in the genes (like GA) in each vector randomly. Each grey wolf would attend this operator and exchange data with the leader alpha Xα:where are random variables in the range (0,1).
- -
- Modification 2: This modification would try to enhance the mean of the grey wolf population using a motivating operator as below:where is an integer value of either 1 or 2.
Each grey wolf is allowed to pick one of these two modifications which best fits its situation. The probability of success for each modification is determined by an n index called Prbθ = 0.5 & θ = 1,2. Moreover, a storage is considered whose value is zero at the beginning, but as time passes, it is updated as below:
In the above, is the weight each solution Xj and N is the size of the population. The probability of any modification method is updated as below:
where ε is a constant value for balancing the two modifications. In the last step, the Prbθ is normalized as follows:
5. Simulation Results
In this section, a test system is used for examining the proposed model. The test system structure is shown in Figure 5. As is seen here, there is a wind turbine, a fuel cell, a micro turbine and a solar panel installed in the system as the generators. In addition, battery is considered to play the role of an active player as ancillary services. The utility, also as a big supplier, can attend the market and sell its power. The total power generation of the wind and solar units are plotted in Figure 6 and Figure 7, respectively. Furthermore, the market demand is considered as shown in Figure 8. It is worth noting that this demand can also be predicted, but since the paper’s focus is on the market price, it is ignored in this research, though the solution procedure is the same.
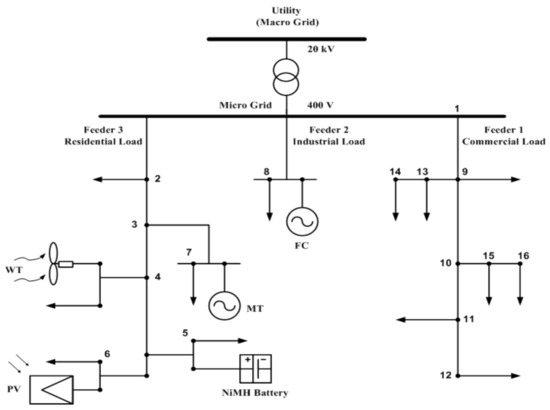
Figure 5.
Single line diagram of the MG test system [27].
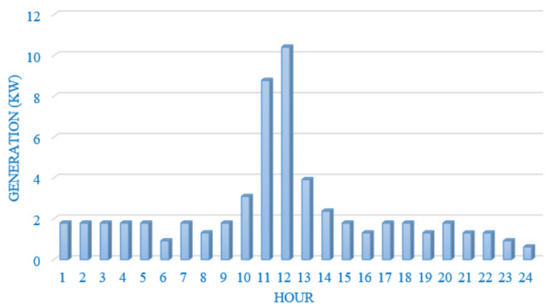
Figure 6.
Wind turbine output power.
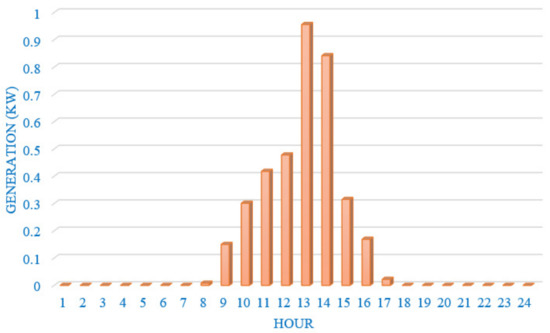
Figure 7.
Solar panel output power.
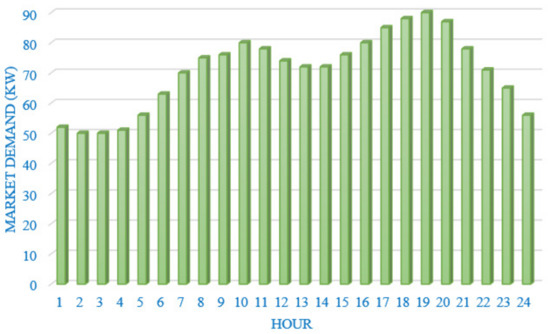
Figure 8.
Market demand production.
Table 1 summarizes the test system data, including the capacity and prices of each generator. In order to show first the accuracy of the proposed prediction model for market price forecasting, the historical data over a year of Tehran Electricity market are considered as the benchmark [28]. The recorded data include the hourly market price over 480 h in 2018, from which 90% is used as the training set, 5% as the validation set and 5% as the test set. Therefore, we consider the next 24 h as the prediction time horizon. The comaprisons are made according to MAPE and RMSE, as described in [29]. For the sake of simplicity, the formualtions are not provided here but can be found in [29]. Table 2 shows the prediction results using the proposed fuzzy SVR (FSVR), the original support vector machine, artificial neural network (ANN) and the grey model. As can be seen in this table, the proposed FSVR shows a higher training result, as reflected in the MAPE and RMSE. The proposed model could enhance the RMSE rather than the SVR, ANN and grey model by 7.8%, 8.4% and 9.2%, respectively. A complete comaprison is provided in Figure 9. Almost similar iprovements can be seen for the MAPE. The same conclusion might be made for the RMSE, of which the low value shows the very high robustness. Figure 10 shows the forecast curve plotted in the same figure with the real data. The appropriate accuracy can be deduced from the following nature of the forecast signal that can be seen here.

Table 1.
Data of the test system.

Table 2.
The results of prediction by the fuzzy SVR for the market price.
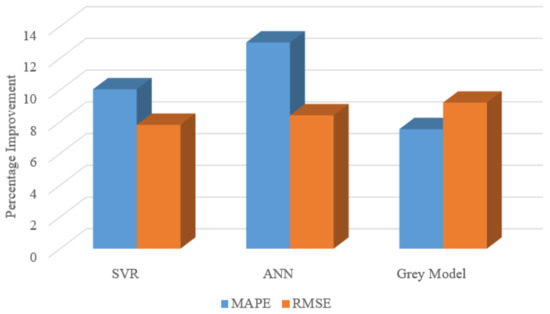
Figure 9.
The percentage improvement made by the proposed prediction model compared to SVR, ANN and Grey model.
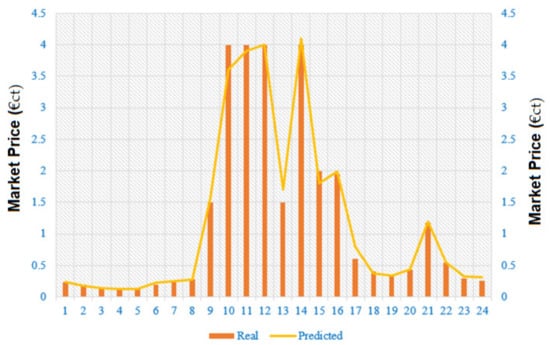
Figure 10.
Forecast market price value versus real data.
Considering the market price, as shown in Figure 10, the cost minimization problem is solved using the AGWO algorithm. It is assumed that the battery has an initial charge of zero. The optimal scheduling is for 24 h (a full day). However, in order to see the search ability of the algorithm, the optimization process is repeated 25 times. Through this repetition, the best solution, the average of the optimal solutions and standard deviation values, would be achieved. This is a well-defined approach for assessing the stability of the algorithm. The simulation results are repeated 25 times and the final results are provided in Table 3. Accordingly, it is seen here that the proposed algorithm has discovered a more optimal solution than the other algorithms. The performance of the proposed algorithm is compared with the PSO, GA, FSAPSO and original GWO, and the results clearly show the superiority of the algorithm. Not only the best solution, but also the worst solution and standard deviation values, are still optimal compared with the other algorithms. These results show the robustness of the algorithm. The very time saving nature of the AGWO may be deduced from the last column, showing the CPU time. This is especially important if the operation time interval is reduced in the management (such as to 10 min or less). The results evidently reveal the high quality and search features of the algorithm for solving the problem. The optimal power generation and charging values of each unit is plotted as a bar diagram in Figure 11. According to this bar diagram, the battery is trying charge during the first hours and discharge during the mid-hour times. Moreover, the fuel cell, as a cheap unit, is attending with the maximum capacity. The utility is changing to a buyer of the power at the middle of the day to let the market increase its profit. The renewable wind and solar energy sources are also producing as forecasted in their initial power curves.

Table 3.
Simulation results of optimizing cost function over 25 times.
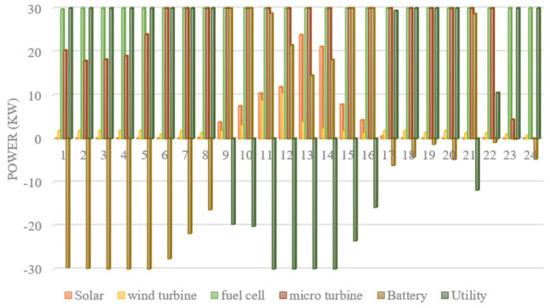
Figure 11.
Output Power of RESs evaluated by the proposed method.
6. Conclusions
The focus of this work is to study market management and modeling based on AI. The proposed model uses the fuzzy-based SVR for the prediction of the market price with high accuracy. A management model based on cost minimization and unit dispatch is developed in the study, which can help scheduling the units. A novel adaptive-modified GWO is also devised which can help to minimize the operation cost over the next 24 h. The adaptive formulation is such that it allows the algorithm to chose the best modification according to its success rate and probability. The simulation results show that the proposed model has an appropriate performance for market price prediction with low MAPE and RMSE. Furthermore, it is seen that the test system model can suitably optimize the total cost of operations, including the solar and wind renewable energy sources, as well the fossil fuel-based models, such as fuel cell, micro turbine and battery. The AGWO’s superiority over the set of algorithms is well proved.
Funding
This research received no external funding.
Institutional Review Board Statement
Not applicable.
Informed Consent Statement
Not applicable.
Data Availability Statement
This study did not report any data.
Conflicts of Interest
The authors declare no conflict of interest.
References
- Mohamed, M.A.; Mirjalili, S.; Dampage, U.; Salmen, S.H.; Al Obaid, S.; Annuk, A. A Cost-Efficient-Based Cooperative Allocation of Mining Devices and Renewable Resources Enhancing Blockchain Architecture. Sustainability 2021, 13, 10382. [Google Scholar] [CrossRef]
- Zeng, L.; Xia, T.; Elsayed, S.; Ahmed, M.; Rezaei, M.; Jermsittiparsert, K.; Dampage, U.; Mohamed, M. A Novel Machine Learning-Based Framework for Optimal and Secure Operation of Static VAR Compensators in EAFs. Sustainability 2021, 13, 5777. [Google Scholar] [CrossRef]
- Abera, T.; Dereje, F.; Larago, B. Mobile Backhaul in Release 8 and Beyond: Benefits, Challenges, Market Status and Impact Analysis. Int. J. Wirel. Microw. Technol. 2020, 10, 9–15. [Google Scholar] [CrossRef]
- Beni, S.A.; Sheikh-El-Eslami, M.K. Market power assessment in electricity markets based on social network analysis. Comput. Electr. Eng. 2021, 94, 107302. [Google Scholar] [CrossRef]
- Yildirim, C.; Kasman, A.; Hamid, F.S. Impact of foreign ownership on market power: Do regional banks behave differently in ASEAN countries? Econ. Model. 2021, 105, 105654. [Google Scholar] [CrossRef]
- Kamala, H. Development of an Effective Method of Data Collection for Advertising and Marketing on the Internet. Int. J. Math. Sci. Comput. 2021, 7, 1–11. [Google Scholar] [CrossRef]
- Hossain, M.A.; Pota, H.R.; Squartini, S.; Abdou, A.F. Modified PSO algorithm for real-time energy management in grid-connected microgrids. Renew. Energy 2019, 136, 746–757. [Google Scholar] [CrossRef]
- Rizwan, M.; Waseem, M.; Liaqat, R.; Sajjad, I.A.; Dampage, U.; Salmen, S.H.; Obaid, S.A.; Mohamed, M.A.; Annuk, A. SPSO Based Optimal Integration of DGs in Local Distribution Systems under Extreme Load Growth for Smart Cities. Electronics 2021, 10, 2542. [Google Scholar] [CrossRef]
- Bui, V.-H.; Hussain, A.; Kim, H.-M. A Multiagent-Based Hierarchical Energy Management Strategy for Multi-Microgrids Considering Adjustable Power and Demand Response. IEEE Trans. Smart Grid 2018, 9, 1323–1333. [Google Scholar] [CrossRef]
- Fan, W.; Huang, L.; Cong, B.; Tan, Z.; Xing, T. Research on an optimization model for wind power and thermal power participating in two-level power market transactions. Int. J. Electr. Power Energy Syst. 2021, 134, 107423. [Google Scholar] [CrossRef]
- Liu, Y.-W.; Li, L.-L.; Tseng, M.-L.; Lim, M.K.; Helmi Ali, M. Optimal scheduling of combined cooling, heating, and power microgrid based on a hybrid gray wolf optimizer. J. Ind. Prod. Eng. 2022, 39, 277–292. [Google Scholar] [CrossRef]
- Mahedy, A.; Abdelsalam, A.; Mohamed, R.; El-Nahry, I. Utilizing Neural Networks for Stocks Prices Prediction in Stocks Markets. Int. J. Inf. Technol. Comput. Sci. 2020, 12, 1–7. [Google Scholar] [CrossRef]
- Amjady, N.; Daraeepour, A. Mixed price and load forecasting of electricity markets by a new iterative prediction method. Electr. Power Syst. Res. 2009, 79, 1329–1336. [Google Scholar] [CrossRef]
- Sahoo, S.; Swain, S.; Subburaj, V. Novel Gaussian flower pollination algorithm with IoT for unit price prediction in peer-to-peer energy trading market. Energy Rep. 2021, 7, 8265–8276. [Google Scholar] [CrossRef]
- Bhatia, K.; Mittal, R.; Tripathi, M.M. An ensemble approach for electricity price forecasting in markets with renewable energy resources. Util. Policy 2021, 70, 101185. [Google Scholar] [CrossRef]
- Shi, W.; Wang, Y.; Ma, J. An effective Two-Stage Electricity Price forecasting scheme. Electr. Power Syst. Res. 2021, 199, 107416. [Google Scholar] [CrossRef]
- Daglish, T.; de Bragança, G.G.F.; Romano, T. Pricing effects of the electricity market reform in Brazil. Energy Econ. 2021, 97, 105197. [Google Scholar] [CrossRef]
- Flammini, M.G.; Prettico, G.; Chicco, G. Reducing fossil fuel-based generation: Impact on wholesale electricity market prices in the North-Italy bidding zone. Electr. Power Syst. Res. 2021, 194, 107095. [Google Scholar] [CrossRef]
- Correa-Giraldo, M.; Garcia-Rendon, J.J.; Perez, A. Strategic behaviors and transfer of wholesale costs to retail prices in the electricity market: Evidence from Colombia. Energy Econ. 2021, 99, 105276. [Google Scholar] [CrossRef]
- Shao, Z.; Zheng, Q.; Liu, C. Modeling and forecasting the electricity clearing price: A novel BELM based pattern classification framework and a comparative analytic study on multi-layer BELM and LSTM. Energy Econ. 2020, 86, 104648. [Google Scholar] [CrossRef]
- Prabakaran, S.; Garcia, I.C.; Mora, J.U. A temperature stochastic model for option pricing and its impacts on the electricity market. Econ. Anal. Policy 2020, 68, 58–77. [Google Scholar] [CrossRef]
- Prasenjit, C.; Banerjee, I.; Rahaman, H. Load management scheme for energy holes reduction in wireless sensor networks. Comput. Electr. Eng. 2015, 48, 343–357. [Google Scholar]
- Xiang, Z.; Cao, J.; Guo, Q.; Wen, T. A novel network security algorithm based on improved support vector machine from smart city perspective. Comput. Electr. Eng. 2018, 65, 67–78. [Google Scholar]
- Liu, M.; Luo, K.; Chen, S. A stock selection algorithm hybridizing grey wolf optimizer and support vector regression. Expert Syst. Appl. 2021, 179, 115078. [Google Scholar] [CrossRef]
- Khalid, A.; Annuk, A.; Dampage, U.; Mohamed, M.A. Effective Energy Management via False Data Detection Scheme for the Interconnected Smart Energy Hub–Microgrid System under Stochastic Framework. Sustainability 2021, 13, 11836. [Google Scholar]
- Figuera, C.; Barquero-Pérez, Ó.; Caamaño, A.J. Spectrally adapted Mercer kernels for support vector nonuniform interpolation. Signal Process. 2014, 94, 421–433. [Google Scholar] [CrossRef]
- Baziar, A.; Kavousi-Fard, A. Considering uncertainty in the optimal energy management of renewable micro-grids including storage devices. Renew. Energy 2013, 59, 158–166. [Google Scholar] [CrossRef]
- IREMA Website. Available online: https://www.irema.ir/market-data/statistical-report/daily-data/price/average (accessed on 30 March 2021).
- Kavousifard, A.; Samet, H. A novel method based on modified shuffled frog leaping algorithm and artificial neural network for power system load prediction. Emerg. Intell. Technol. Ind. 2012, 369, 35–46. [Google Scholar]
Publisher’s Note: MDPI stays neutral with regard to jurisdictional claims in published maps and institutional affiliations. |
© 2022 by the author. Licensee MDPI, Basel, Switzerland. This article is an open access article distributed under the terms and conditions of the Creative Commons Attribution (CC BY) license (https://creativecommons.org/licenses/by/4.0/).