
Aging Passenger Car Fleet Structure, Dynamics, and Environmental Performance Evaluation at the Regional Level by Life Cycle Assessment


Abstract
:1. Introduction
2. Materials and Methods
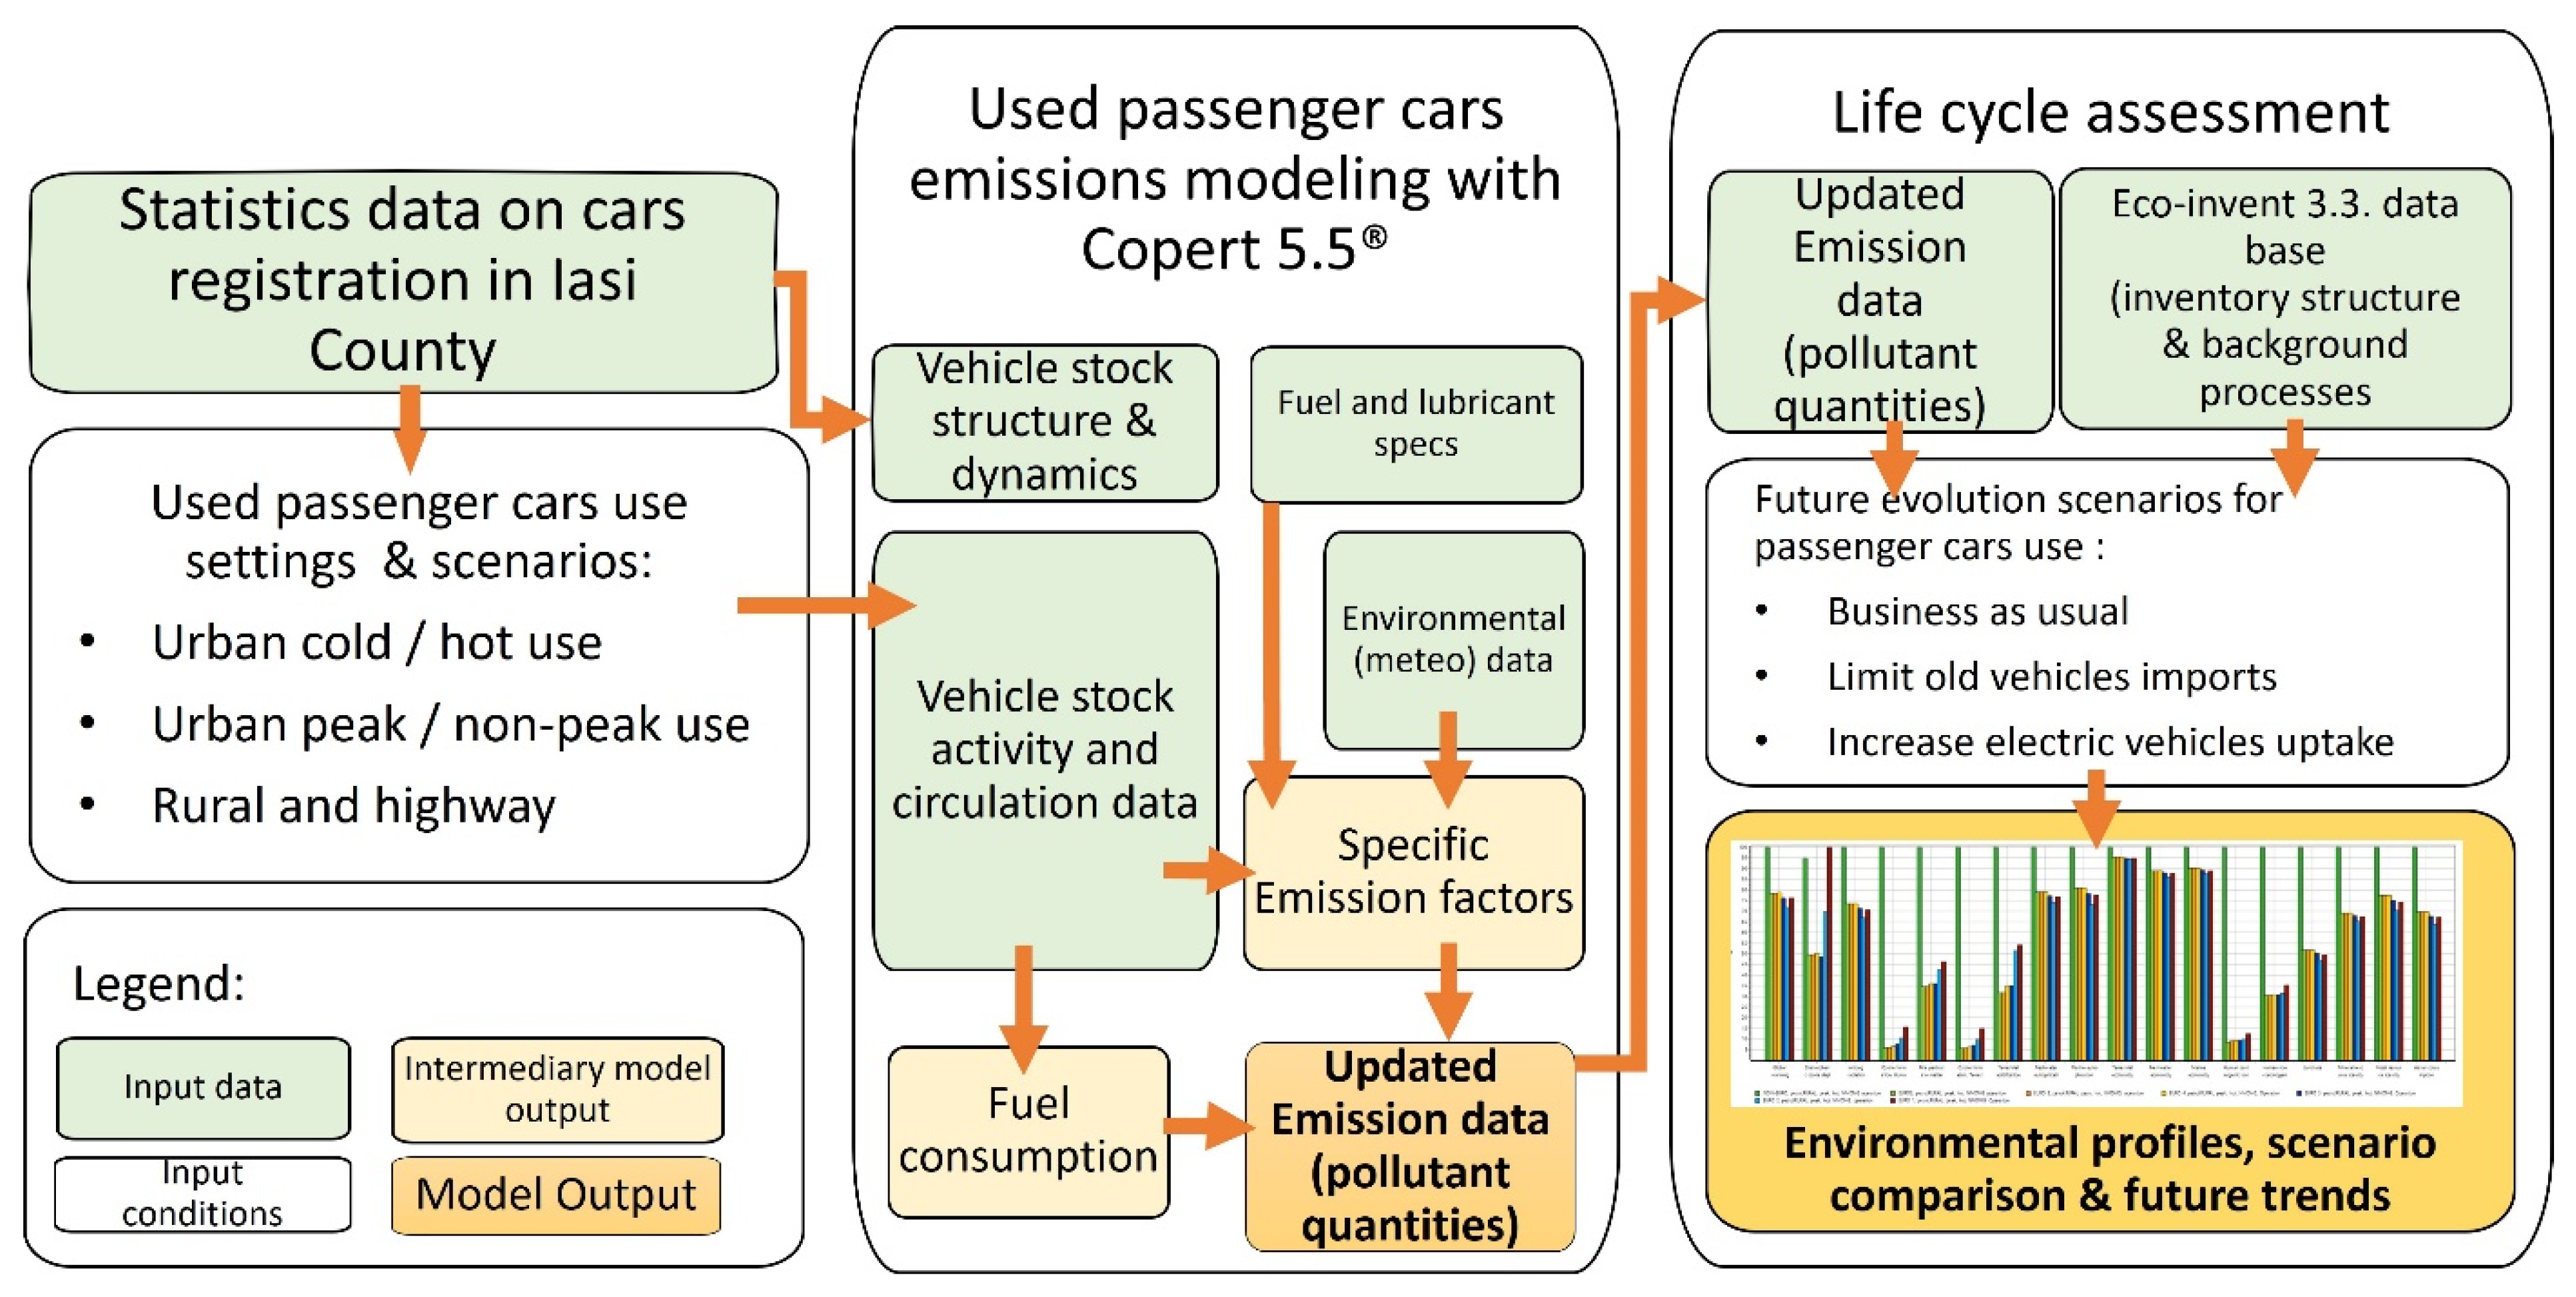
2.1. Research Methodology
2.2. Data Sources
2.3. Passenger Cars Emissions Modeling
2.4. Life Cycle Assessment Methodology
3. Results and Discussion
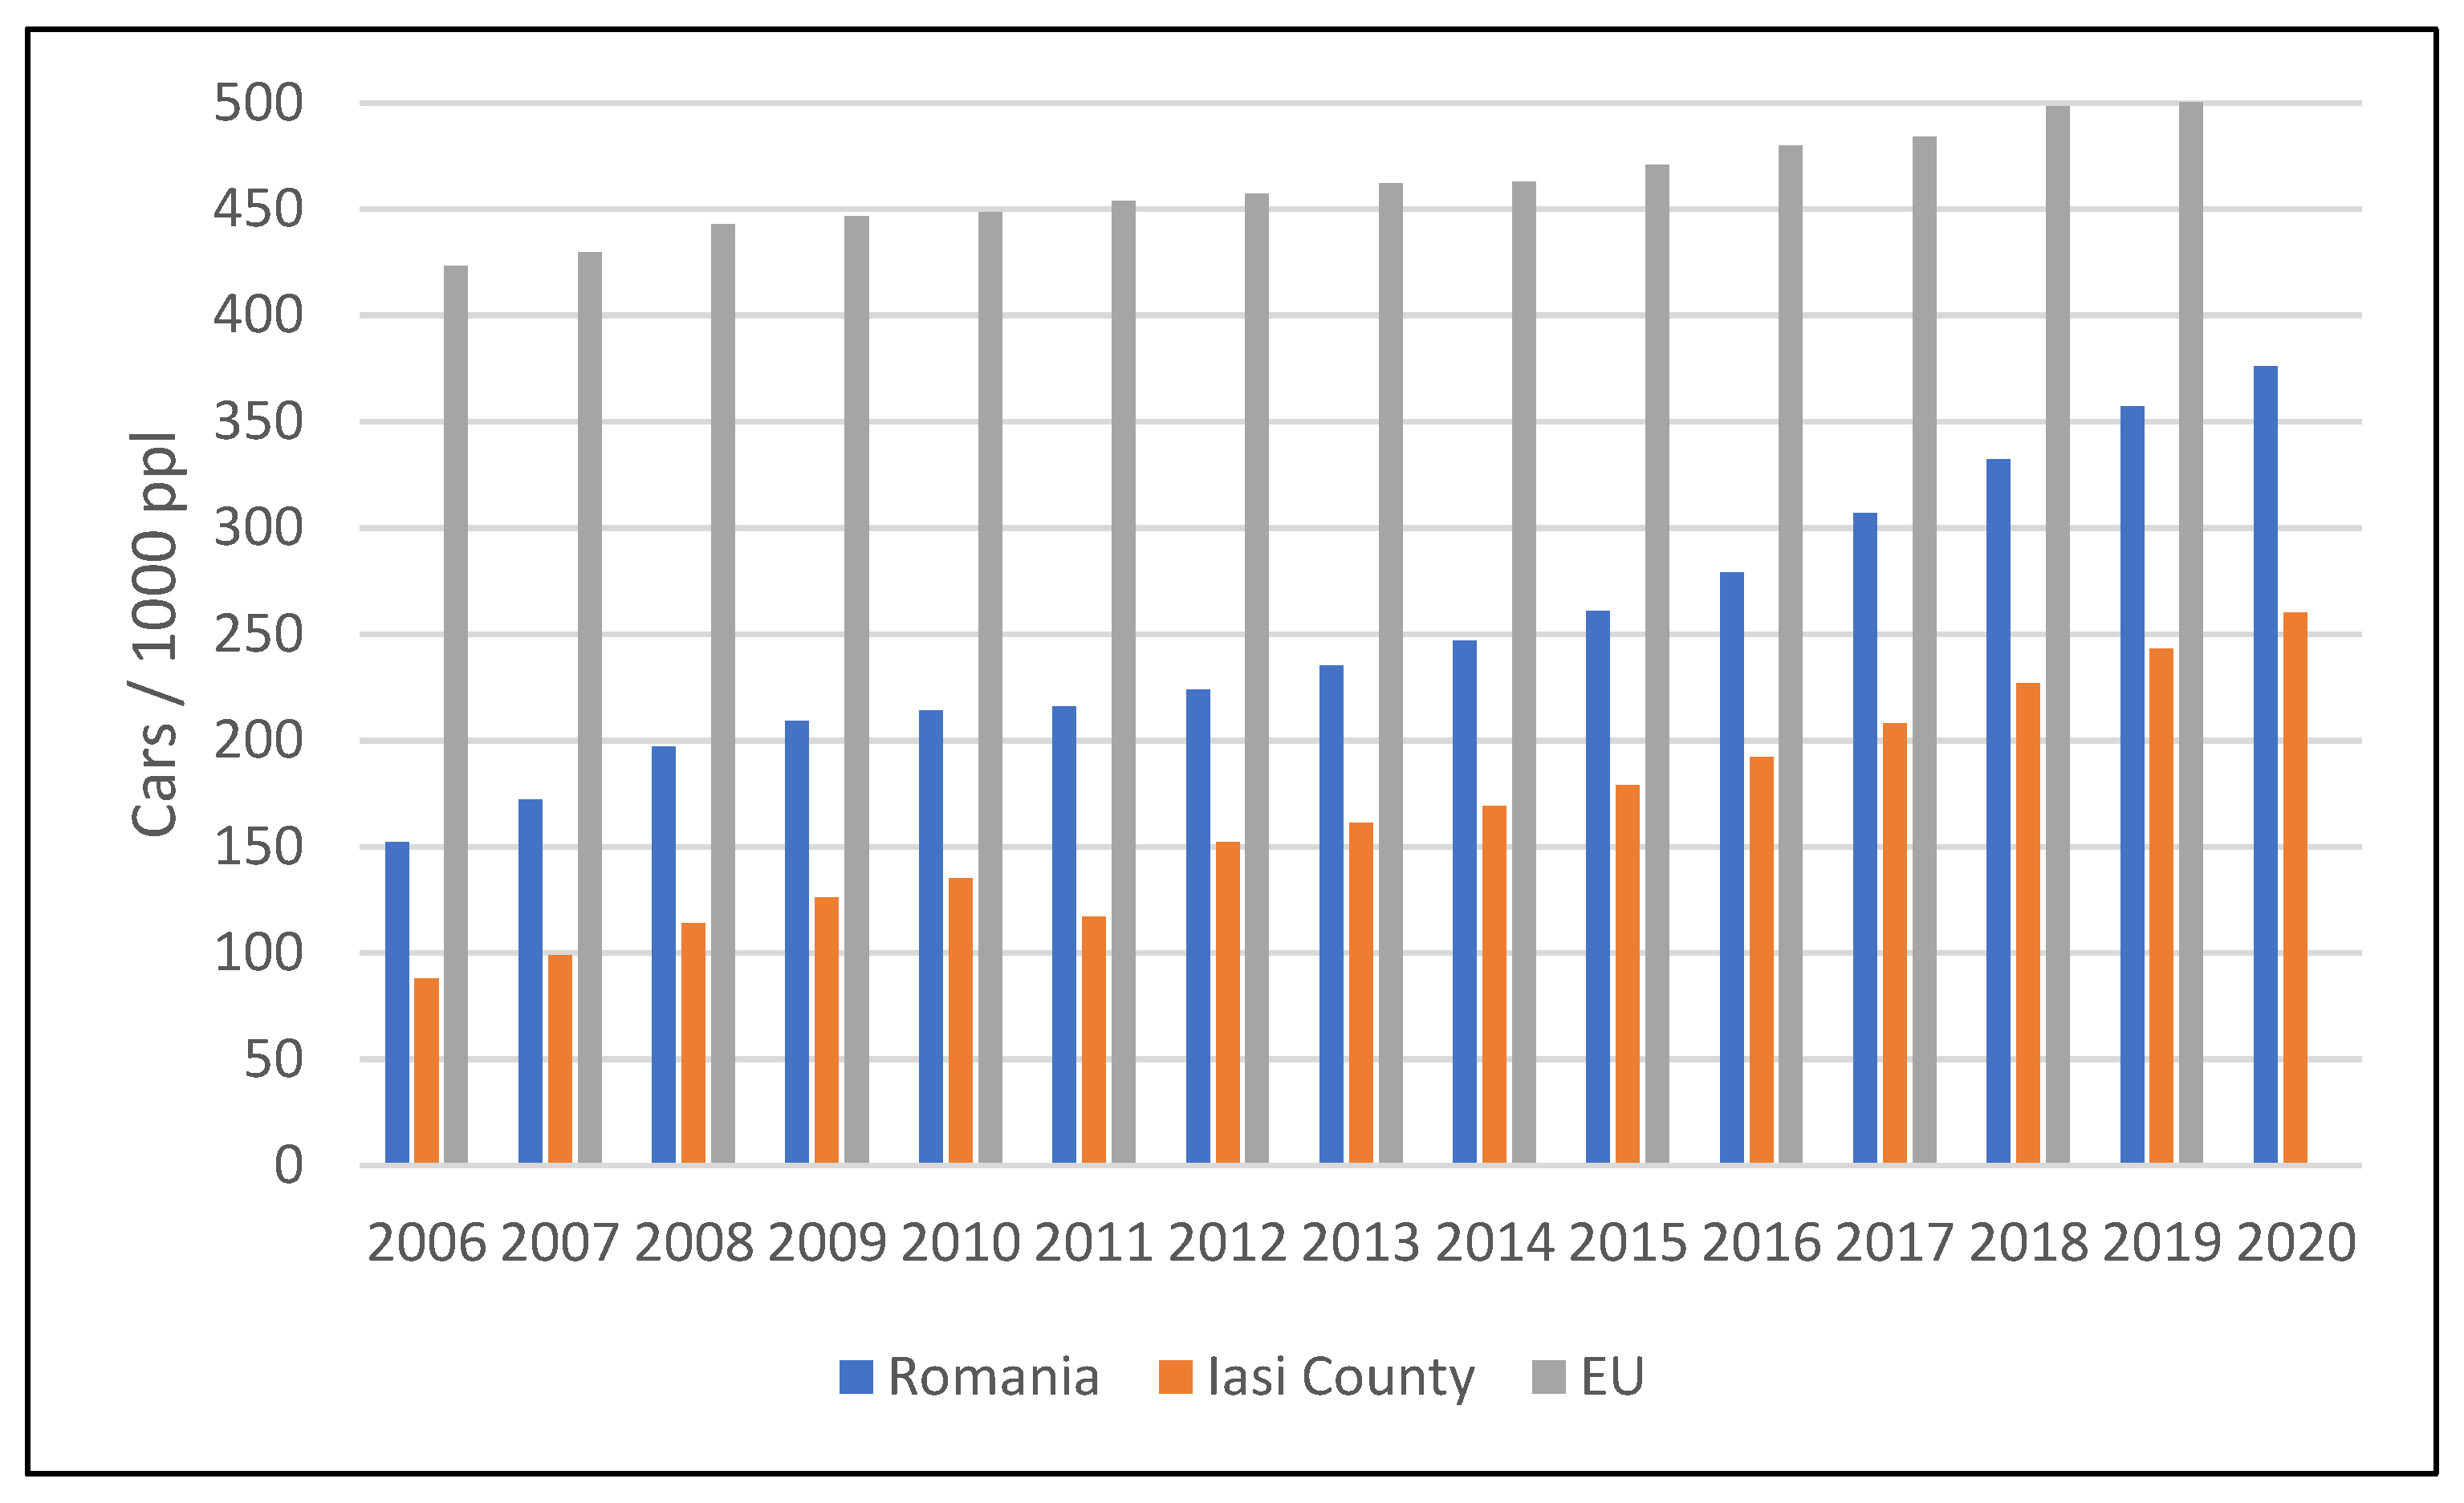
3.1. Passenger Car Fleet Dynamics
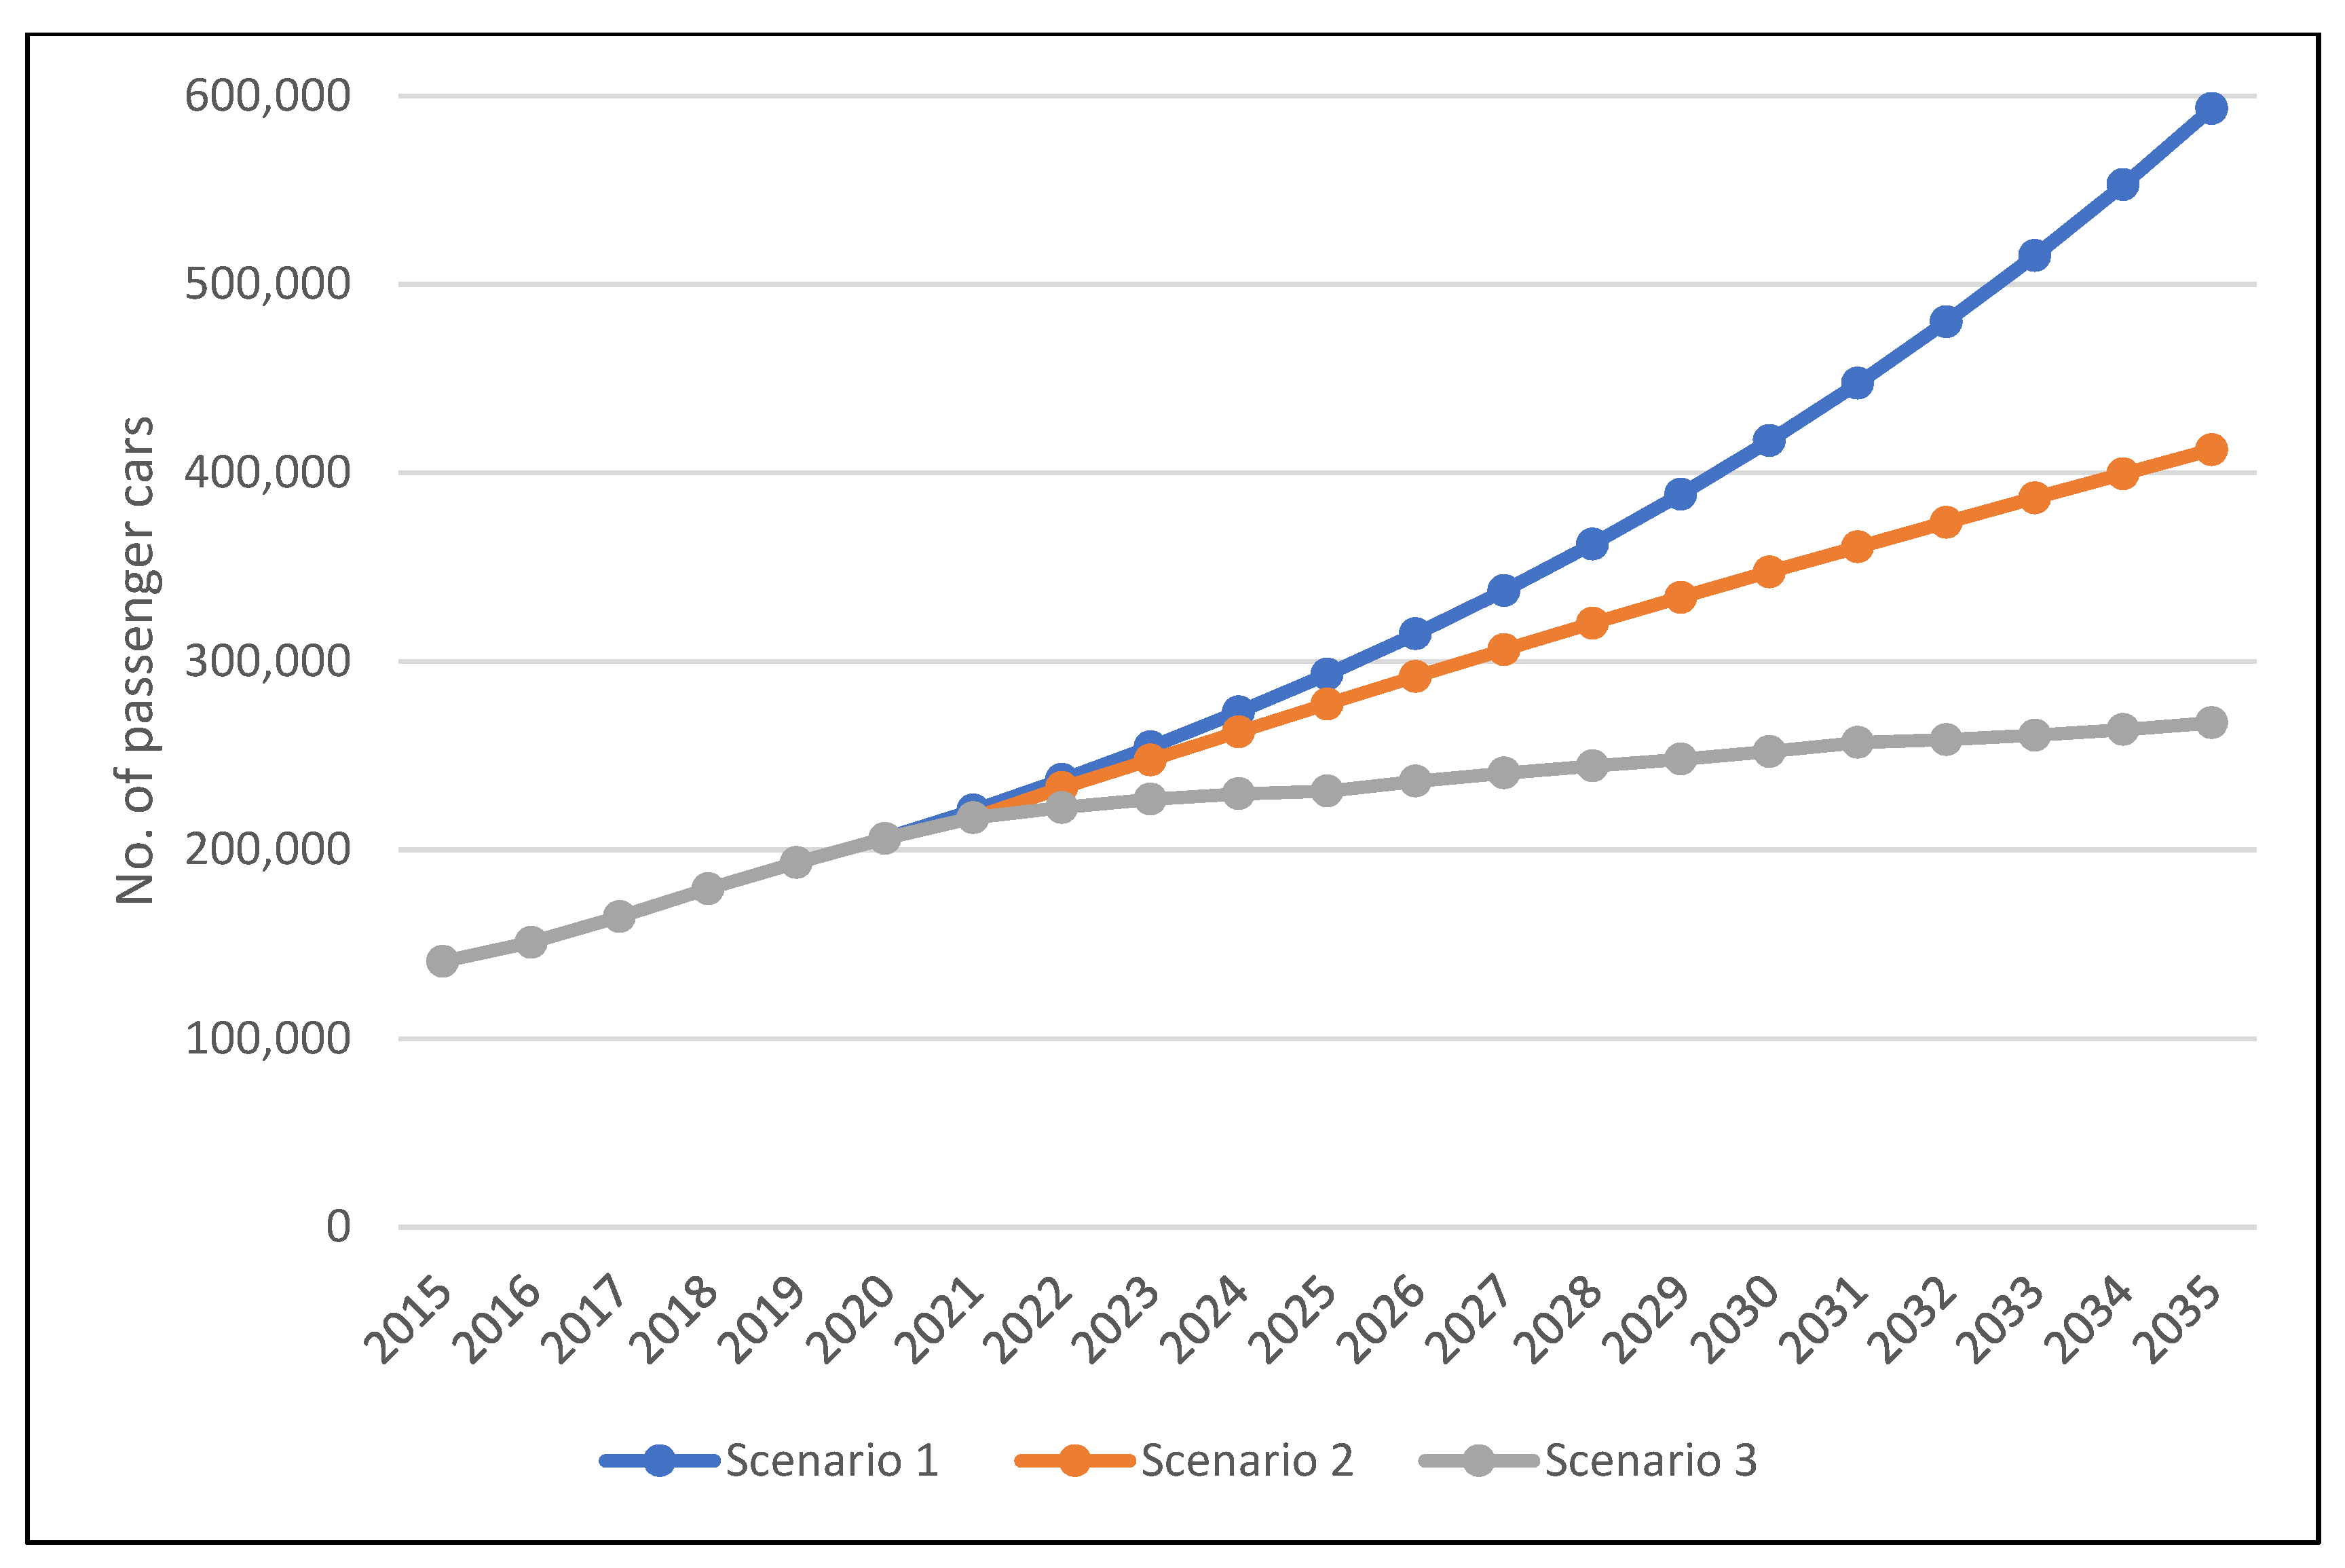
3.2. Car Fleet Dynamics Scenarios
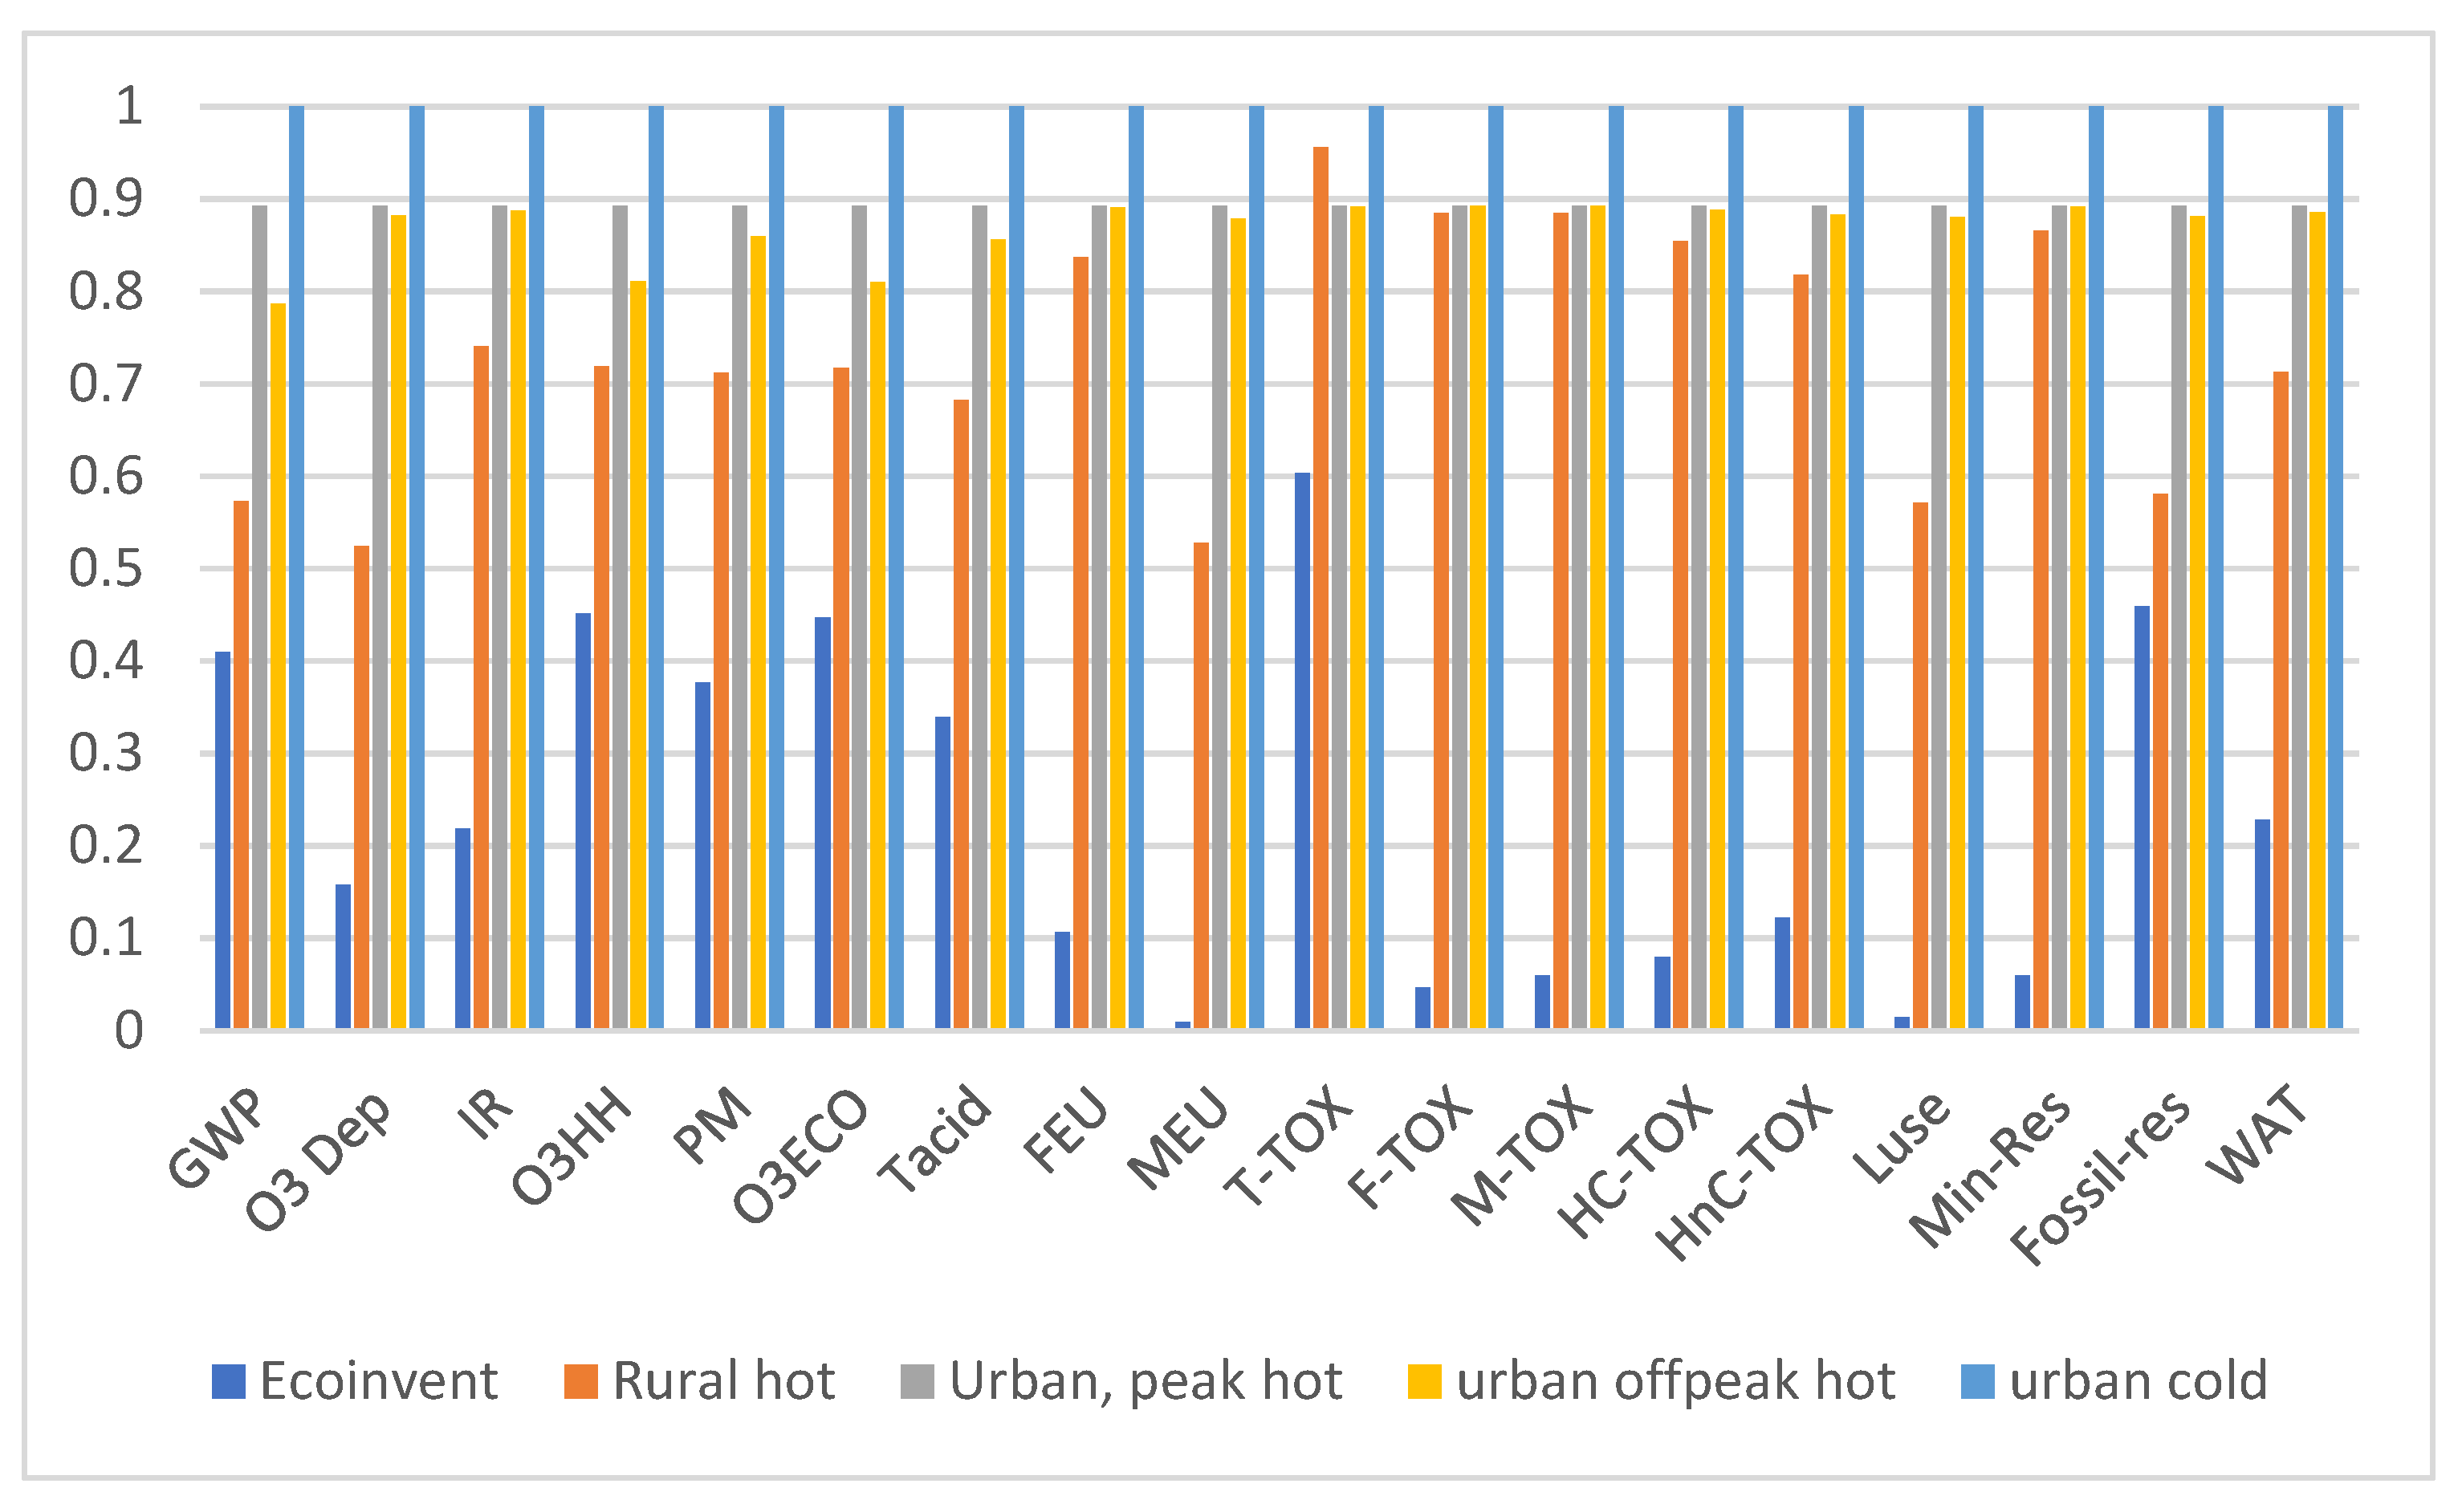
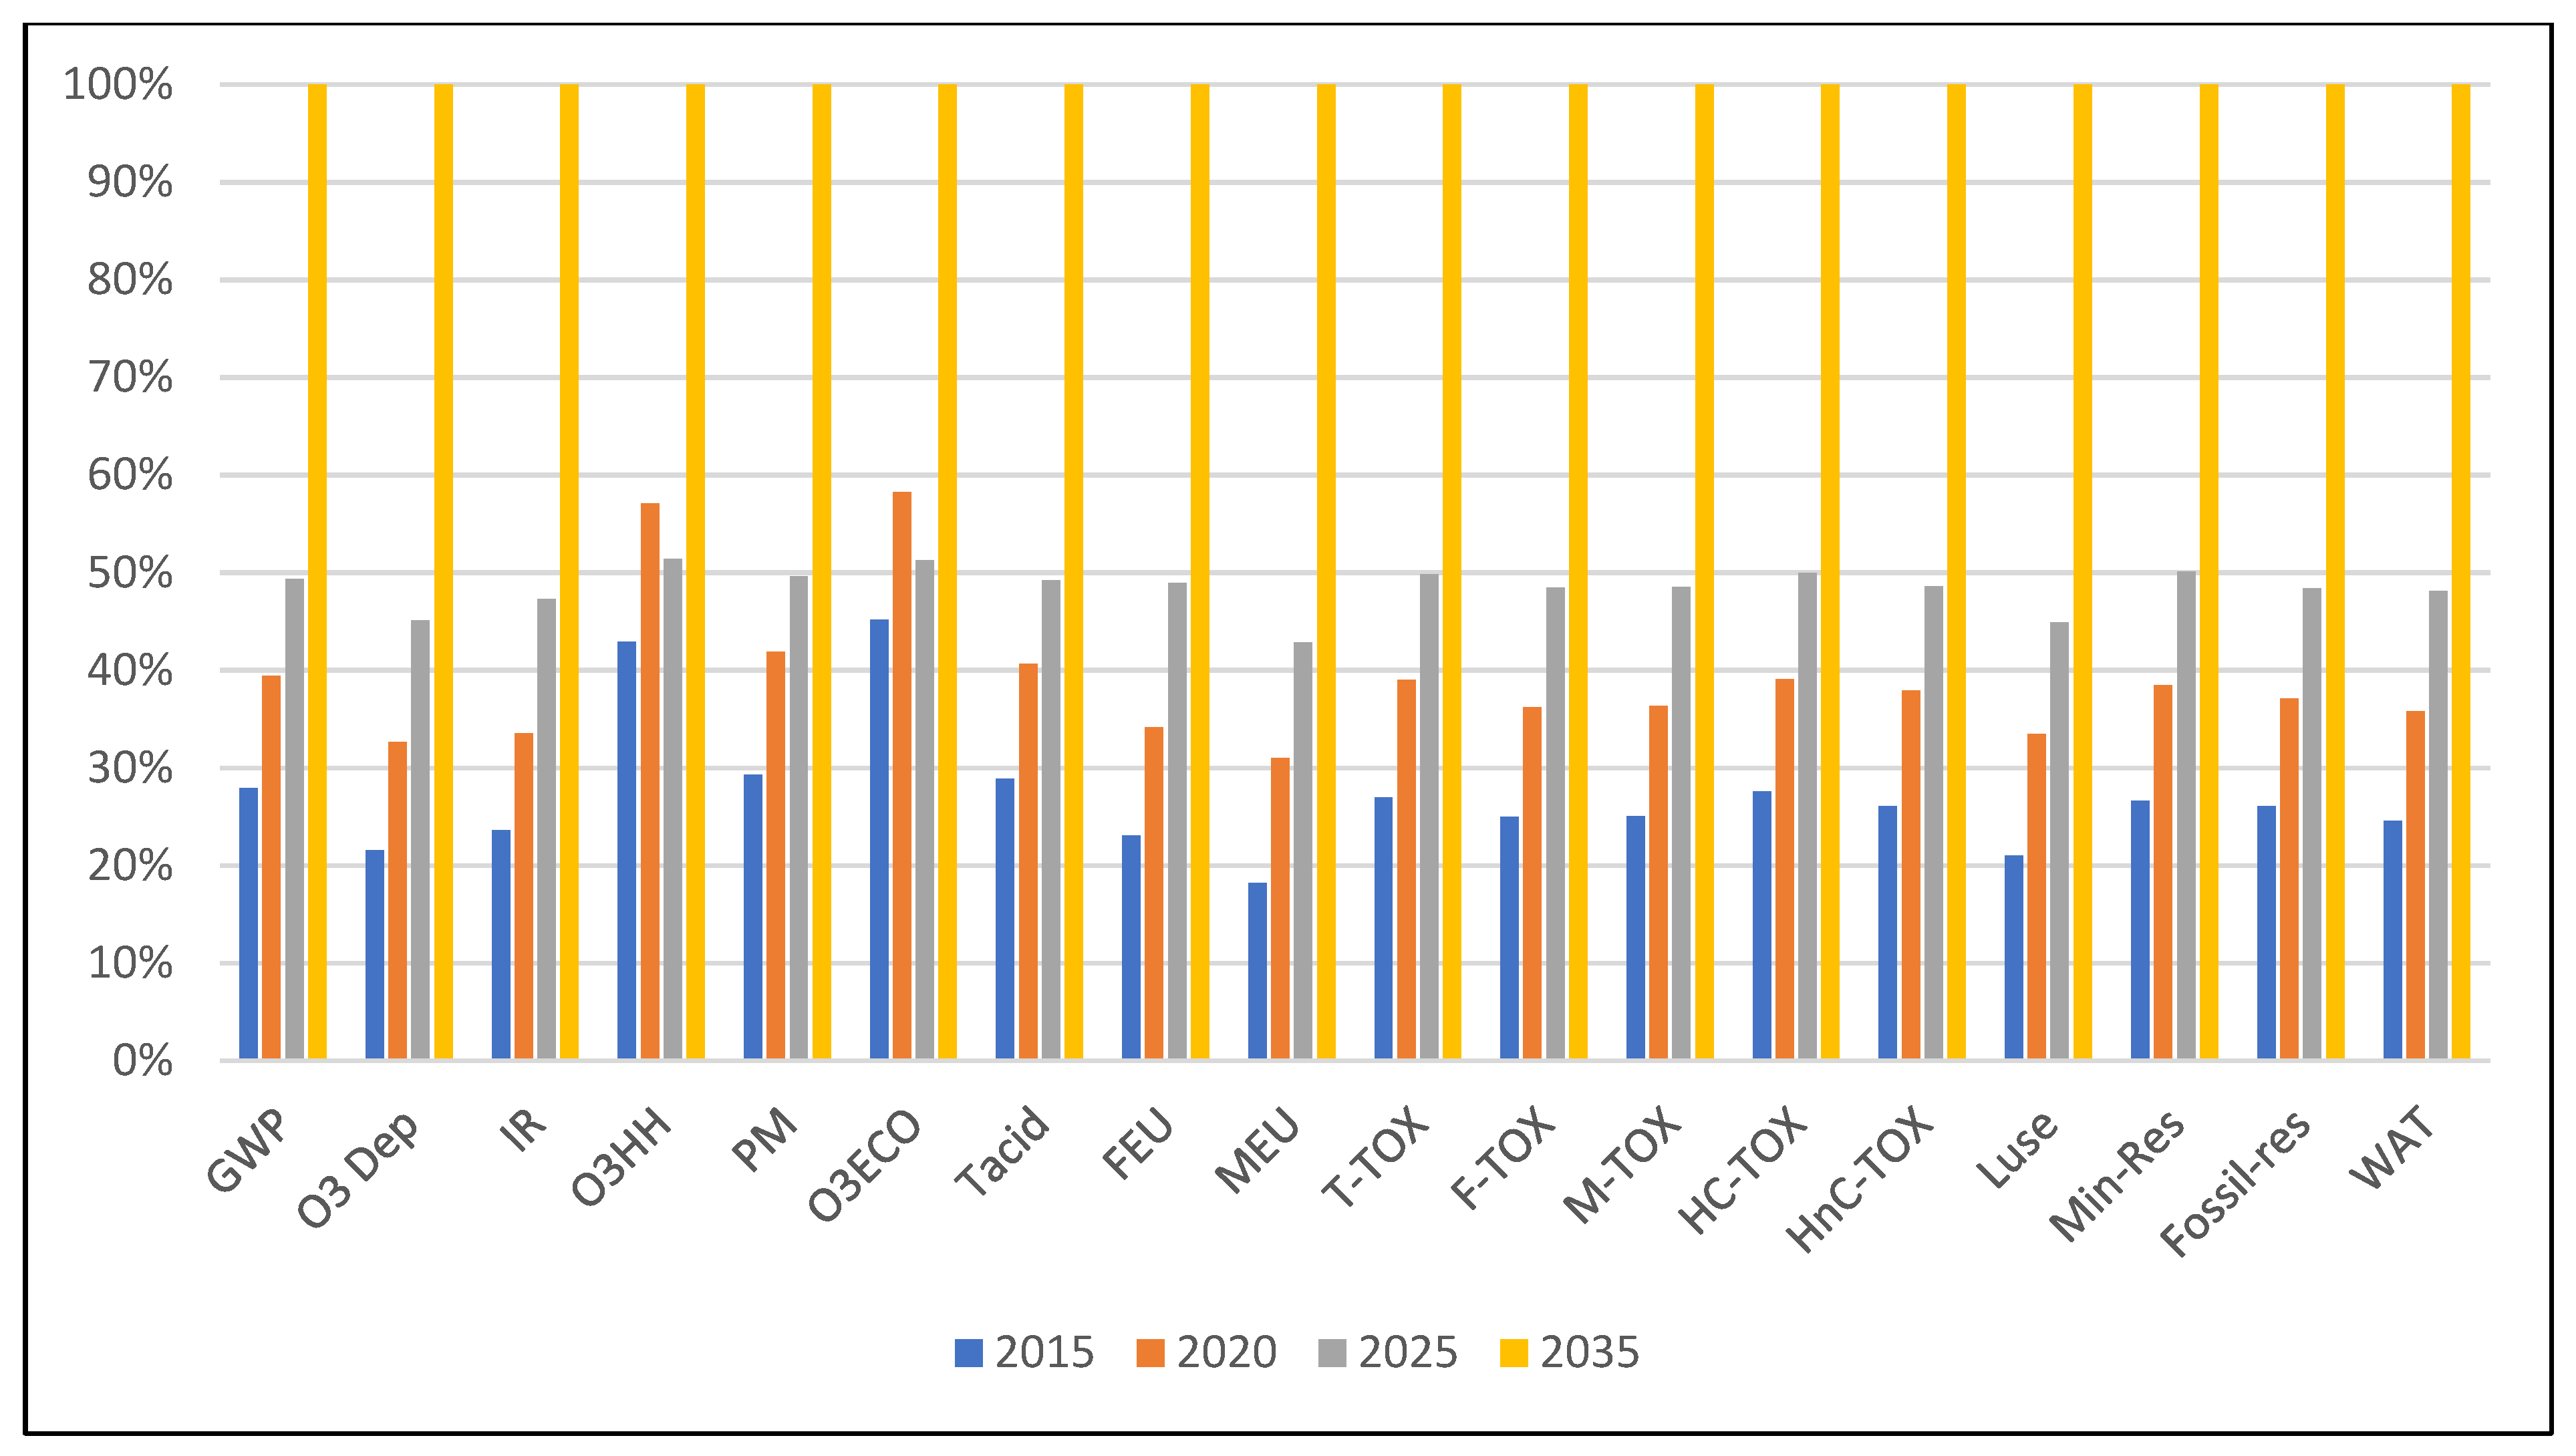
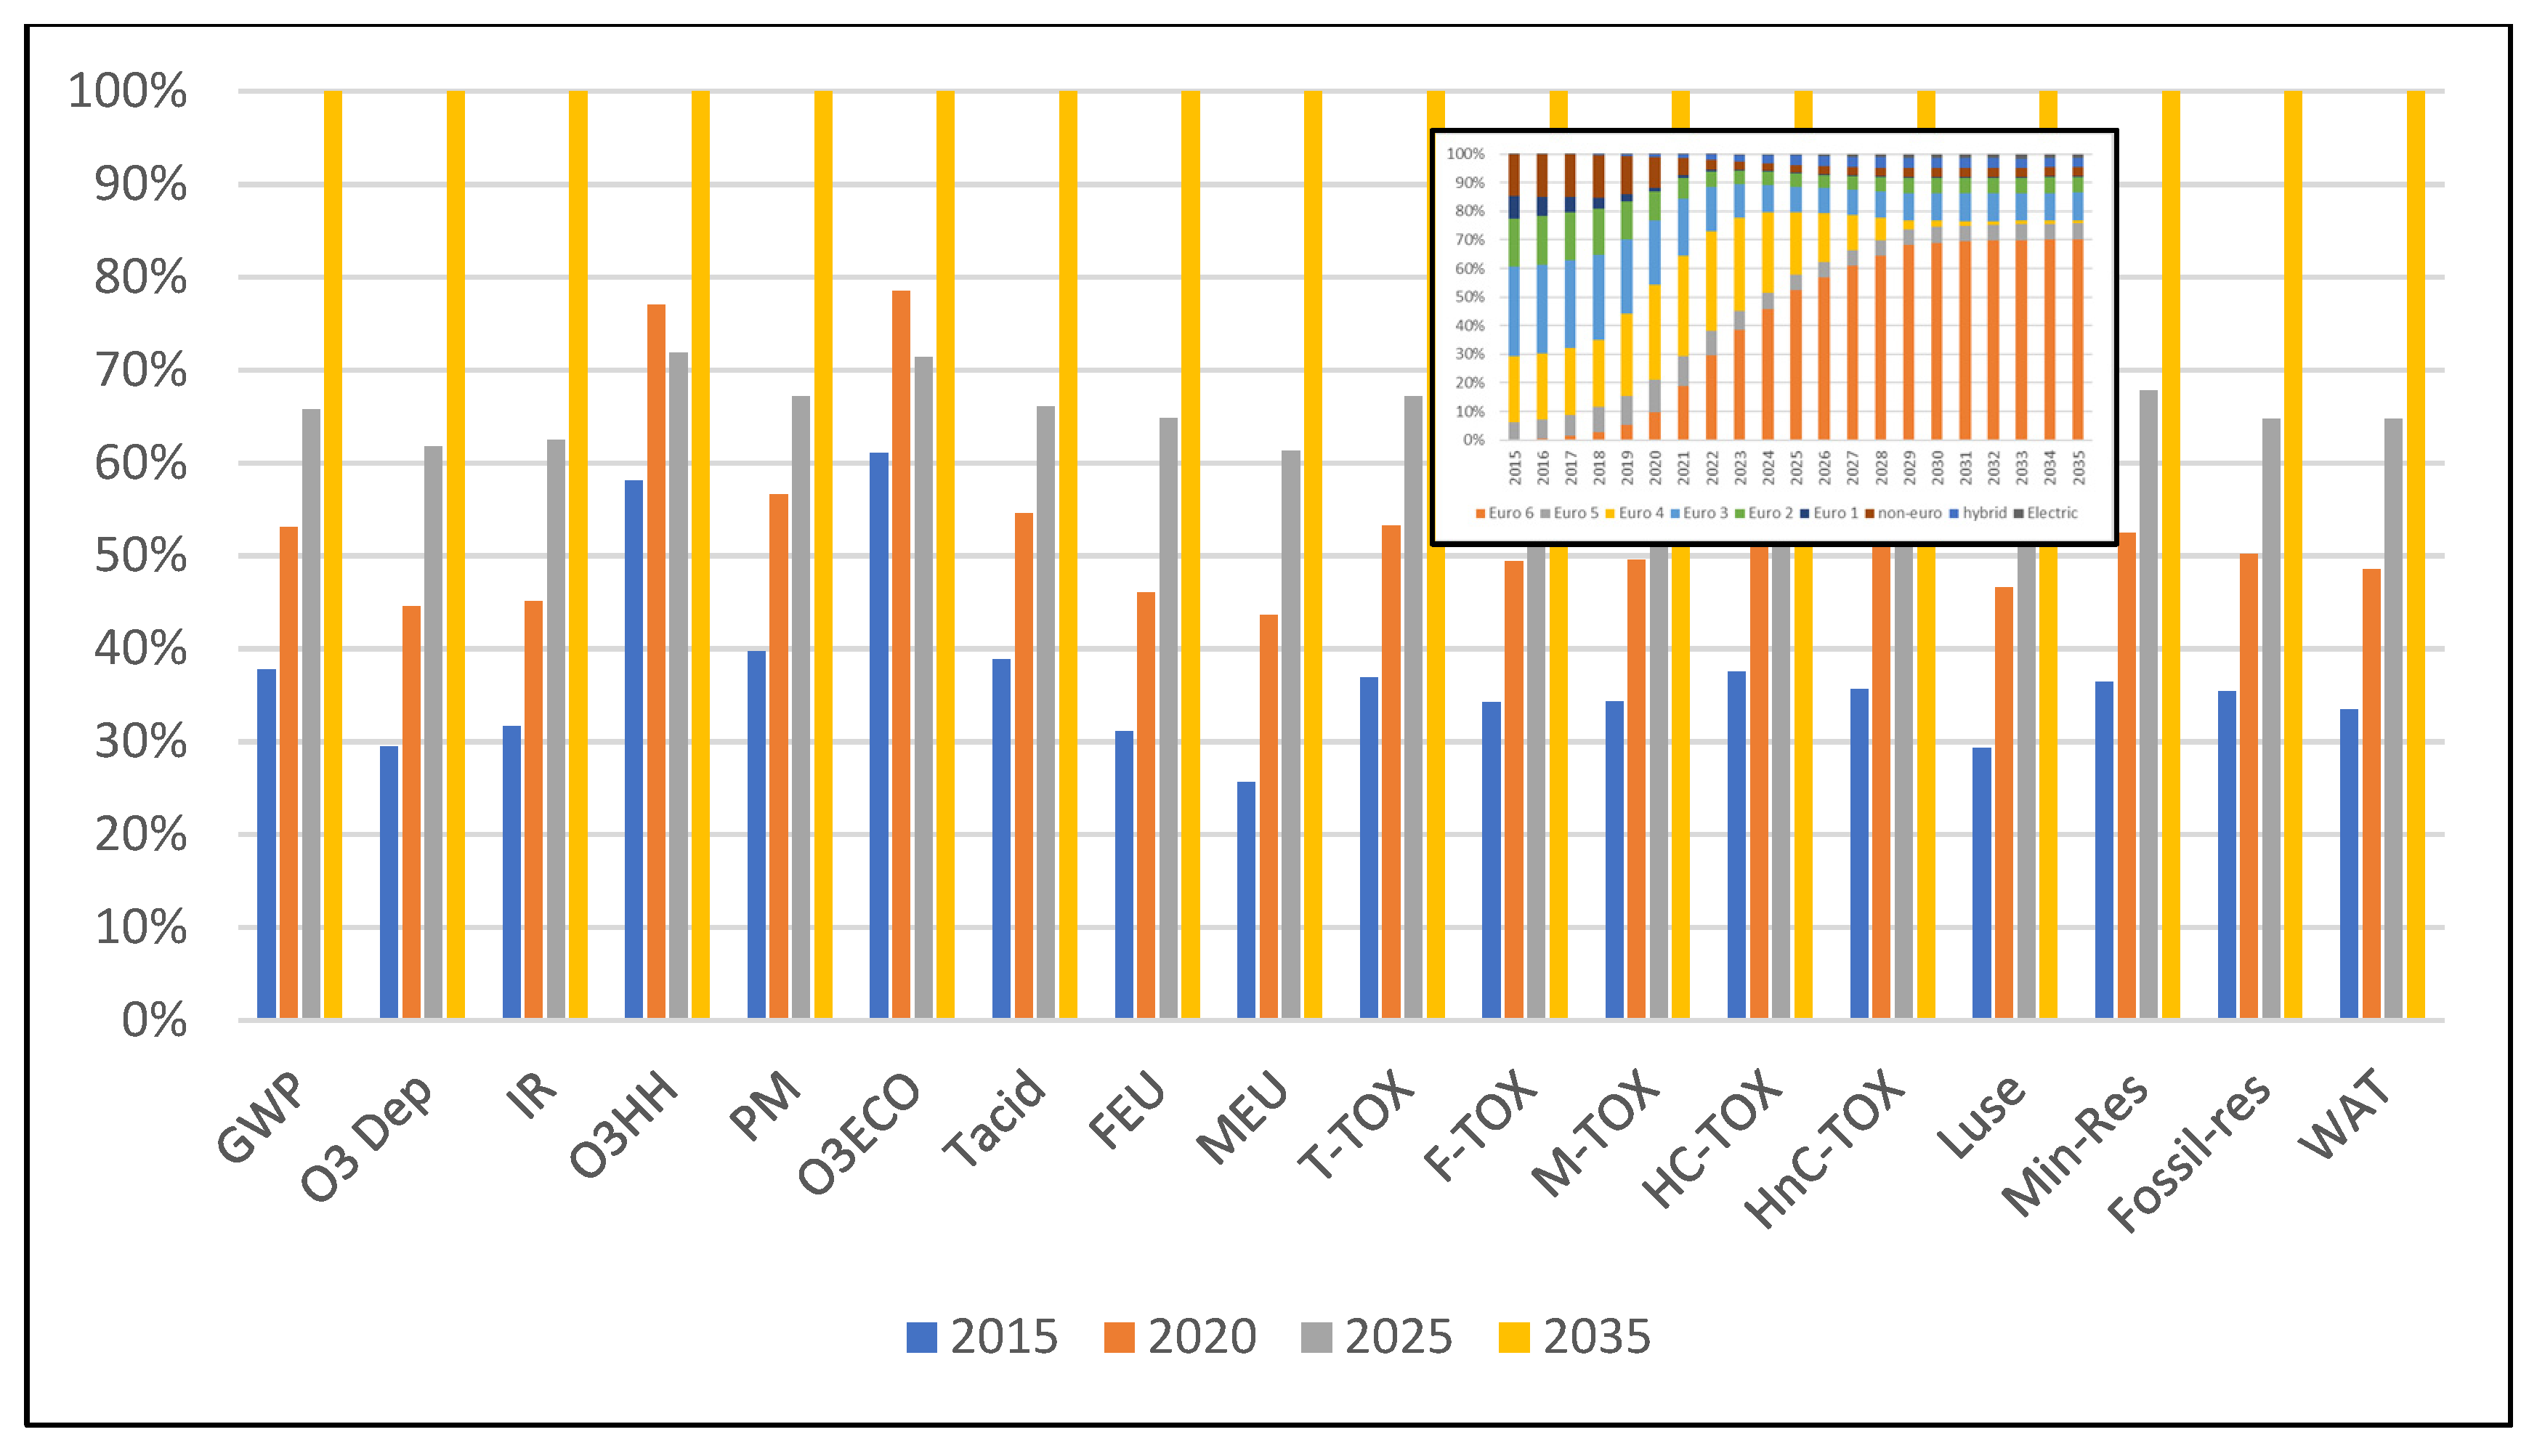
3.3. Default Environmental Profiles
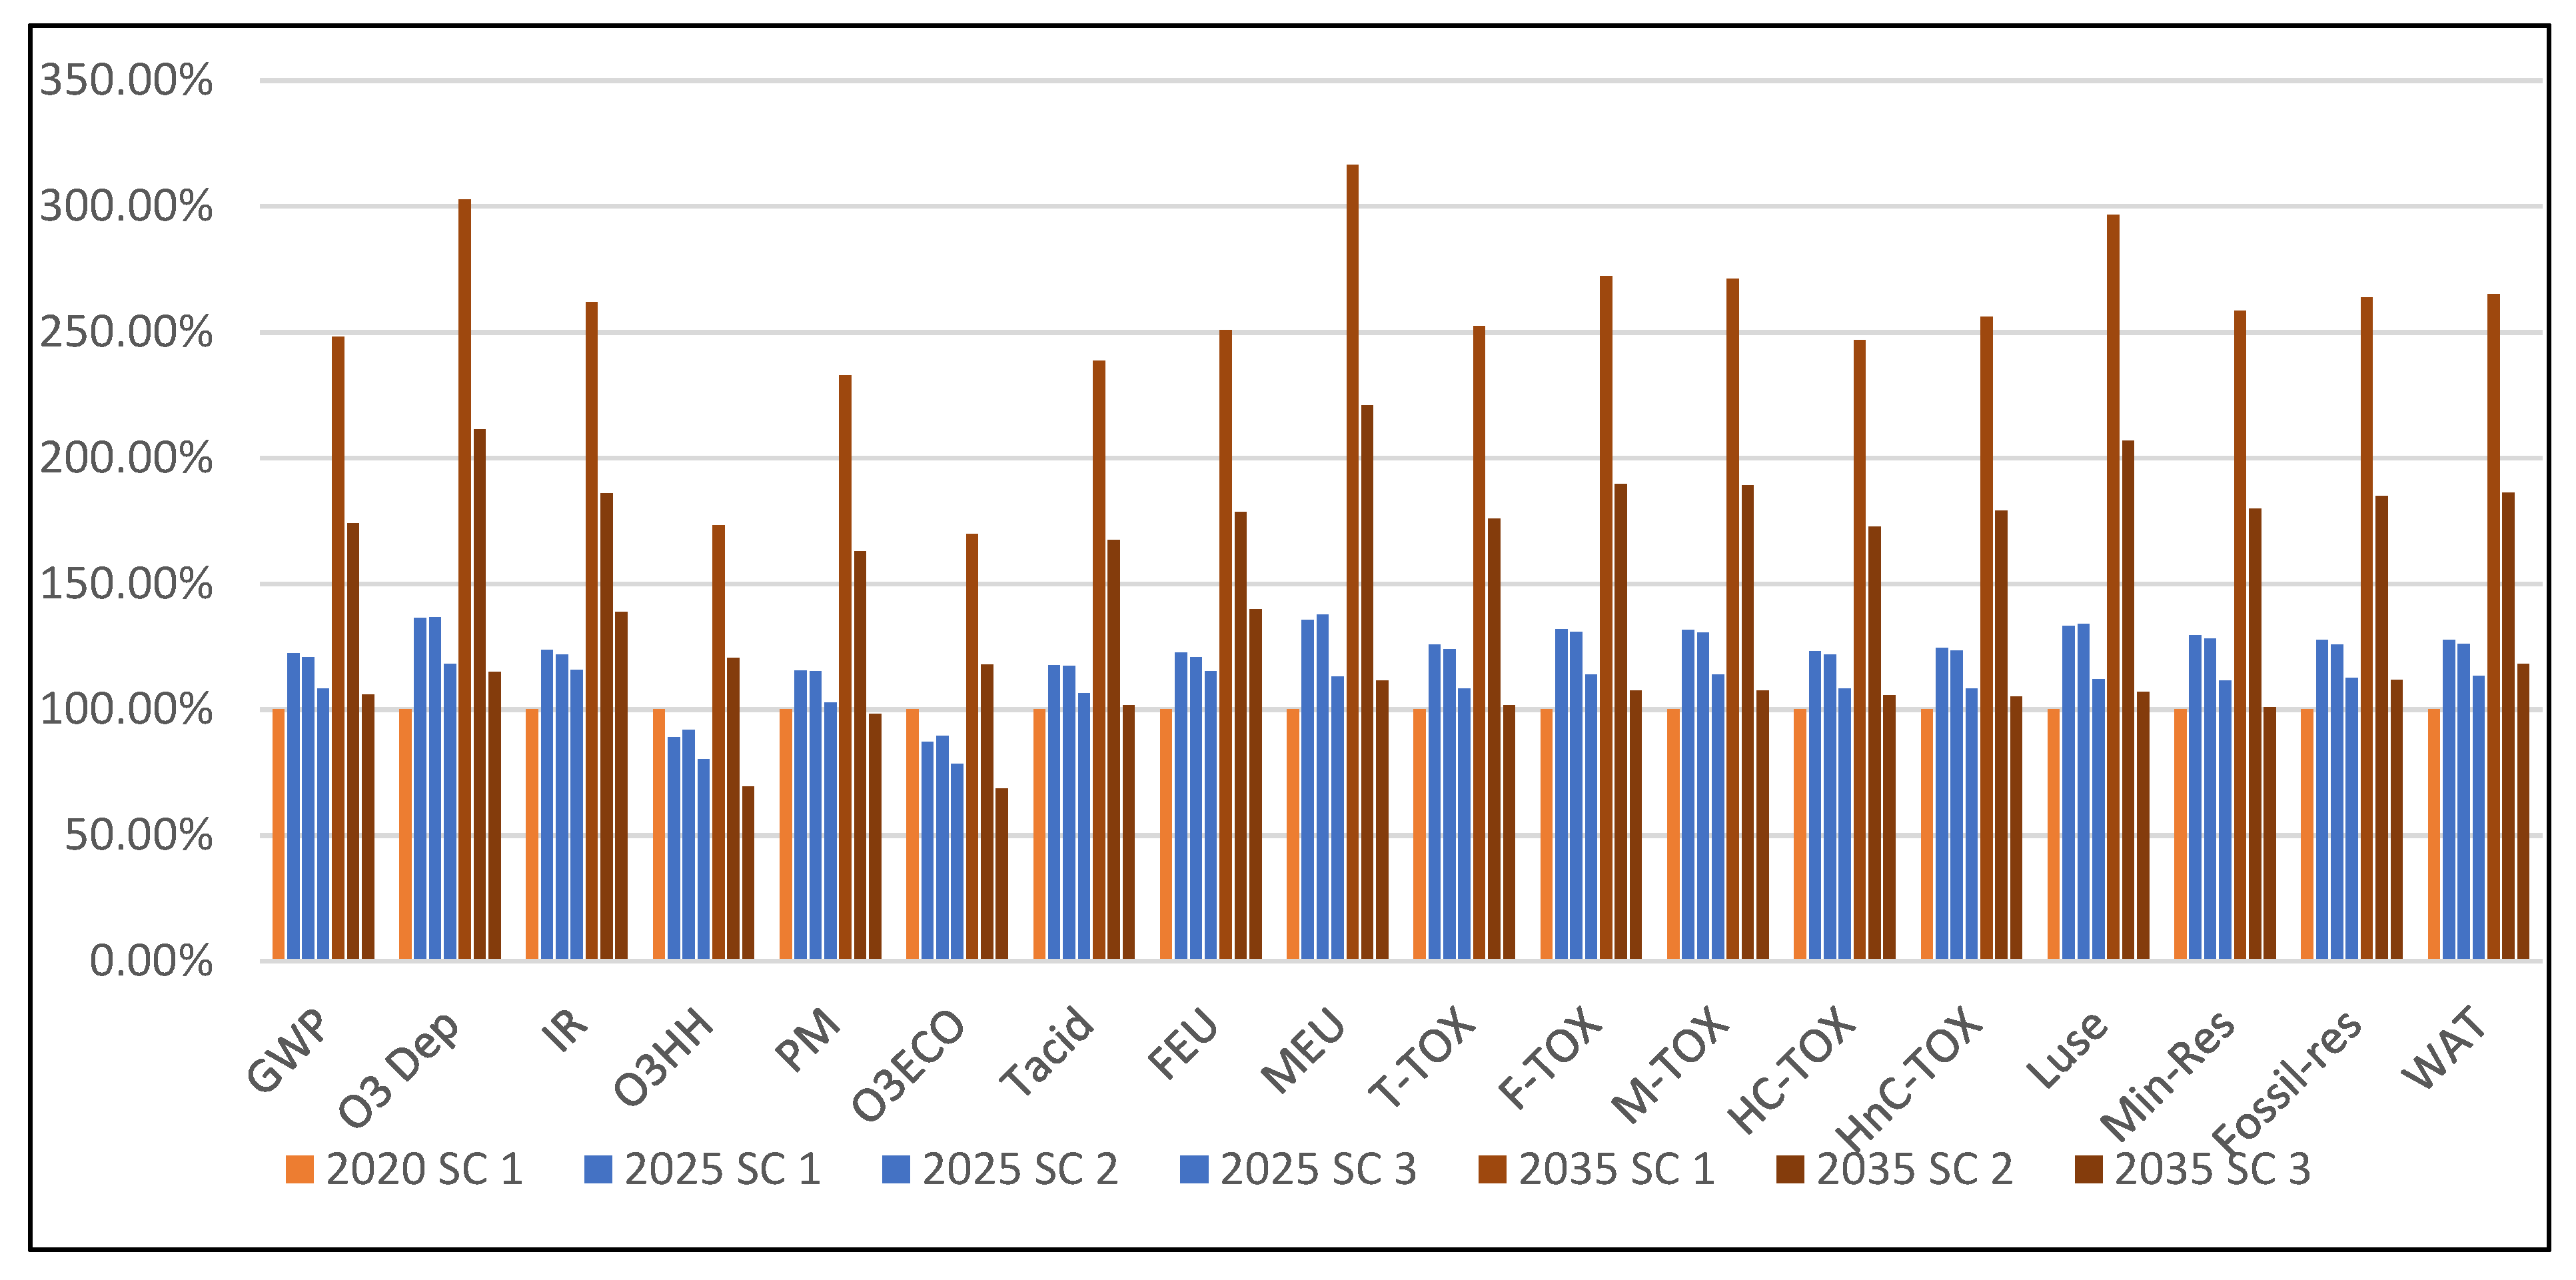
3.4. Car Fleet Evolution Scenarios
4. Conclusions
Supplementary Materials
Author Contributions
Funding
Institutional Review Board Statement
Informed Consent Statement
Data Availability Statement
Conflicts of Interest
Abbreviations
| Global warming | GWP, kg CO2 eq |
| Stratospheric ozone depletion | O3DEP, kg CFC11 eq |
| Ionizing radiation | IR, kBq Co-60 eq |
| Ozone formation, Human health | O3HH, kg NOx eq |
| Fine particulate matter formation | PM, kg PM2.5 eq |
| Ozone formation, Terrestrial ecosystems | O3ECO, kg NOx eq |
| Terrestrial acidification | T acid, kg SO2 eq |
| Freshwater eutrophication | FEU, kg P eq |
| Marine eutrophication | MEU kg N eq |
| Terrestrial ecotoxicity | T-TOX, kg 1,4-DCB |
| Freshwater ecotoxicity | F-TOX kg 1,4-DCB |
| Marine ecotoxicity | M-TOX kg 1,4-DCB |
| Human carcinogenic toxicity | HC-TOX kg 1,4-DCB |
| Human non-carcinogenic | HnC-toxicityTOX kg 1,4-DCB |
| Land use | Luse m2a crop eq |
| Mineral resource scarcity | Min-Res kg Cu eq |
| Fossil resource scarcity | Fossil-res, kg oil eq |
| Water consumption | WAT m3 |
References
- ACEA. Vehicles in Use Europe 2022; ACEA: Brussels, Belgium, 2022. [Google Scholar]
- NIS, National institute for Statistics-Romania, R. TRN103C—Registered Road Vehicles (End of the Year), by Groups of Age Data Set. Available online: http://statistici.insse.ro:8077/tempo-online/#/pages/tables/insse-table (accessed on 15 February 2022).
- ISO 14006:2020(En); Environmental Management Systems—Guidelines for Incorporating Ecodesign. International Organization for Standardization: Geneva, Switzerland, 2020.
- Danilecki, K.; Eliasz, J.; Smurawski, P.; Stanek, W.; Szlęk, A. Modeling Inventory and Environmental Impacts of Car Maintenance and Repair: A Case Study of Ford Focus Passenger Car. J. Clean. Prod. 2021, 315, 128085. [Google Scholar] [CrossRef]
- ISO 14044:2006; Environmental Management. Life Cycle Assessment. Requirements and Guidelines. International Organization for Standardization: Geneva, Switzerland, 2006.
- Staniszewska, E.; Klimecka-Tatar, D.; Obrecht, M. Eco-Design Processes in the Automotive Industry. Prod. Eng. Arch. 2020, 26, 131–137. [Google Scholar] [CrossRef]
- Anselma, P.G.; Belingardi, G. Comparing Battery Electric Vehicle Powertrains through Rapid Component Sizing. Int. J. Electr. Hybrid Veh. 2019, 11, 36–58. [Google Scholar] [CrossRef]
- Jung, H. Fuel Economy of Plug-In Hybrid Electric and Hybrid Electric Vehicles: Effects of Vehicle Weight, Hybridization Ratio and Ambient Temperature. World Electr. Veh. J. 2020, 11, 31. [Google Scholar] [CrossRef] [Green Version]
- Mierlo, J. Van Special Issue “Plug-In Hybrid Electric Vehicle (PHEV)”. Appl. Sci. 2019, 9, 2829. [Google Scholar] [CrossRef] [Green Version]
- Yang, Z.; Wang, B.; Jiao, K. Life Cycle Assessment of Fuel Cell, Electric and Internal Combustion Engine Vehicles under Different Fuel Scenarios and Driving Mileages in China. Energy 2020, 198, 117365. [Google Scholar] [CrossRef]
- Alvarez-Meaza, I.; Zarrabeitia-Bilbao, E.; Rio-Belver, R.M.; Garechana-Anacabe, G. Fuel-Cell Electric Vehicles: Plotting a Scientific and Technological Knowledge Map. Sustainability 2020, 12, 2334. [Google Scholar] [CrossRef] [Green Version]
- Buberger, J.; Kersten, A.; Kuder, M.; Eckerle, R.; Weyh, T.; Thiringer, T. Total CO2-Equivalent Life-Cycle Emissions from Commercially Available Passenger Cars. Renew. Sustain. Energy Rev. 2022, 159, 112158. [Google Scholar] [CrossRef]
- Ren, L.; Zhou, S.; Ou, X. Life-Cycle Energy Consumption and Greenhouse-Gas Emissions of Hydrogen Supply Chains for Fuel-Cell Vehicles in China. Energy 2020, 209, 118482. [Google Scholar] [CrossRef]
- Onat, N.C.; Gumus, S.; Kucukvar, M.; Tatari, O. Application of the TOPSIS and Intuitionistic Fuzzy Set Approaches for Ranking the Life Cycle Sustainability Performance of Alternative Vehicle Technologies. Sustain. Prod. Consum. 2016, 6, 12–25. [Google Scholar] [CrossRef]
- Li, W.; Long, R.; Zhang, L.; Cheng, X.; He, Z.; Chen, F. How the Uptake of Electric Vehicles in China Leads to Emissions Transfer: An Analysis from the Perspective of Inter-Provincial Electricity Trading. Sustain. Prod. Consum. 2021, 28, 1006–1017. [Google Scholar] [CrossRef]
- Xu, B.; Sharif, A.; Shahbaz, M.; Dong, K. Have Electric Vehicles Effectively Addressed CO2 Emissions? Analysis of Eight Leading Countries Using Quantile-on-Quantile Regression Approach. Sustain. Prod. Consum. 2021, 27, 1205–1214. [Google Scholar] [CrossRef]
- Guo, Z.; Li, T.; Shi, B.; Zhang, H. Economic Impacts and Carbon Emissions of Electric Vehicles Roll-out towards 2025 Goal of China: An Integrated Input-Output and Computable General Equilibrium Study. Sustain. Prod. Consum. 2022, 31, 165–174. [Google Scholar] [CrossRef]
- Chen, Z.; Carrel, A.L.; Gore, C.; Shi, W. Environmental and Economic Impact of Electric Vehicle Adoption in the U.S. Environ. Res. Lett. 2021, 16, 045011. [Google Scholar] [CrossRef]
- Woo, J.R.; Magee, C.L. Forecasting the Value of Battery Electric Vehicles Compared to Internal Combustion Engine Vehicles: The Influence of Driving Range and Battery Technology. Int. J. Energy Res. 2020, 44, 6483–6501. [Google Scholar] [CrossRef]
- Huang, X.; Lin, Y.; Zhou, F.; Lim, M.K.; Chen, S. Agent-Based Modelling for Market Acceptance of Electric Vehicles: Evidence from China. Sustain. Prod. Consum. 2021, 28, 206–217. [Google Scholar] [CrossRef]
- Hjelkrem, O.A.; Arnesen, P.; Aarseth Bø, T.; Sondell, R.S. Estimation of Tank-to-Wheel Efficiency Functions Based on Type Approval Data. Appl. Energy 2020, 276, 115463. [Google Scholar] [CrossRef]
- de Souza, L.L.P.; Lora, E.E.S.; Palacio, J.C.E.; Rocha, M.H.; Renó, M.L.G.; Venturini, O.J. Comparative Environmental Life Cycle Assessment of Conventional Vehicles with Different Fuel Options, Plug-in Hybrid and Electric Vehicles for a Sustainable Transportation System in Brazil. J. Clean. Prod. 2018, 203, 444–468. [Google Scholar] [CrossRef]
- Ternel, C.; Bouter, A.; Melgar, J. Life Cycle Assessment of Mid-Range Passenger Cars Powered by Liquid and Gaseous Biofuels: Comparison with Greenhouse Gas Emissions of Electric Vehicles and Forecast to 2030. Transp. Res. Part D Transp. Environ. 2021, 97, 102897. [Google Scholar] [CrossRef]
- Pourahmadiyan, A.; Ahmadi, P.; Kjeang, E. Dynamic Simulation and Life Cycle Greenhouse Gas Impact Assessment of CNG, LNG, and Diesel-Powered Transit Buses in British Columbia, Canada. Transp. Res. Part D Transp. Environ. 2021, 92, 102724. [Google Scholar] [CrossRef]
- Karagoz, S.; Aydin, N.; Simic, V. End-of-Life Vehicle Management: A Comprehensive Review. J. Mater. Cycles Waste Manag. 2020, 22, 416–442. [Google Scholar] [CrossRef] [Green Version]
- Zhang, L.; Ji, K.; Liu, W.; Cui, X.; Liu, Y.; Cui, Z. Collaborative Approach for Environmental and Economic Optimization Based on Life Cycle Assessment of End-of-Life Vehicles’ Dismantling in China. J. Clean. Prod. 2020, 276, 124288. [Google Scholar] [CrossRef]
- Hooftman, N.; Oliveira, L.; Messagie, M.; Coosemans, T.; Van Mierlo, J. Environmental Analysis of Petrol, Diesel and Electric Passenger Cars in a Belgian Urban Setting. Energies 2016, 9, 84. [Google Scholar] [CrossRef]
- Del Pero, F.; Delogu, M.; Pierini, M. The Effect of Lightweighting in Automotive LCA Perspective: Estimation of Mass-Induced Fuel Consumption Reduction for Gasoline Turbocharged Vehicles. J. Clean. Prod. 2017, 154, 566–577. [Google Scholar] [CrossRef]
- Danielis, R.; Scorrano, M.; Giansoldati, M. Decarbonising Transport in Europe: Trends, Goals, Policies and Passenger Car Scenarios. Res. Transp. Econ. 2021, 91, 101068. [Google Scholar] [CrossRef]
- Lam, A.; Mercure, J.F. Which Policy Mixes Are Best for Decarbonising Passenger Cars? Simulating Interactions among Taxes, Subsidies and Regulations for the United Kingdom, the United States, Japan, China, and India. Energy Res. Soc. Sci. 2021, 75, 101951. [Google Scholar] [CrossRef]
- Del Pero, F.; Delogu, M.; Pierini, M. Life Cycle Assessment in the Automotive Sector: A Comparative Case Study of Internal Combustion Engine (ICE) and Electric Car. Procedia Struct. Integr. 2018, 12, 521–537. [Google Scholar] [CrossRef]
- Xiong, S.; Ji, J.; Ma, X. Comparative Life Cycle Energy and GHG Emission Analysis for BEVs and PHEVs: A Case Study in China. Energies 2019, 12, 834. [Google Scholar] [CrossRef] [Green Version]
- Held, M.; Schücking, M. Utilization Effects on Battery Electric Vehicle Life-Cycle Assessment: A Case-Driven Analysis of Two Commercial Mobility Applications. Transp. Res. Part D Transp. Environ. 2019, 75, 87–105. [Google Scholar] [CrossRef]
- Mayyas, A.; Omar, M.; Hayajneh, M.; Mayyas, A.R. Vehicle’s Lightweight Design vs. Electrification from Life Cycle Assessment Perspective. J. Clean. Prod. 2017, 167, 687–701. [Google Scholar] [CrossRef]
- Lewis, G.M.; Buchanan, C.A.; Jhaveri, K.D.; Sullivan, J.L.; Kelly, J.C.; Das, S.; Taub, A.I.; Keoleian, G.A. Green Principles for Vehicle Lightweighting. Environ. Sci. Technol. 2019, 53, 4063–4077. [Google Scholar] [CrossRef] [PubMed]
- Kelly, J.C.; Sullivan, J.L.; Burnham, A.; Elgowainy, A. Impacts of Vehicle Weight Reduction via Material Substitution on Life-Cycle Greenhouse Gas Emissions. Environ. Sci. Technol. 2015, 49, 12535–12542. [Google Scholar] [CrossRef] [PubMed]
- Nis, National institute for Statistics-Romania, TRN103E—Registered Road Vehicles (End of the Year), by European Vehicle Emissions Standards Data Set. Available online: http://statistici.insse.ro:8077/tempo-online/#/pages/tables/insse-table (accessed on 17 March 2022).
- Ntziachristos, L.; Samaras, Z. EMEP/EEA Air Pollutant Emission Inventory Guidebook 2019—Update Oct. 2021; European Environment Agency: Copenhagen, Denmark, 2021. [Google Scholar]
- ISO 14040:2006; Environmental Management—Life Cycle Assessment—Part 1: Principles and Framework. International Organization for Standardization: Geneva, Switzerland, 2006.
- Huijbregts, M.A.J.; Steinmann, Z.J.N.; Elshout, P.M.F.; Stam, G.; Verones, F.; Vieira, M.D.M.; Hollander, A.; Zijp, M.; van Zelm, R. ReCiPe 2016 v1.1-A Harmonized Life Cycle Impact Assessment Method at Midpoint and Mndpoint Level Report I: Characterization RIVM Report 2016-0104a; National Institute for Public Health and the Environment: Bilthoven, The Netherlands, 2017. [Google Scholar]
- DRPCIV General Directorate for Driving Lincenses and Car Registrations Iasi County Car Registry Data Set, Montly Reports. 2020. Available online: https://www.drpciv.ro/news-details/statistica/ (accessed on 17 March 2022).
- EC Regulation (EU) 2019/631 of the European Parliament and of the Council of 17 April 2019 Setting CO2 Emission Performance Standards for New Passenger Cars and for New Light Commercial Vehicles, and Repealing Regulations (EC) No 443/2009 and (EU) No 510/201. Off. J. Eur. Communities 2021, 111, 13.


| Article Topic | Study Objectives | Main Findings | Reference |
|---|---|---|---|
| Environmental comparison of conventional and electric cars | Comparative case study of ICEV and electric cars | BEVs have fewer climate change impacts. BEV manufacturing has greater impacts as compared to ICEV. Other environmental impacts (acidification, human toxicity, particulate matter, photochemical ozone formation and resource depletion) have higher results for the BEV than the ICEV, primarily due to the major environmental loads of powertrain construction and manufacturing. | [7,31] |
| Compare life cycle (LC) Energy and GHG Emission of BEVs and PHEVs | BEVs are less emission-intensive than PHEVs, but efficiency depends greatly on the electricity mix generation | [32,33] | |
| Light weighting | Lightweight design vs. Electrification | Lightweight materials such as aluminum have the lowest energy consumption and the lowest CO2 emissions compared to steel and magnesium-based designs. Hybrid vehicles perform better but this again depends on the electricity mix. | [34] |
| Reducing vehicle mass to improve performance | Material substitution may reduce vehicle weight, but it may also lead to increased vehicle-cycle GHGs (e.g., by replacing steel with wrought aluminum, carbon fiber reinforced plastic (CRFP), or magnesium). However, lifetime fuel economy benefits often outweigh the vehicle-cycle, resulting in a net total life cycle GHG benefit. | [35,36] | |
| Fuels and well-to-wheel systems impacts | Assess GHG emission impacts of diverse biofuels | Biofuels (liquid or gas) impacts depend strongly on the incorporation rate. A low incorporation rate (E10 and B7) leads to small benefits, but for the E85 and B100 fuels, the CO2 emissions reduction would be great. Simulated results for E85 biofuel are close to extended range BEVs in 2019: 103 vs. 85 g CO2 eq/km, respectively. | [23] |
| Economic impacts, consumer behavior | Effect of large-scale adoption of BEVs on environmental impacts economic variables and consumer acceptability | Fuel price changes, incentives by manufacturers, but mainly state subsidies are the main drivers for BEV adoption. Availability of charging stations is also important. Increased BEV productivity and uptake may lead to growth in non-tailpipe emissions which can cancel out some of the tailpipe benefices, so BEV adoption stimulation policies (subsidies) should be complemented by green manufacturing and green power generation initiatives. | [17,18,20] |
| Large-scale adoption of BEVs leads to changes in national or regional electricity impact profiles. | [15] | ||
| Investigation of 63 scenarios of using combinations of regulatory, procurement and fiscal policies | Combining electric vehicle mandates with taxes and regulations on combustion vehicles is highly effective in changing consumer behavior. | [30] |
| Emission Group | Pollutants (Major Types) | Emission Calculation Methodology | Specific Conditions and Parameters |
|---|---|---|---|
| Group 1 | CO, NOx, NMVOC, PM, N2O, NH3 | Specific emission factors considering various models | |
| Group 2 | CO2, SO2, heavy metals | Estimated based on fuel consumption (fuel quantity dependent) | Default values were used: Petrol calorific value: 43.774 MJ/kg Diesel calorific value: 42.695 MJ/kg E10 petrol mix (90% petrol, 10% bioethanol), B7 diesel mix (93% diesel, 7% biodiesel) |
| Group 3 | Polycyclic aromatic hydrocarbons (PAHs) and persistent organic pollutants (POPs) | Simplified methodology considering bulk emission factors (instead of specific) | |
| Group 4 | Alkanes, Alkenes, Alkynes, Aldehydes, Ketones, cycloalkanes, Aromatics | Estimation based on fraction of total NMVOCs |
| Pollution Class | Units | EURO4 Petrol | EURO4 Diesel | Hybrid EURO5 | EV | Ecoinvent Process/ Ecoinvent Flow | Data Source/ Comments |
|---|---|---|---|---|---|---|---|
| INVENTORY INPUTS: | |||||||
| Fuel consumption | kg/km | 0.0755 | 0.0756 | 0.0302 | - | E10 Petrol: 10% ethanol by volume from biomass {RO}| production|Alloc Def, U + 90% Petrol, low sulfur {ROW}| market for|Alloc Def, U And Diesel B7: 7% Vegetable oil methyl ester {RoW}| esterification of rape oil|Alloc Def, U + 93% Diesel {RO}| market for|Alloc Def, U | Values (quantities) calculated in Copert 5.5 |
| Electricity | kWh/km | - | - | 0.158 | 0.119 | 2020 Electricity, low voltage {RO}| market for|Alloc Def, U | Modeled according to existing PHEV and EV data manuals |
| INVENTORY OUTPUTS: | |||||||
| DIRECT OPERATION EMISSIONS (EXHAUST EMISSIONS) | |||||||
| Carbon monoxide | g/km | 0.1591 | 0.1900 | 0.09984 | - | Carbon monoxide | Values (quantities) calculated in Copert 5.5 considering specific driving conditions, passenger car age |
| Carbon Dioxide | g/km | 232.99 | 206.48 | 93.196 | - | Carbon Dioxide | |
| Methane | g/km | 0.0020 | 0.0008 | 0.0008 | - | Methane | |
| Sulfur Dioxide | g/km | 0.0014 | 0.0012 | 0.0005 | - | Sulfur Dioxide | |
| NOx, of which: | g/km | 0.0789 | 0.7785 | 0.0160 | - | NOx | |
| NO2 | g/km | 0.0024 | 0.4282 | 0.0005 | - | NO2 | |
| NO | g/km | 0.0765 | 0.3503 | 0.0155 | - | NO | |
| Dinitrous Oxide | g/km | 0.0015 | 0.0064 | 0.0007 | - | Dinitrous Oxide | |
| Particulates, PM 2.5 | g/km | 0.0004 | 0.0360 | 0.00026 | - | Particulates, PM 2.5 | |
| Lead | mg/km | 1.20 × 10⁻⁴ | 3.28 × 10⁻⁵ | 4.80 × 10⁻⁵ | - | Lead | Values (quantities) calculated in Copert 5.5. considering specific driving conditions, passenger car age |
| Nickel | mg/km | 1.73 × 10⁻⁴ | 1.31 × 10⁻⁵ | 6.90 × 10⁻⁵ | - | Nickel | |
| Zinc | mg/km | 2.48 × 10⁻³ | 1.18 × 10⁻³ | 9.90 × 10⁻⁴ | - | Zinc | |
| Selenium | mg/km | 1.50 × 10⁻⁵ | 6.57 × 10⁻⁶ | 6.01 × 10⁻⁶ | - | Selenium | |
| Mercury | mg/km | 6.53 × 10⁻⁴ | 3.48 × 10⁻⁴ | 2.61 × 10⁻⁴ | - | Mercury | |
| Chromium | mg/km | 4.73 × 10⁻⁴ | 5.58 × 10⁻⁴ | 1.89 × 10⁻⁴ | - | Chromium | |
| Arsenic | mg/km | 2.25 × 10⁻⁵ | 6.57 × 10⁻⁶ | 9.01 × 10⁻⁶ | - | Arsenic | |
| Cadmium | mg/km | 1.50 × 10⁻⁵ | 3.28 × 10⁻⁶ | 6.01 × 10⁻⁶ | - | Cadmium | |
| Volatile organic compounds | g/km | 0.0115 | 0.0250 | 0.00317 | - | VOCs | Values (quantities) calculated in Copert 5.5 considering specific driving conditions, passenger car age |
| Non-methane Volatile organic compounds | g/km | 0.0094 | 0.0242 | 0.00051 | - | NMVOCs | |
| NON-EXHAUST EMISSIONS: | |||||||
| Specific brake pads wear emissions | kg/km | 1.15 × 10⁻⁶ | 1.15 × 10⁻⁶ | 1.15 × 10⁻⁶ | 1.15 × 10⁻⁶ | Break wear emissions, passenger car {GLO}| market for|Alloc Def, U | Default values from Ecoinvent database |
| Specific tire emissions | kg/km | 7.42 × 10⁻⁵ | 7.42 × 10⁻⁵ | 7.42 × 10⁻⁵ | 7.42 × 10⁻⁵ | Tire wear emissions, passenger car {GLO}| market for|Alloc Def, U | Default values from Ecoinvent database |
| Specific road abrasion emissions | kg/km | 1.27 × 10⁻⁵ | 1.27 × 10⁻⁵ | 1.279 × 10⁻⁵ | 1.27 × 10⁻⁵ | Road wear emissions, passenger car {GLO}| market for|Alloc Def, U | Default values from Ecoinvent database |
| Total | Non-EURO | EURO 1 | EURO 2 | EURO 3 | EURO 4 | EURO 5 | EURO 6 | |
|---|---|---|---|---|---|---|---|---|
| 2020 stock | 193,187 | 22,744 | 607 | 21,543 | 35,088 | 68,099 | 24,322 | 20,784 |
| 2020 registrations | 14,415 | 28 | 28 | 254 | 2237 | 4847 | 2416 | 4605 |
| 2020 outputs | −2048 | −68 | −244 | −346 | −817 | −460 | −73 | −40 |
| total | 205,554 | 22,704 | 391 | 21,451 | 36,508 | 72,486 | 26,665 | 25,349 |
| % of total | 100 | 11.0% | 0.2% | 10.4% | 17.8% | 35.3% | 13.0% | 12.3% |
| Scenario | Description |
|---|---|
| Scenario 1—no change | Used vehicles are being imported at the same rates since the last limits were dropped-out (2015–2021). Engine type and pollution class distribution follow historic trends. |
| Scenario 2—2023 ban on importing used passenger cars older than 15 years | Used vehicles are imported at the same rates as in the regulated period (2008–2014). Engine type and pollution class distribution are modeled considering S-type or bell-type growth curves. Hybrid and electric cars growth rates are modeled considering the initial exponential trend and then they reach a plateau based on the future development in this market sector such as: increased support in the car renewal program, increased production numbers of national electric cars, increasing the number of publicly available charging stations. |
| Scenario 3—2023 ban on used passenger cars imports and an accelerated intake rate for hybrid and electric cars | Growth rates consider that used cars are imported at the same rates as in the regulated period (2008–2014), and the current new cars registration rates. Hybrid and electric car uptake at a double rate as compared to Scenario 2. |
Publisher’s Note: MDPI stays neutral with regard to jurisdictional claims in published maps and institutional affiliations. |
© 2022 by the authors. Licensee MDPI, Basel, Switzerland. This article is an open access article distributed under the terms and conditions of the Creative Commons Attribution (CC BY) license (https://creativecommons.org/licenses/by/4.0/).
Share and Cite
Barjoveanu, G.; Dinita, F.; Teodosiu, C. Aging Passenger Car Fleet Structure, Dynamics, and Environmental Performance Evaluation at the Regional Level by Life Cycle Assessment. Sustainability 2022, 14, 8443. https://doi.org/10.3390/su14148443
Barjoveanu G, Dinita F, Teodosiu C. Aging Passenger Car Fleet Structure, Dynamics, and Environmental Performance Evaluation at the Regional Level by Life Cycle Assessment. Sustainability. 2022; 14(14):8443. https://doi.org/10.3390/su14148443
Chicago/Turabian StyleBarjoveanu, George, Florenta Dinita, and Carmen Teodosiu. 2022. "Aging Passenger Car Fleet Structure, Dynamics, and Environmental Performance Evaluation at the Regional Level by Life Cycle Assessment" Sustainability 14, no. 14: 8443. https://doi.org/10.3390/su14148443
APA StyleBarjoveanu, G., Dinita, F., & Teodosiu, C. (2022). Aging Passenger Car Fleet Structure, Dynamics, and Environmental Performance Evaluation at the Regional Level by Life Cycle Assessment. Sustainability, 14(14), 8443. https://doi.org/10.3390/su14148443