
Power System Planning Assessment for Optimizing Renewable Energy Integration in the Maluku Electricity System

 , ,
, , 
Abstract
:1. Introduction

| Reference | Technical Parameters | ||||||||
|---|---|---|---|---|---|---|---|---|---|
| Component Loading | Voltage Profile | Short-Circuit Current | N-1 Contingency | Voltage Stability | Small-Signal Stability | Dynamic Voltage Stability | Frequency Stability | Rotor Angle Stability | |
| [13] | ✓ | ✓ | - | - | ✓ | - | ✓ | ✓ | ✓ |
| [14] | - | ✓ | - | - | - | - | ✓ | - | - |
| [15] | ✓ | ✓ | - | - | ✓ | - | - | - | - |
| [16] | ✓ | ✓ | - | - | ✓ | - | ✓ | ✓ | ✓ |
| [17] | - | ✓ | - | - | - | - | ✓ | ✓ | ✓ |
| [21] | ✓ | ✓ | - | ✓ | - | - | - | - | - |
| [22] | ✓ | ✓ | ✓ | ✓ | ✓ | ✓ | - | - | - |
| [26] | - | - | ✓ | - | - | - | ✓ | - | - |
| [27] | - | ✓ | - | - | - | - | - | - | |
| [28] | ✓ | ✓ | ✓ | ✓ | - | - | ✓ | ✓ | ✓ |
| [29] | - | - | - | - | - | ✓ | - | - | - |
2. Materials and Methods
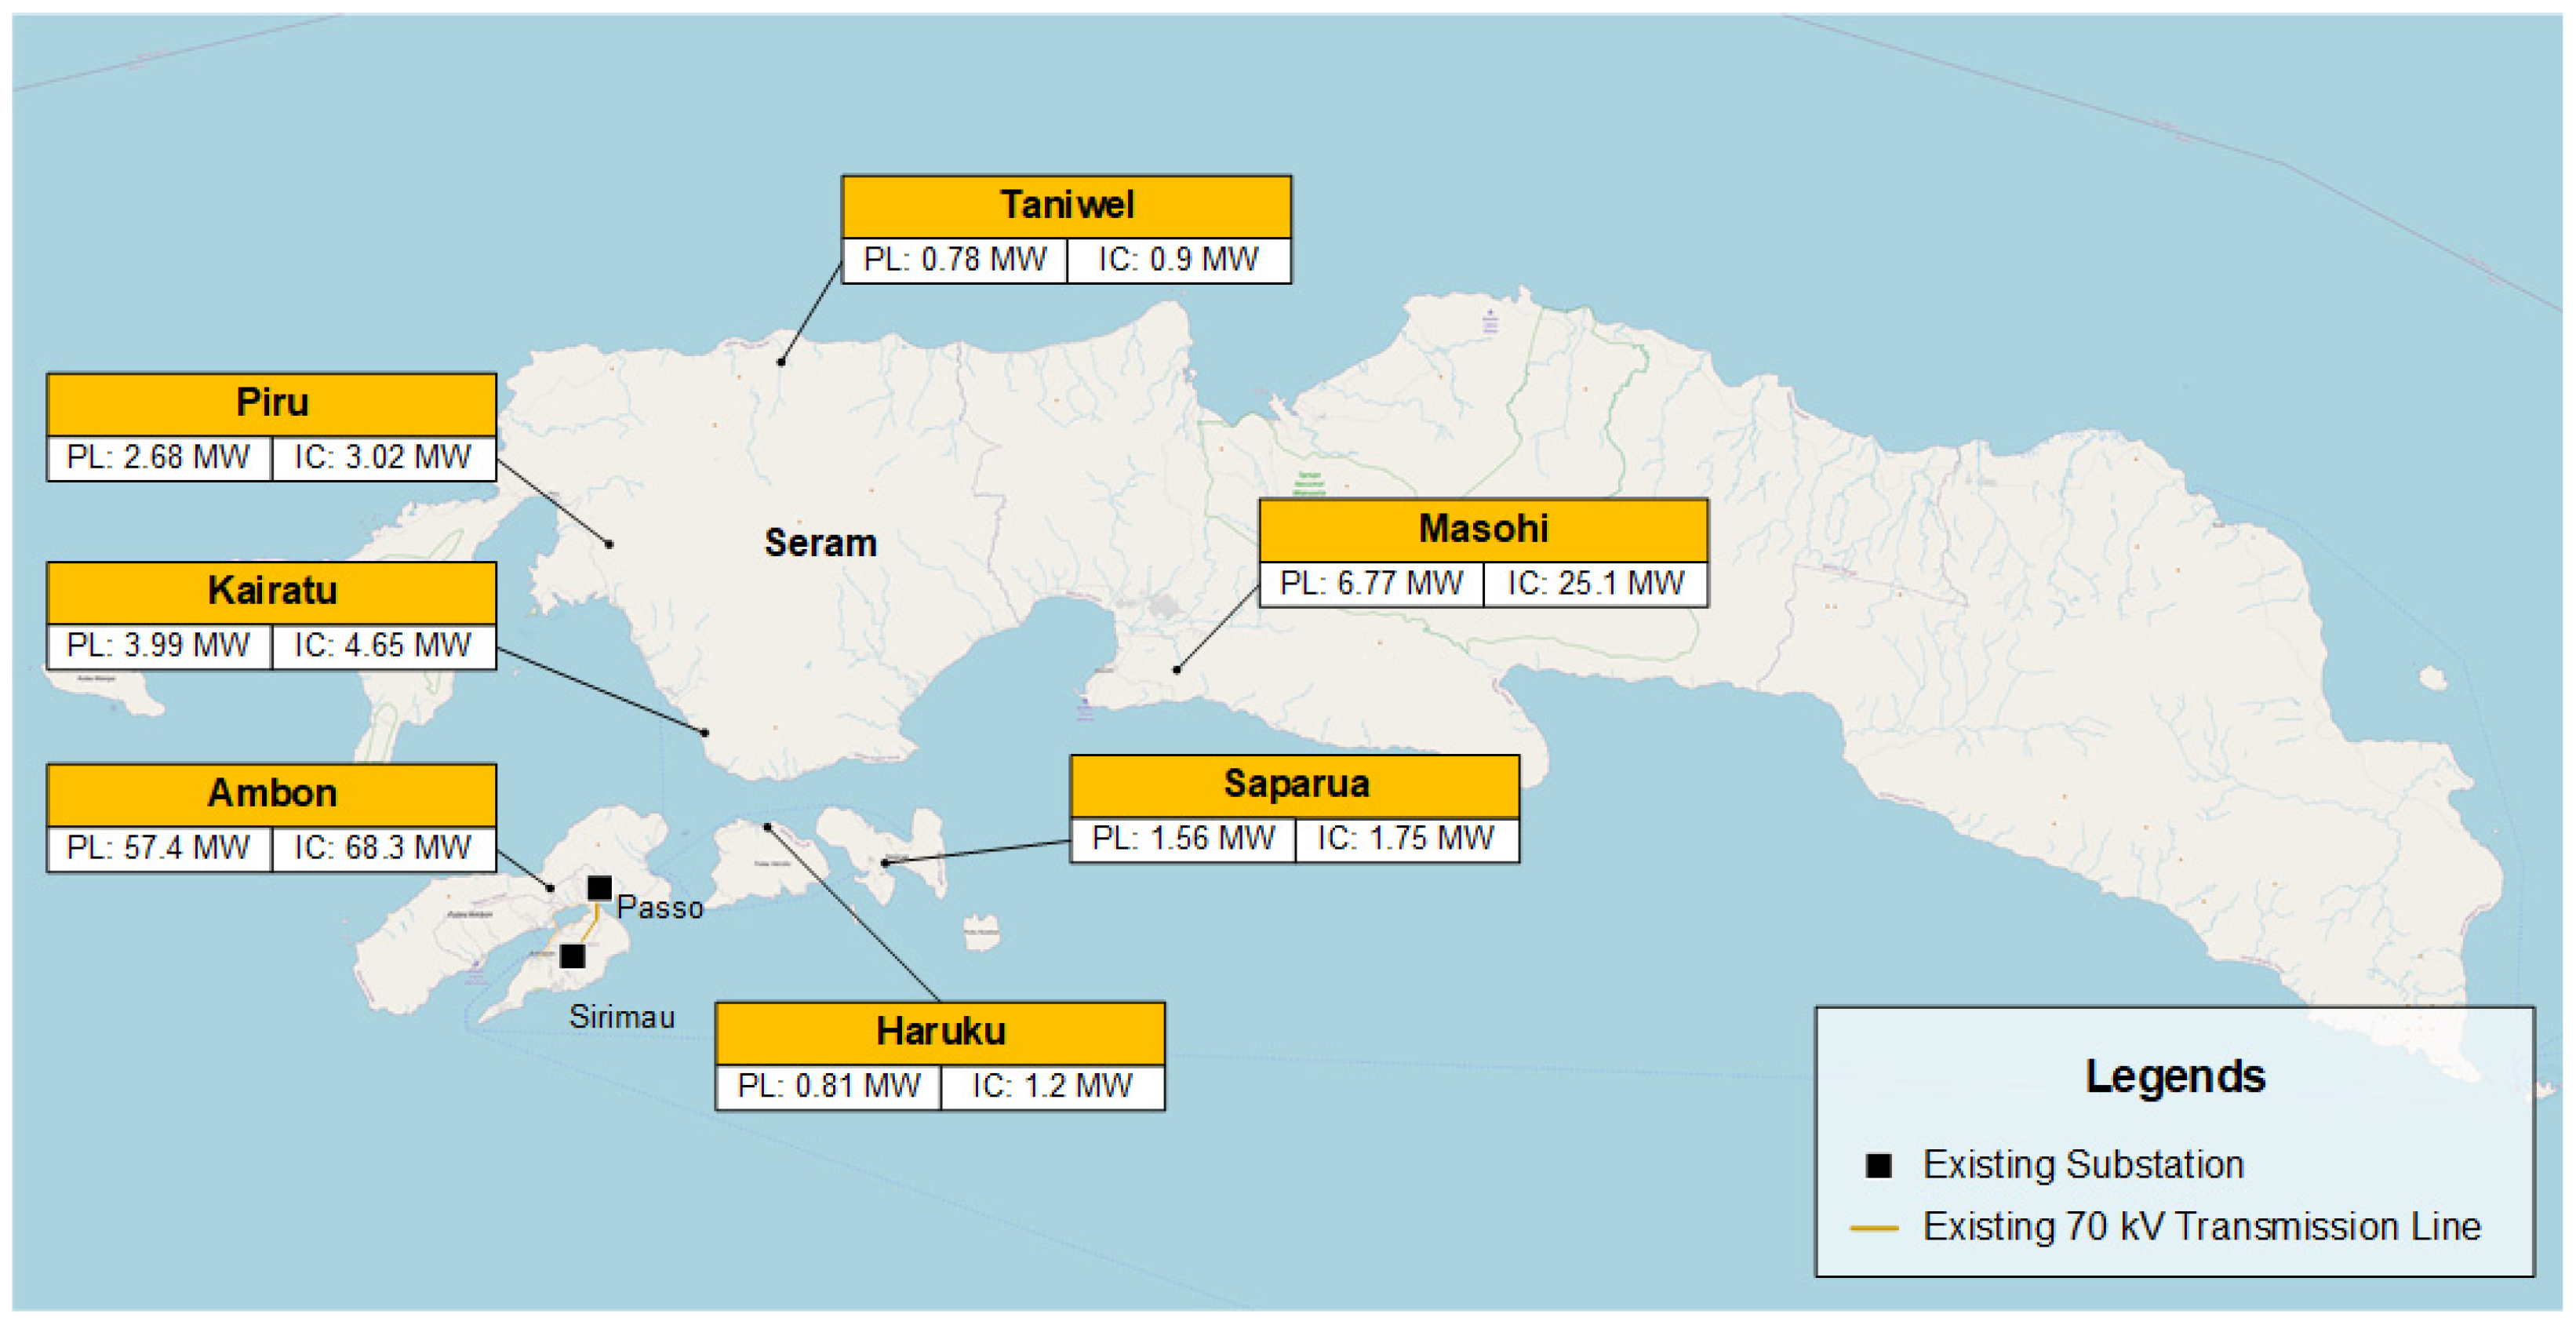
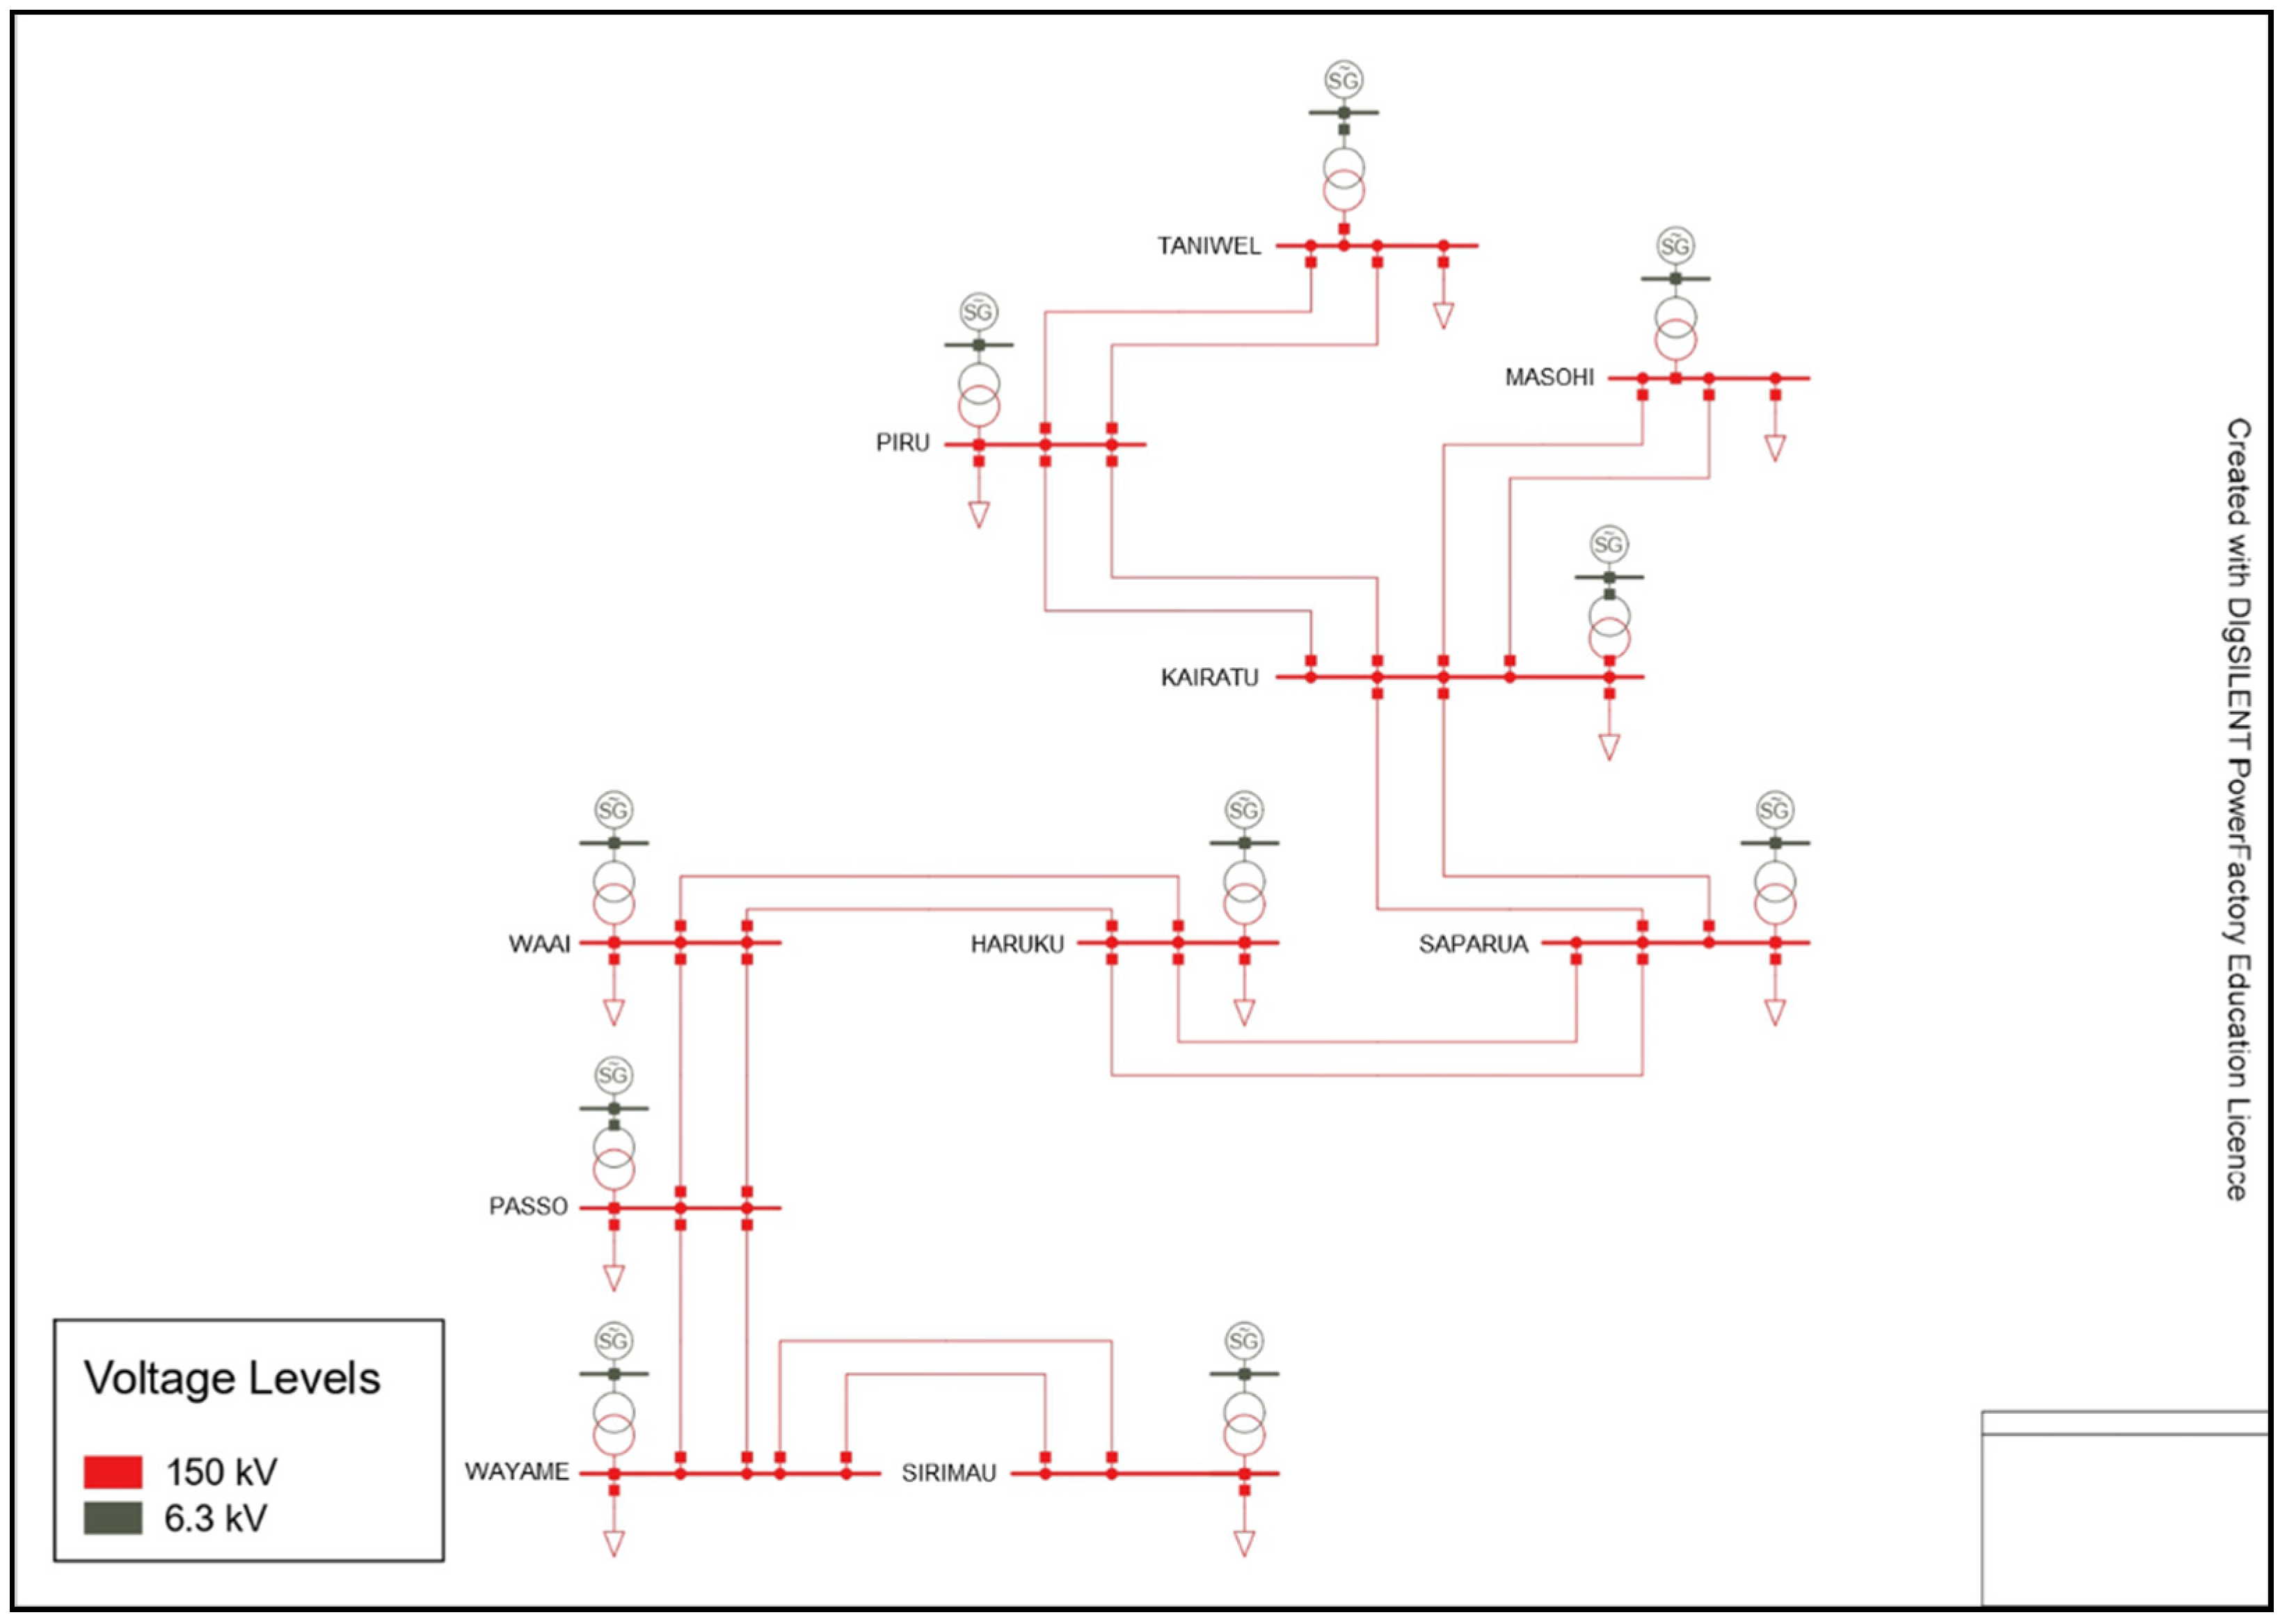
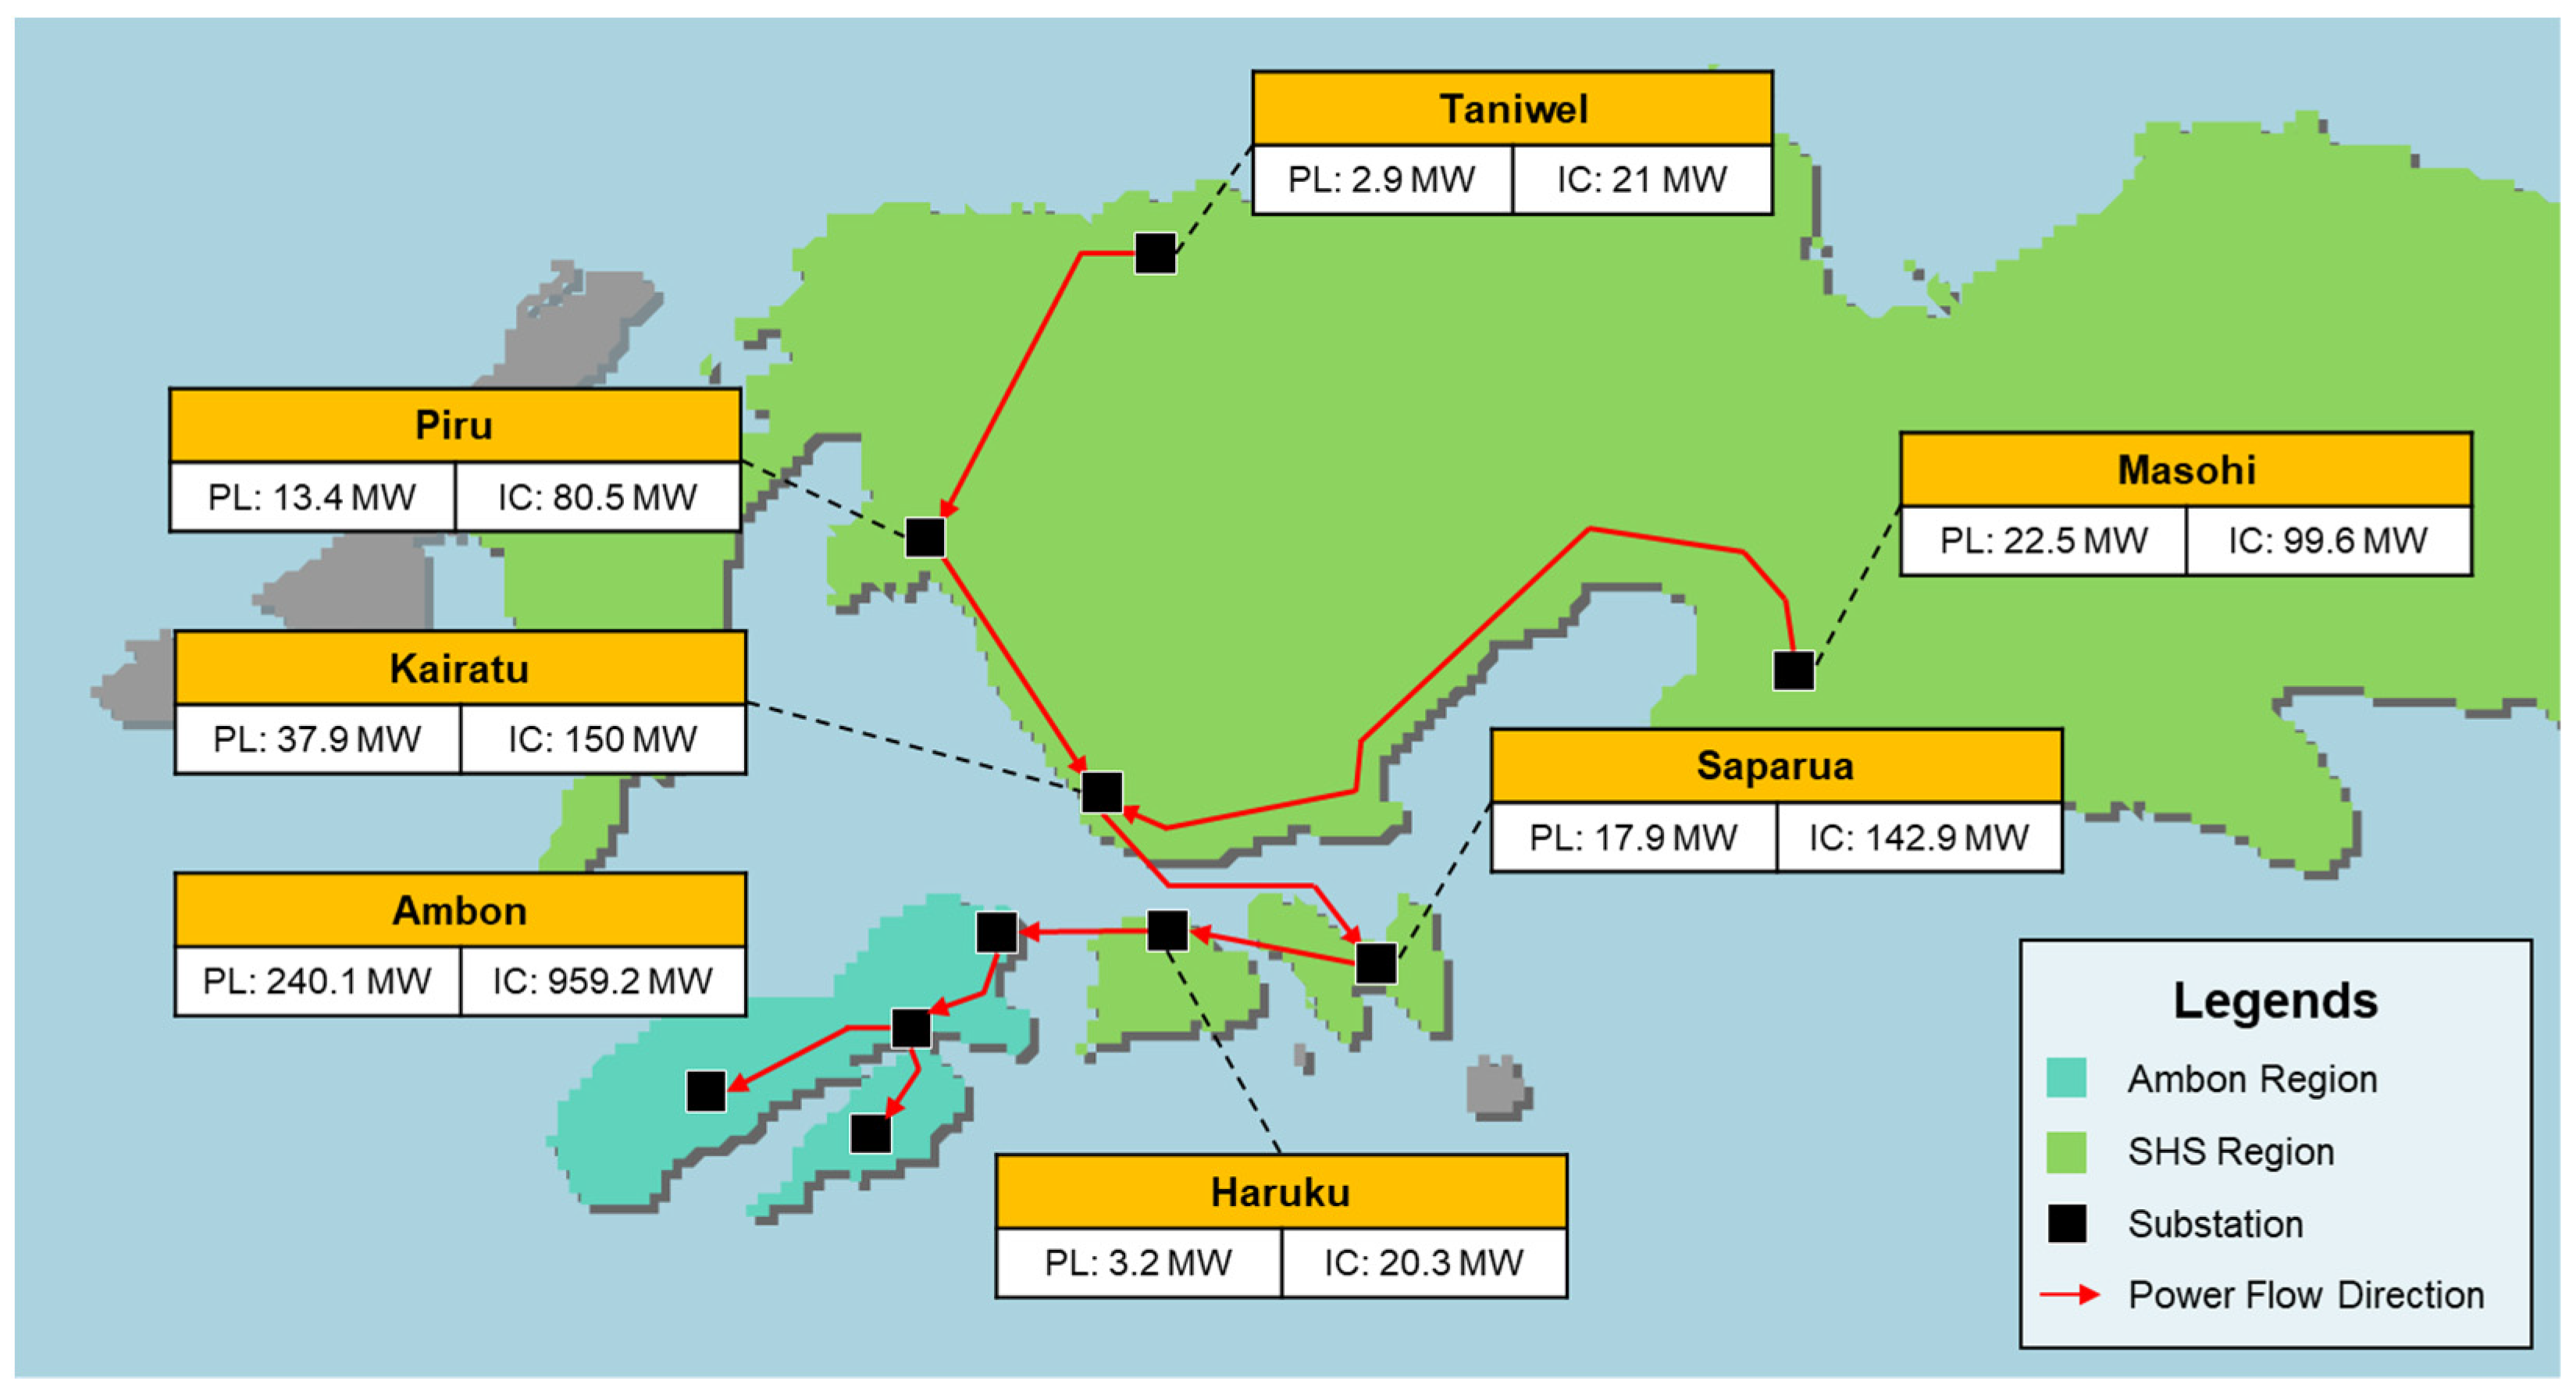
2.1. Maluku Power System
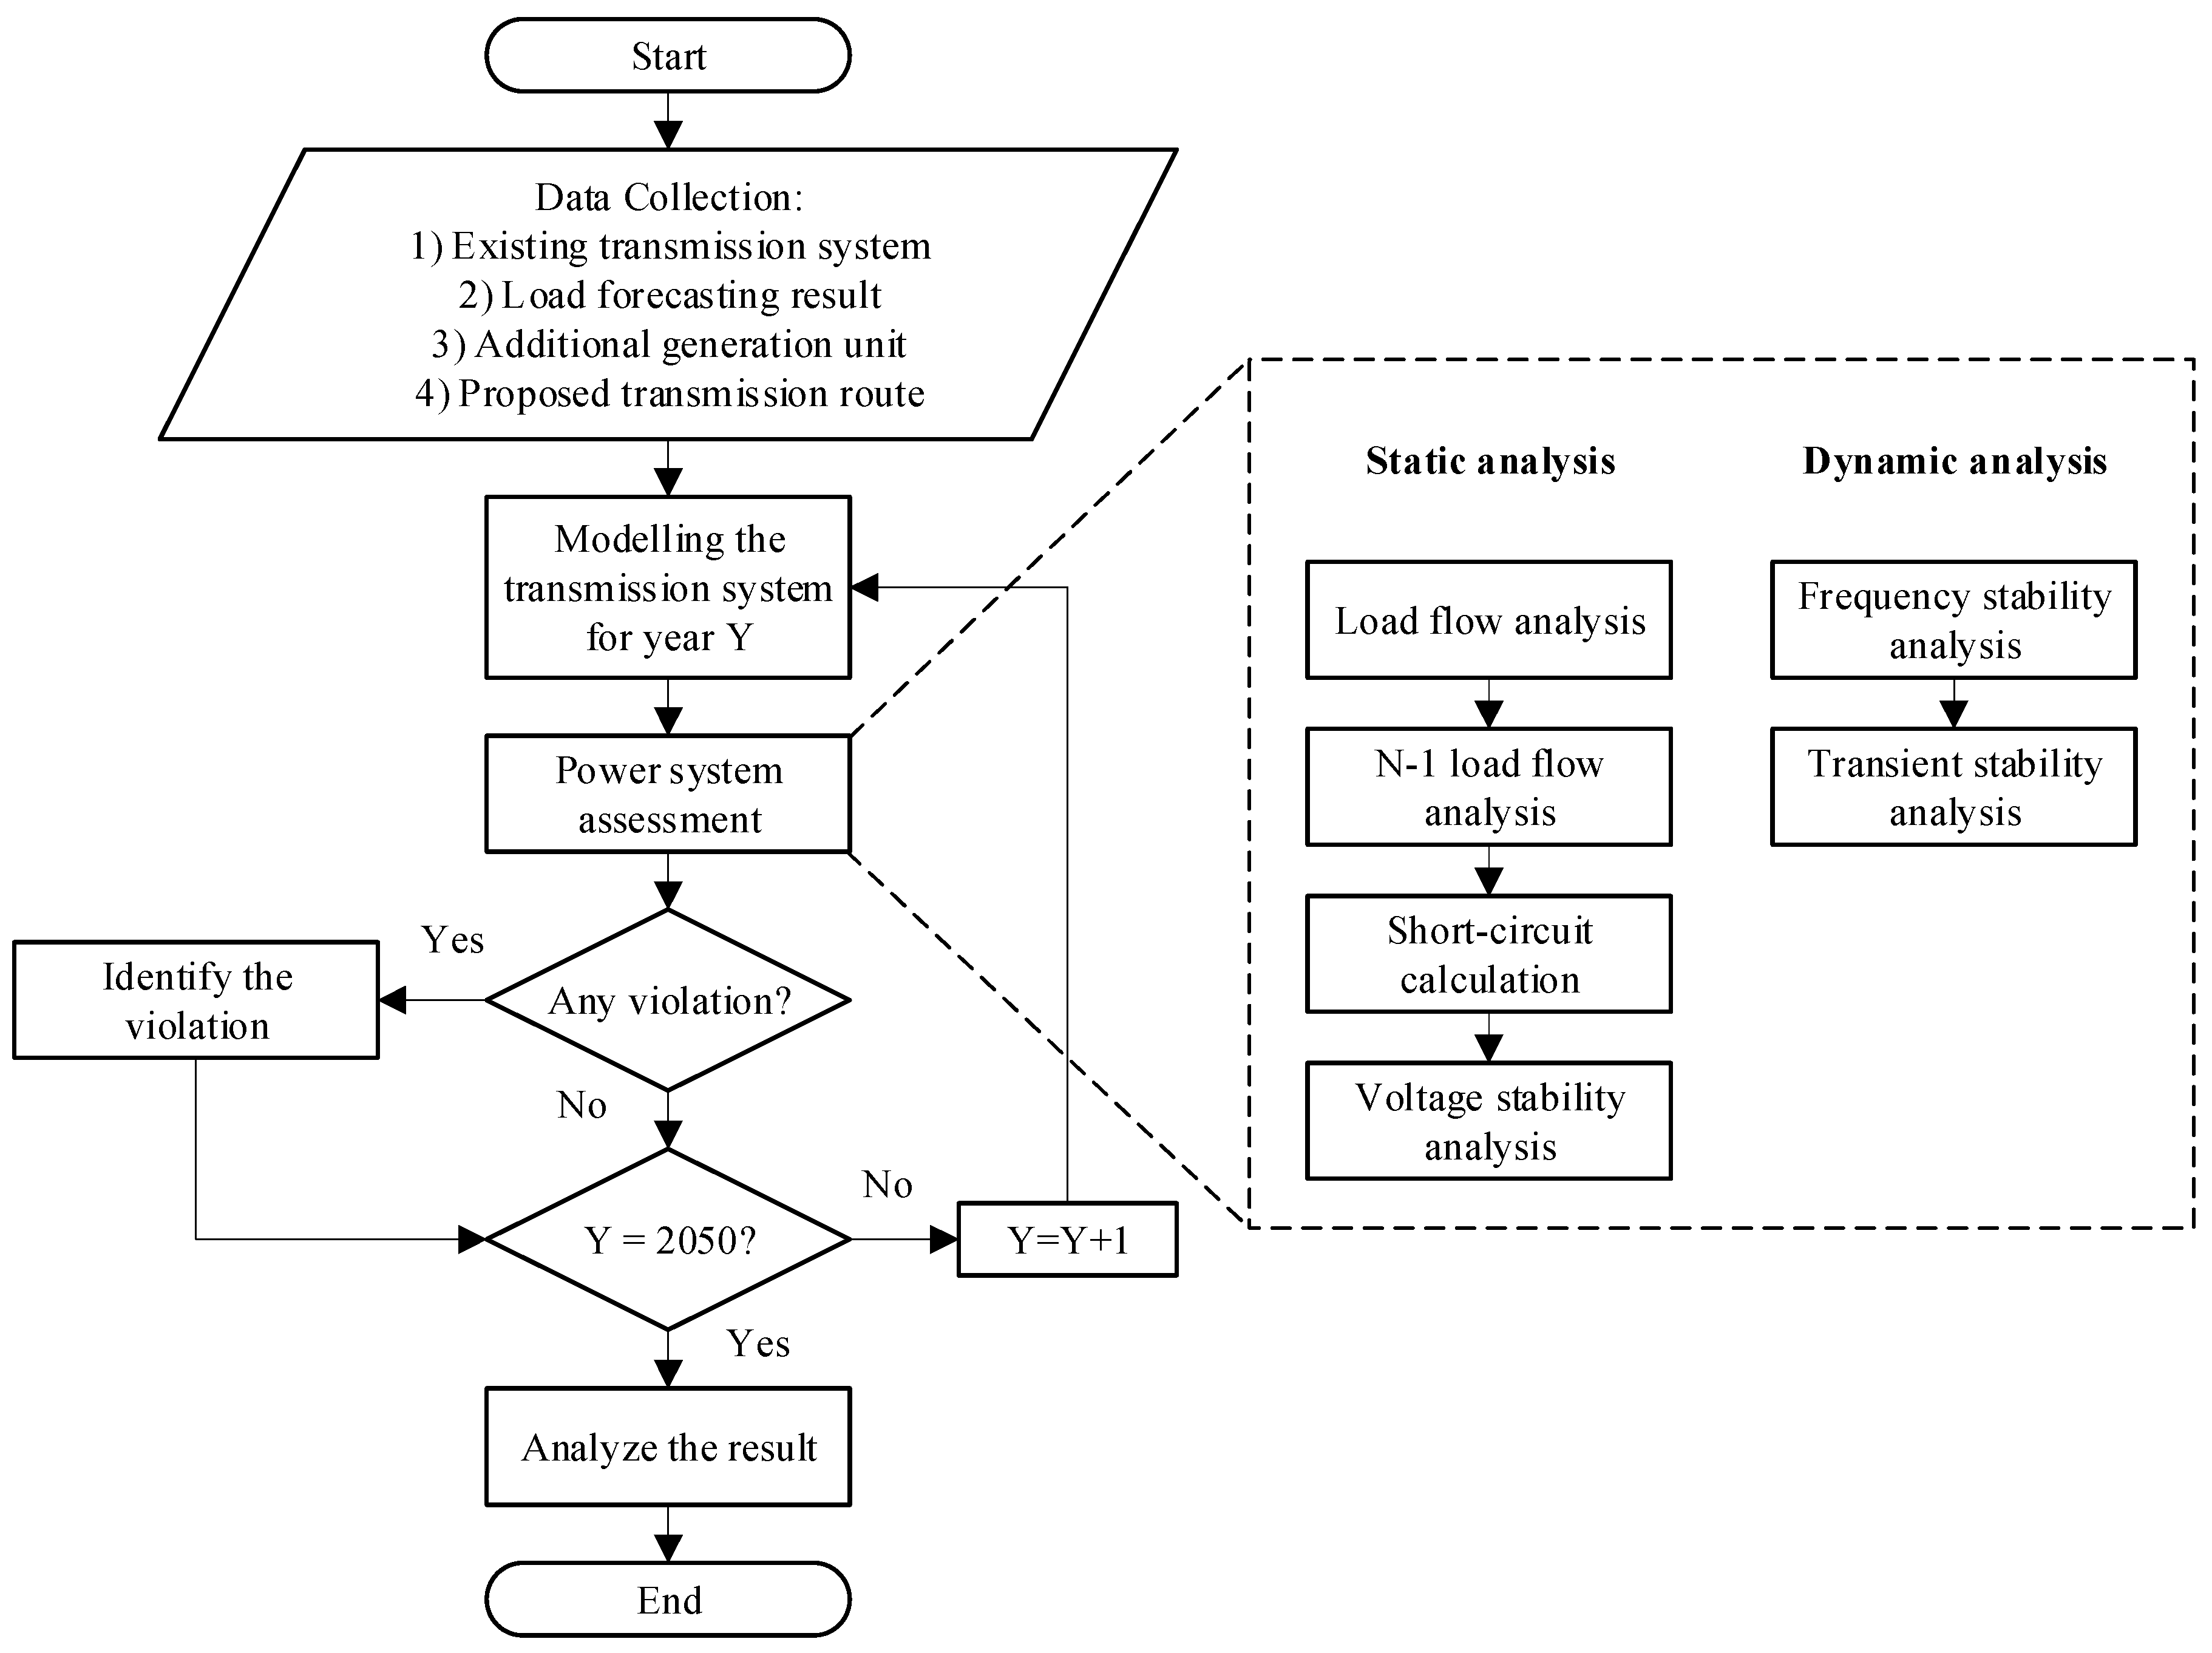
2.2. Transmission Expansion Planning Assessment Method
| Criteria | Allowable Value | |
|---|---|---|
| Normal Operation | N-1 Contingency | |
| Voltage profile | ≥0.9 p.u. and ≤1.05 p.u. | ≥0.9 p.u. and ≤1.05 p.u. |
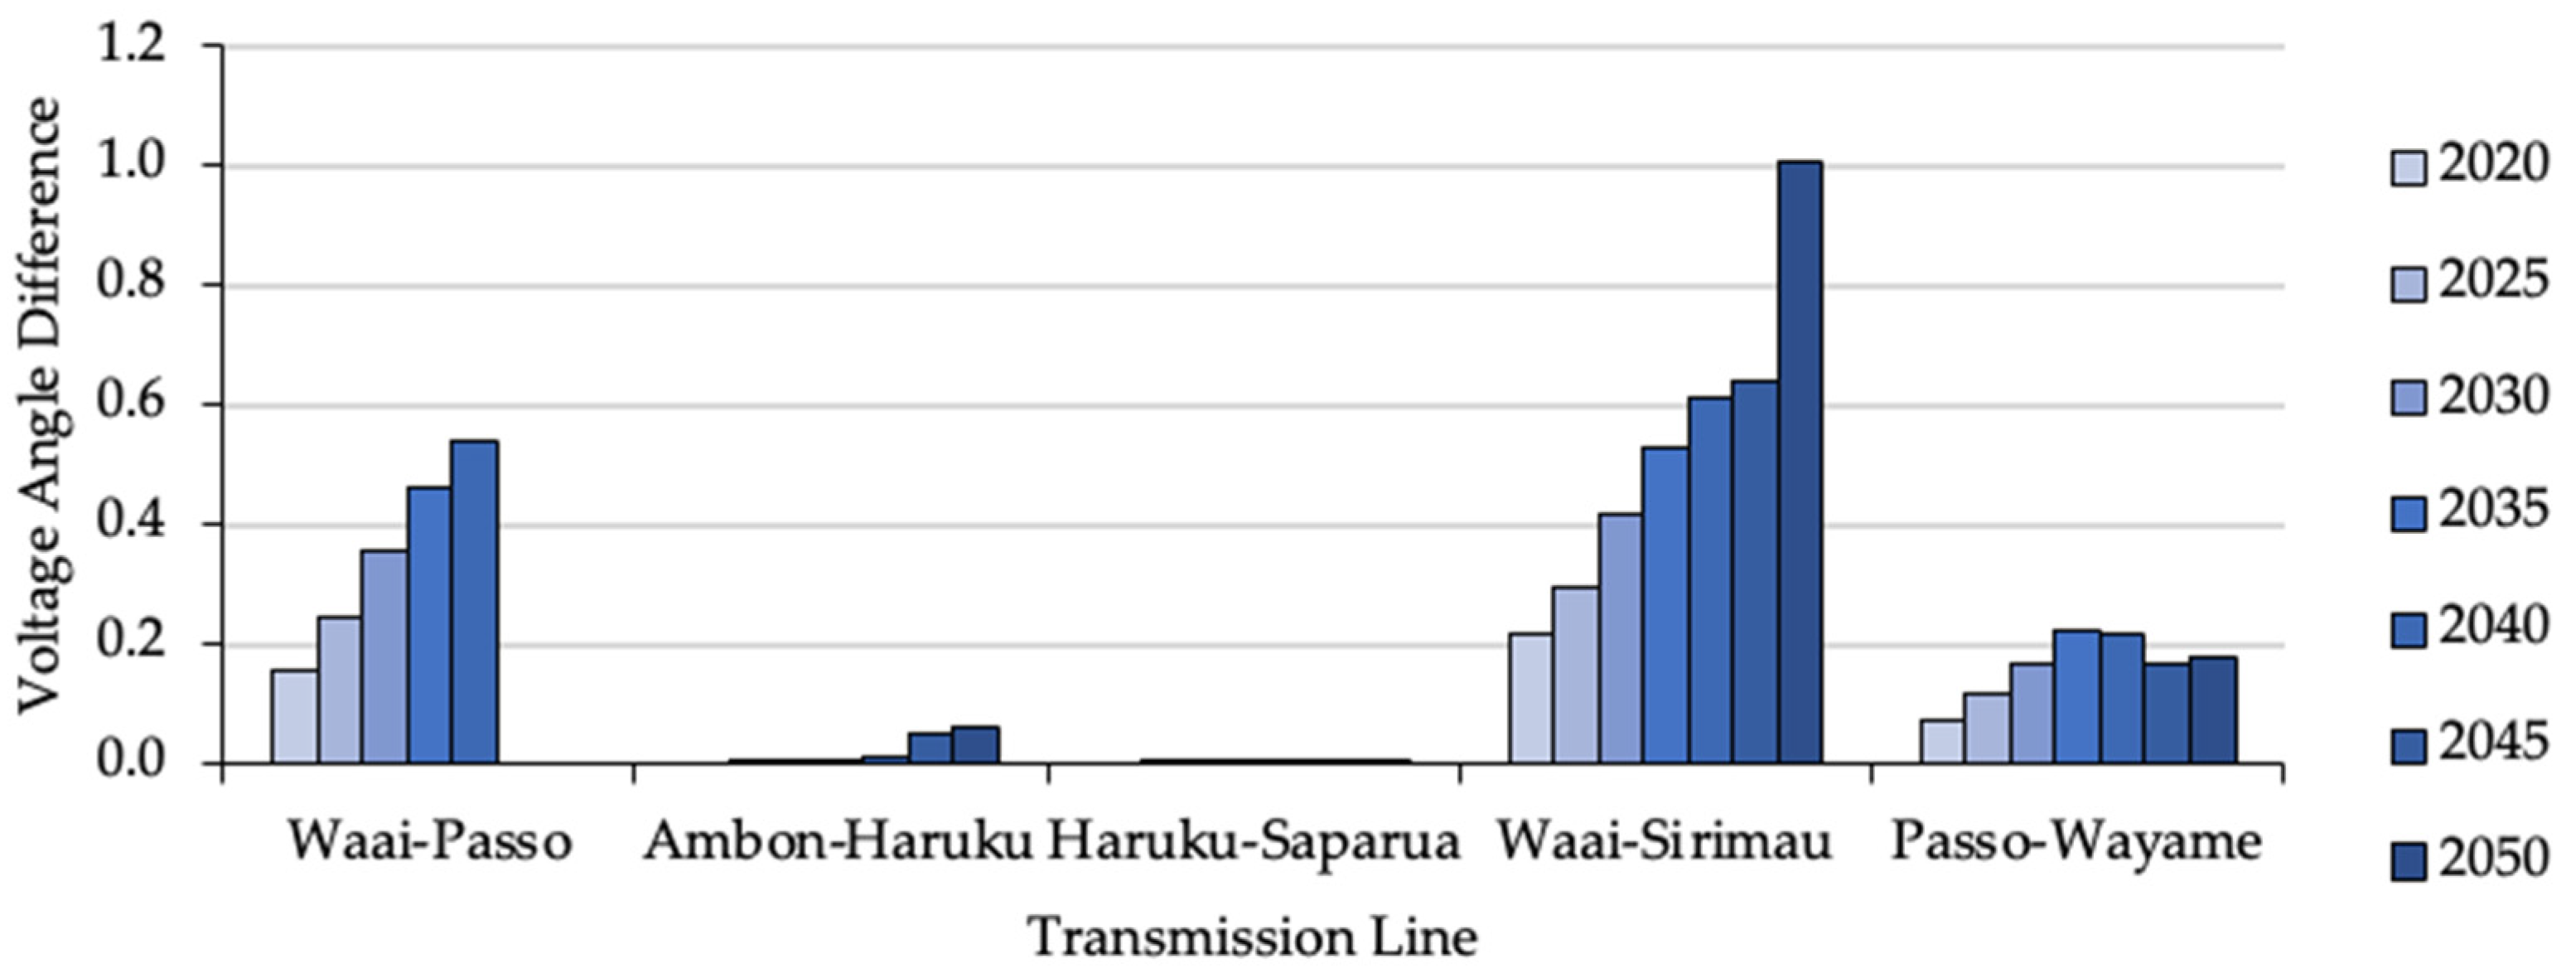
| Voltage angle difference between the substations | ≤30° | ≤30° |
| Loading of the transformer and transmission line | ≤80% | ≤100% |
| Voltage Level (kV) | Short-Circuit Current (kA) |
|---|---|
| 70 | ≤20 |
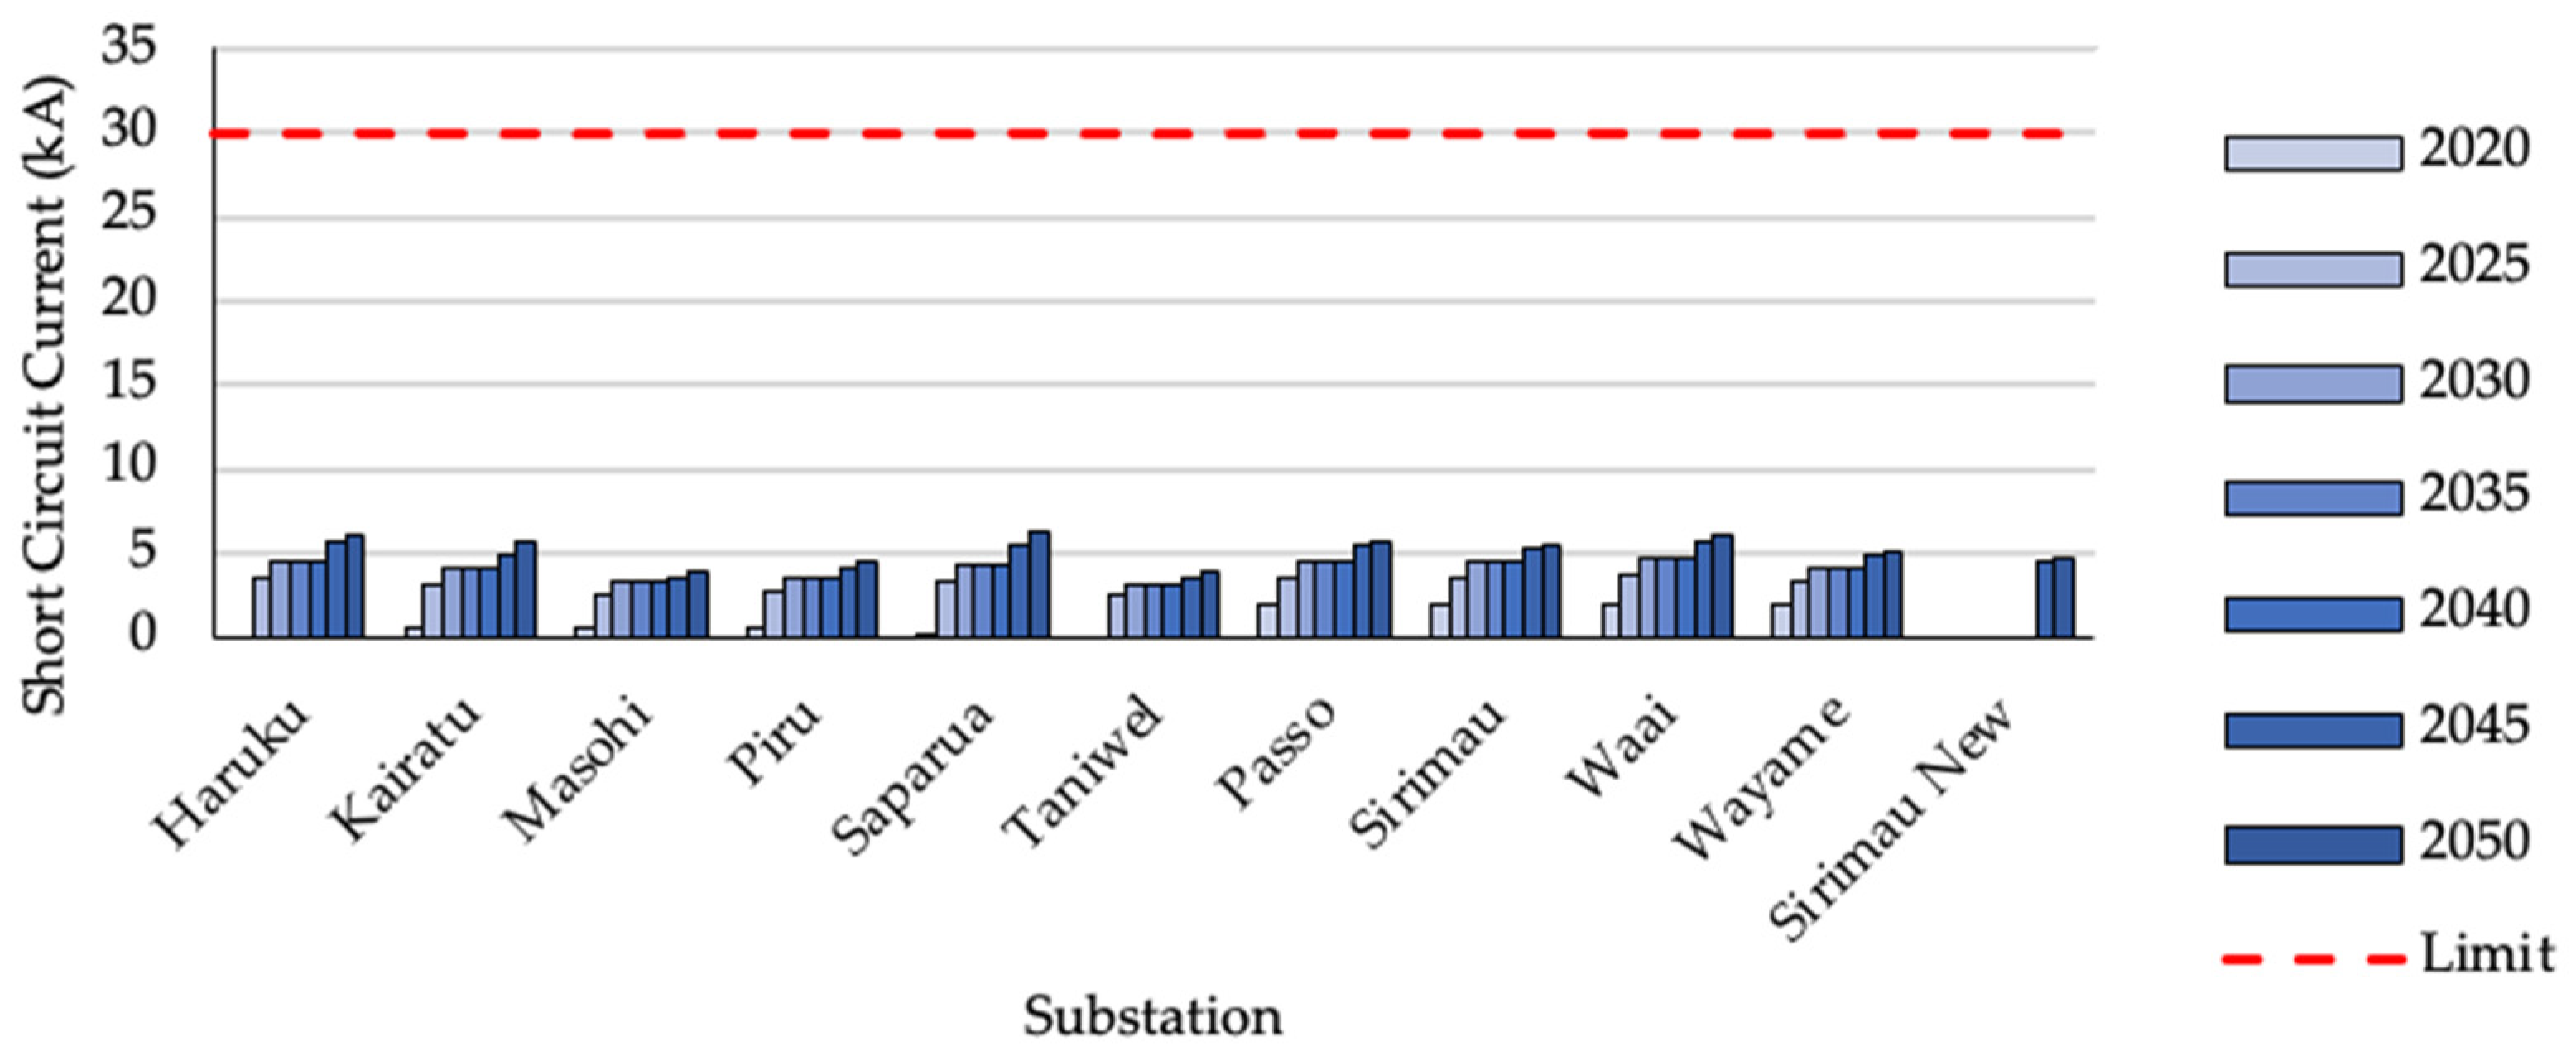
| 150 | ≤30 |
3. Simulation’s Set-Up
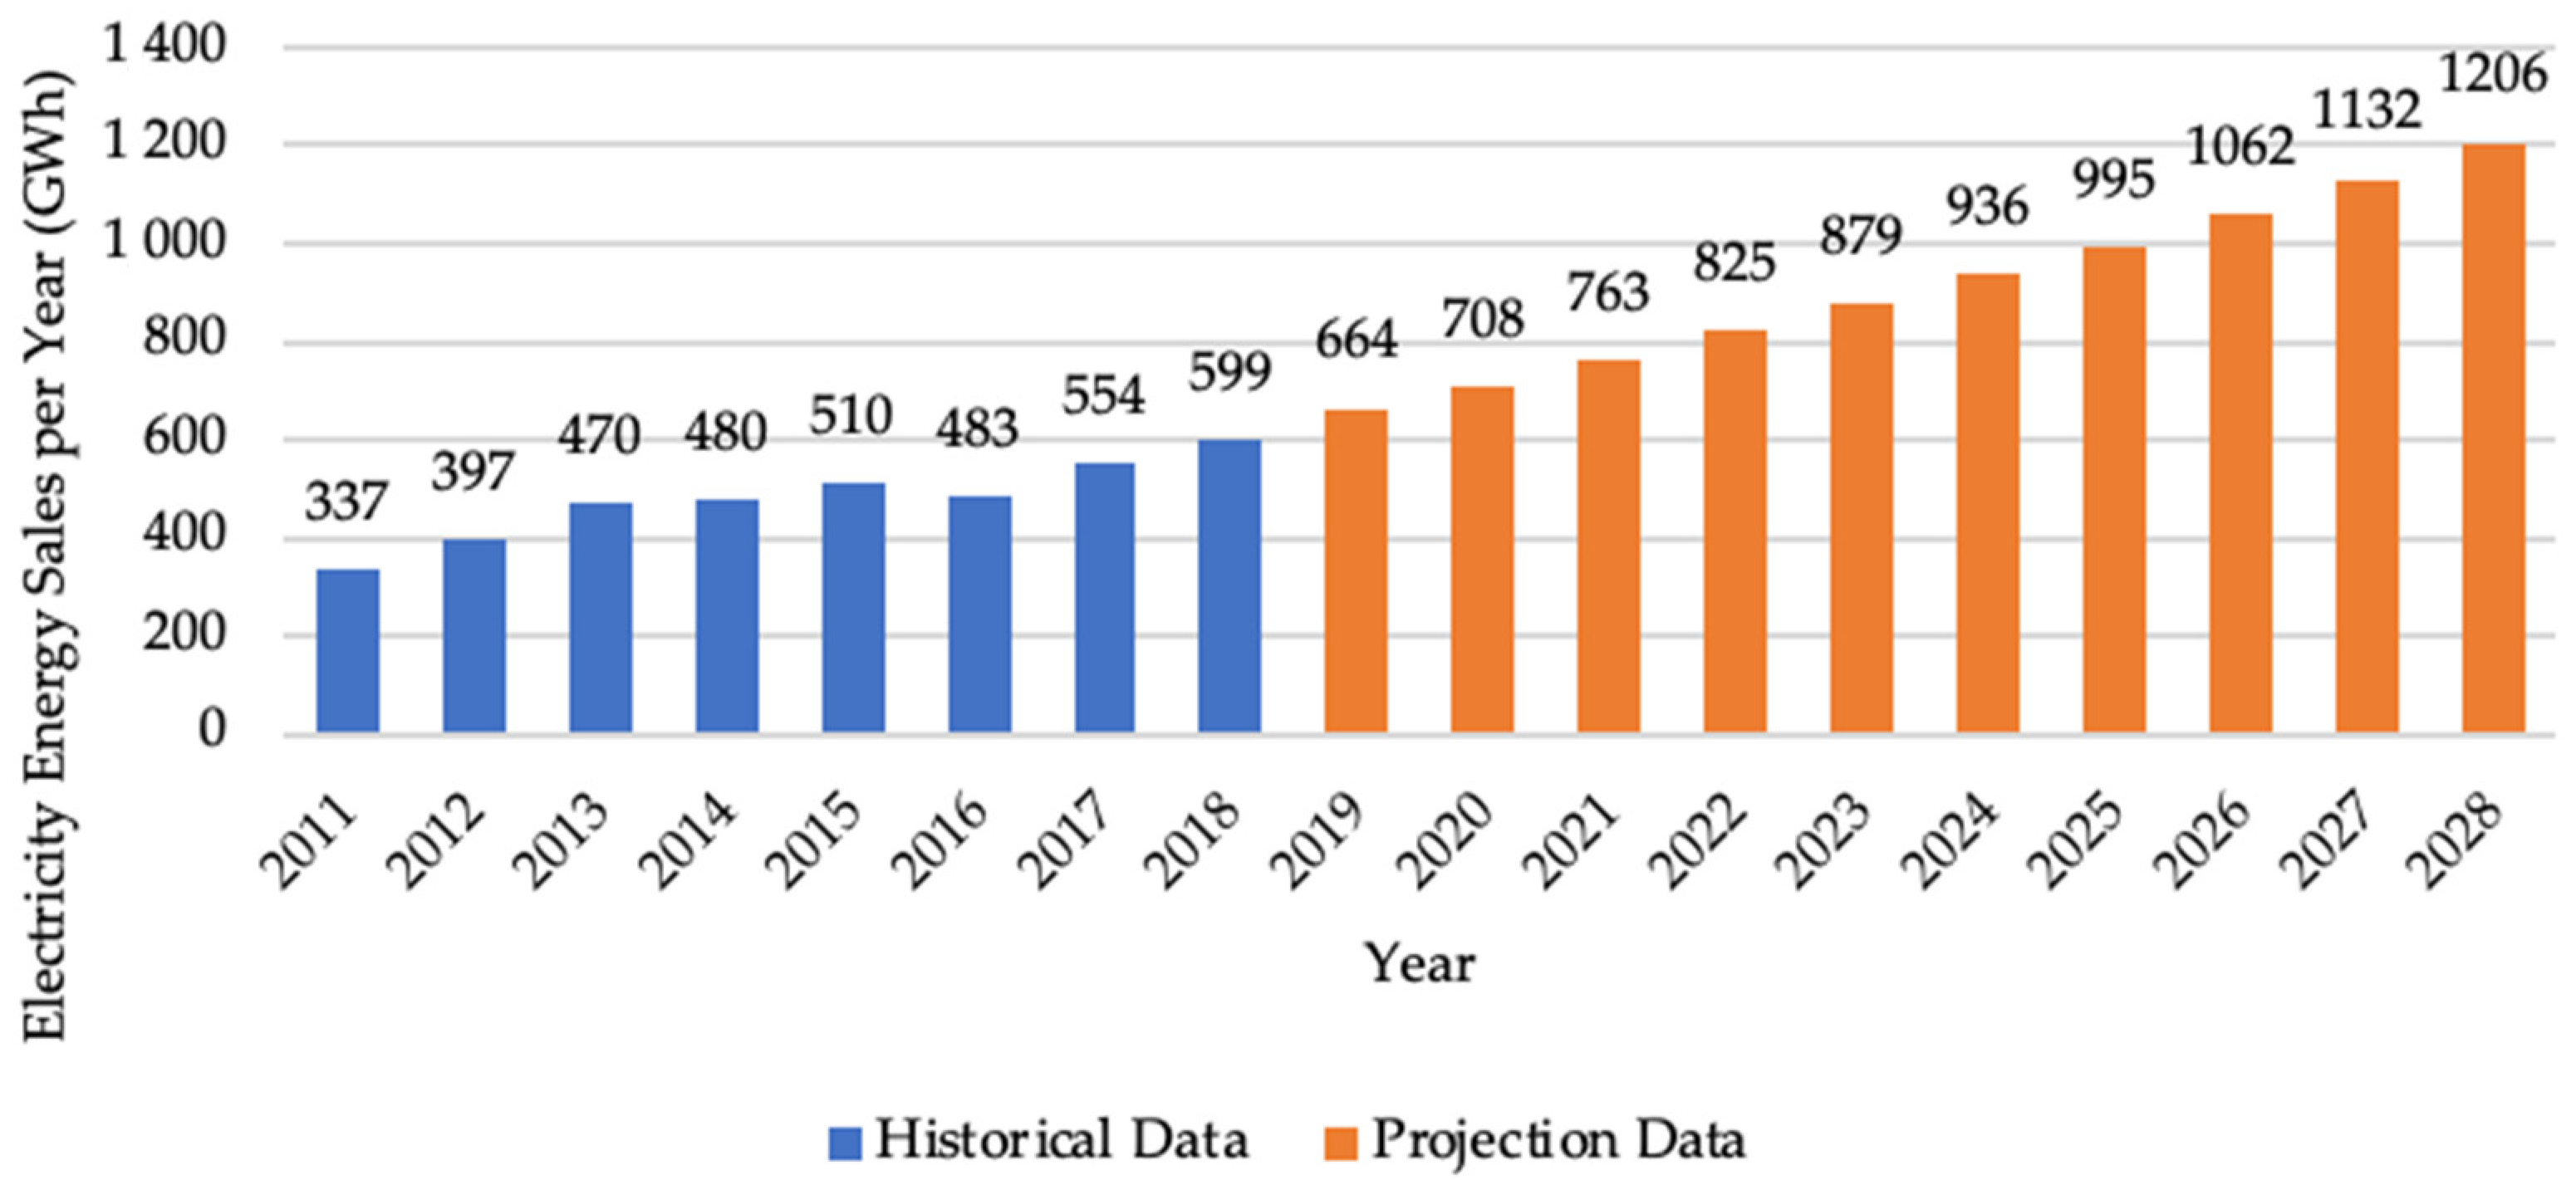
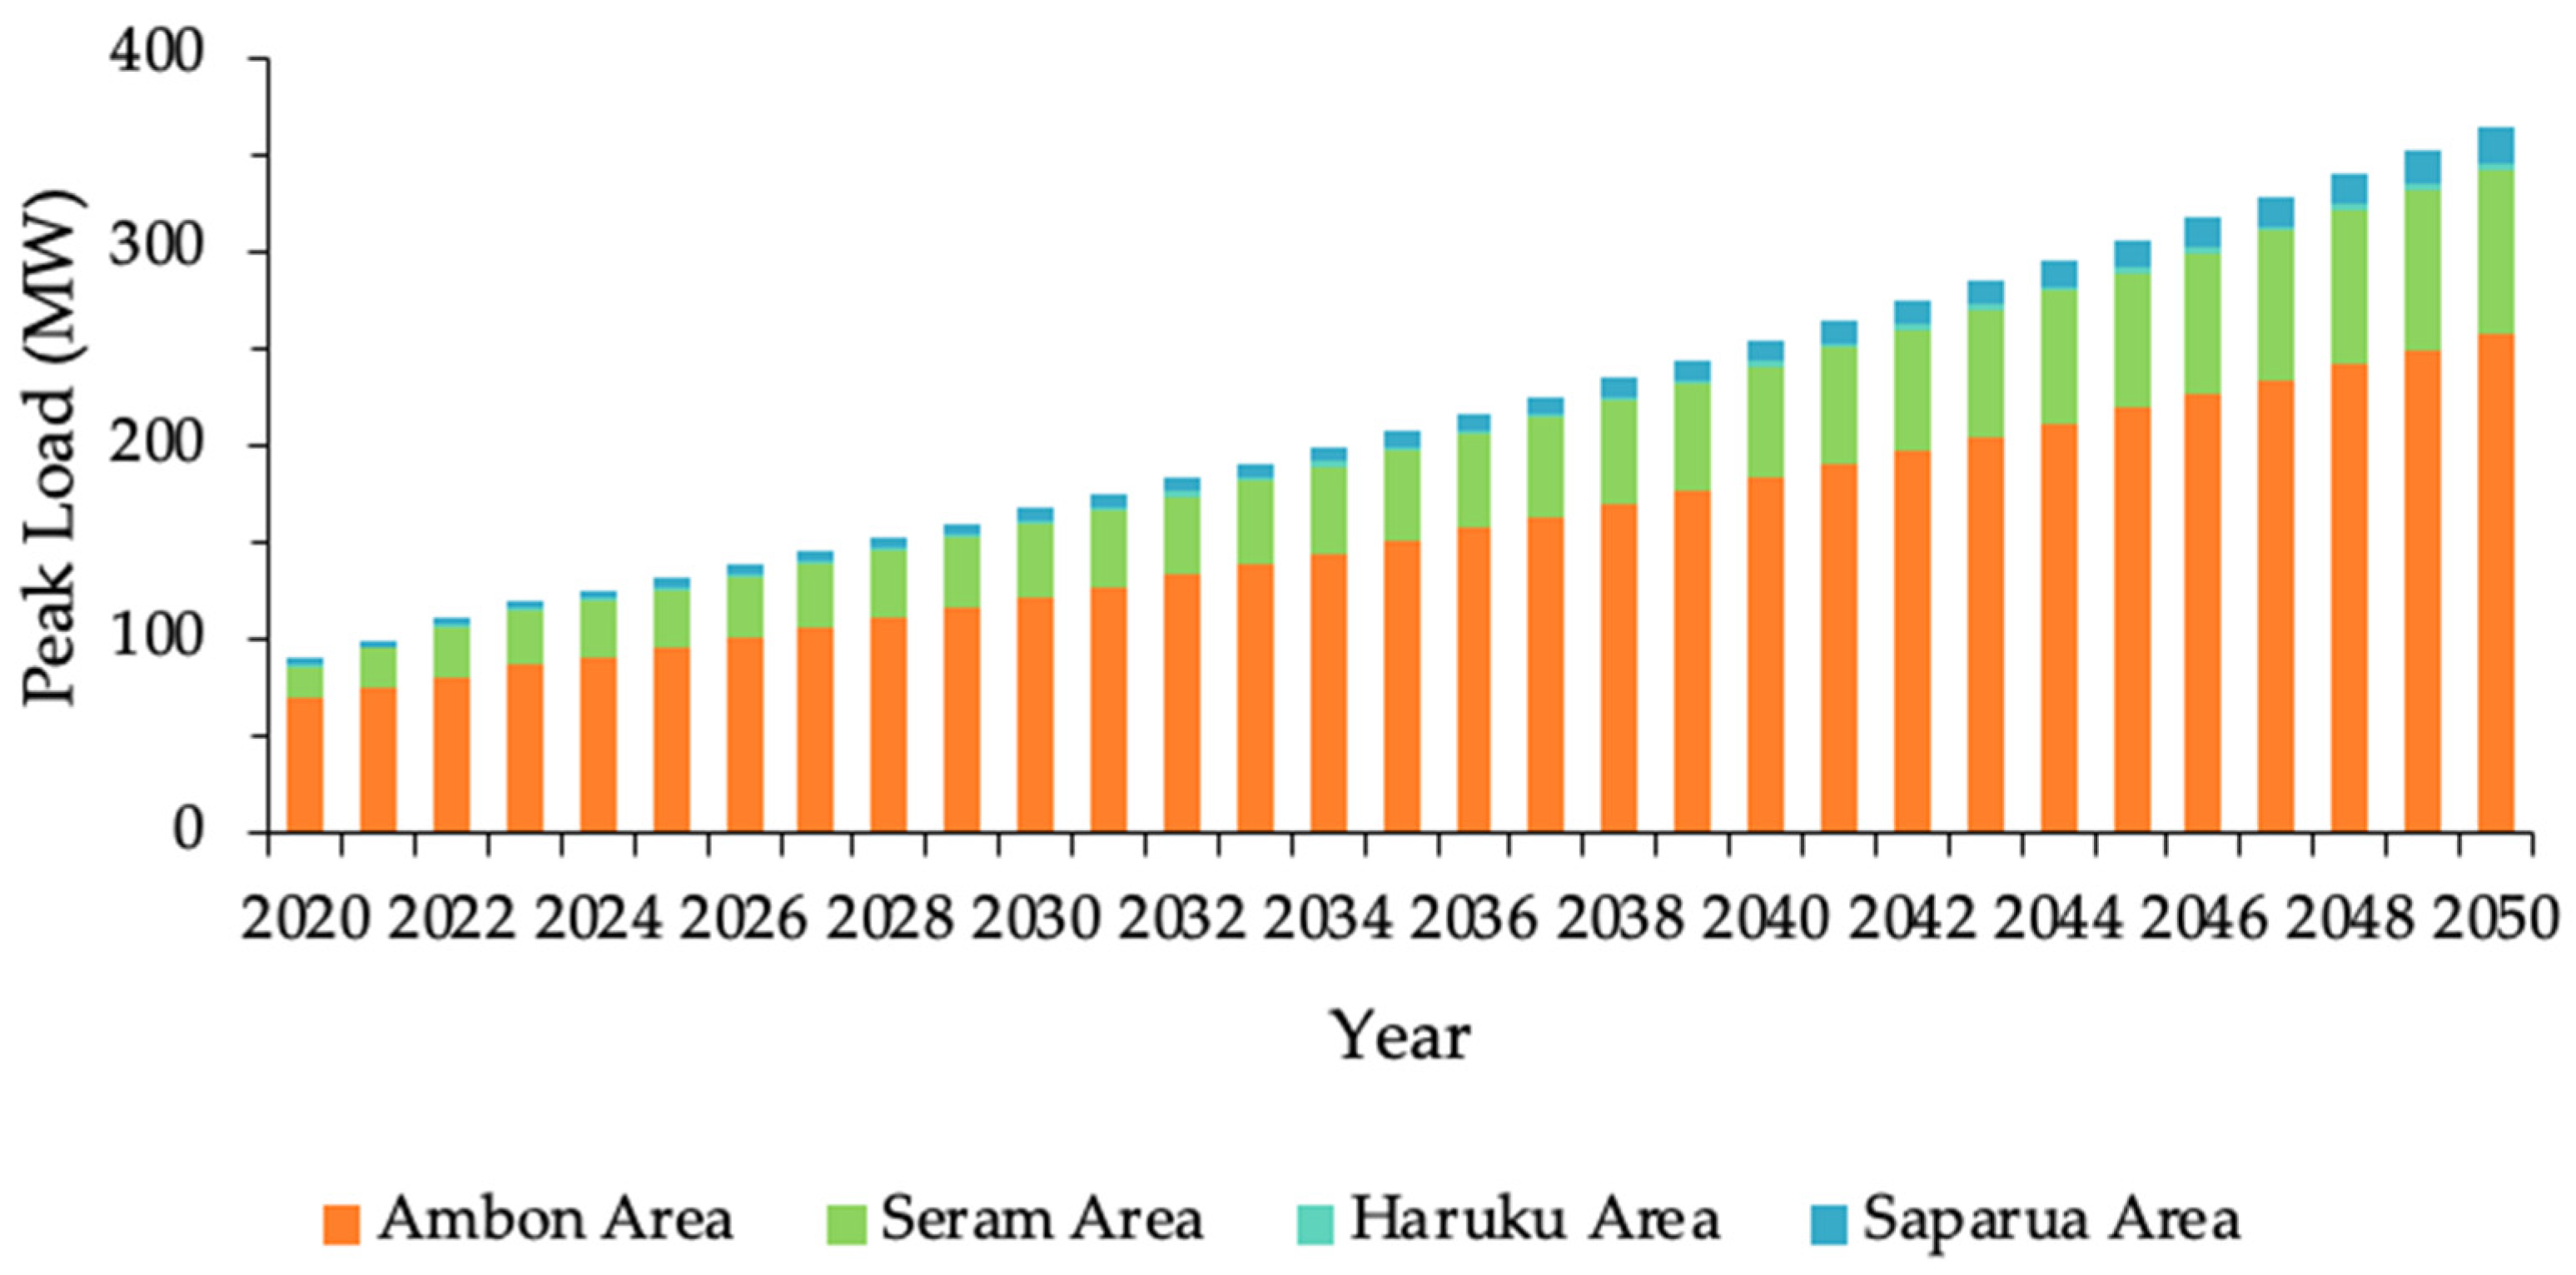
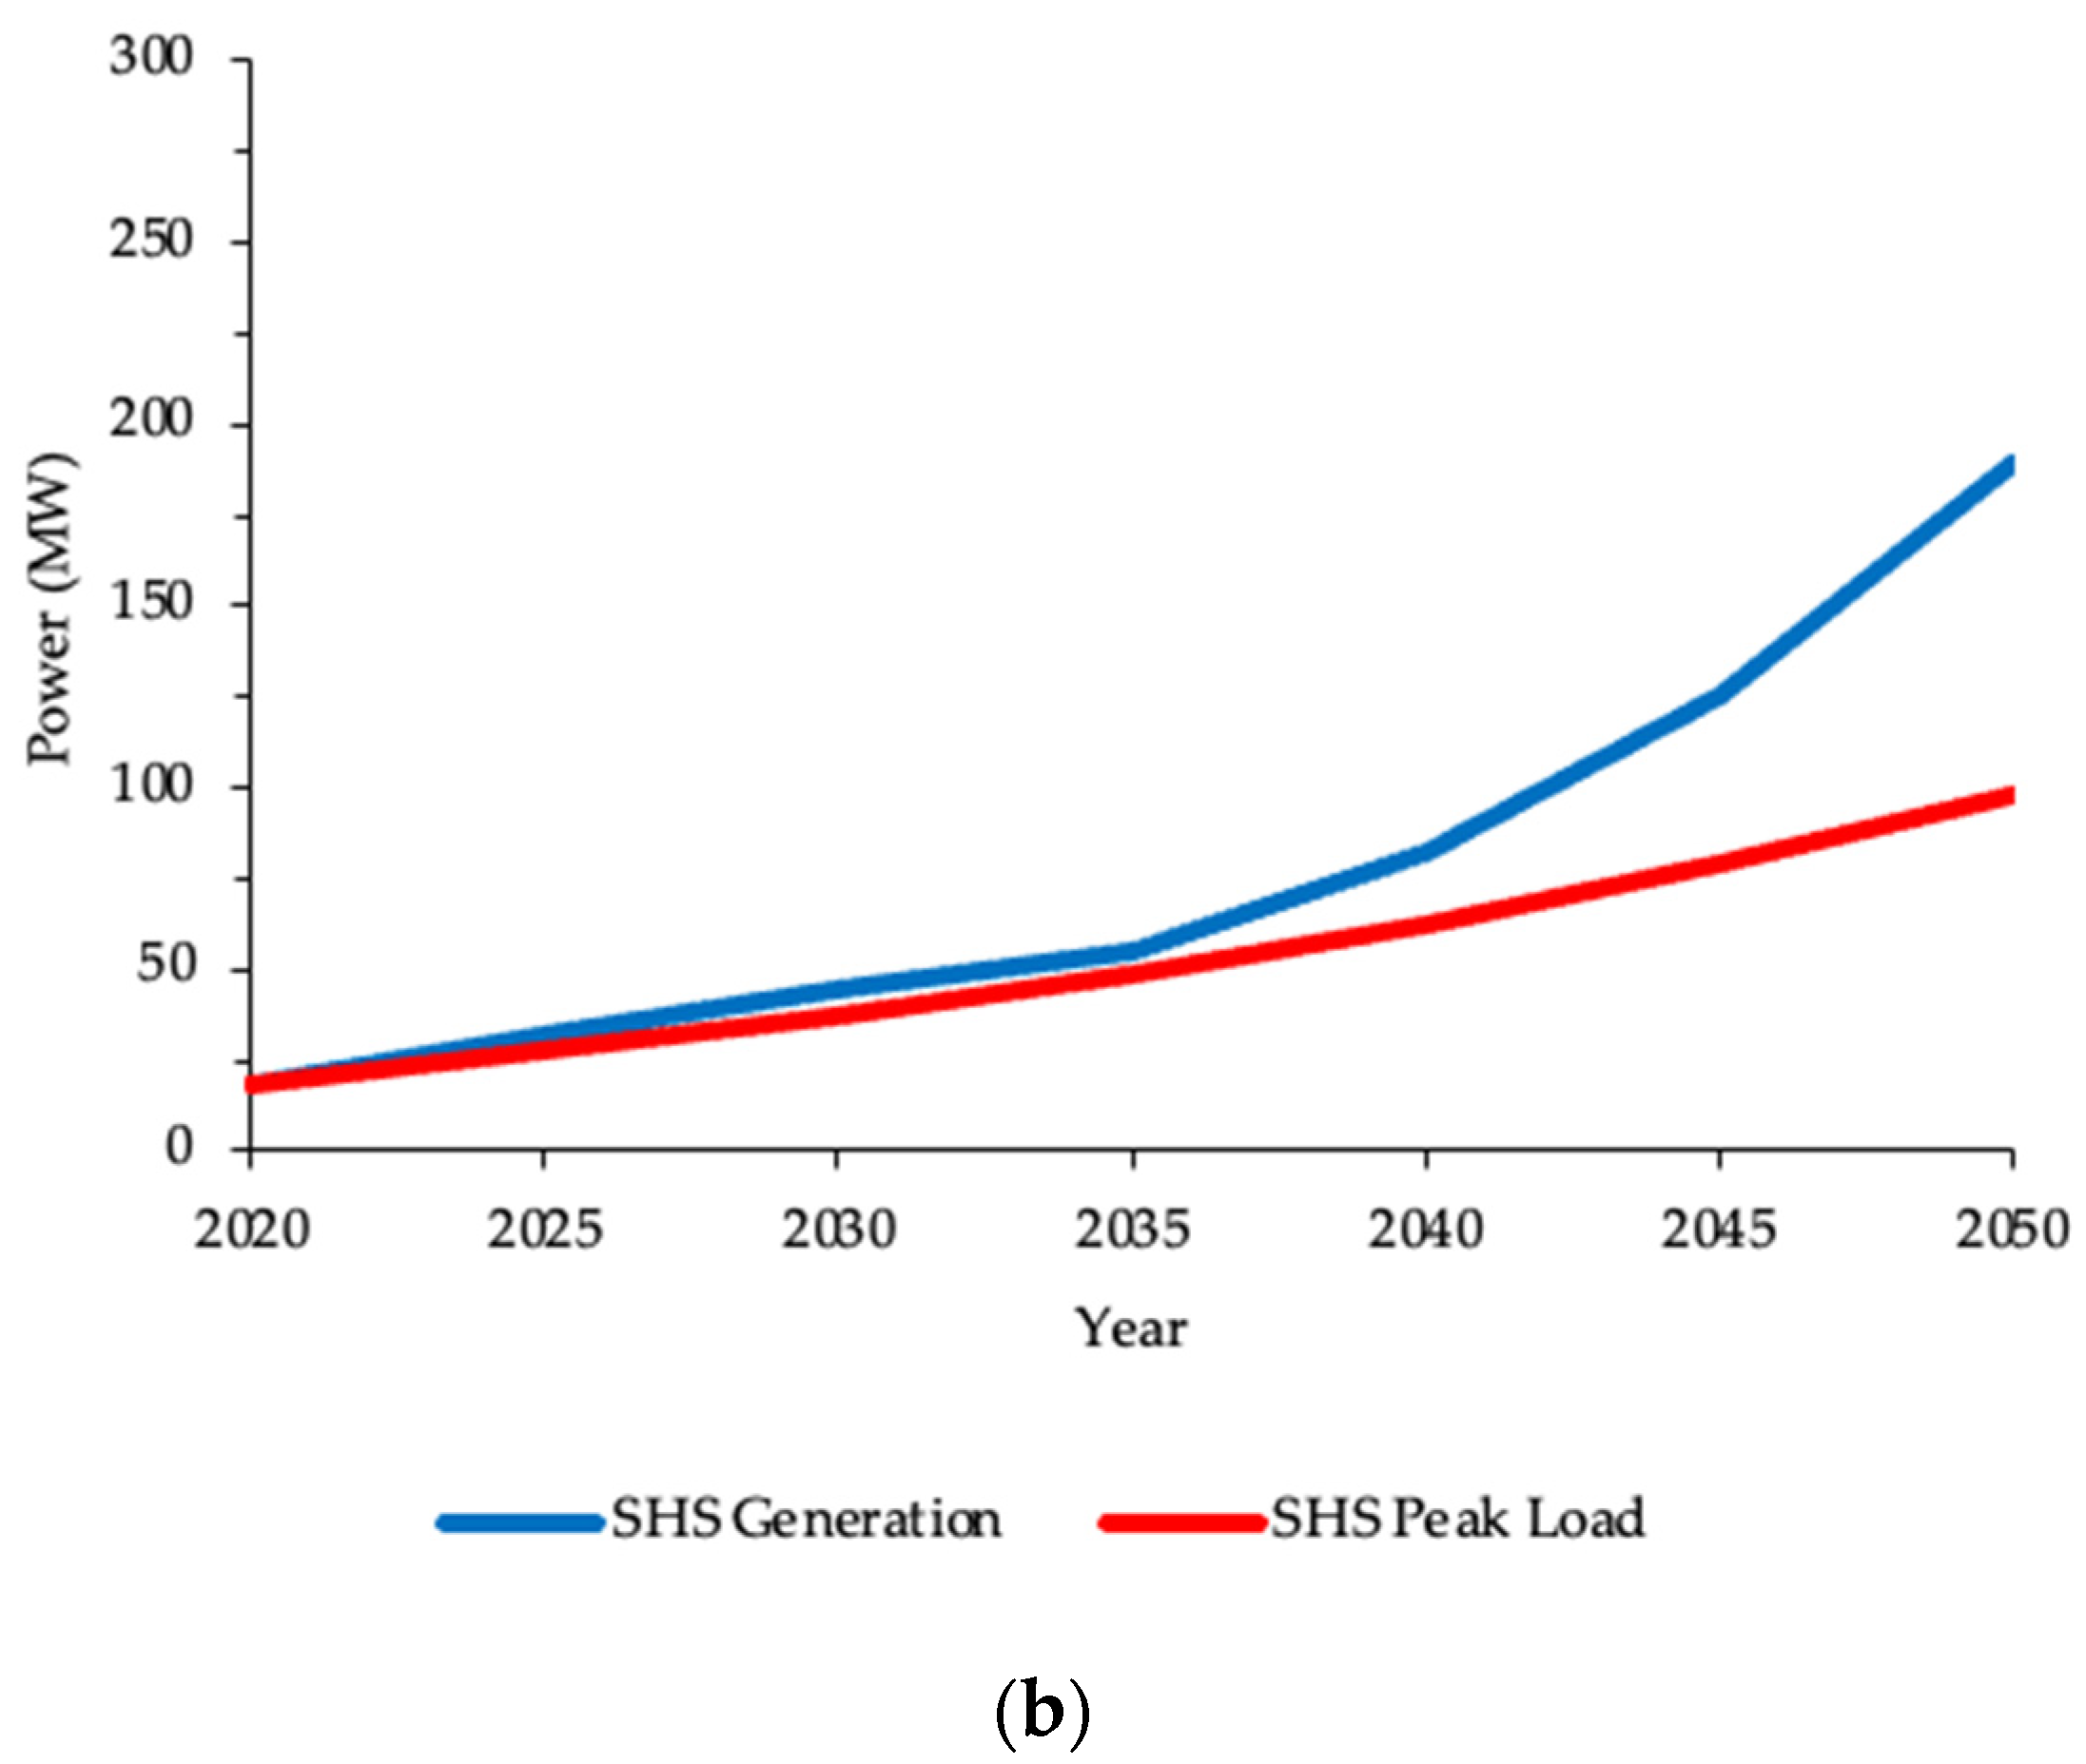
3.1. Load Forecasting Projection
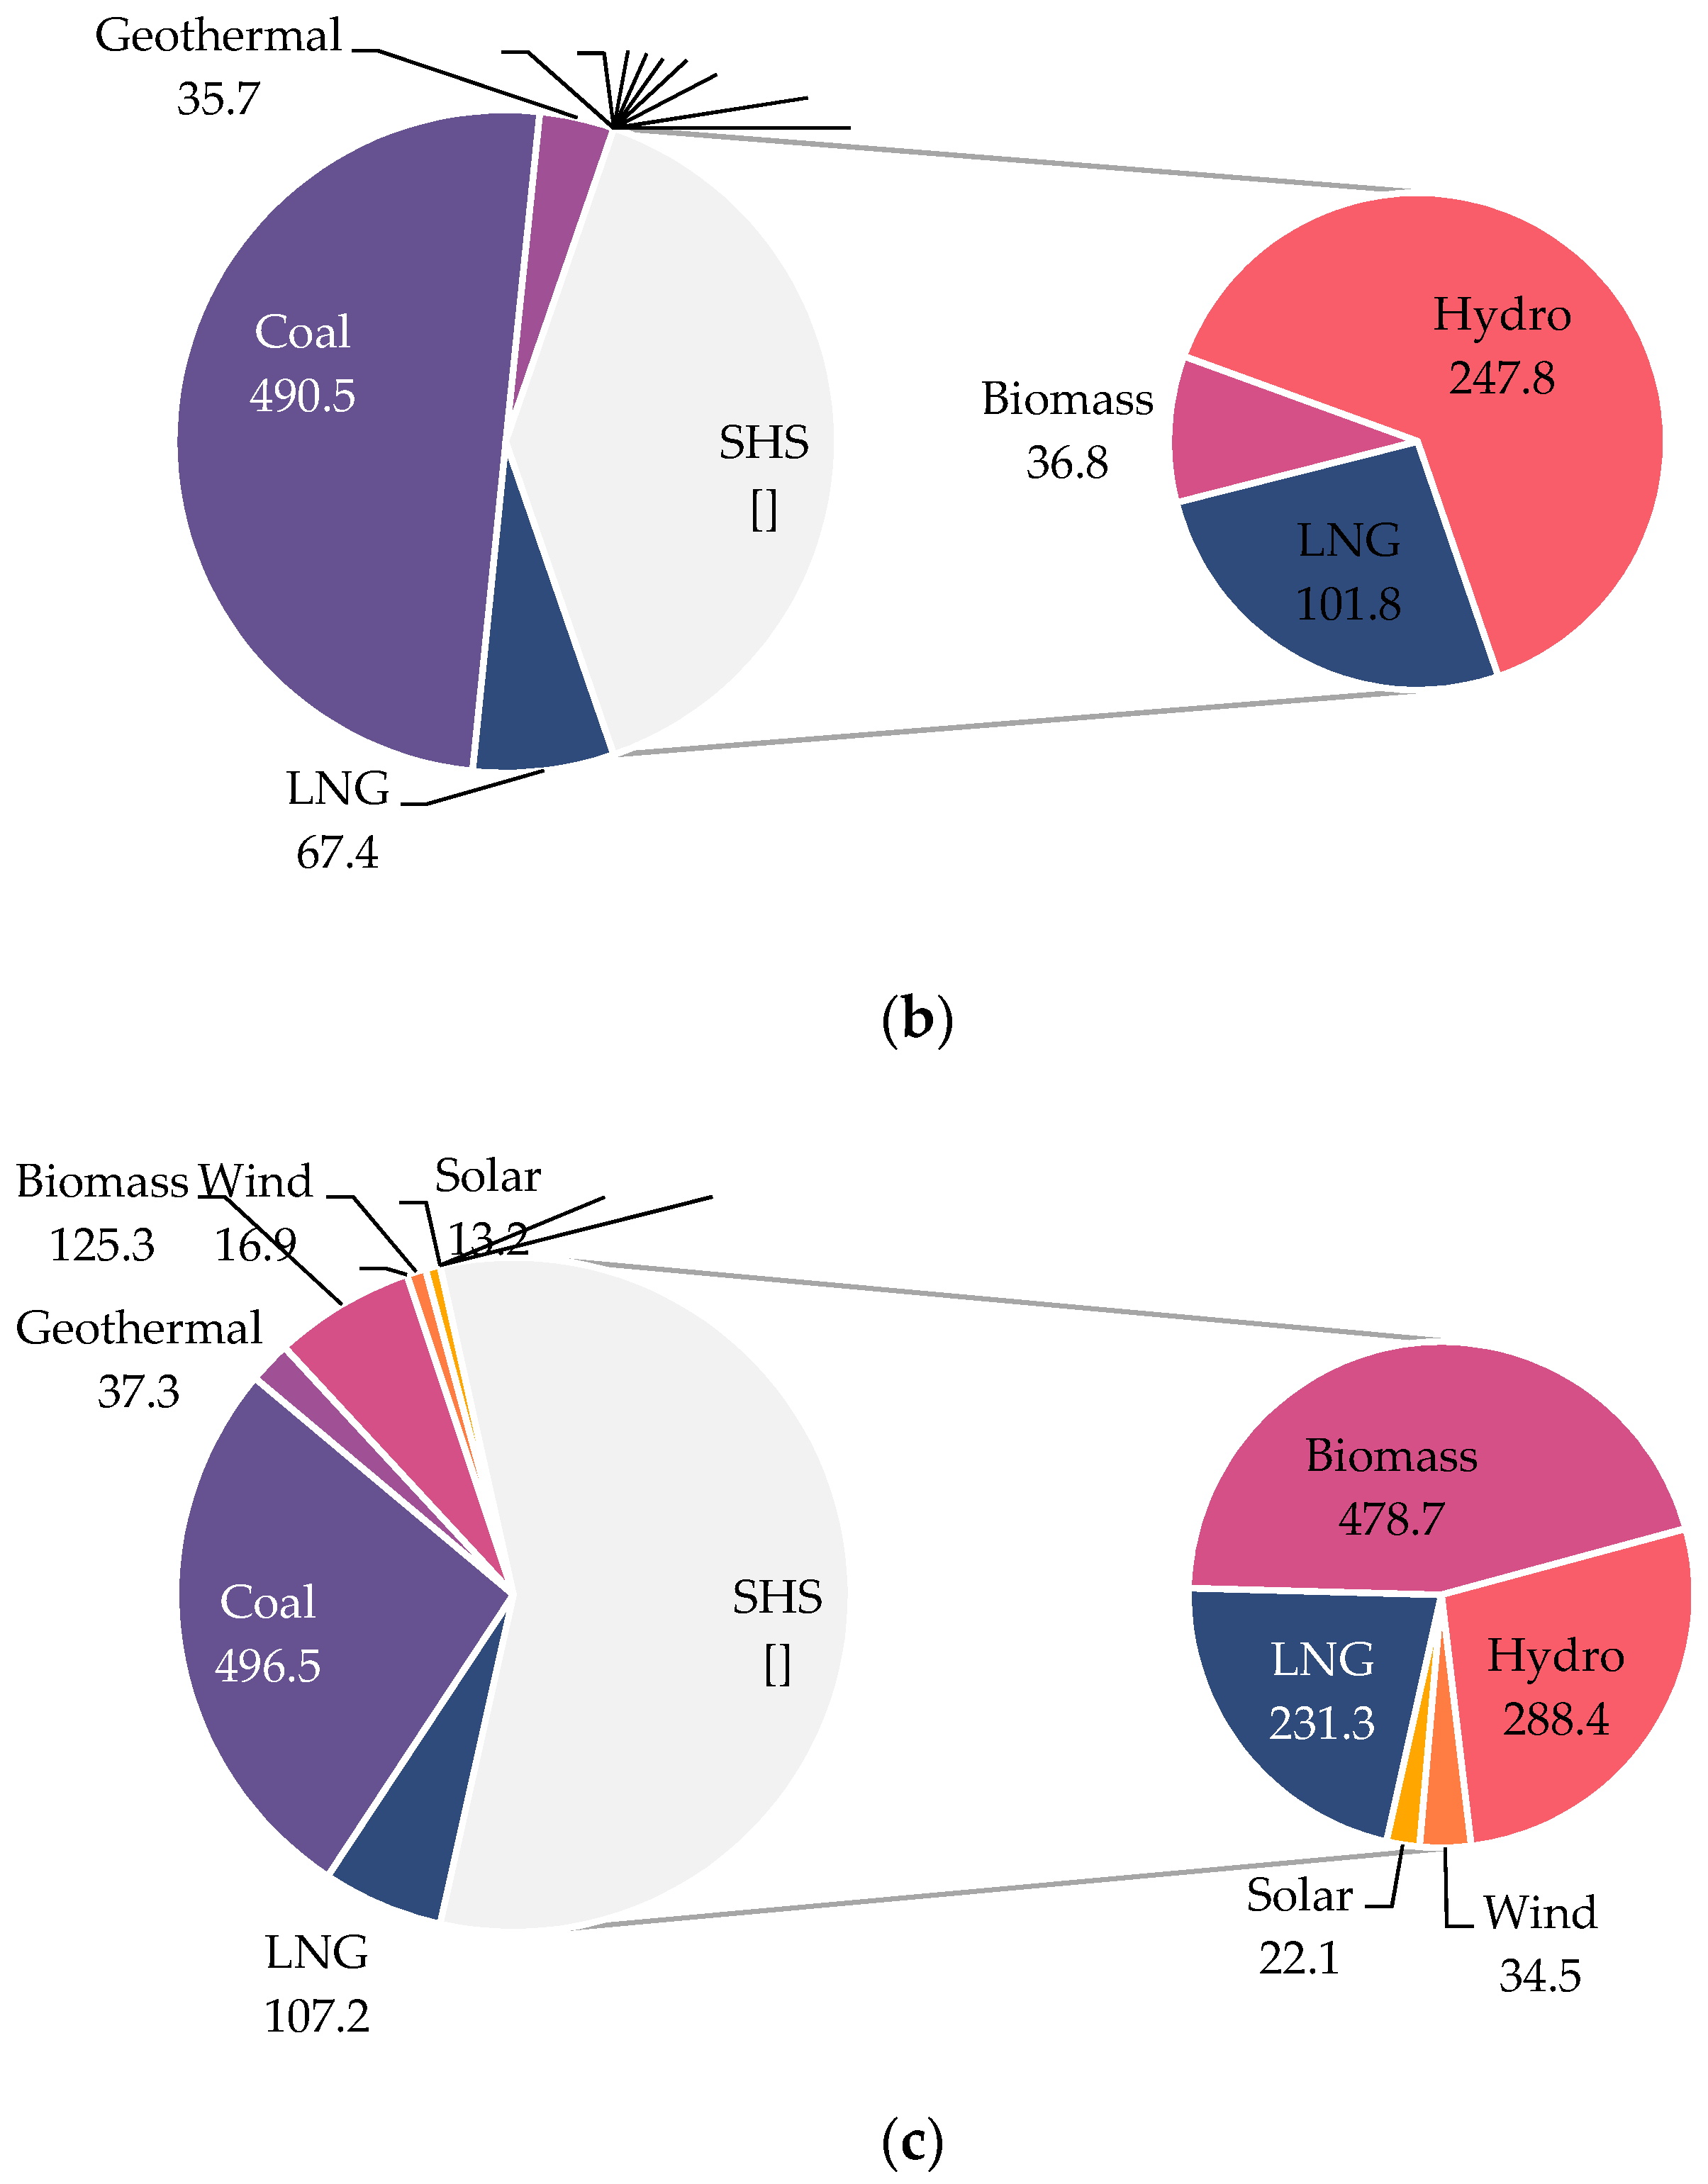
3.2. Generating Unit Candidates
3.3. Transmission Line and Interconnection Candidates
4. Results and Discussion
4.1. Effect of the Interconnection
4.2. Evaluation of The Proposed Power System Planning
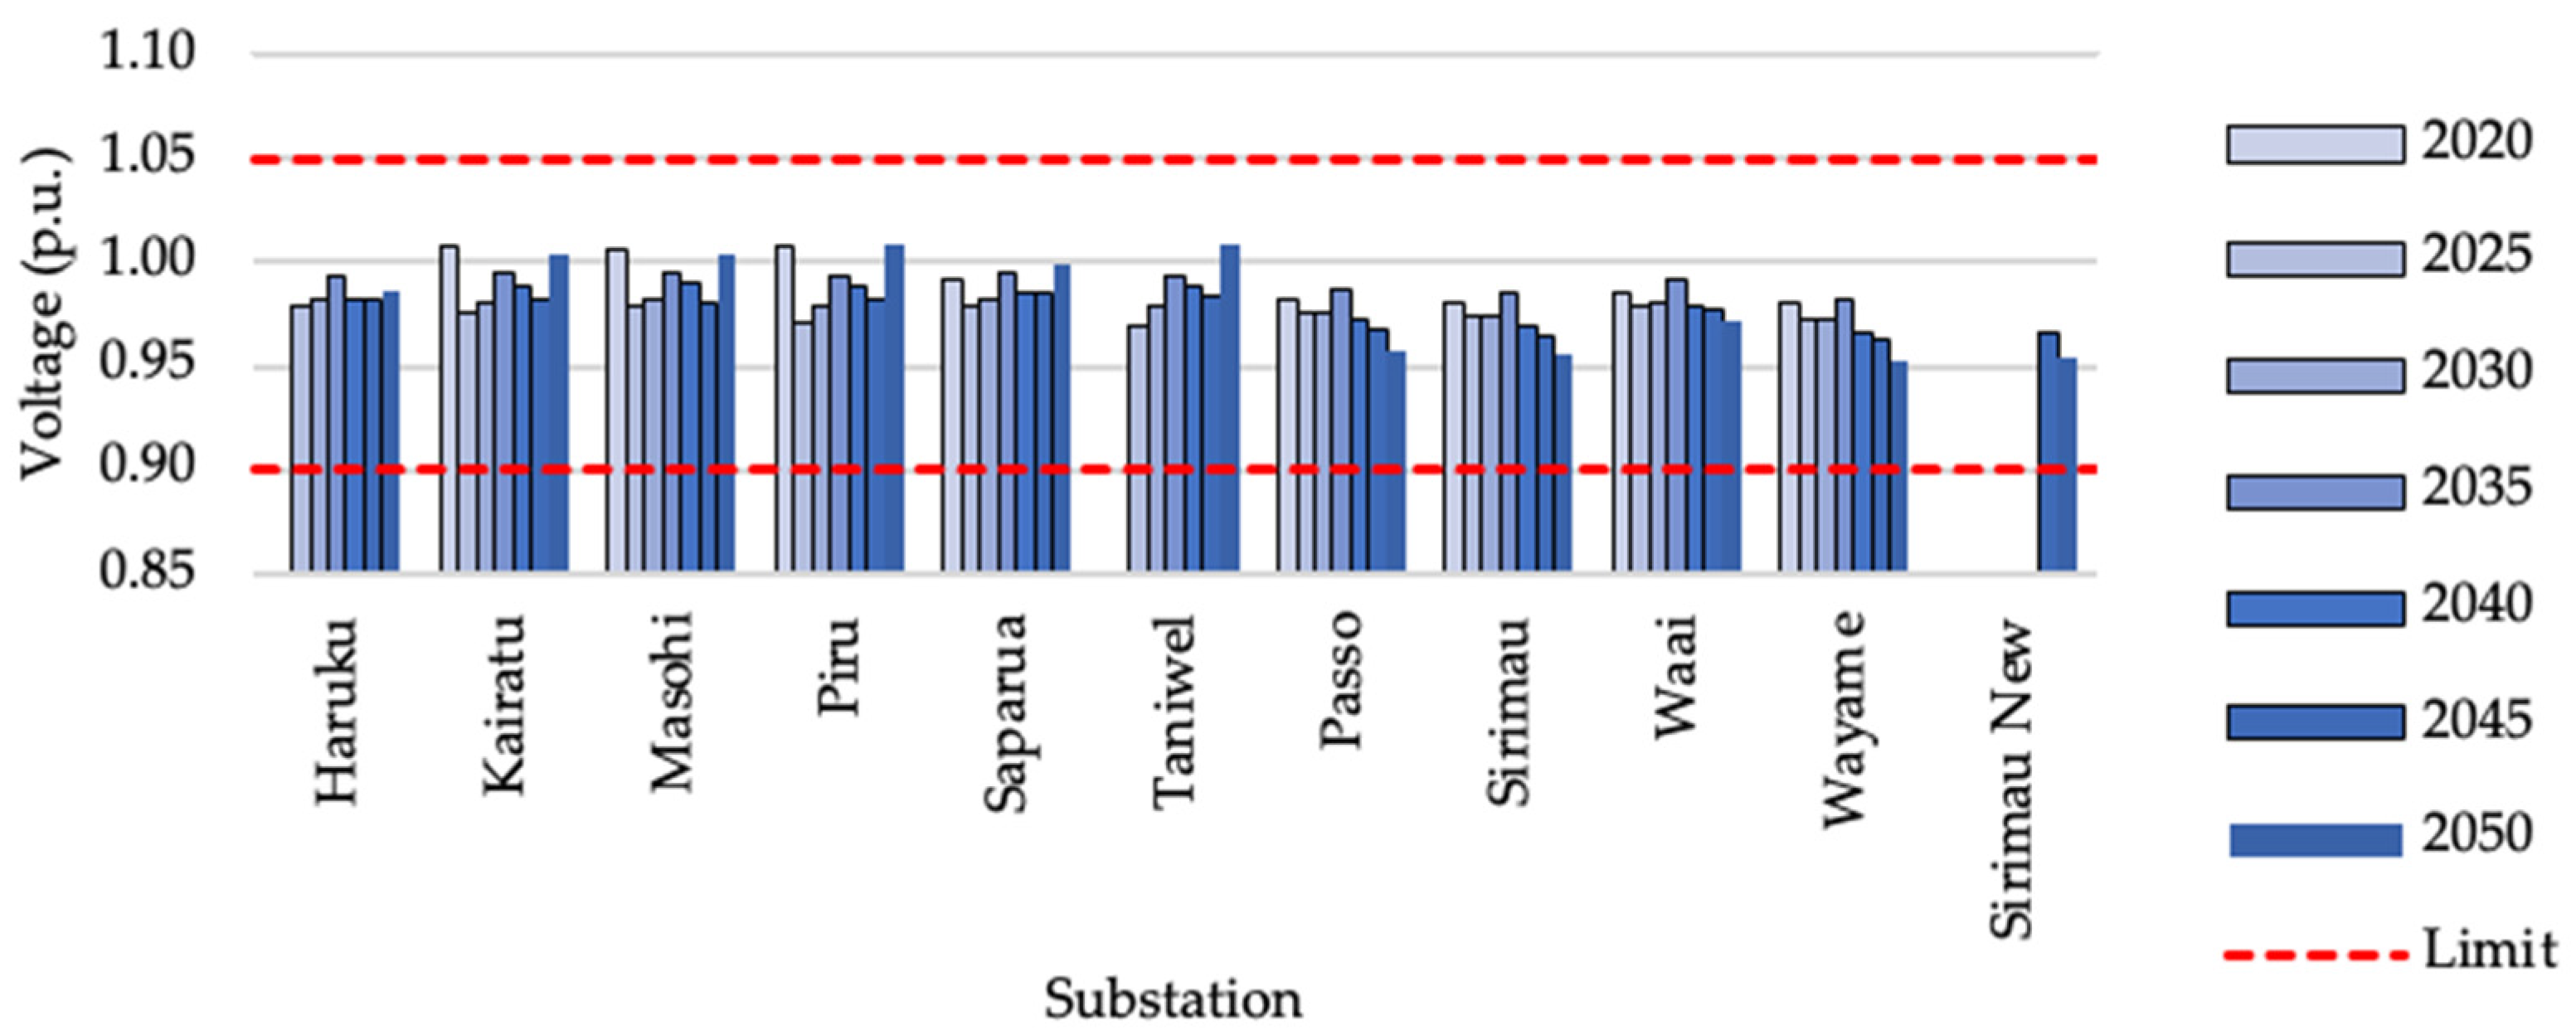
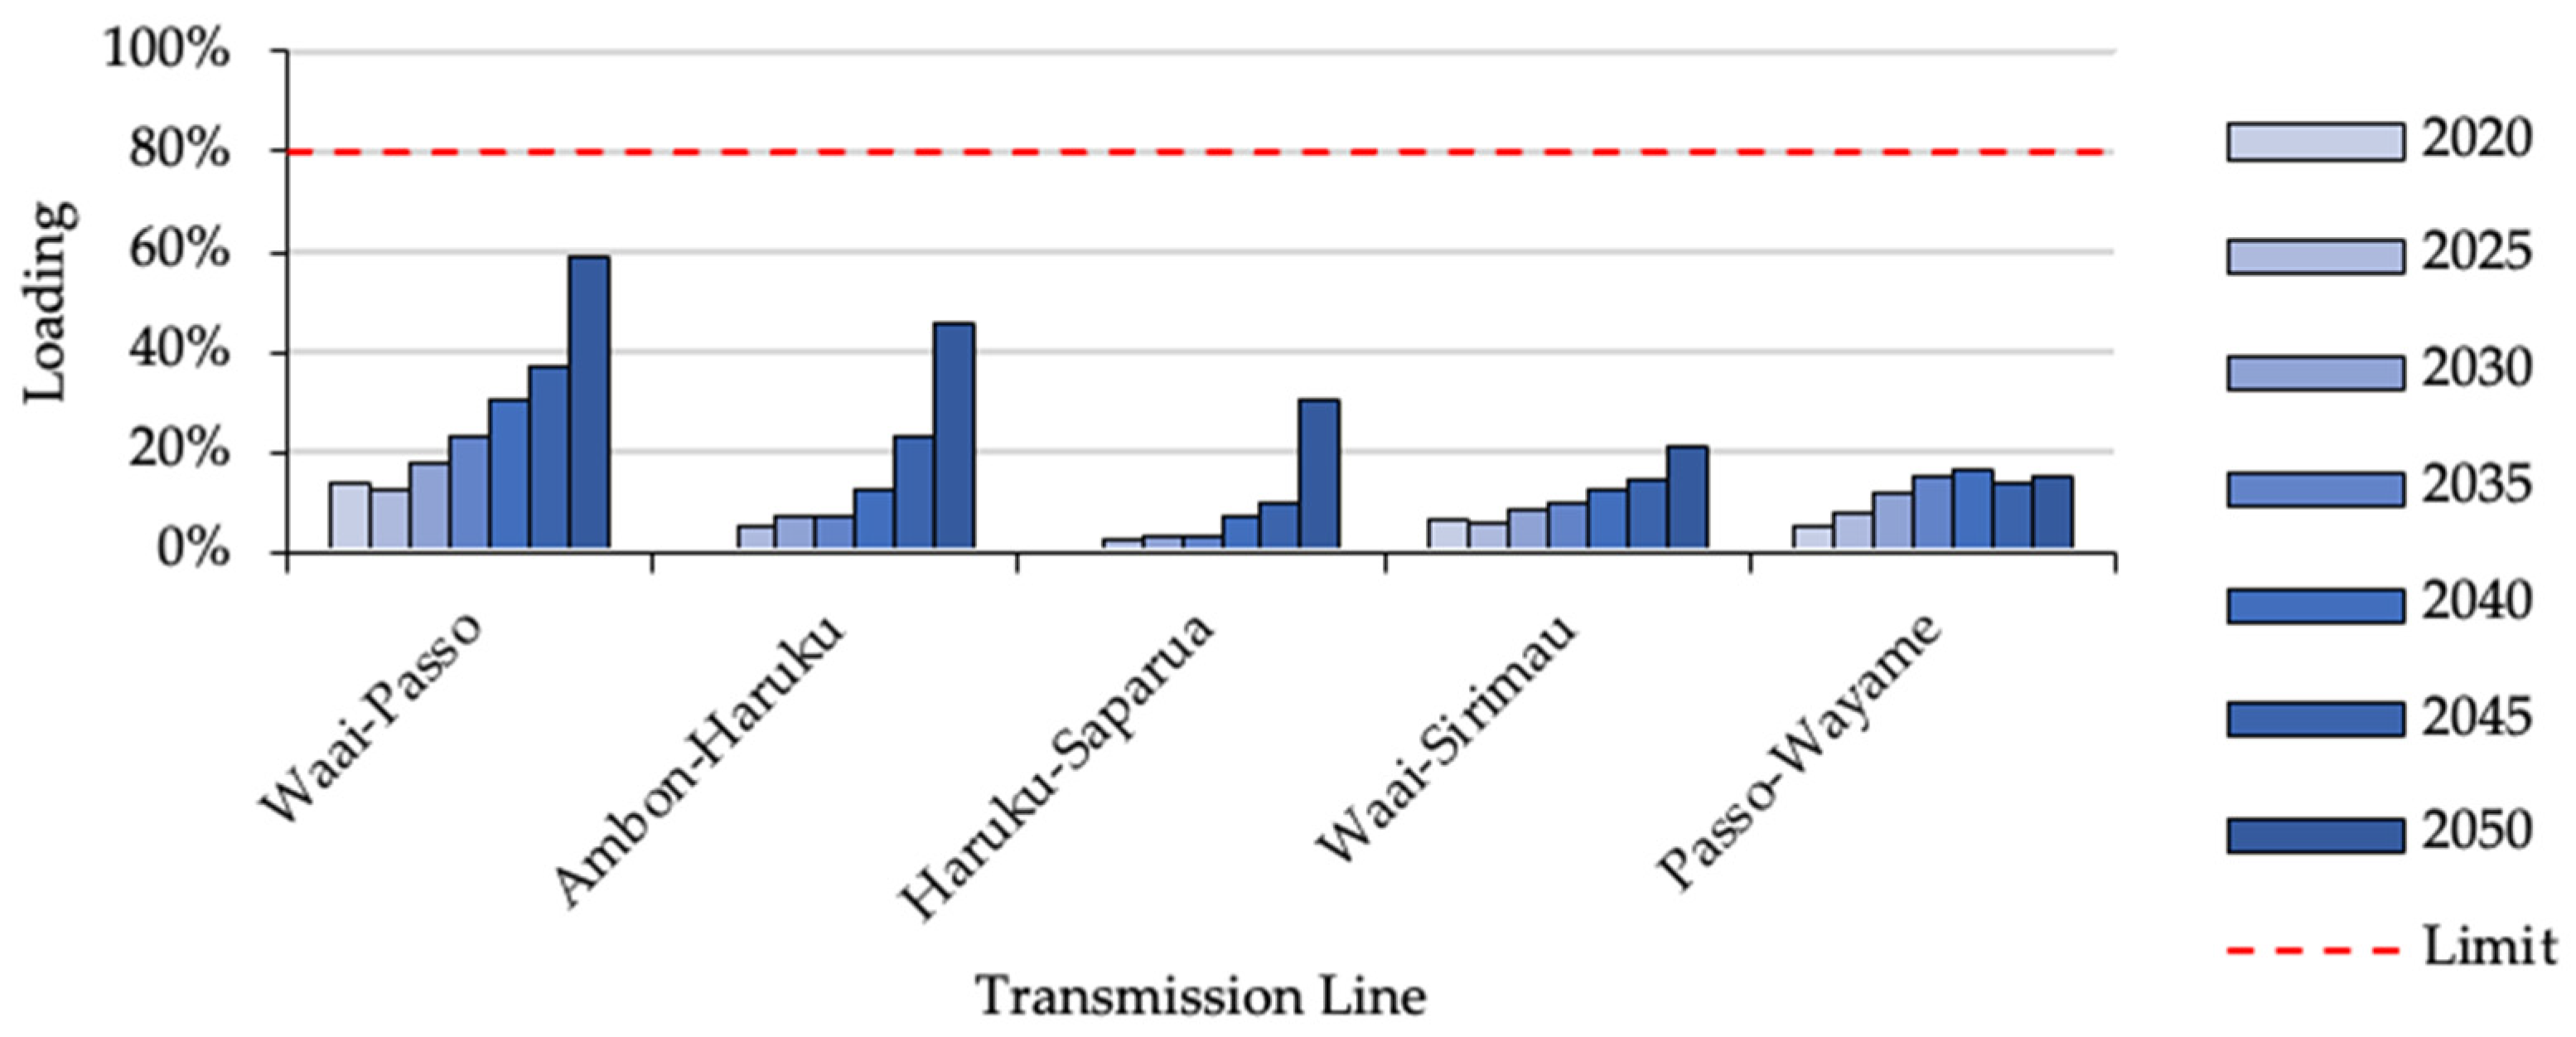
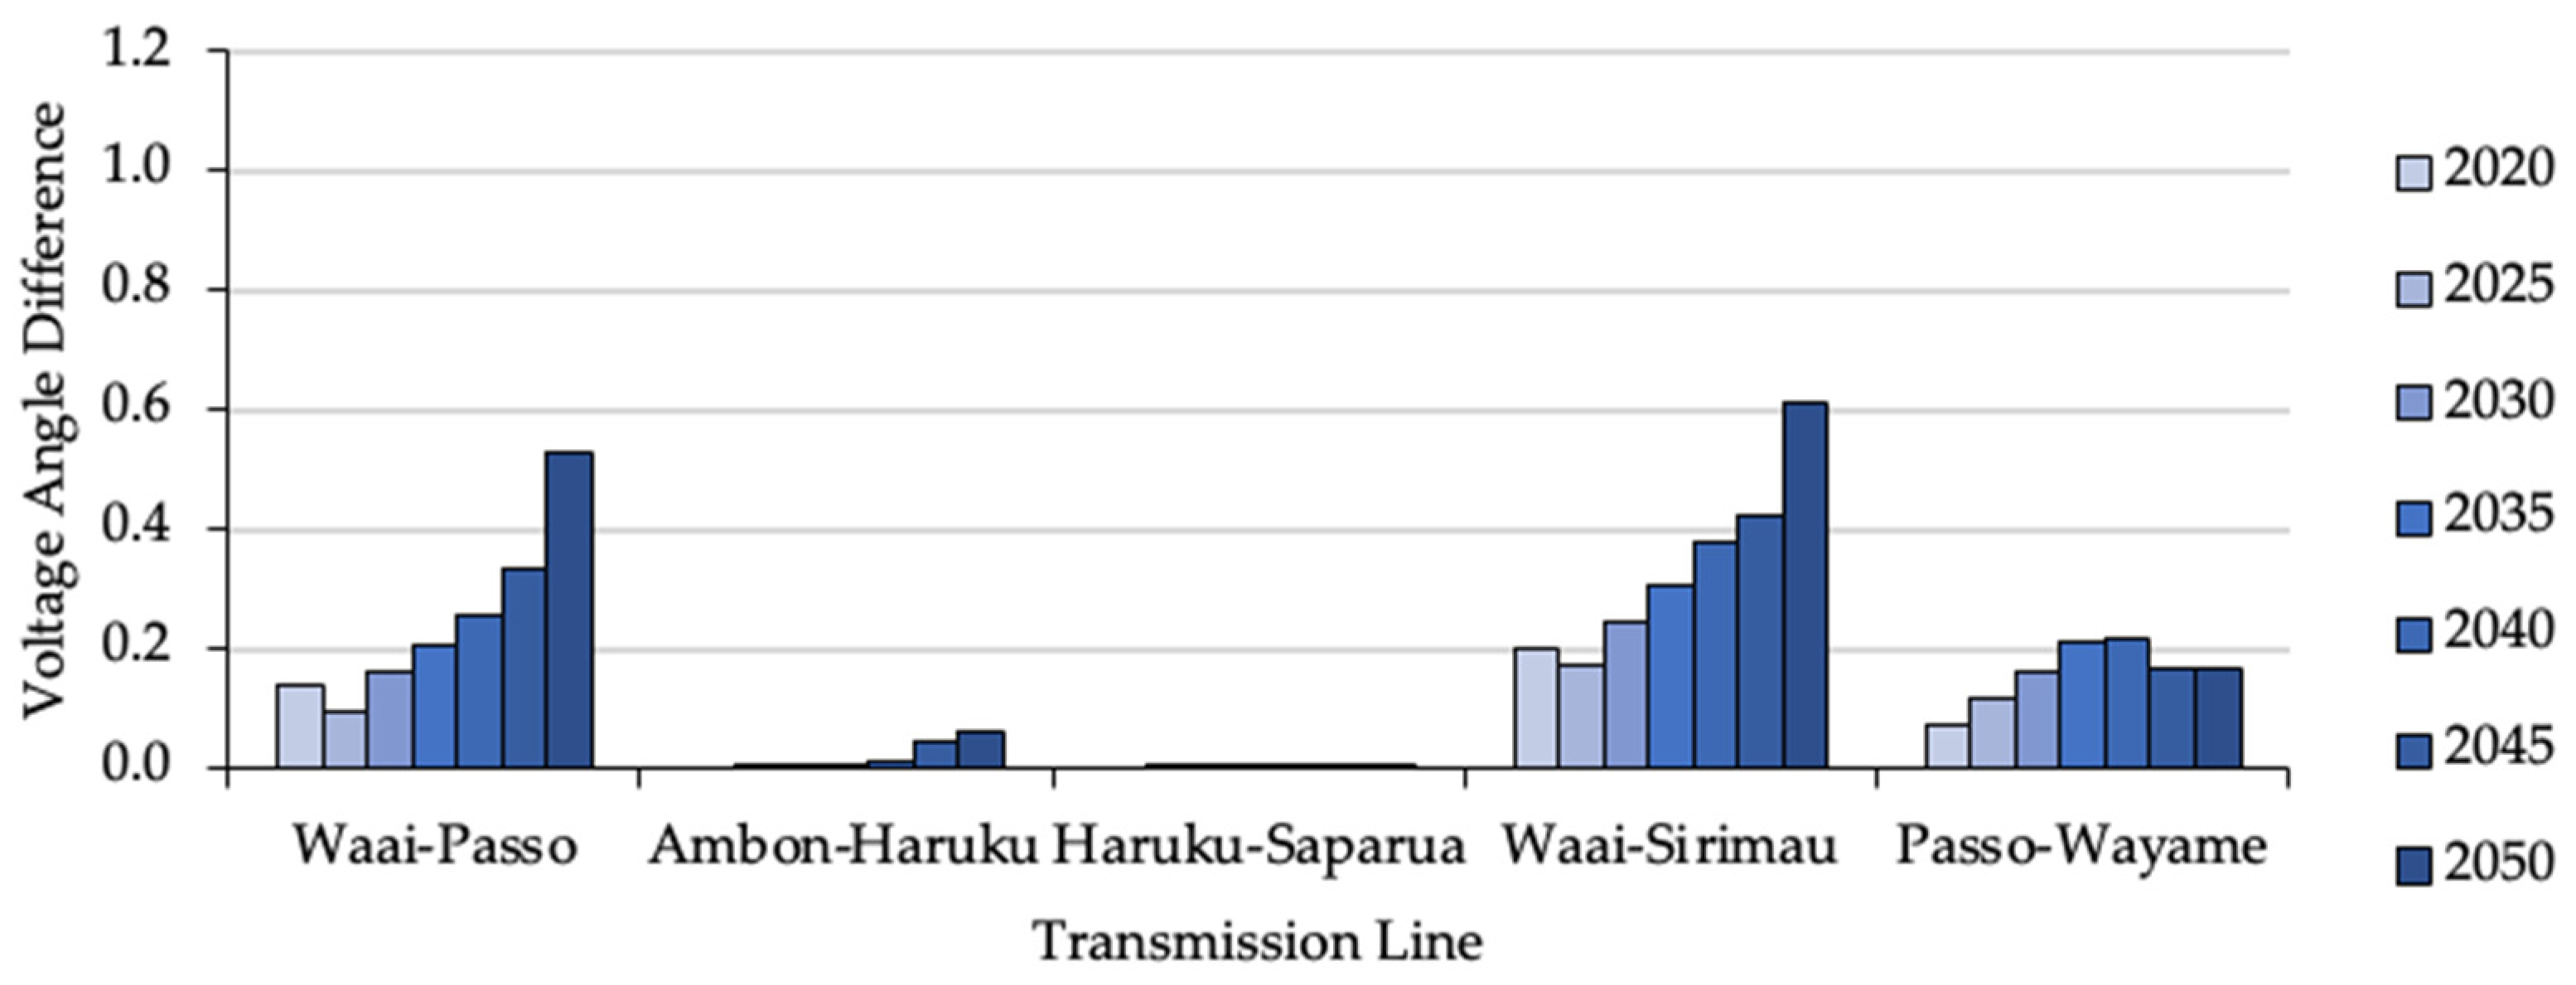
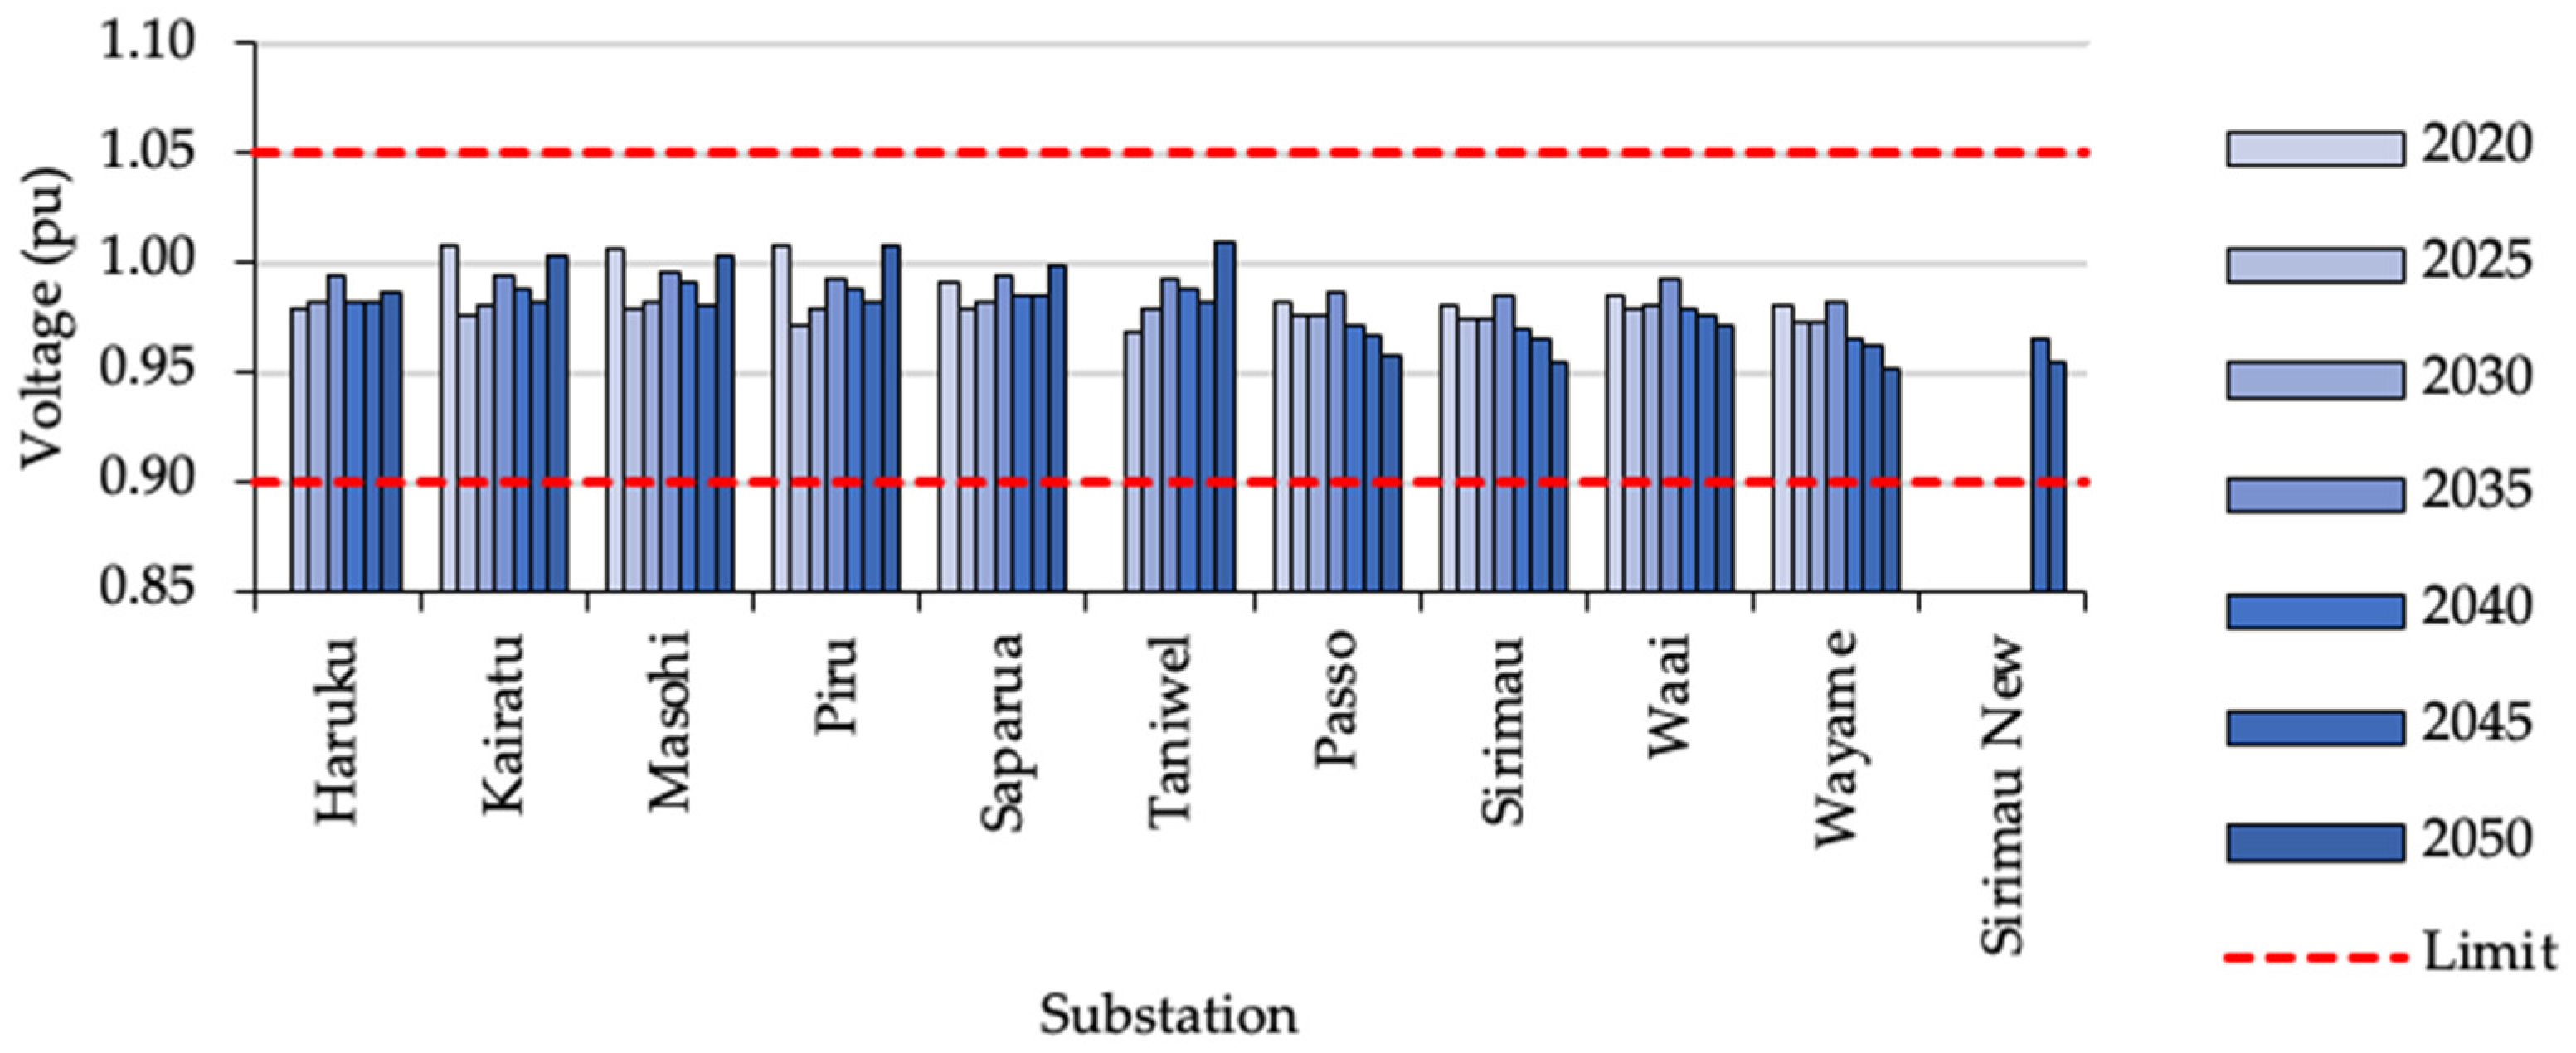
4.2.1. Power Flow Analysis
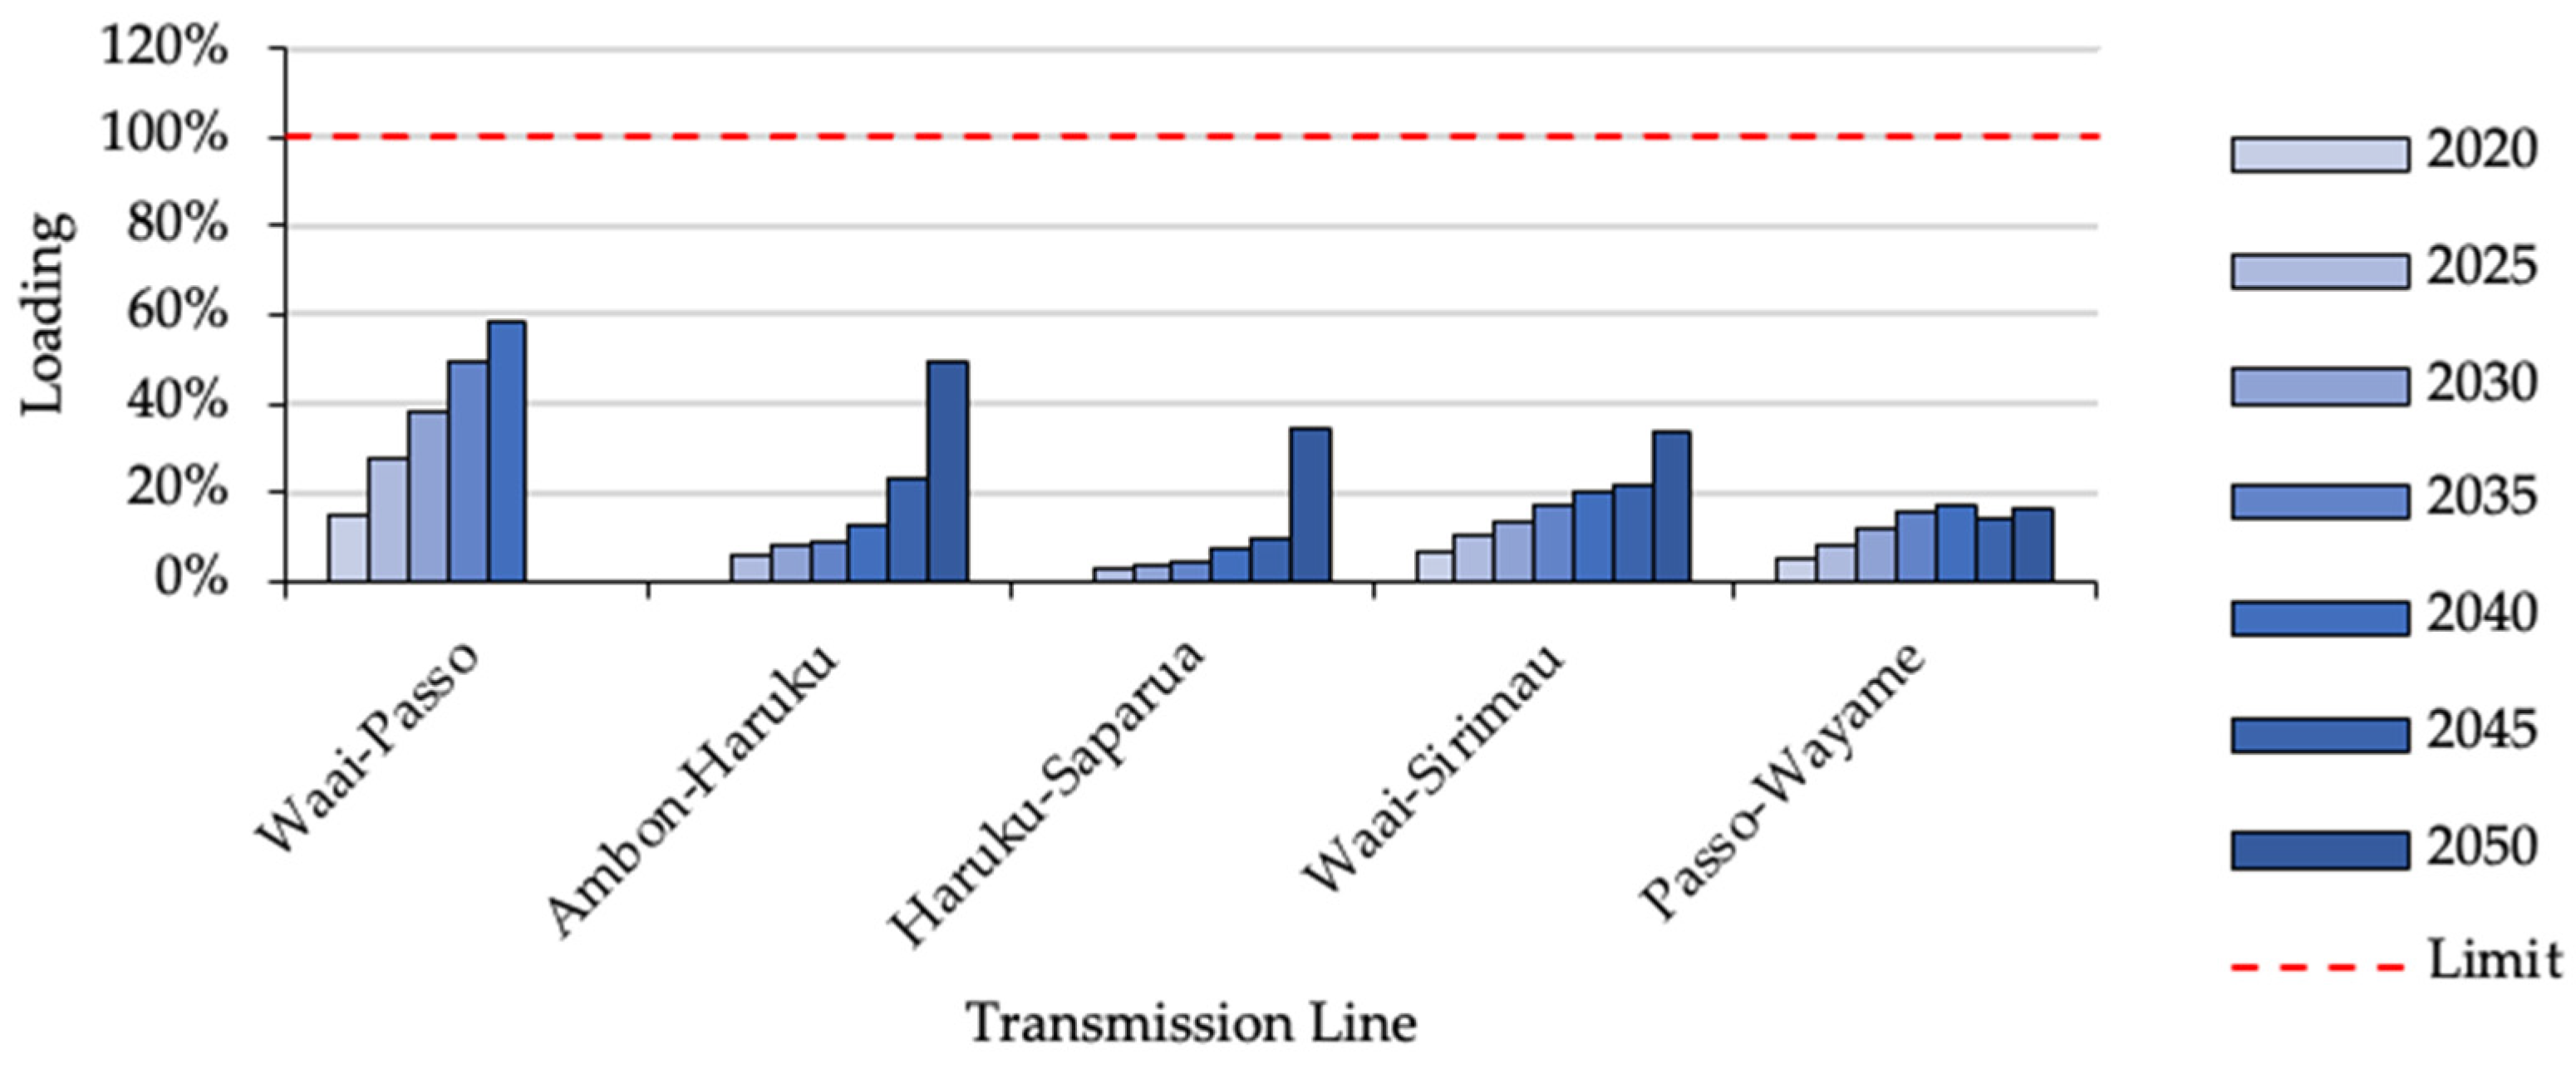
4.2.2. Contingency Analysis
4.2.3. Short Circuit Analysis
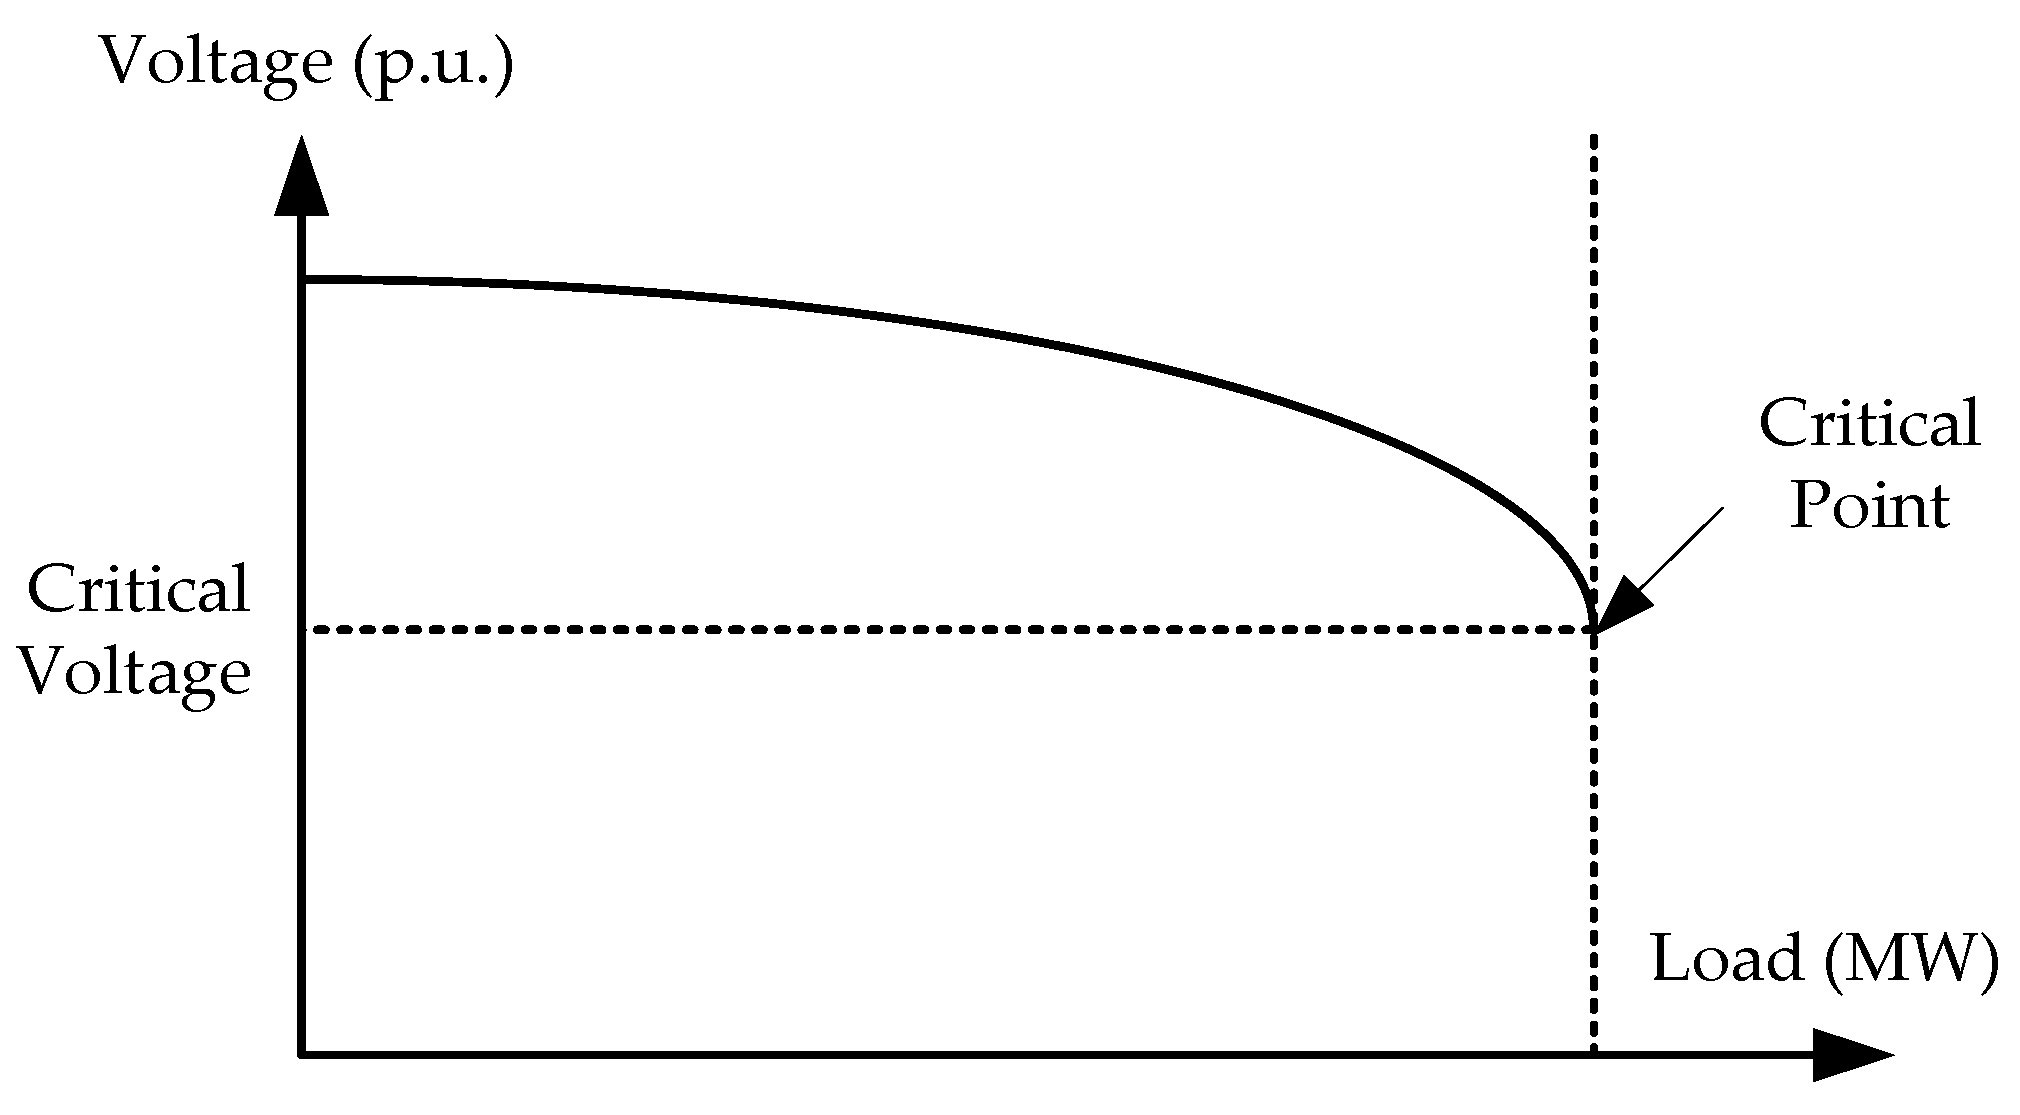
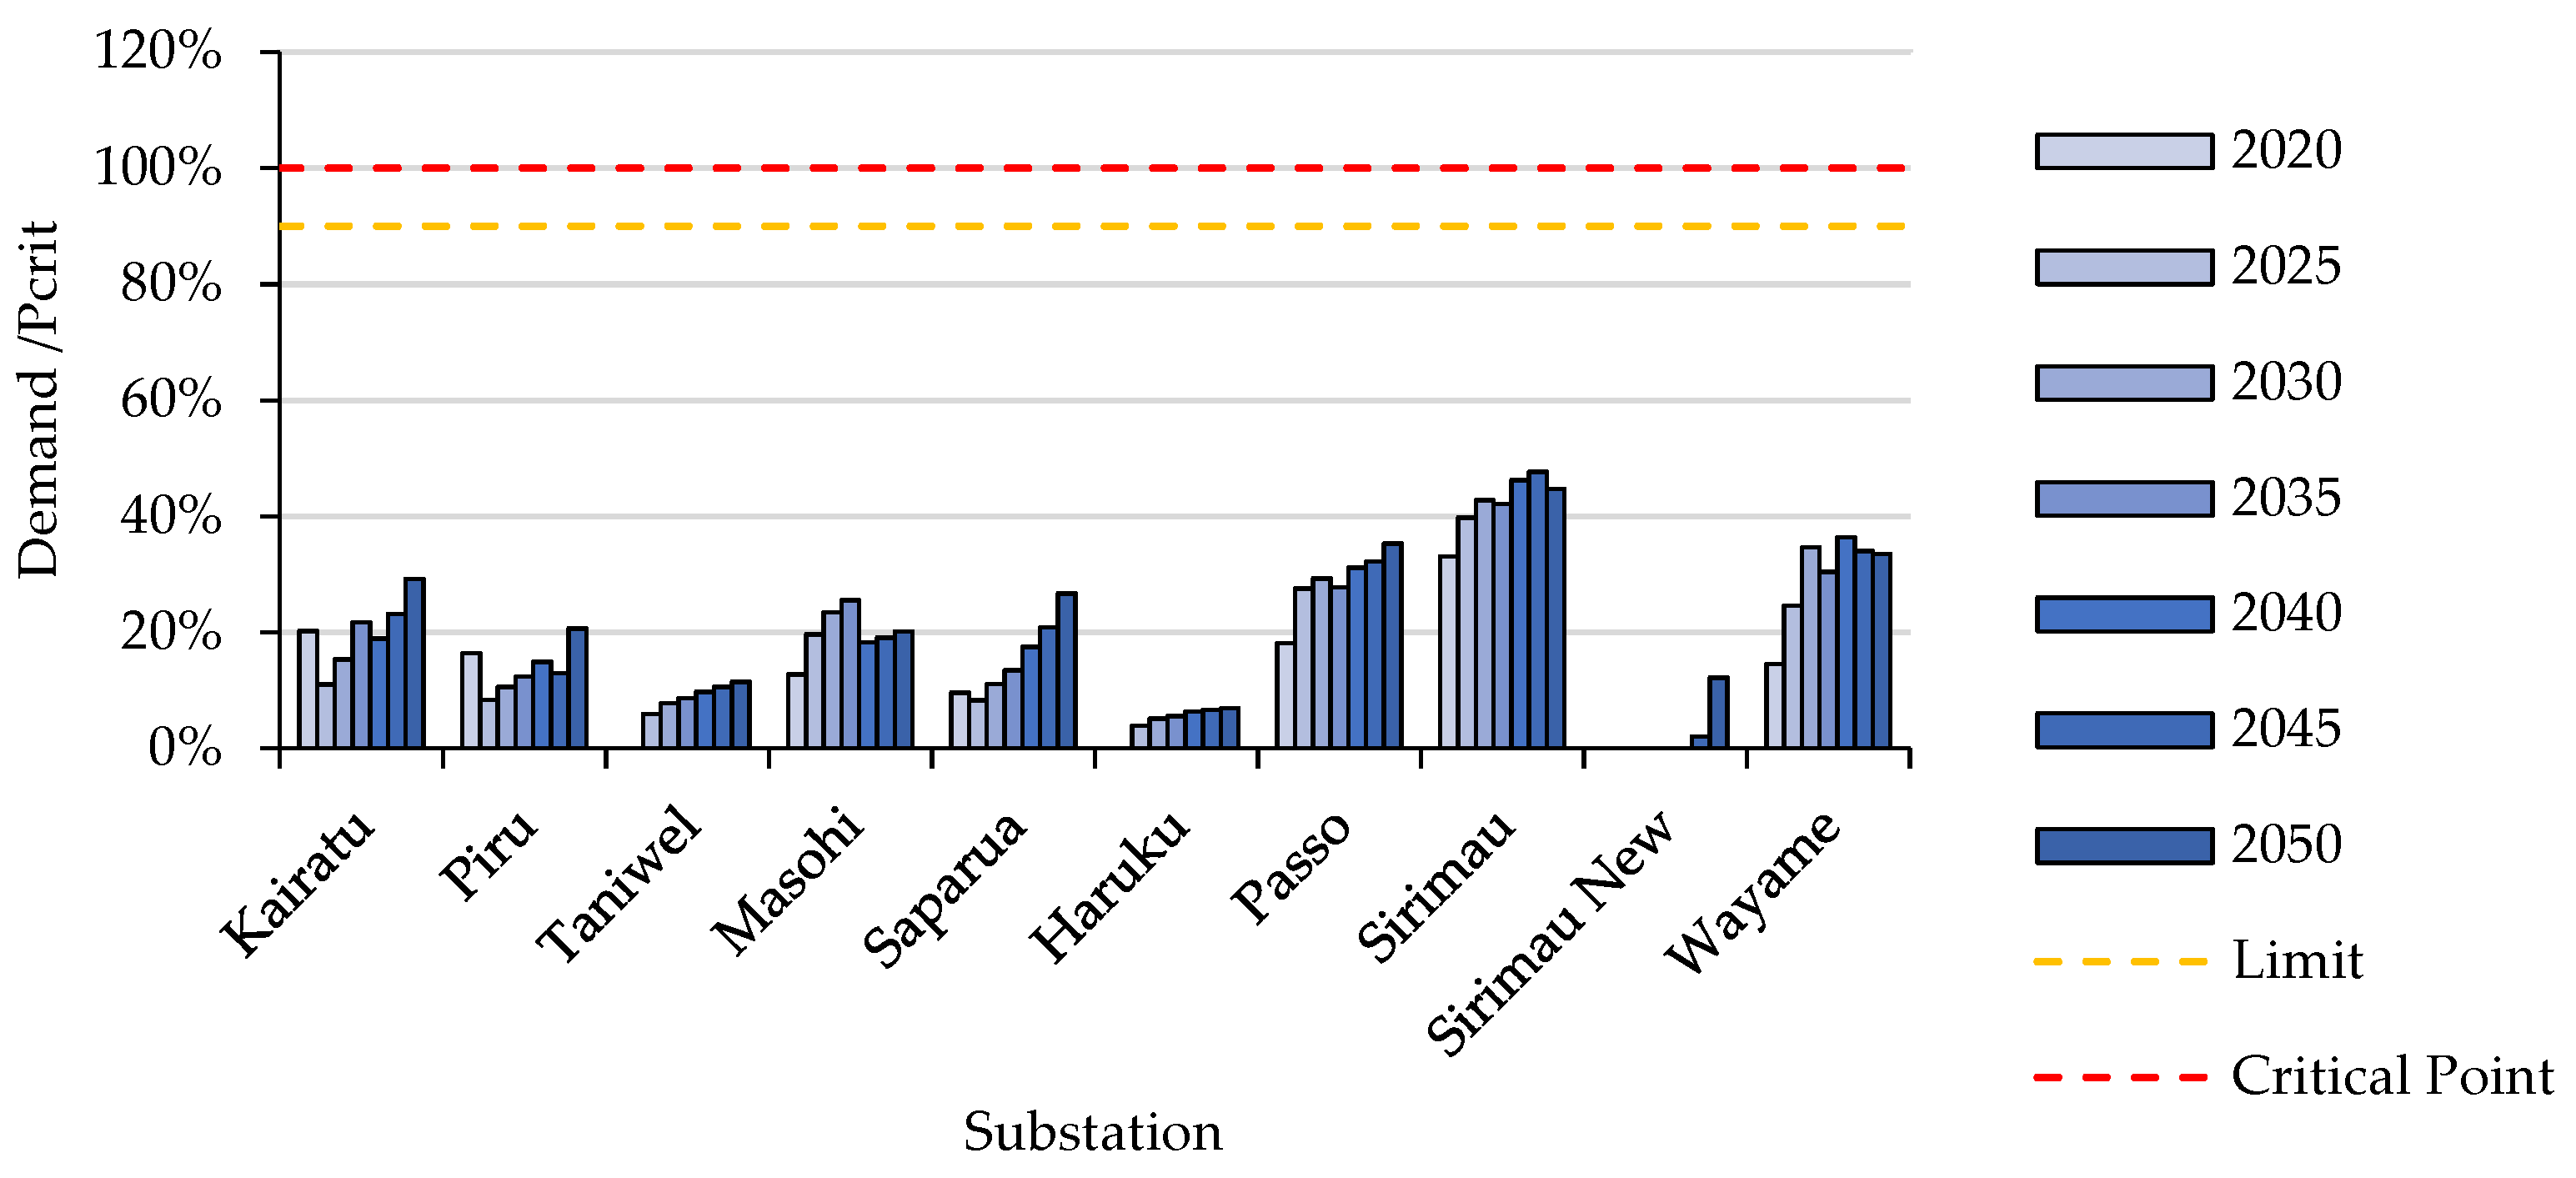
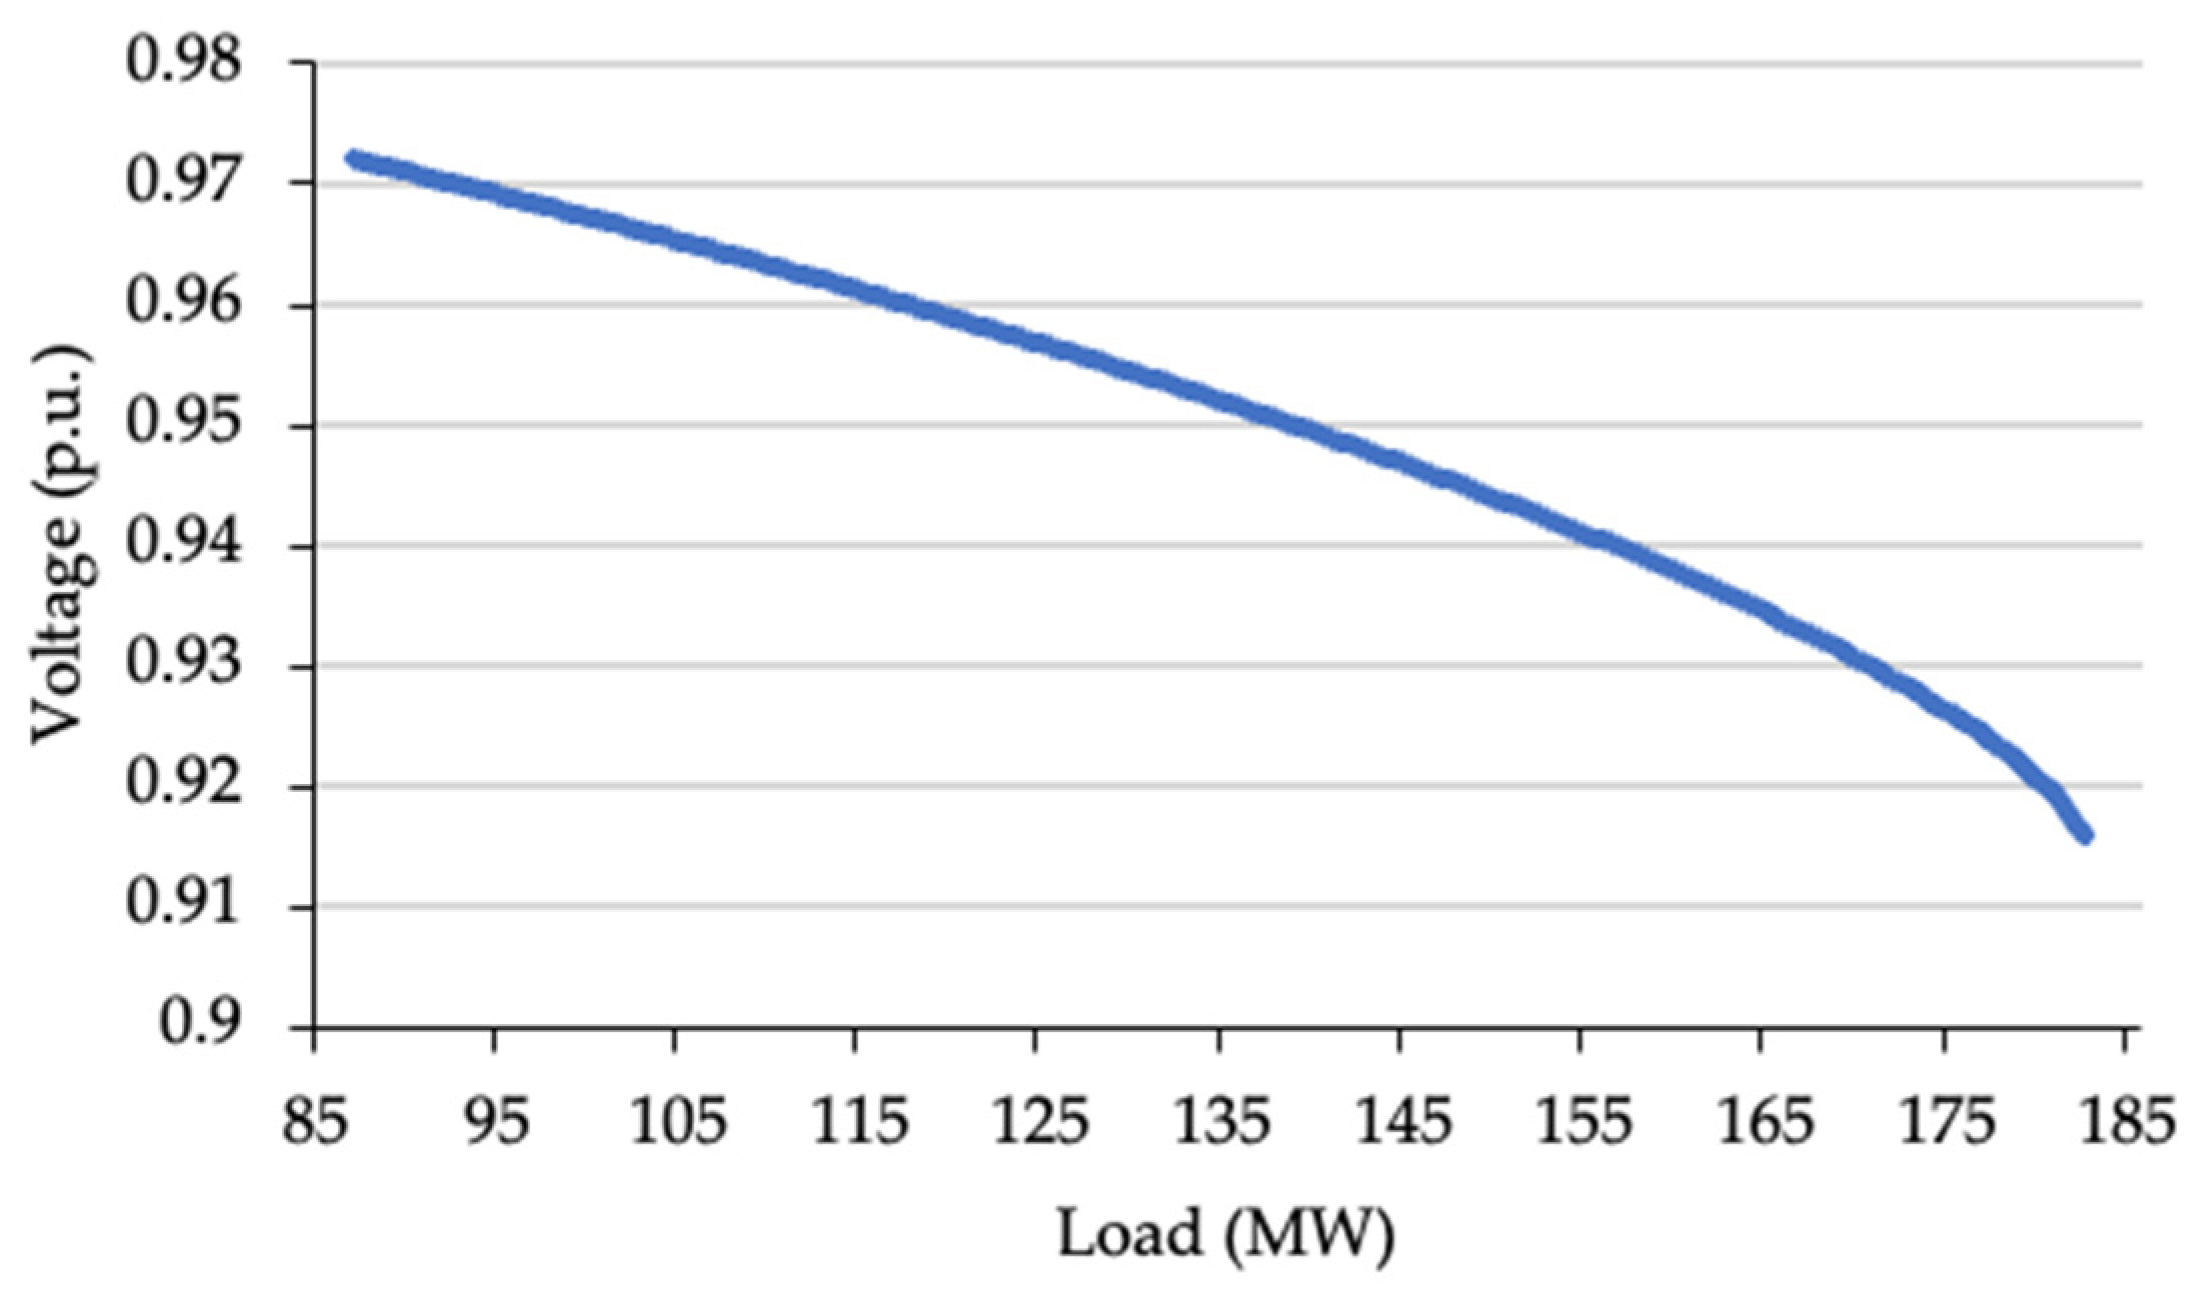
4.2.4. Voltage Stability Analysis
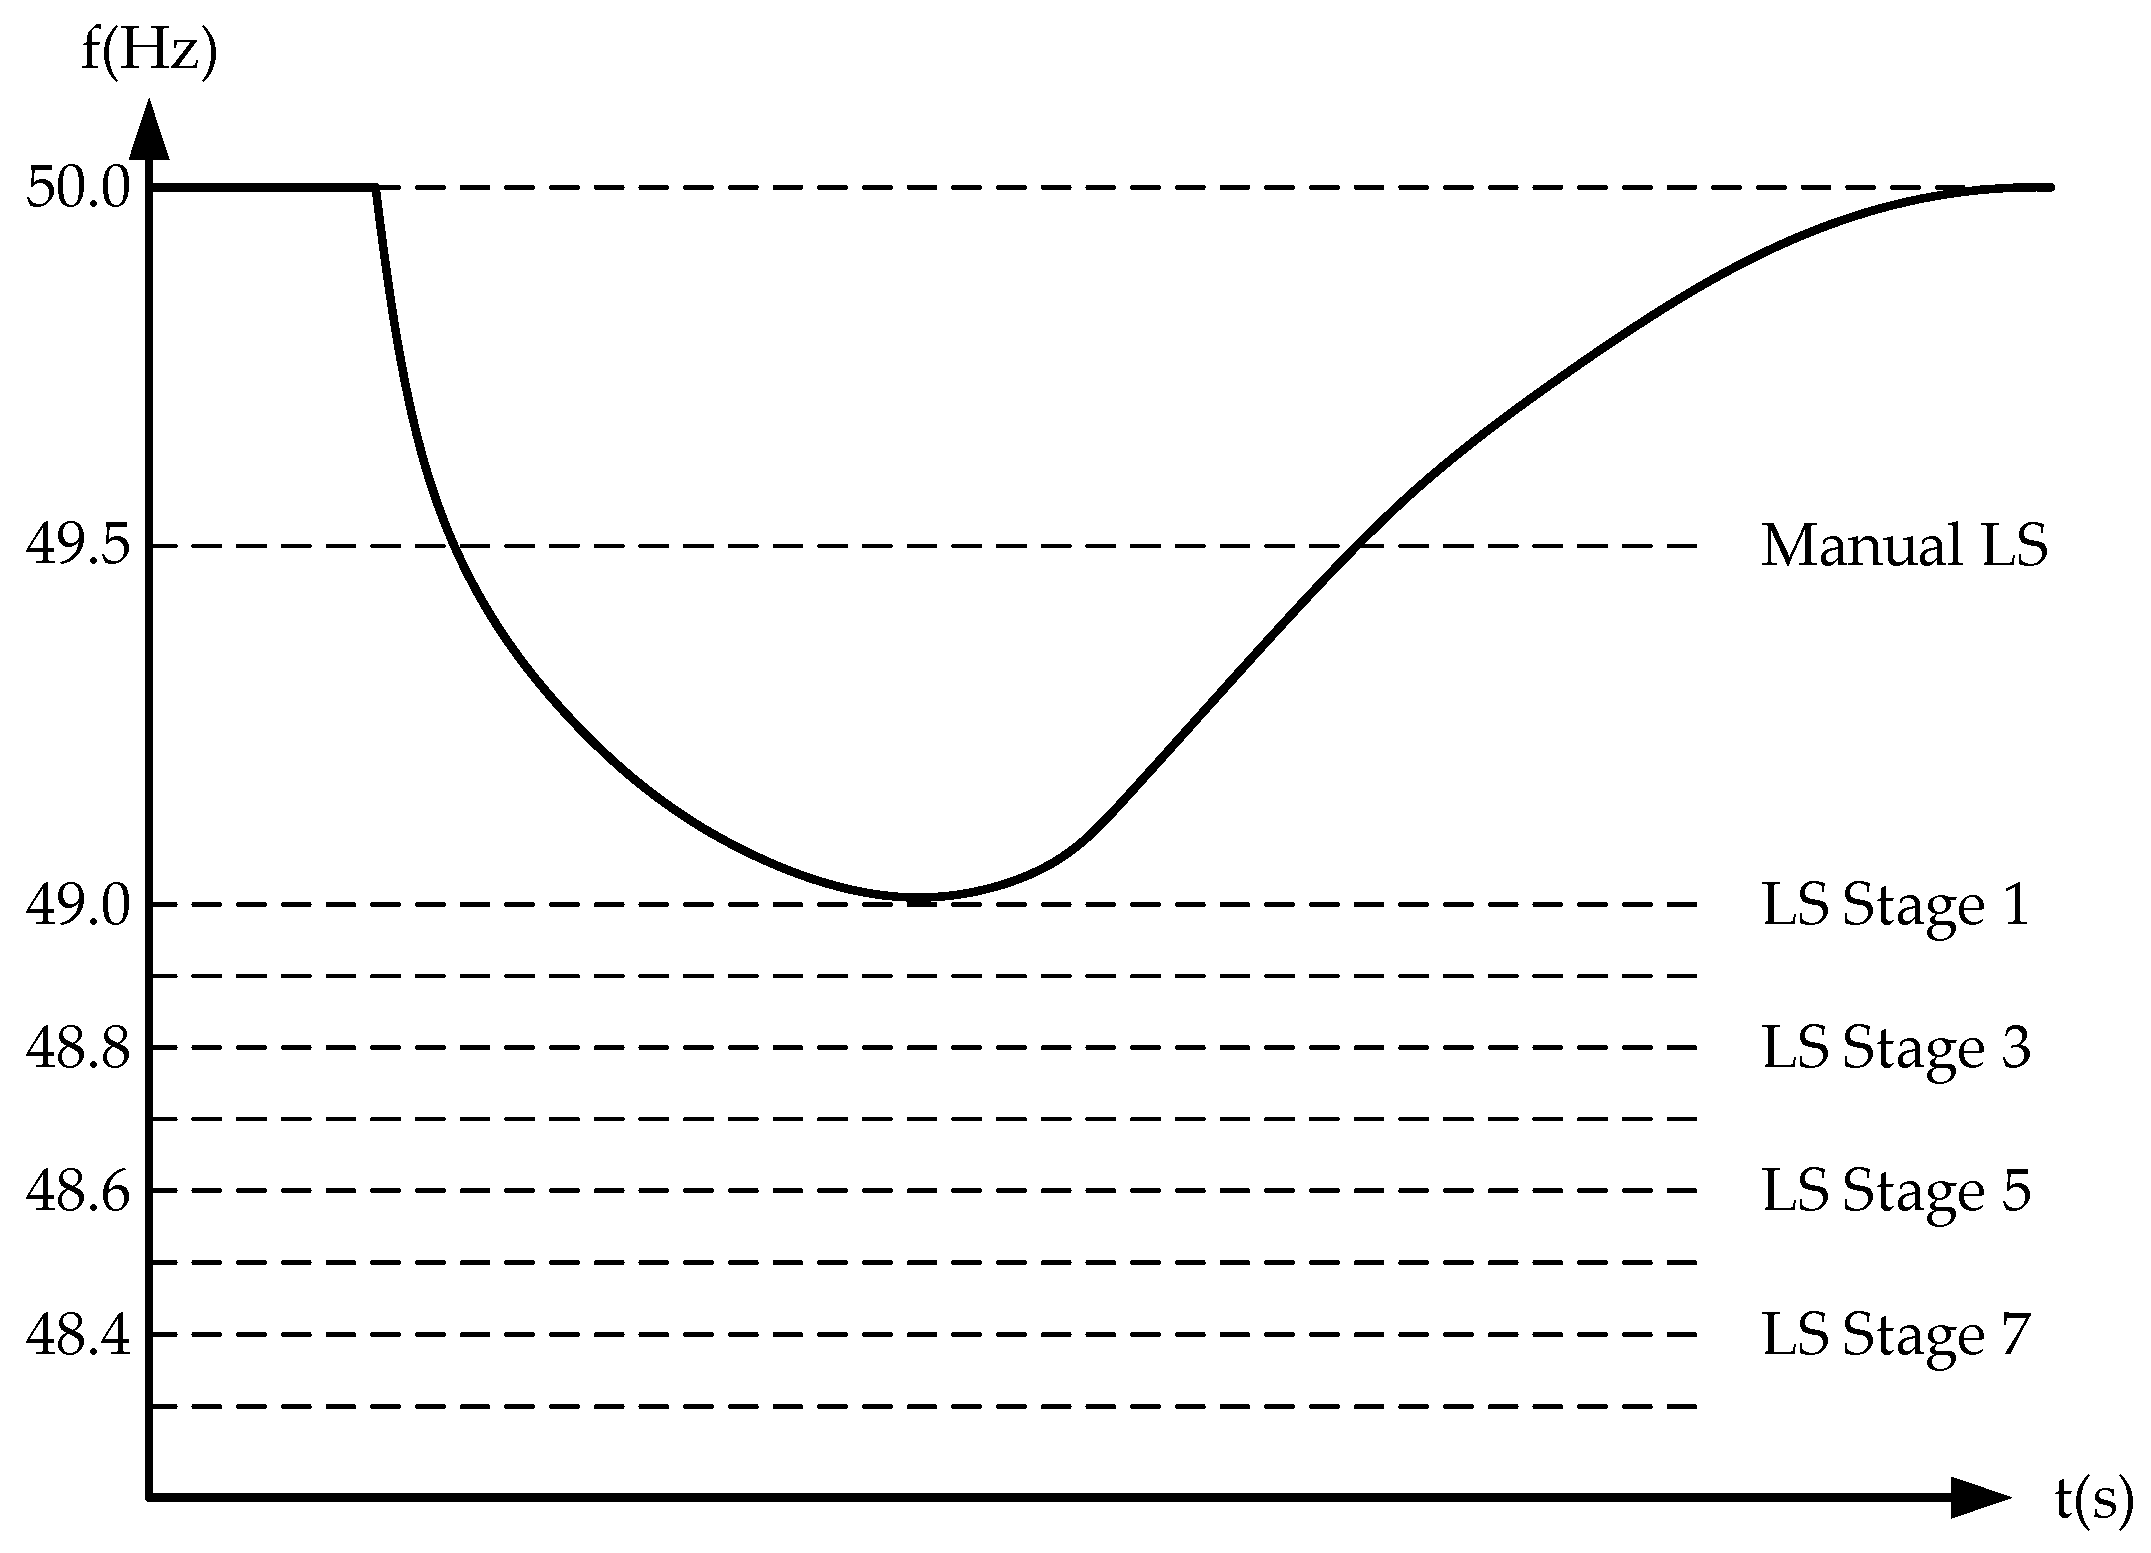
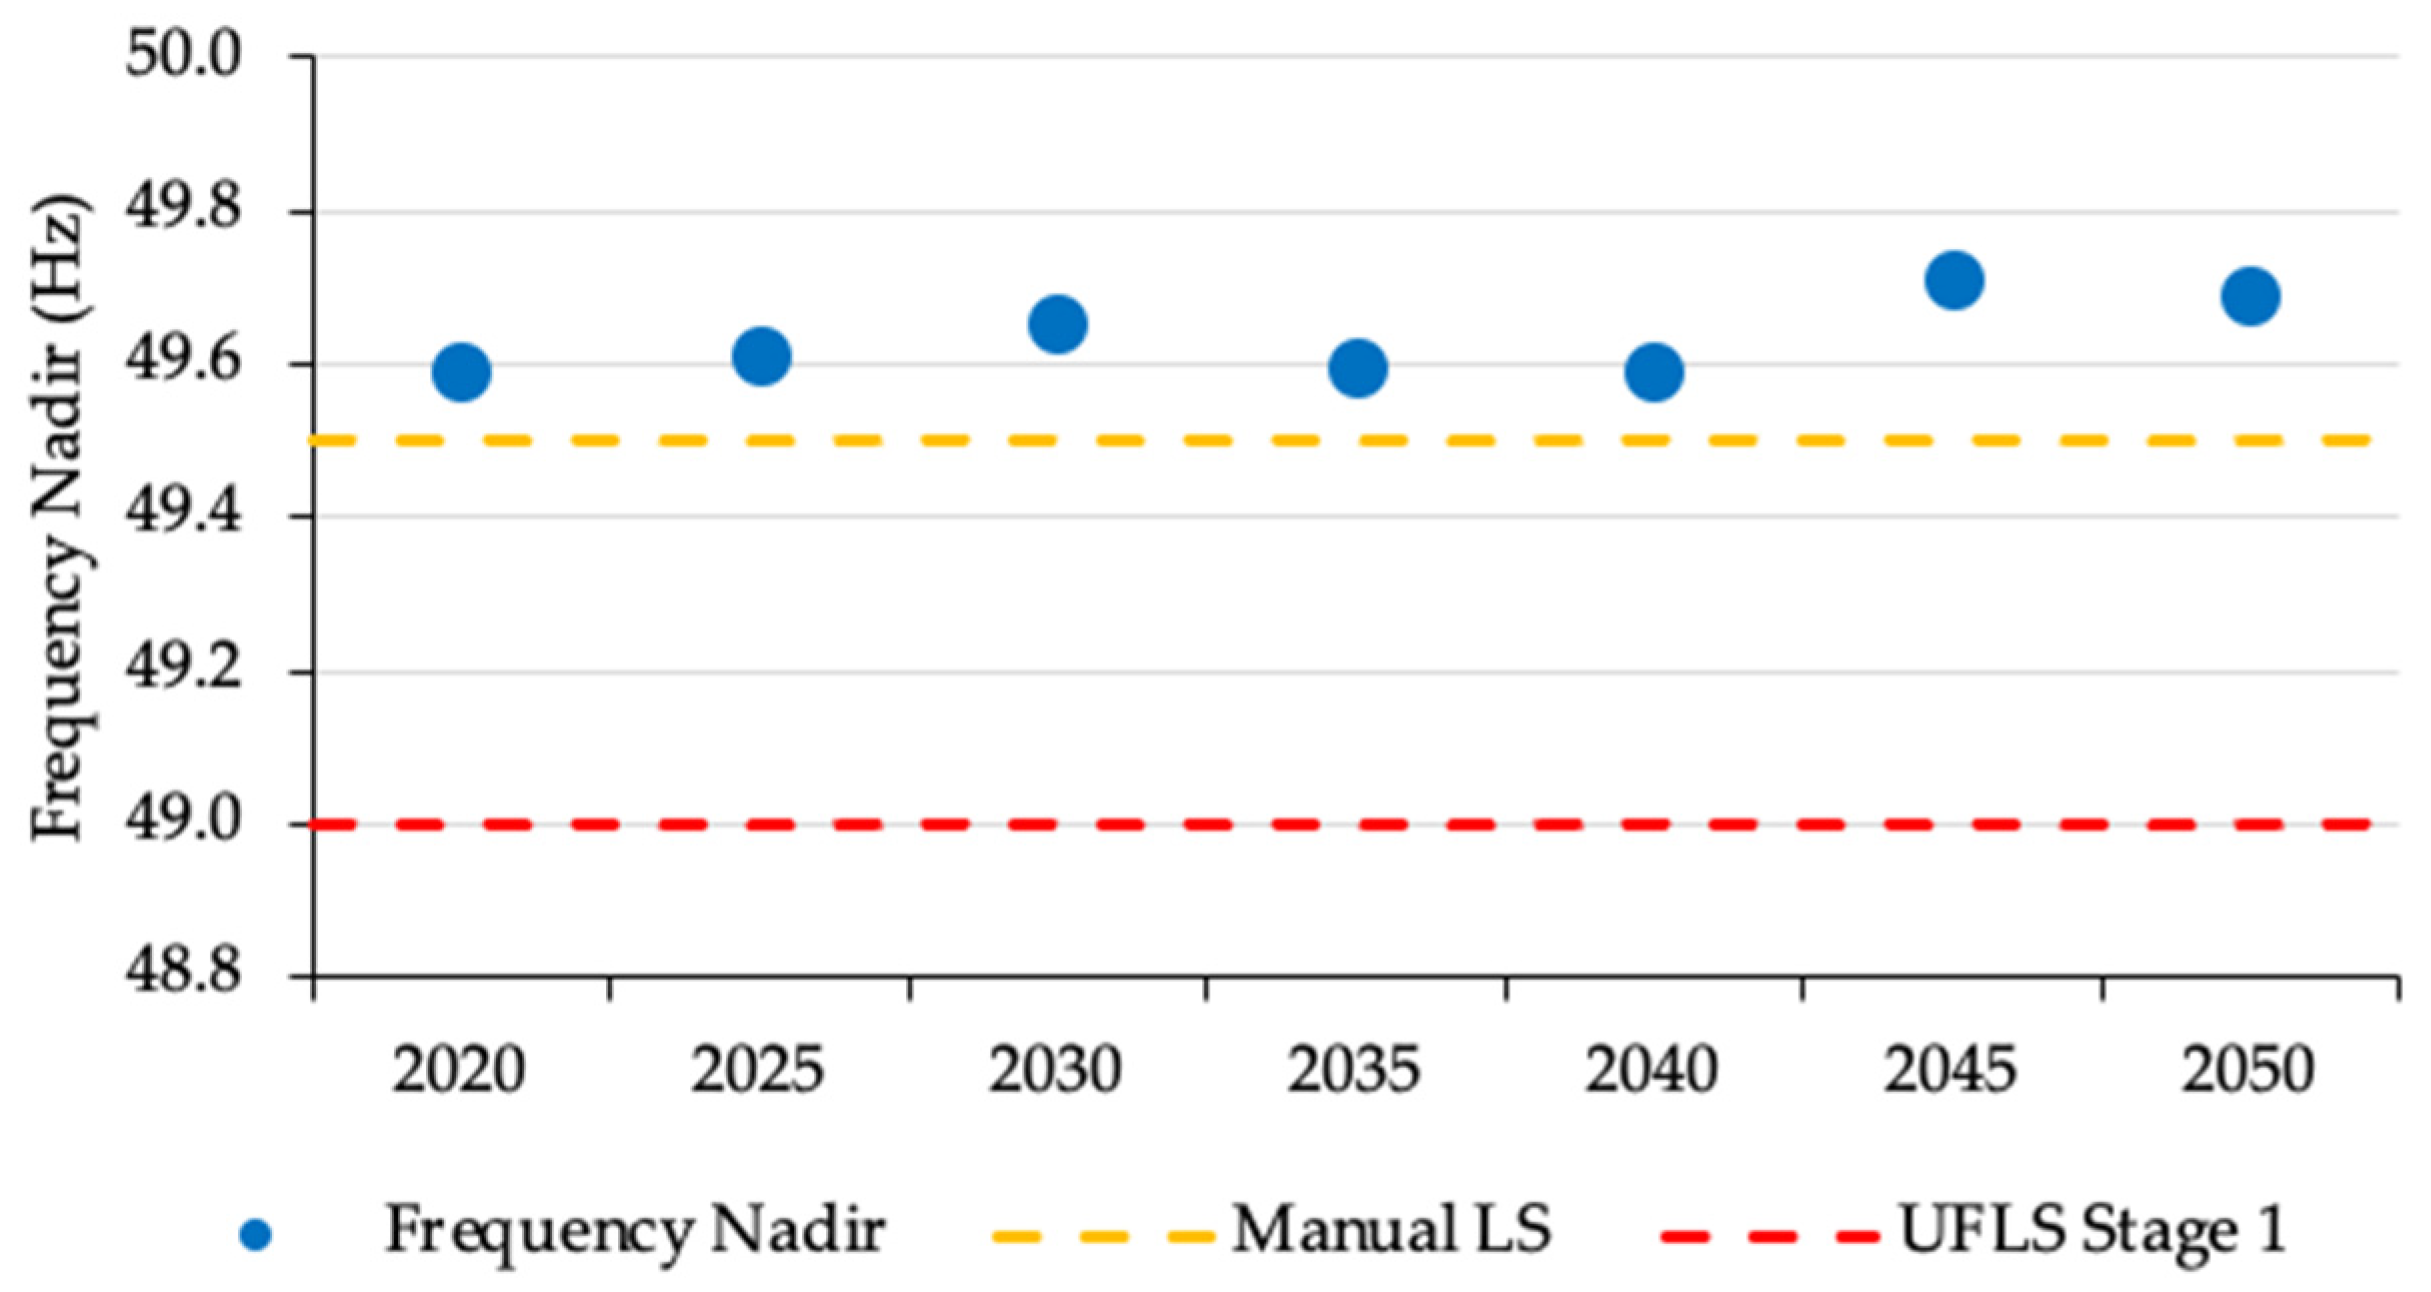
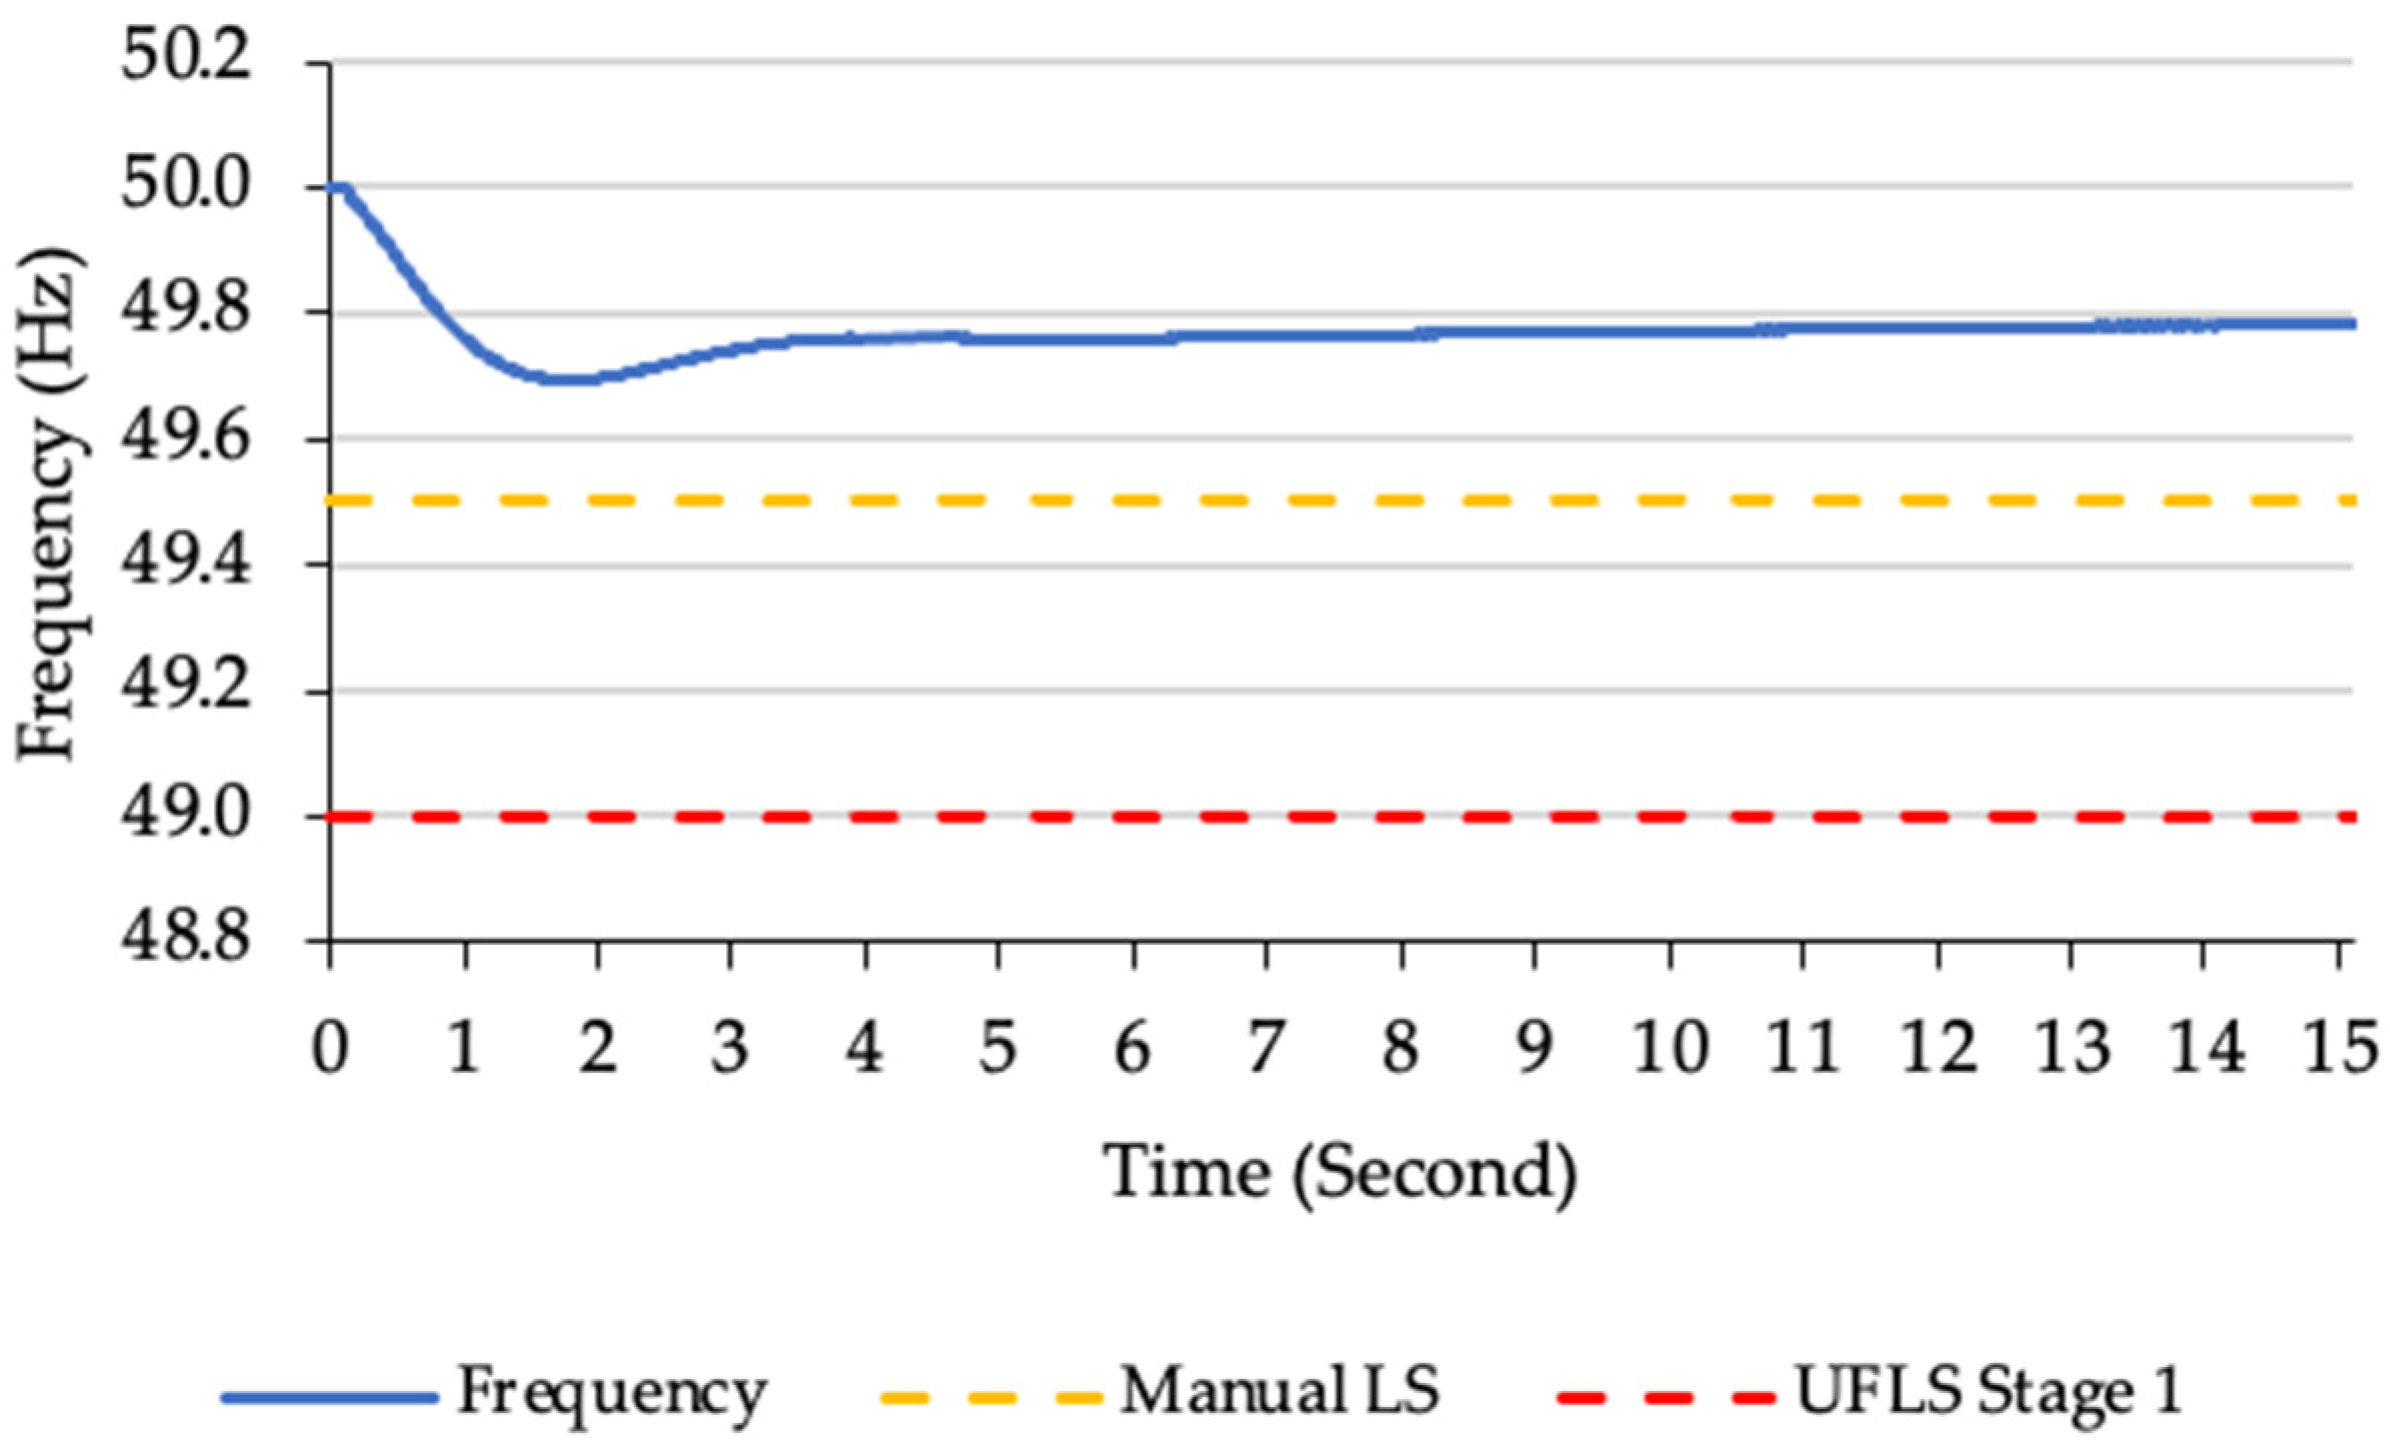
4.2.5. Frequency Stability Analysis
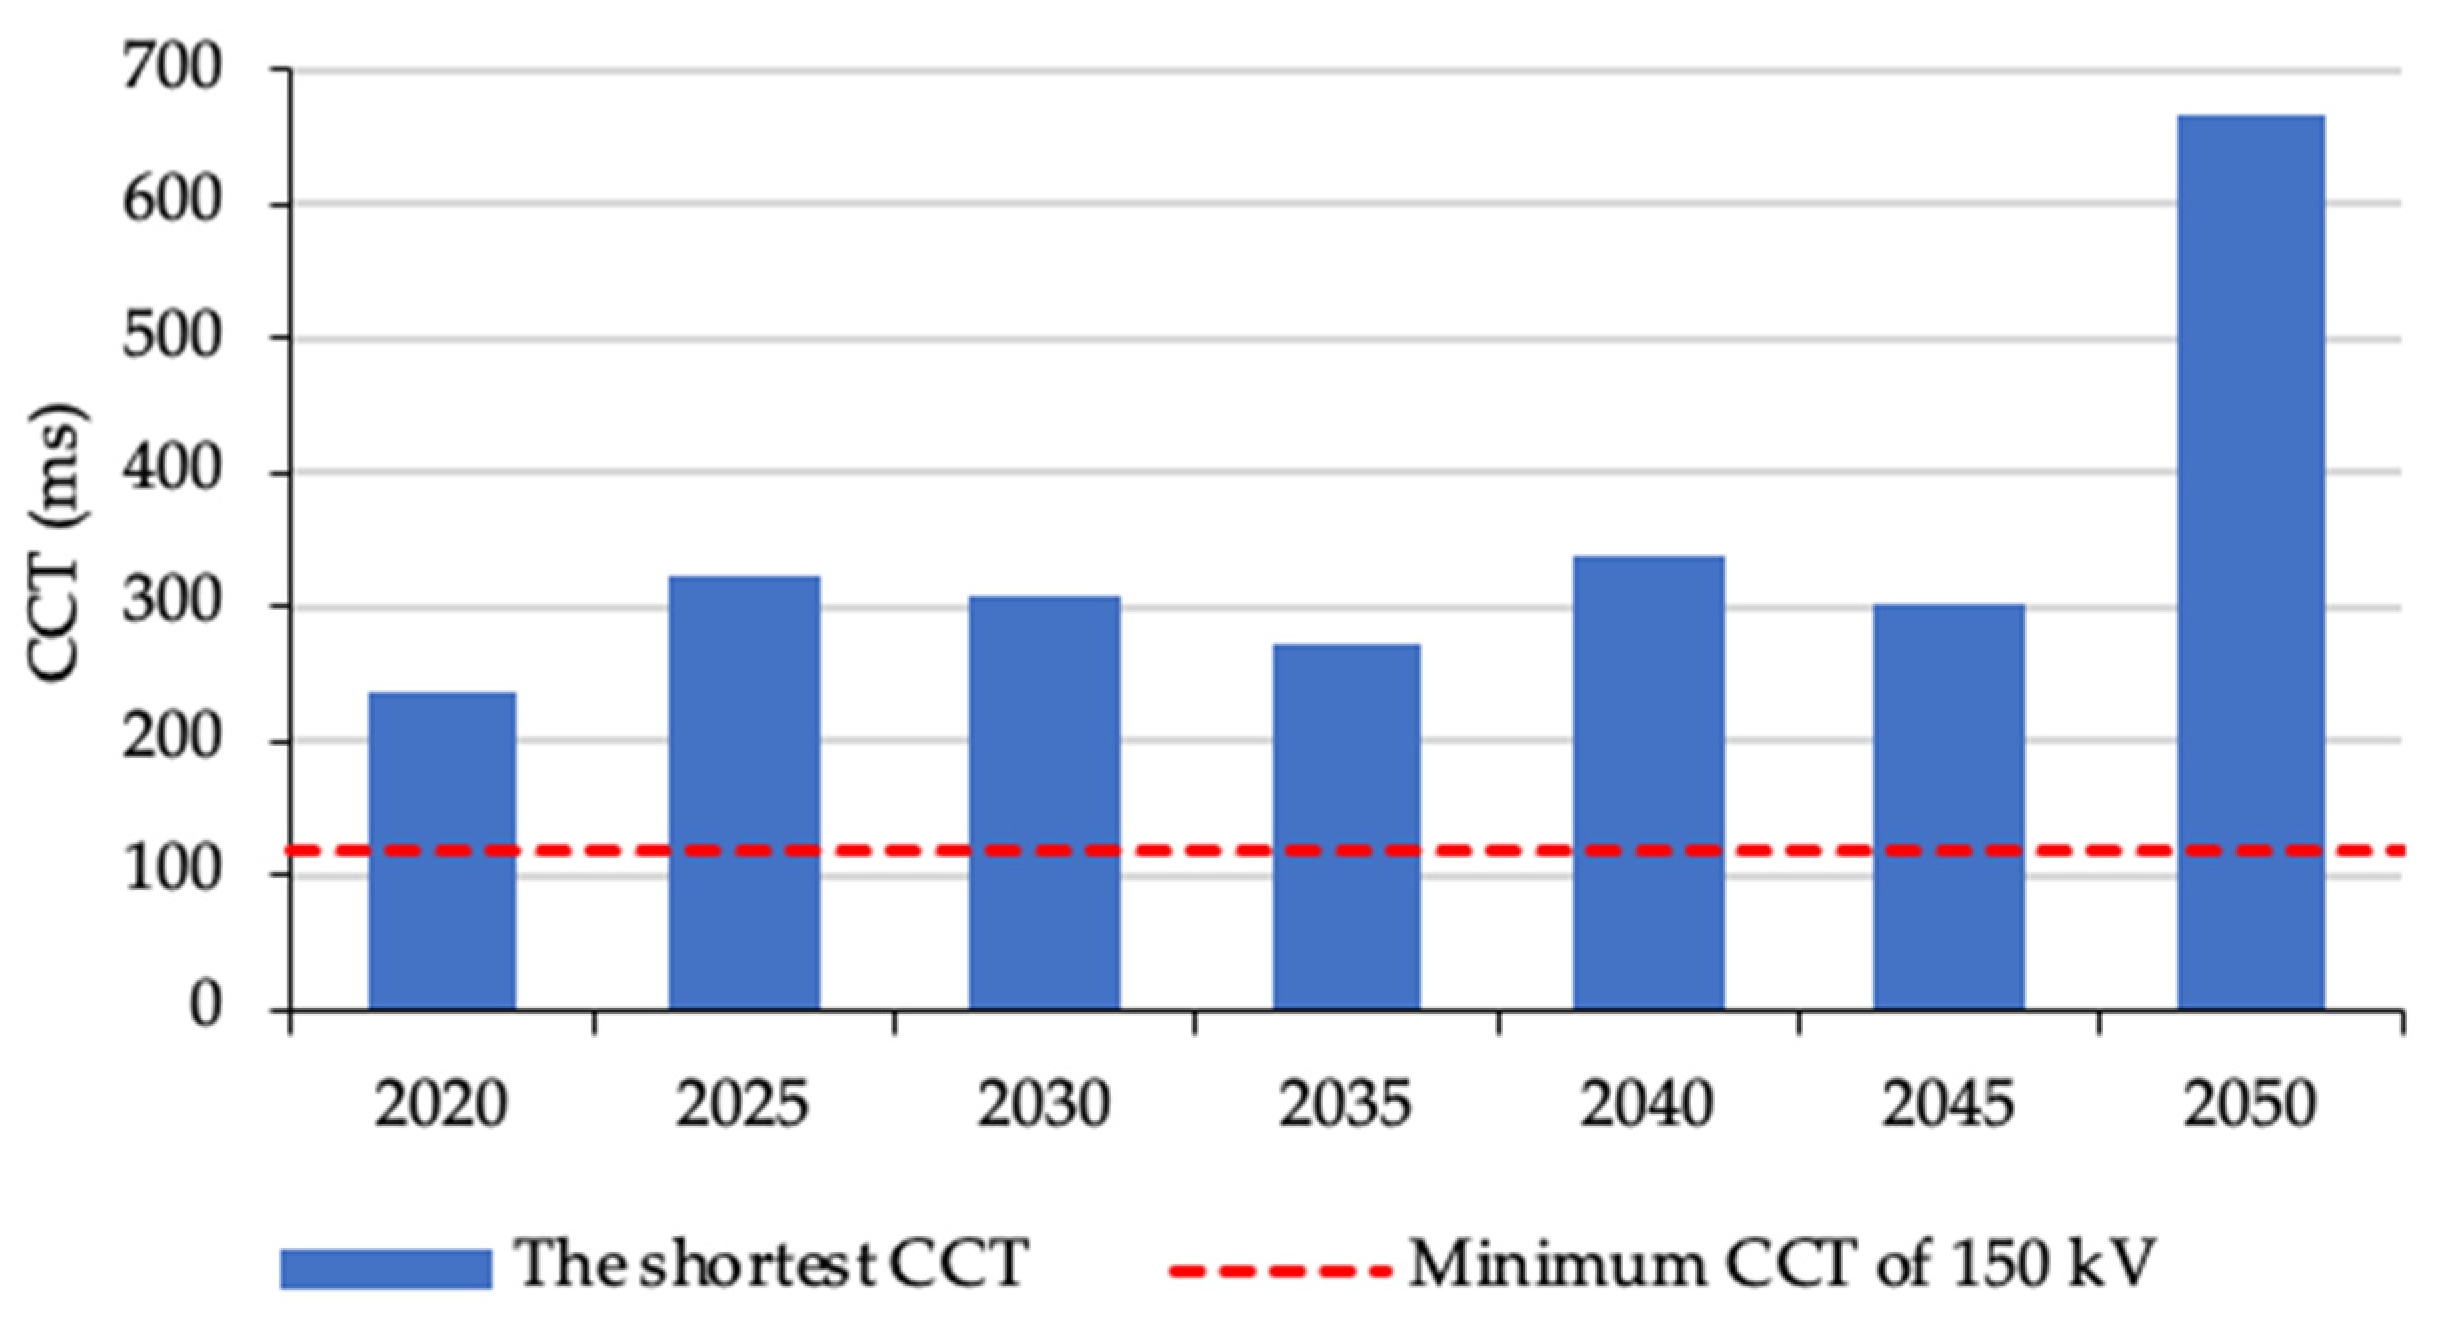
4.2.6. Transient Stability Analysis
4.2.7. Assessment Summary
5. Conclusions
Author Contributions
Funding
Institutional Review Board Statement
Informed Consent Statement
Data Availability Statement
Conflicts of Interest
Abbreviations
| AC | alternating current |
| CB | circuit breaker |
| CCT | critical clearing time |
| GEP | generation expansion planning |
| HVAC | high-voltage alternating current |
| HVDC | high-voltage direct current |
| IC | installed capacity |
| LS | load shedding |
| MVPP | marine vessel power plant |
| PL | peak load |
| PP | power plant |
| SHS | Seram, Haruku, and Saparua |
| SLD | single line diagram |
| TEP | transmission expansion planning |
| UFLS | under-frequency load shedding |
| TCSC | thyristor-controlled series compensator |
| FACTS | flexible AC transmission system |
References
- Tumiran; Sarjiya; Putranto, L.M.; Priyanto, A.; Savitri, I. Generation expansion planning for high-potential hydropower resources: The case of the sulawesi electricity system. Int. J. Sustain. Energy Plan. Manag. 2020, 28, 37–52. [Google Scholar] [CrossRef]
- The World Bank Electric Power Consumption (kWh per Capita)—Indonesia. Available online: https://data.worldbank.org/indicator/EG.USE.ELEC.KH.PC?locations=ID (accessed on 16 December 2021).
- PT PLN (Persero). Statistik PLN 2018 [PLN Statistics 2018]; PT PLN (Persero): Jakarta, Indonesia, 2019. [Google Scholar]
- Tumiran; Sarjiya; Putranto, L.M.; Sunanda, W.; Irnawan, R.; Priyanto, A.; Savitri, I. The Masterplan for Developing Electricity Systems for Archipelagic Area by Considering Local Energy Resources: A Case Study of Maluku Islands. In Proceedings of the 2019 IEEE 7th International Conference on Smart Energy Grid Engineering (SEGE), Oshawa, ON, Canada, 12–14 August 2019; pp. 290–293. [Google Scholar] [CrossRef]
- PT PLN (Persero). Rencana Usaha Penyediaan Tenaga Listrik PT PLN (Persero) 2019–2028 [Electricity Supply Business Plan of PT PLN (Persero) 2019–2028]; PT PLN (Persero): Jakarta, Indonesia, 2019. [Google Scholar]
- Valinejad, J.; Marzband, M.; Elsdon, M.; Al-Sumaiti, A.S.; Barforoushi, T. Dynamic carbon-constrained EPEC model for strategic generation investment incentives with the aim of reducing CO2 emissions. Energies 2019, 12, 4813. [Google Scholar] [CrossRef] [Green Version]
- Arif, A.; Rizwan, M.; Elkamel, A.; Hakeem, L.; Zaman, M. Optimal selection of integrated electricity generation systems for the power sector with low greenhouse gas (GHG) emissions. Energies 2020, 13, 4571. [Google Scholar] [CrossRef]
- Tumiran; Putranto, L.M.; Wijaya, F.D.; Priyanto, A.; Savitri, I. Generation Expansion Planning Based on Local Renewable Energy Resources: A Case Study of the Isolated Ambon-Seram Power System. Sustainability 2022, 14, 3032. [Google Scholar] [CrossRef]
- Karekezi, S.; Lata, K.; Teixeira Coelho, S. Traditional Biomass Energy: Imporiving its Use and Moving to Modern Energy Use. Int. Conf. Renew. Energ. 2004, 53, 1689–1699. [Google Scholar]
- Gomes, P.V.; Saraiva, J.T. State-of-the-art of transmission expansion planning: A survey from restructuring to renewable and distributed electricity markets. Int. J. Electr. Power Energy Syst. 2019, 111, 411–424. [Google Scholar] [CrossRef]
- Saadat, H. Power System Analysis; McGraw-Hill: New York, NY, USA, 1999. [Google Scholar]
- Kundur, P.; Balu, N.J. Power System Stability and Control; EPRI Power System Engineering Series; McGraw-Hill: New York, NY, USA, 1994; ISBN 9780780334632. [Google Scholar]
- Sultan, H.M.; Zaki Diab, A.A.; Kuznetsov, O.N.; Ali, Z.M.; Abdalla, O. Evaluation of the impact of high penetration levels of PV power plants on the capacity, frequency and voltage stability of Egypt’s unified grid. Energies 2019, 12, 552. [Google Scholar] [CrossRef] [Green Version]
- Salah Saidi, A. Impact of grid-tied photovoltaic systems on voltage stability of tunisian distribution networks using dynamic reactive power control. Ain Shams Eng. J. 2021, 13, 101537. [Google Scholar] [CrossRef]
- Adetokun, B.B.; Muriithi, C.M. Impact of integrating large-scale DFIG-based wind energy conversion system on the voltage stability of weak national grids: A case study of the Nigerian power grid. Energy Rep. 2021, 7, 654–666. [Google Scholar] [CrossRef]
- Feilat, E.A.; Azzam, S.; Al-Salaymeh, A. Impact of large PV and wind power plants on voltage and frequency stability of Jordan’s national grid. Sustain. Cities Soc. 2018, 36, 257–271. [Google Scholar] [CrossRef]
- Mokeke, S.; Thamae, L.Z. The impact of intermittent renewable energy generators on Lesotho national electricity grid. Electr. Power Syst. Res. 2021, 196, 107196. [Google Scholar] [CrossRef]
- Inman, R.H.; Pedro, H.T.C.; Coimbra, C.F.M. Solar forecasting methods for renewable energy integration. Prog. Energy Combust. Sci. 2013, 39, 535–576. [Google Scholar] [CrossRef]
- De Alencar, D.B.; De Mattos Affonso, C.; De Oliveira, R.C.L.; Rodríguez, J.L.M.; Leite, J.C.; Filho, J.C.R. Different Models for Forecasting Wind Power Generation: Case Study. Energies 2017, 10, 1976. [Google Scholar] [CrossRef] [Green Version]
- Prajapati, V.K.; Mahajan, V. Reliability assessment and congestion management of power system with energy storage system and uncertain renewable resources. Energy 2021, 215, 119134. [Google Scholar] [CrossRef]
- Karystianos, M.E.; Pitas, C.N.; Efstathiou, S.P.; Tsili, M.A.; Mantzaris, J.C.; Leonidaki, E.A.; Voumvoulakis, E.M.; Sakellaridis, N.G. Planning of aegean archipelago interconnections to the continental power system of Greece. Energies 2021, 14, 3818. [Google Scholar] [CrossRef]
- Tumiran; Putranto, L.M.; Irnawan, R.; Sarjiya; Priyanto, A.; Isnandar, S.; Savitri, I. Transmission expansion planning for the optimization of renewable energy integration in the sulawesi electricity system. Sustainability 2021, 13, 477. [Google Scholar] [CrossRef]
- Blaabjerg, F.; Yang, Y.; Ma, K.; Wang, X. Power electronics-the key technology for renewable energy system integration. In Proceedings of the 2015 International Conference on Renewable Energy Research and Applications (ICRERA), Palermo, Italy, 22–25 November 2015; IEEE: Piscataway, NJ, USA, 2015; pp. 1618–1626. [Google Scholar]
- Şahin, M.E.; Blaabjerg, F. A hybrid PV-battery/supercapacitor system and a basic active power control proposal in MATLAB/Simulink. Electronics 2020, 9, 129. [Google Scholar] [CrossRef] [Green Version]
- Behabtu, H.A.; Messagie, M.; Coosemans, T.; Berecibar, M.; Fante, K.A.; Kebede, A.A.; Van Mierlo, J. A review of energy storage technologies’ application potentials in renewable energy sources grid integration. Sustainability 2020, 12, 511. [Google Scholar] [CrossRef]
- Aksoy, A.; Nuroğlu, F.M. Estimation of Voltage Profile and Short-Circuit Currents for a Real Substation Distribution System. Turk. J. Electromechanics Energy 2018, 3, 22–27. [Google Scholar]
- Omara, M.A.; Nassar, I.A. Voltage quality in delta Egypt network and its impact in oil industry. Energy Rep. 2019, 5, 29–36. [Google Scholar] [CrossRef]
- Kwon, H.-I.; Cho, Y.-S.; Choi, S.-M. A Study on Optimal Power System Reinforcement Measures Following Renewable Energy Expansion. Energies 2020, 13, 5929. [Google Scholar] [CrossRef]
- Amaral, T.S.; Gomes, S.; Borges, C.L.T. Reliability evaluation of bulk power systems with wind generation using small signal stability analysis. Int. J. Electr. Power Energy Syst. 2021, 129, 106840. [Google Scholar] [CrossRef]
- Badan Pusat Statistik Provinsi Maluku [Central Bureau of Statistics of Maluku Province] Penduduk Provinsi Maluku Menurut Kabupaten/Kota, 1961–2020 [Population of Maluku Province by Regency/City, 1961–2020]. Available online: https://maluku.bps.go.id/ (accessed on 16 February 2022).
- Tumiran; Na’Iem, M.; Sarjiya; Putranto, L.M.; Listyanto, T.; Priyanto, A.; Muthahhari, A.A.; Budi, R.F.S. Potential of Biomass as RE Source for Sustainable Electricity Supply in Eastern Indonesia. In Proceedings of the 2021 3rd International Conference on High Voltage Engineering and Power Systems (ICHVEPS), Bandung, Indonesia, 5–6 October 2021; IEEE: Piscataway, NJ, USA, 2021; pp. 22–27. [Google Scholar]
- Koltsaklis, N.E.; Dagoumas, A.S. State-of-the-art generation expansion planning: A review. Appl. Energy 2018, 230, 563–589. [Google Scholar] [CrossRef]
- DIgSILENT GmbH Power Factory Applications. Available online: https://www.digsilent.de/en/powerfactory.html (accessed on 6 January 2022).
- PT PLN (Persero). Tegangan-Tegangan Standar [Standard Voltages]; PT PLN (Persero): Jakarta, Indonesia, 1995. [Google Scholar]
- Central Electricity Authority. Manual on Transmission Planning Criteria; Central Electricity Authority: New Delhi, India, 2013. [Google Scholar]
- Wijoyo, Y.S.; Delpiero, M.R.; Rosyied, M.A. Analisis Teknis Implementasi Power Wheeling di Jaringan Interkoneksi Sistem Barito [Technical Analysis of Power Wheeling Implementation in the Barito System Interconnection Network]. J. Nas. Tek. Elektro Teknol. Inf. Natl. J. Electr. Eng. Inf. Technol. 2018, 7, 356–361. [Google Scholar]
- de Metz-Noblat, B.; Dumas, F.; Poulain, C. Calculation of short-circuit currents. In Cahier technique; Electric, S., Ed.; Schneider Electric: Grenoble, France, 2005. [Google Scholar]
- Kundur, P.; Paserba, J.; Ajjarapu, V.; Andersson, G.; Bose, A.; Canizares, C.; Hatziargyriou, N.; Hill, D.; Stankovic, A.; Taylor, C.; et al. Definition and Classification of Power System Stability IEEE/CIGRE Joint Task Force on Stability Terms and Definitions. IEEE Trans. Power Syst. 2004, 19, 1387–1401. [Google Scholar] [CrossRef]
- Kementerian Energi dan Sumber Daya Mineral [Ministry of Energy and Mineral Resources Republic of Indonesia]. Peraturan Menteri Energi dan Sumber Daya Mineral Republik Indonesia Nomor 20 Tahun 2020 tentang Aturan Jaringan Sistem Tenaga Listrik (Grid Code) [Regulation of The Minister of Energy and Mineral Resources of The Republic of Indonesia No. 20 Year 2020 abo. 2020. Available online: https://jdih.esdm.go.id/storage/document/PM%20ESDM%20No%2020%20Tahun%202020.pdf (accessed on 4 January 2022).
- Eremia, M.; Shahidehpour, M. (Eds.) Handbook of Electrical Power System Dynamics: Modeling, Stability, and Control; John Wiley & Sons, Inc.: Hoboken, NJ, USA, 2013; ISBN 9781118497173. [Google Scholar]
- Al-Hamadi, H.M.; Soliman, S.A. Long-term/mid-term electric load forecasting based on short-term correlation and annual growth. Electr. Power Syst. Res. 2005, 74, 353–361. [Google Scholar] [CrossRef]
- Tumiran; Sarjiya; Putranto, L.M.; Putra, E.N.; Budi, R.F.S.; Nugraha, C.F. Long-Term Electricity Demand Forecast Using Multivariate Regression and End-Use Method: A Study Case of Maluku-Papua Electricity System. In Proceedings of the 2021 International Conference on Technology and Policy in Energy and Electric Power, Jakarta, Indonesia, 29–30 September 2021. [Google Scholar]


| Consumer Group | Annual Energy Sales (GWh) |
|---|---|
| Household | 103,733 |
| Industry | 77,879 |
| Business | 46,901 |
| Social | 8622 |
| Others | 8383 |
| Renewable Energy Source | Amount of Potential (MW) |
|---|---|
| Hydro | 109.6 |
| Wind | 404.8 |
| Solar | 496,587.9 |
| Biomass | 18,385.3 |
| Voltage Level (kV) | Critical Clearing Time (ms) |
|---|---|
| 66 | 150 |
| 150 | 120 |
| 275 | 100 |
| Year | Total Capacity of Power Plant (MW) | ||||||
|---|---|---|---|---|---|---|---|
| Gas-Machine | Steam | Geothermal | Biomass | Hydro | Wind | Solar | |
| 2020 | 129 | 0 | 0 | 0 | 0 | 0 | 0 |
| 2025 | 125 | 50 | 7 | 6 | 18.6 | 0 | 0 |
| 2030 | 125 | 80 | 7 | 6 | 72.6 | 0 | 0 |
| 2035 | 125 | 80 | 7 | 6 | 72.6 | 0 | 0 |
| 2040 | 125 | 80 | 7 | 6 | 72.6 | 37.7 | 3 |
| 2045 | 122.5 | 80 | 7 | 49 | 72.6 | 50.6 | 21.4 |
| Year | Total Energy of Power Plant (GWh) | ||||||
|---|---|---|---|---|---|---|---|
| Gas-Machine | Steam | Geothermal | Biomass | Hydro | Wind | Solar | |
| 2020 | 439.9 | 0.0 | 0.0 | 0.0 | 0.0 | 0.0 | 0.0 |
| 2025 | 241.0 | 306.6 | 36.8 | 36.8 | 105.9 | 0.0 | 0.0 |
| 2030 | 117.3 | 490.5 | 35.7 | 36.8 | 247.8 | 0.0 | 0.0 |
| 2035 | 282.0 | 491.2 | 36.8 | 36.9 | 272.3 | 0.0 | 0.0 |
| 2040 | 339.0 | 515.7 | 39.1 | 39.2 | 319.5 | 66.7 | 3.2 |
| 2045 | 327.0 | 502.3 | 37.8 | 312.5 | 301.9 | 58.0 | 18.3 |
| From Bus | To Bus | Year Built | Length (Circuit km) |
|---|---|---|---|
| Piru | Kairatu | 2020 | 110 |
| Masohi | Kairatu | 2020 | 210 |
| Piru | Taniwel | 2022 | 60 |
| Passo | Sirimau | 2025 | 12 |
| Waai | Haruku | 2025 | 30 |
| Haruku | Saparua | 2025 | 48 |
| Kairatu | Saparua | 2025 | 40 |
| Year | Installed Capacity (MW) | |||||||||
|---|---|---|---|---|---|---|---|---|---|---|
| Waai | Passo | Sirimau | Wayame | Haruku | Saparua | Kairatu | Piru | Taniwel | Masohi | |
| 2020 | 60 | 27 | 0 | 0 | 0.3 | 3 | 0 | 4.5 | 0 | 0 |
| 2025 | 10 | 27 | 0 | 3 | 1.3 | 5.3 | 0 | 19 | 0 | 0 |
| 2030 | 15 | 27 | 0 | 3 | 1.3 | 5.5 | 0 | 19 | 1.5 | 0 |
| 2035 | 15 | 27 | 0 | 3 | 1.3 | 5.5 | 0 | 19 | 1.5 | 0 |
| 2040 | 15 | 27 | 74 | 3 | 4.3 | 26.4 | 0 | 30 | 1.5 | 0 |
| 2045 | 55.4 | 439.1 | 187 | 153 | 20.3 | 33.9 | 140 | 25.5 | 5.4 | 95.2 |
| Year | Installed Capacity (MW) | |||||||||
|---|---|---|---|---|---|---|---|---|---|---|
| Waai | Passo | Sirimau | Wayame | Haruku | Saparua | Kairatu | Piru | Taniwel | Masohi | |
| 2020 | 0 | 22.1 | 34.3 | 13.7 | 0 | 3.1 | 4.1 | 3.1 | 0 | 7.5 |
| 2025 | 0 | 29.4 | 44.2 | 21.5 | 1.6 | 4.4 | 5.7 | 4.3 | 1.3 | 10.4 |
| 2030 | 0 | 36.9 | 54.2 | 30.5 | 2.1 | 6 | 8.3 | 5.6 | 1.7 | 13.4 |
| 2035 | 0 | 44.6 | 65.3 | 40.7 | 2.5 | 8.1 | 12.9 | 7.1 | 2.1 | 15.8 |
| 2040 | 0 | 52.9 | 77.1 | 53.1 | 2.9 | 10.8 | 19.1 | 8.9 | 2.4 | 18.2 |
| 2045 | 0 | 61.7 | 85 | 67.8 | 3.1 | 14 | 27.3 | 11 | 2.7 | 20.6 |
| Analysis | Parameter | Planning Period | ||||||
|---|---|---|---|---|---|---|---|---|
| 2020 | 2025 | 2030 | 2035 | 2040 | 2045 | 2050 | ||
| Load flow under normal conditions | Voltage profile | Meets the limit of 0.9–1.05 p.u. | ||||||
| Difference in the voltage angle between substations | Less than 30° | |||||||
| Loading of the transformer and transmission line | Less than 80% | |||||||
| Load flow under a Contingency of the N-1 line | Voltage profile | Meets the limit of 0.9–1.05 p.u. | ||||||
| Difference in the voltage angle between the substations | Less than 30° | |||||||
| Loading of the transformer and transmission line | Less than 100% | |||||||
| Short circuit | Symmetrical short-circuit current | Less than 30 kA | ||||||
| Voltage stability | Operating point | Load demand of less than 90% of | ||||||
| Frequency stability | Frequency nadir | Above 49.5 Hz | ||||||
| Transient stability | CCT | Longer than 120 ms | ||||||
Publisher’s Note: MDPI stays neutral with regard to jurisdictional claims in published maps and institutional affiliations. |
© 2022 by the authors. Licensee MDPI, Basel, Switzerland. This article is an open access article distributed under the terms and conditions of the Creative Commons Attribution (CC BY) license (https://creativecommons.org/licenses/by/4.0/).
Share and Cite
Tumiran, T.; Putranto, L.M.; Irnawan, R.; Sarjiya, S.; Nugraha, C.F.; Priyanto, A.; Savitri, I. Power System Planning Assessment for Optimizing Renewable Energy Integration in the Maluku Electricity System. Sustainability 2022, 14, 8436. https://doi.org/10.3390/su14148436
Tumiran T, Putranto LM, Irnawan R, Sarjiya S, Nugraha CF, Priyanto A, Savitri I. Power System Planning Assessment for Optimizing Renewable Energy Integration in the Maluku Electricity System. Sustainability. 2022; 14(14):8436. https://doi.org/10.3390/su14148436
Chicago/Turabian StyleTumiran, Tumiran, Lesnanto Multa Putranto, Roni Irnawan, Sarjiya Sarjiya, Candra Febri Nugraha, Adi Priyanto, and Ira Savitri. 2022. "Power System Planning Assessment for Optimizing Renewable Energy Integration in the Maluku Electricity System" Sustainability 14, no. 14: 8436. https://doi.org/10.3390/su14148436
APA StyleTumiran, T., Putranto, L. M., Irnawan, R., Sarjiya, S., Nugraha, C. F., Priyanto, A., & Savitri, I. (2022). Power System Planning Assessment for Optimizing Renewable Energy Integration in the Maluku Electricity System. Sustainability, 14(14), 8436. https://doi.org/10.3390/su14148436