
Private Firm Support for Circular Economy Regulation in the EU Policy Context

Abstract
:1. Introduction
2. Literature and Theoretical Background
2.1. Circular Economy
2.2. Corporate Political Activities
2.3. Resource-Based View
3. Development of Hypotheses
4. Research Methods
4.1. Data Collection
4.2. Measures
4.2.1. Dependent Variable
4.2.2. Independent Variables
4.2.3. Controls
4.3. Data Analysis Approach
5. Results
5.1. Descriptive Statistics
5.2. Results of Hypotheses Tests

| Control-Variable Model | IV-Only Model | Base Model | Interaction Model | |
|---|---|---|---|---|
| Intercept | 20.61 *** (1.41) | 22.43 *** (0.68) | 25.12 *** (1.61) | 23.43 *** (1.63) |
| Diversification | 0.1 (0.38) | 0.01 (0.37) | 0.16 (0.35) | |
| EUorNot | −0.93 (1.29) | −2.80 ** (1.30) | −1.76 (1.32) | |
| Employees | −0.47 *** (0.11) | −0.51 *** (0.11) | −0.42 *** (0.16) | |
| SlackResources | 0 (0) | 0 (0) | 0 (0) | |
| SC Position | −0.66 (1.55) | −0.98 (1.56) | 2.32 (1.81) | |
| Quoted | 20.99 *** (7.70) | |||
| Employees × Quoted | −2.12 ** (0.74) | |||
| SlackResources × Quoted | 0.01 (0.03) | |||
| SlackResources × SC Position | −0.05 ** (0.02) | |||
| R2 | 0 | 0.14 | 0.18 | 0.27 |
| Adj.R2 | −0.01 | 0.12 | 0.14 | 0.21 |
| Num.obs. | 142 | 124 | 124 | 124 |
5.3. Tests for Robustness
6. Discussion
6.1. Theoretical Implications
6.2. Practical Implications
7. Limitations and Future Research
8. Conclusions
Funding
Institutional Review Board Statement
Informed Consent Statement
Data Availability Statement
Conflicts of Interest
References
- European Commission. The European Green Deal. 2019. Available online: https://ec.europa.eu/info/sites/info/files/european-green-deal-communication_en.pdf (accessed on 20 September 2020).
- EU. A New Circular Economy Action Plan For a Cleaner and More Competitive Europe. 2020. Available online: https://eur-lex.europa.eu/legal-content/EN/TXT/?uri=COM%3A2020%3A98%3AFIN (accessed on 20 September 2020).
- WBCSD. Unlocking Systems Transformation (Vision 2050)—World Business Council for Sustainable Development (WBCSD). 2020. Available online: https://www.wbcsd.org/Overview/Resources/General/Unlocking-systems-transformation (accessed on 22 February 2021).
- Ellen MacArthur Foundation. Growth Within: A Circular Economy Vision For A Competitive Europe; Ellen MacArthur Foundation: Cowes, UK, 2015; p. 100. [Google Scholar]
- Whiteman, G.; Walker, B.; Perego, P. Planetary Boundaries: Ecological Foundations for Corporate Sustainability. J. Manag. Stud. 2013, 50, 307–336. [Google Scholar] [CrossRef]
- Kirchherr, J.; Piscicelli, L.; Bour, R.; Kostense-Smit, E.; Muller, J.; Huibrechtse-Truijens, A.; Hekkert, M. Barriers to the Circular Economy: Evidence from the European Union (EU). Ecol. Econ. 2018, 150, 264–272. [Google Scholar] [CrossRef] [Green Version]
- Kennard, A. The Enemy of My Enemy: When Firms Support Climate Change Regulation. Int. Organ. 2020, 74, 187–221. [Google Scholar] [CrossRef] [Green Version]
- Vishwanathan, P.; Van Oosterhout, H.J.; Heugens, P.P.M.A.R.; Duran, P.; Van Essen, M. Strategic CSR: A Concept Building Meta-Analysis. J. Manag. Stud. 2020, 57, 314–350. [Google Scholar] [CrossRef] [Green Version]
- Bocken, N.; Strupeit, L.; Whalen, K.; Nußholz, J. A Review and Evaluation of Circular Business Model Innovation Tools. Sustainability 2019, 11, 2210. [Google Scholar] [CrossRef] [Green Version]
- Mishra, J.L.; Chiwenga, K.D.; Ali, K. Collaboration as an enabler for circular economy: A case study of a developing country. Manag. Decis. 2019, 59, 1784–1800. [Google Scholar] [CrossRef]
- Morone, P.; Yilan, G. A paradigm shift in sustainability: From lines to circles. Acta Innov. 2020, 36, 5–16. [Google Scholar] [CrossRef]
- Geisendorf, S.; Pietrulla, F. The circular economy and circular economic concepts—A literature analysis and redefinition. Thunderbird Int. Bus. Rev. 2018, 60, 771–782. [Google Scholar] [CrossRef]
- Corona, B.; Shen, L.; Reike, D.; Carreón, J.R.; Worrell, E. Towards sustainable development through the circular economy—A review and critical assessment on current circularity metrics. Resour. Conserv. Recycl. 2019, 151, 104498. [Google Scholar] [CrossRef]
- McDowall, W.; Geng, Y.-J.; Huang, B.; Barteková, E.; Bleischwitz, R.; Türkeli, S.; Kemp, R.; Doménech, T. Circular Economy Policies in China and Europe. J. Ind. Ecol. 2017, 21, 651–661. [Google Scholar] [CrossRef] [Green Version]
- Donner, M.; Verniquet, A.; Broeze, J.; Kayser, K.; De Vries, H. Critical success and risk factors for circular business models valorising agricultural waste and by-products. Resour. Conserv. Recycl. 2021, 165, 105236. [Google Scholar] [CrossRef]
- Pieroni, M.P.P.; McAloone, T.C.; Pigosso, D.C.A. Business model innovation for circular economy and sustainability: A review of approaches. J. Clean. Prod. 2019, 215, 198–216. [Google Scholar] [CrossRef]
- Konietzko, J.; Bocken, N.; Hultink, E.J. Circular ecosystem innovation: An initial set of principles. J. Clean. Prod. 2020, 253, 119942. [Google Scholar] [CrossRef]
- Kanda, W.; Geissdoerfer, M.; Hjelm, O. From circular business models to circular business ecosystems. Bus. Strateg. Environ. 2021, 30, 2814–2829. [Google Scholar] [CrossRef]
- Anastasiadis, S. Toward a View of Citizenship and Lobbying. Bus. Soc. 2014, 53, 260–299. [Google Scholar] [CrossRef]
- Scherer, A.G.; Palazzo, G.; Matten, D. The Business Firm as a Political Actor: A New Theory of the Firm for a Globalized World. Bus. Soc. 2014, 53, 143–156. [Google Scholar] [CrossRef]
- Pearce, D.W.; Turner, R.K. Economics of Natural Resources and the Environment; John Hopkins University Press: Baltimore, MD, USA, 1990. [Google Scholar]
- Boulding, K. The Economics of the Coming Spaceship Earth; Earthscan Publications Ltd: New York, NY, USA, 1966. [Google Scholar]
- Stahel, W.R.; Reday, G. Jobs for Tomorrow, the Potential for Substituting Manpower for Energy; Vantage Press: New York, NY, USA, 1981. [Google Scholar]
- Erkman, S. Industrial ecology: An historical view. J. Clean. Prod. 1997, 5, 1–10. [Google Scholar] [CrossRef]
- Graedel, E.T.; Allenby, B.R. Industrial Ecology; AT & T Prentice-Hall: Hoboken, NJ, USA, 1995. [Google Scholar]
- Ayres, R.U.; Ayres, L.W. Industrial Ecology; Edward Elgar: Cheltenham, UK, 1996; Available online: https://ideas.repec.org/b/elg/eebook/915.html (accessed on 25 November 2020).
- Braungart, M.; McDonough, W.; Bollinger, A. Cradle-to-cradle design: Creating healthy emissions—A strategy for eco-effective product and system design. J. Clean. Prod. 2007, 15, 1337–1348. [Google Scholar] [CrossRef]
- Mcdonough, W.; Braungart, M. Cradle to Cradle: Remaking the Way We Make Things; North Point Press: New York, NY, USA, 2010. [Google Scholar]
- Bocken, N.; de Pauw, I.; Bakker, C.; van der Grinten, B. Product design and business model strategies for a circular economy. J. Ind. Prod. Eng. 2016, 33, 308–320. [Google Scholar] [CrossRef] [Green Version]
- Lewandowski, M. Designing the business models for circular economy-towards the conceptual framework. Sustainability 2016, 8, 43. [Google Scholar] [CrossRef] [Green Version]
- Lüdeke-Freund, F.; Gold, S.; Bocken, N. A Review and Typology of Circular Economy Business Model Patterns. J. Ind. Ecol. 2019, 23, 36–61. [Google Scholar] [CrossRef] [Green Version]
- Rizos, V.; Behrens, A.; Van Der Gaast, W.; Hofman, E.; Ioannou, A.; Kafyeke, T.; Flamos, A.; Rinaldi, R.; Papadelis, S.; Hirschnitz-Garbers, M.; et al. Implementation of Circular Economy Business Models by Small and Medium-Sized Enterprises (SMEs): Barriers and Enablers. Sustainability 2016, 8, 1212. [Google Scholar] [CrossRef] [Green Version]
- Evans, S.; Vladimirova, D.; Holgado, M.; Van Fossen, K.; Yang, M.; Silva, E.A.; Barlow, C.Y. Business Model Innovation for Sustainability: Towards a Unified Perspective for Creation of Sustainable Business Models. Bus. Strat. Environ. 2017, 26, 597–608. [Google Scholar] [CrossRef]
- Bocken, N.; Miller, K.; Evans, S. Assessing the environmental impact of new Circular business models. In Proceedings of the “New Business Models”—Exploring a Changing View on Organizing Value Creation, Toulouse, France, 16–17 June 2016. [Google Scholar]
- Bocken, N.M.P.; Short, S.W.; Rana, P.; Evans, S. A literature and practice review to develop sustainable business model archetypes. J. Clean. Prod. 2014, 65, 42–56. [Google Scholar] [CrossRef] [Green Version]
- Manninen, K.; Koskela, S.; Antikainen, R.; Bocken, N.; Dahlbo, H.; Aminoff, A. Do circular economy business models capture intended environmental value propositions? J. Clean. Prod. 2018, 171, 413–422. [Google Scholar] [CrossRef] [Green Version]
- Geissdoerfer, M.; Pieroni, M.P.P.; Pigosso, D.C.A.; Soufani, K. Circular business models: A review. J. Clean. Prod. 2020, 277, 123741. [Google Scholar] [CrossRef]
- Pietrulla, F.; Frankenberger, K. A research model for circular business models—Antecedents, moderators, and outcomes. Sustain. Futur. 2022, 4, 100084. [Google Scholar] [CrossRef]
- Geissdoerfer, M.; Savaget, P.; Bocken, N.; Hultink, E.J. The circular economy—A new sustainability paradigm? J. Clean. Prod. 2017, 143, 757–768. [Google Scholar] [CrossRef] [Green Version]
- Kirchherr, J.; Reike, D.; Hekkert, M. Conceptualizing the circular economy: An analysis of 114 definitions. Resour. Conserv. Recycl. 2017, 127, 221–232. [Google Scholar] [CrossRef]
- Ghisellini, P.; Cialani, C.; Ulgiati, S. A Review on Circular Economy: The Expected Transition to a Balanced Interplay of Environmental and Economic Systems. J. Clean. Prod. 2016, 114, 11–32. [Google Scholar] [CrossRef]
- Padilla-Rivera, A.; Russo-Garrido, S.; Merveille, N. Addressing the Social Aspects of a Circular Economy: A Systematic Literature Review. Sustainability 2020, 12, 7912. [Google Scholar] [CrossRef]
- Ghisellini, P.; Ripa, M.; Ulgiati, S. Exploring environmental and economic costs and benefits of a circular economy approach to the construction and demolition sector. A literature review. J. Clean. Prod. 2018, 178, 618–643. [Google Scholar] [CrossRef]
- Saidani, M.; Yannou, B.; Leroy, Y.; Cluzel, F.; Kendall, A. A taxonomy of circular economy indicators. J. Clean. Prod. 2019, 207, 542–559. [Google Scholar] [CrossRef] [Green Version]
- Saidani, M.; Kim, H.; Cluzel, F.; Leroy, Y.; Yannou, B. Product Circularity Indicators: What Contributions in Designing for a Circular Economy? In Proceedings of the Design Society: DESIGN Conference, Cavtat, Croatia, 26–29 October 2020; pp. 2129–2138. [Google Scholar] [CrossRef]
- Elia, V.; Gnoni, M.G.; Tornese, F. Measuring circular economy strategies through index methods: A critical analysis. J. Clean. Prod. 2017, 142, 2741–2751. [Google Scholar] [CrossRef]
- Bassi, A.M.; Bianchi, M.; Guzzetti, M.; Pallaske, G.; Tapia, C. Improving the understanding of circular economy potential at territorial level using systems thinking. Sustain. Prod. Consum. 2021, 27, 128–140. [Google Scholar] [CrossRef]
- Drejerska, N.; Vrontis, D.; Siachou, E.; Golebiewski, J. System solutions for the circular economy on the regional level: The case of Green Lungs of Poland. J. Glob. Bus. Adv. 2020, 13, 447. [Google Scholar] [CrossRef]
- Golębiewska, B. Changes in the management of municipal waste in Poland—Towards the circular economy. In Proceedings of the International Scientific Conference Rural Development, Kaunas, Lituania, 23–24 November 2017; pp. 272–277. [Google Scholar] [CrossRef] [Green Version]
- Ghimire, S.; Flury, M.; Scheenstra, E.J.; Miles, C.A. Sampling and degradation of biodegradable plastic and paper mulches in field after tillage incorporation. Sci. Total Environ. 2020, 703, 135577. [Google Scholar] [CrossRef]
- Redlingshöfer, B.; Barles, S.; Weisz, H. Are waste hierarchies effective in reducing environmental impacts from food waste? A systematic review for OECD countries. Resour. Conserv. Recycl. 2020, 156, 104723. [Google Scholar] [CrossRef]
- Calisto Friant, M.; Vermeulen, W.J.V.; Salomone, R. Analysing European Union circular economy policies: Words versus actions. Sustain. Prod. Consum. 2021, 27, 337–353. [Google Scholar] [CrossRef]
- Baron, D.P. Integrated Strategy: Market and Nonmarket Components. Calif. Manag. Rev. 1995, 37, 47–65. [Google Scholar] [CrossRef]
- Lux, S.; Crook, T.R.; Woehr, D.J. Mixing Business with Politics: A Meta-Analysis of the Antecedents and Outcomes of Corporate Political Activity. J. Manag. 2011, 37, 223–247. [Google Scholar] [CrossRef]
- Mellahi, K.; Frynas, J.G.; Sun, P.; Siegel, D. A Review of the Nonmarket Strategy Literature. J. Manag. 2016, 42, 143–173. [Google Scholar] [CrossRef] [Green Version]
- Hillman, A.J.; Keim, G.D.; Schuler, D. Corporate Political Activity: A Review and Research Agenda. J. Manag. 2004, 30, 837–857. [Google Scholar] [CrossRef]
- Scherer, A.G.; Rasche, A.; Palazzo, G.; Spicer, A. Managing for Political Corporate Social Responsibility: New Challenges and Directions for PCSR 2.0. J. Manag. Stud. 2016, 53, 273–298. [Google Scholar] [CrossRef] [Green Version]
- Lawton, T.; McGuire, S.; Rajwani, T. Corporate Political Activity: A Literature Review and Research Agenda. Int. J. Manag. Rev. 2013, 15, 86–105. [Google Scholar] [CrossRef] [Green Version]
- Barley, S.R. Building an Institutional Field to Corral a Government: A Case to Set an Agenda for Organization Studies. Organ. Stud. 2010, 31, 777–805. [Google Scholar] [CrossRef]
- Yllström, A.; Murray, J. Lobbying the Client: The role of policy intermediaries in corporate political activity. Organ. Stud. 2019, 42, 971–991. [Google Scholar] [CrossRef]
- Aguinis, H.; Glavas, A. What We Know and Don’t Know About Corporate Social Responsibility. J. Manag. 2012, 38, 932–968. [Google Scholar] [CrossRef] [Green Version]
- Aguinis, H. Organizational Responsibility: Doing Good and Doing Well. In APA Handbook of Industrial and Organizational Psychology, Vol 3: Maintaining, Expanding, and Contracting the Organization; Zedeck, S., Ed.; American Psychological Association: Washington, DC, USA, 2011; pp. 855–879. [Google Scholar] [CrossRef] [Green Version]
- Helmig, B.; Spraul, K.; Ingenhoff, D. Under Positive Pressure. Bus. Soc. 2016, 55, 151–187. [Google Scholar] [CrossRef]
- Mathiyazhagan, K.; Diabat, A.; Al-Refaie, A.; Xu, L. Application of analytical hierarchy process to evaluate pressures to implement green supply chain management. J. Clean. Prod. 2015, 107, 229–236. [Google Scholar] [CrossRef]
- Ambec, S.; Lanoie, P. Does It Pay to Be Green? A Systematic Overview. Acad. Manag. Perspect. 2008, 22, 45–62. [Google Scholar] [CrossRef] [Green Version]
- Flammer, C. Corporate Social Responsibility and Shareholder Reaction: The Environmental Awareness of Investors. Acad. Manag. J. 2013, 56, 758–781. [Google Scholar] [CrossRef] [Green Version]
- Stoian, C.; Gilman, M. Corporate Social Responsibility That “Pays”: A Strategic Approach to CSR for SMEs. J. Small Bus. Manag. 2017, 55, 5–31. [Google Scholar] [CrossRef]
- Choi, T.-M.; Taleizadeh, A.A.; Yue, X. Game theory applications in production research in the sharing and circular economy era. Int. J. Prod. Res. 2020, 58, 118–127. [Google Scholar] [CrossRef] [Green Version]
- Palafox-Alcantar, P.G.; Hunt, D.V.L.; Rogers, C.D.F. The complementary use of game theory for the circular economy: A review of waste management decision-making methods in civil engineering. Waste Manag. 2020, 102, 598–612. [Google Scholar] [CrossRef]
- Younis, H.; Sundarakani, B.; Vel, P. The impact of implementing green supply chain management practices on corporate performance. Compet. Rev. Int. Bus. J. 2016, 26, 216–245. [Google Scholar] [CrossRef]
- Schmidt, C.G.; Foerstl, K.; Schaltenbrand, B. The Supply Chain Position Paradox: Green Practices and Firm Performance. J. Supply Chain Manag. 2017, 53, 3–25. [Google Scholar] [CrossRef]
- Chen, H.; Zeng, S.; Lin, H.; Ma, H. Munificence, Dynamism, and Complexity: How Industry Context Drives Corporate Sustainability. Bus. Strat. Environ. 2017, 26, 125–141. [Google Scholar] [CrossRef]
- Wernerfelt, B. A resource-based view of the firm. Strat. Manag. J. 1984, 5, 171–180. [Google Scholar] [CrossRef]
- Barney, J.B. Resource-based theories of competitive advantage: A ten-year retrospective on the resource-based view. J. Manag. 2001, 27, 643–650. [Google Scholar] [CrossRef]
- Barney, J. Firm Resources and Sustained Competitive Advantage. J. Manag. 1991, 17, 99–120. [Google Scholar] [CrossRef]
- Prahalad, C.; Hamel, G. The Core Competence of the Corporation. Harv. Bus. Rev. 1990, 68, 79–91. [Google Scholar]
- Hart, S.L. A natural-resource-based view of the firm. Acad. Manag. Rev. 1995, 20, 986–1014. [Google Scholar] [CrossRef] [Green Version]
- Hart, S.L.; Dowell, G. Invited Editorial: A Natural-Resource-Based View of the Firm. J. Manag. 2011, 37, 1464–1479. [Google Scholar] [CrossRef]
- Chan, R.Y.K. Does the Natural-Resource-Based View of the Firm Apply in an Emerging Economy? A Survey of Foreign Invested Enterprises in China. J. Manag. Stud. 2005, 42, 625–672. [Google Scholar] [CrossRef]
- Portillo-Tarragona, P.; Scarpellini, S.; Moneva, J.M.; Valero-Gil, J.; Aranda-Usón, A. Classification and Measurement of the Firms’ Resources and Capabilities Applied to Eco-Innovation Projects from a Resource-Based View Perspective. Sustainability 2018, 10, 3161. [Google Scholar] [CrossRef] [Green Version]
- Teece, D.J. Explicating dynamic capabilities: The nature and microfoundations of (sustainable) enterprise performance. Strat. Manag. J. 2007, 28, 1319–1350. [Google Scholar] [CrossRef] [Green Version]
- Teece, D.J. Business models and dynamic capabilities. Long Range Plan. 2018, 51, 40–49. [Google Scholar] [CrossRef]
- Wang, C.L.; Ahmed, P.K. Dynamic capabilities: A review and research agenda. Int. J. Manag. Rev. 2007, 9, 31–51. [Google Scholar] [CrossRef]
- Teece, D.J.; Pisano, G.; Shuen, A. Dynamic Capabilities and Strategic Management. Strateg. Manag. J. 1997, 18, 509–533. [Google Scholar] [CrossRef]
- Khan, O.; Daddi, T.; Iraldo, F. The role of dynamic capabilities in circular economy implementation and performance of companies. Corp. Soc. Responsib. Environ. Manag. 2020, 27, 3018–3033. [Google Scholar] [CrossRef]
- Rodríguez-Antón, J.M.; Rubio-Andrada, L.; Celemín-Pedroche, M.S.; Ruíz-Peñalver, S.M. From the circular economy to the sustainable development goals in the European Union: An empirical comparison. Int. Environ. Agreem. Politi. Law Econ. 2021, 22, 67–95. [Google Scholar] [CrossRef] [PubMed]
- Friedman, M. The social responsibility of business is to increase its profits. In Corporate Ethics and Corporate Governance; Springer: Berlin/Heidelberg, Germany, 2007; pp. 173–178. [Google Scholar] [CrossRef]
- Bansal, P. Evolving sustainably: A longitudinal study of corporate sustainable development. Strat. Manag. J. 2005, 26, 197–218. [Google Scholar] [CrossRef]
- Gray, R.; Javad, M.; Power, D.M.; Sinclair, C.D. Social and Environmental Disclosure and Corporate Characteristics: A Research Note and Extension. J. Bus. Financ. Account. 2001, 28, 327–356. [Google Scholar] [CrossRef]
- Gallo, P.J.; Christensen, L.J. Firm Size Matters: An Empirical Investigation of Organizational Size and Ownership on Sustainability-Related Behaviors. Bus. Soc. 2011, 50, 315–349. [Google Scholar] [CrossRef]
- Shin, H.; Lee, J.-N.; Kim, D.; Rhim, H. Strategic agility of Korean small and medium enterprises and its influence on operational and firm performance. Int. J. Prod. Econ. 2015, 168, 181–196. [Google Scholar] [CrossRef]
- Lopez, F.J.D.; Bastein, T.; Tukker, A. Business Model Innovation for Resource-efficiency, Circularity and Cleaner Production: What 143 Cases Tell Us. Ecol. Econ. 2019, 155, 20–35. [Google Scholar] [CrossRef]
- Keivanpour, S.; Ait-Kadi, D.; Mascle, C. Automobile manufacturers’ strategic choice in applying green practices: Joint application of evolutionary game theory and fuzzy rule-based approach. Int. J. Prod. Res. 2016, 55, 1312–1335. [Google Scholar] [CrossRef]
- Hannan, M.T.; Freeman, J. Structural Inertia and Organizational Change. Am. Sociol. Rev. 1984, 49, 149–164. [Google Scholar] [CrossRef]
- Rajagopalan, N. Strategic orientations, incentive plan adoptions, and firm performance: Evidence from electric utility firms. Strat. Manag. J. 1997, 18, 761–785. [Google Scholar] [CrossRef]
- Pavlou, P.A.; El Sawy, O.A. Understanding the Elusive Black Box of Dynamic Capabilities. Decis. Sci. 2011, 42, 239–273. [Google Scholar] [CrossRef]
- Winter, S.G. Understanding dynamic capabilities. Strateg. Manag. J. 2003, 24, 991–995. [Google Scholar] [CrossRef] [Green Version]
- Zhang, Y.; Li, J.; Jiang, W.; Zhang, H.; Hu, Y.; Liu, M. Organizational structure, slack resources and sustainable corporate socially responsible performance. Corp. Soc. Responsib. Environ. Manag. 2018, 25, 1099–1107. [Google Scholar] [CrossRef]
- Loderer, C.; Waelchli, U. Protecting Minority Shareholders: Listed versus Unlisted Firms. Financ. Manag. 2010, 39, 33–57. [Google Scholar] [CrossRef]
- Buzby, S.L. Company Size, Listed Versus Unlisted Stocks, and the Extent of Financial Disclosure. J. Account. Res. 1975, 13, 16. [Google Scholar] [CrossRef]
- Brav, O. Access to Capital, Capital Structure, and the Funding of the Firm. J. Financ. 2009, 64, 263–308. [Google Scholar] [CrossRef]
- Gao, H.; Harford, J.; Li, K. Determinants of corporate cash policy: Insights from private firms. J. Financ. Econ. 2013, 109, 623–639. [Google Scholar] [CrossRef]
- George, G. Slack Resources and the Performance of Privately Held Firms. Acad. Manag. J. 2005, 48, 661–676. [Google Scholar] [CrossRef]
- Schoubben, F.; Van Hulle, C. The Determinants of Leverage; Differences between Quoted and Non Quoted Firms. Tijdschr. Voor Econ. En Manag. 2004, 49, 589–622. Available online: https://lirias.kuleuven.be/1665459?limo=0 (accessed on 4 December 2021).
- Lo, S.M. Effects of supply chain position on the motivation and practices of firms going green. Int. J. Oper. Prod. Manag. 2014, 34, 93–114. [Google Scholar] [CrossRef]
- Diabat, A.; Govindan, K. An analysis of the drivers affecting the implementation of green supply chain management. Resour. Conserv. Recycl. 2011, 55, 659–667. [Google Scholar] [CrossRef]
- Laari, S.; Töyli, J.; Ojala, L. Supply chain perspective on competitive strategies and green supply chain management strategies. J. Clean. Prod. 2017, 141, 1303–1315. [Google Scholar] [CrossRef]
- Min, H.; Galle, W.P. Green purchasing practices of US firms. Int. J. Oper. Prod. Manag. 2001, 21, 1222–1238. [Google Scholar] [CrossRef]
- Siano, A.; Vollero, A.; Conte, F.; Amabile, S. “More than words”: Expanding the taxonomy of greenwashing after the Volkswagen scandal. J. Bus. Res. 2017, 71, 27–37. [Google Scholar] [CrossRef]
- Harlow, W.F.; Brantley, B.C.; Harlow, R.M. BP initial image repair strategies after the Deepwater Horizon spill. Public Relati. Rev. 2011, 37, 80–83. [Google Scholar] [CrossRef]
- Che, X.; Katayama, H.; Lee, P. Willingness to Pay for Brand Reputation: Lessons from the Volkswagen Diesel Emissions Scandal; University of London: London, UK, 2020; Volume 2. [Google Scholar]
- Fernando, Y.; Bee, P.S.; Jabbour, C.J.C.; Thomé, A.M.T. Understanding the effects of energy management practices on renewable energy supply chains: Implications for energy policy in emerging economies. Energy Policy 2018, 118, 418–428. [Google Scholar] [CrossRef]
- Orbis. Company Information Across the Globe. BvD. 2021. Available online: https://orbis.bvdinfo.com/version-2021128/orbis/Companies/Login?returnUrl=%2Fversion-2021128%2Forbis%2FCompanies (accessed on 31 January 2021).
- Delgado, M.; Mills, K.G. The supply chain economy: A new industry categorization for understanding innovation in services. Res. Policy 2020, 49, 104039. [Google Scholar] [CrossRef]
- Peng, M.W.; Li, Y.; Xie, E.; Su, Z. CEO duality, organizational slack, and firm performance in China. Asia Pac. J. Manag. 2009, 27, 611–624. [Google Scholar] [CrossRef]
- NAICS. NAICS & SIC Identification Tools. NAICS Association. 2021. Available online: https://www.naics.com/search/ (accessed on 31 January 2021).
- Alabdullah, T.Y.T.; Laadjal, A.; Ries, E.A.; Al-Asadi, Y.A.A. Board Features and Capital Structure in Emerging Markets. J. Adv. Manag. Sci. 2018, 6, 74–80. [Google Scholar] [CrossRef] [Green Version]
- Seber, G.A.; Lee, A.J. Linear Regression Analysis; John Wiley & Sons: Hoboken, NJ, USA, 2012. [Google Scholar]
- Heckman, J.J. The common structure of statistical models of truncation, sample selection and limited dependent variables and a simple estimator for such models. Ann. Econ. Soc. Meas. 1976, 5, 475–492. [Google Scholar]
- Van Buuren, S.; Groothuis-Oudshoorn, K. mice: Multivariate Imputation by Chained Equations in R. J. Stat. Softw. 2011, 45, 1–67. [Google Scholar] [CrossRef] [Green Version]
- LLittle, R.J.A. Missing-Data Adjustments in Large Surveys. J. Bus. Econ. Stat. 1988, 6, 287–296. [Google Scholar] [CrossRef]
- Rubin, D.B. Multiple Imputation for Nonresponse in Surveys; John Wiley & Sons: Hoboken, NJ, USA, 2004; Volume 81, Available online: https://books.google.com/books?hl=en&lr=lang_en&id=bQBtw6rx_mUC&oi=fnd&pg=PR24&dq=Multiple+Imputation+for+Nonresponse+in+Surveys&ots=8PqL5M01fO&sig=aISiyCjaxCNgDDaSrfToK-YjGT8 (accessed on 3 November 2021).
- Rahman, M.M.; Govindarajulu, Z. A modification of the test of Shapiro and Wilk for normality. J. Appl. Stat. 1997, 24, 219–236. [Google Scholar] [CrossRef]
- Mardia, K.V. Measures of multivariate skewness and kurtosis with applications. Biometrika 1970, 57, 519–530. [Google Scholar] [CrossRef]
- Billingsley, P. Measure and Probability; John Wiley & Sons: Hoboken, NJ, USA, 1995. [Google Scholar]
- Sim, J.; Kim, B. Regulatory versus consumer pressure and retailer responsibility for upstream pollution in a supply chain. Omega 2021, 101, 102250. [Google Scholar] [CrossRef]
- Liu, Z.L.; Anderson, T.D.; Cruz, J.M. Consumer environmental awareness and competition in two-stage supply chains. Eur. J. Oper. Res. 2012, 218, 602–613. [Google Scholar] [CrossRef]
- Williams, M.; Grajales, C.; Kurkiewicz, D. Assumptions of multiple regression: Correcting two misconceptions. Pract. Assess. Res. Eval. 2019, 18, 1–14. [Google Scholar] [CrossRef]
- O’Brien, R.M. A Caution Regarding Rules of Thumb for Variance Inflation Factors. Qual. Quant. 2007, 41, 673–690. [Google Scholar] [CrossRef]
- Podsakoff, P.; MacKenzie, S.; Lee, J.; Podsakoff, N. Common method biases in behavioral research: A critical review of the literature and recommended remedies. J. Appl. Psychol. 2003, 88, 879–903. [Google Scholar] [CrossRef]
- Heckman, J.J. Sample selection bias as a specification error. Econom. J. Econom. Soc. 1979, 153–161. Available online: https://www.jstor.org/stable/1912352 (accessed on 4 December 2021). [CrossRef]
- Toomet, O.; Henningsen, A. Sample selection models in R: Package sampleSelection. J. Stat. Softw. 2008, 27, 1–23. Available online: https://scholar.google.com/ftp://ftp.univates.br/ensino/Softwares/Rmatemática/R/R-2.14.2/library/sampleSelection/doc/selection.pdf (accessed on 4 December 2021). [CrossRef] [Green Version]
- Koné, S.; Bonfoh, B.; Dao, D.; Koné, I.; Fink, G. Heckman-type selection models to obtain unbiased estimates with missing measures outcome: Theoretical considerations and an application to missing birth weight data. BMC Med. Res. Methodol. 2019, 19, 231. [Google Scholar] [CrossRef] [PubMed] [Green Version]
- Ismail, H.S.; Poolton, J.; Sharifi, H. The role of agile strategic capabilities in achieving resilience in manufacturing-based small companies. Int. J. Prod. Res. 2011, 49, 5469–5487. [Google Scholar] [CrossRef]
- Conforto, E.C.; Amaral, D.C.; da Silva, S.L.; Di Felippo, A.; Kamikawachi, D.S.L. The agility construct on project management theory. Int. J. Proj. Manag. 2016, 34, 660–674. [Google Scholar] [CrossRef]
- Aranda-Usón, A.; Portillo-Tarragona, P.; Marín-Vinuesa, L.; Scarpellini, S. Financial Resources for the Circular Economy: A Perspective from Businesses. Sustainability 2019, 11, 888. [Google Scholar] [CrossRef] [Green Version]
- Elsayed, K. Reexamining the Expected Effect of Available Resources and Firm Size on Firm Environmental Orientation: An Empirical Study of UK Firms. J. Bus. Ethic. 2006, 65, 297–308. [Google Scholar] [CrossRef]
- Bowen, F.E. Organizational Slack and Corporate Greening: Broadening the Debate. Br. J. Manag. 2002, 13, 305–316. [Google Scholar] [CrossRef]
- Darnall, N.; Henriques, I.; Sadorsky, P. Adopting Proactive Environmental Strategy: The Influence of Stakeholders and Firm Size. J. Manag. Stud. 2010, 47, 1072–1094. [Google Scholar] [CrossRef]
- Bozarth, C.C.; Warsing, D.P.; Flynn, B.B.; Flynn, E.J. The impact of supply chain complexity on manufacturing plant performance. J. Oper. Manag. 2009, 27, 78–93. [Google Scholar] [CrossRef]
- Lafontaine, F.; Slade, M. Vertical Integration and Firm Boundaries: The Evidence. J. Econ. Lit. 2007, 45, 629–685. [Google Scholar] [CrossRef] [Green Version]
- Howard-Grenville, J. ESG Impact Is Hard to Measure—But It’s Not Impossible. Harvard Business Review. 22 January 2021. Available online: https://hbr.org/2021/01/esg-impact-is-hard-to-measure-but-its-not-impossible (accessed on 5 December 2021).
- Cheng, B.; Ioannou, I.; Serafeim, G. Corporate social responsibility and access to finance. Strat. Manag. J. 2013, 35, 1–23. [Google Scholar] [CrossRef]
- Fiss, P.C. Building Better Causal Theories: A Fuzzy Set Approach to Typologies in Organization Research. Acad. Manag. J. 2011, 54, 393–420. [Google Scholar] [CrossRef] [Green Version]
- Robinson, C.; Schumacker, R.E. Interaction effects: Centering, variance inflation factor, and interpretation issues. Mult. Linear Regres. Viewp. 2009, 35, 6–11. Available online: http://citeseerx.ist.psu.edu/viewdoc/download?doi=10.1.1.620.5853&rep=rep1&type=pdf (accessed on 4 November 2021).
- Chan, H.K.; Yee, R.W.Y.; Dai, J.; Lim, M.K. The moderating effect of environmental dynamism on green product innovation and performance. Int. J. Prod. Econ. 2016, 181, 384–391. [Google Scholar] [CrossRef]
- Goll, I.; Rasheed, A.A. The Moderating Effect of Environmental Munificence and Dynamism on the Relationship Between Discretionary Social Responsibility and Firm Performance. J. Bus. Ethic. 2004, 49, 41–54. [Google Scholar] [CrossRef]
- Khan, S.A.R.; Ponce, P.; Thomas, G.; Yu, Z.; Al-Ahmadi, M.S.; Tanveer, M. Digital Technologies, Circular Economy Practices and Environmental Policies in the Era of COVID-19. Sustainability 2021, 13, 12790. [Google Scholar] [CrossRef]
- Ibn-Mohammed, T.; Mustapha, K.B.; Godsell, J.; Adamu, Z.; Babatunde, K.A.; Akintade, D.D.; Acquaye, A.; Fujii, H.; Ndiaye, M.M.; Yamoah, F.A.; et al. A critical analysis of the impacts of COVID-19 on the global economy and ecosystems and opportunities for circular economy strategies. Resour. Conserv. Recycl. 2021, 164, 105169. [Google Scholar] [CrossRef]
- Popescu, C.R.G. Sustainability Assessment: Does the OECD/G20 Inclusive Framework for BEPS (Base Erosion and Profit Shifting Project) Put an End to Disputes Over te Recognition and Measurement of Intellectual Capital? Sustainability 2020, 12, 4. [Google Scholar] [CrossRef]
- OECD. Sustainability Impact Assessment: An Introduction; OECD: Paris, France, 2010; Available online: https://www.oecd.org/greengrowth/48305527.pdf (accessed on 20 June 2022).
- Walls, J.L.; Berrone, P. The Power of One to Make a Difference: How Informal and Formal CEO Power Affect Environmental Sustainability. J. Bus. Ethic. 2017, 145, 293–308. [Google Scholar] [CrossRef]
- Lin, Y.; Shi, W.; Prescott, J.E.; Yang, H. In the Eye of the Beholder: Top Managers’ Long-Term Orientation, Industry Context, and Decision-Making Processes. J. Manag. 2019, 45, 3114–3145. [Google Scholar] [CrossRef]
- Burke, L.; Logsdon, J.M. How corporate social responsibility pays off. Long Range Plan. 1996, 29, 495–502. [Google Scholar] [CrossRef]
- Veenstra, E.M.; Ellemers, N. ESG Indicators as Organizational Performance Goals: Do Rating Agencies Encourage a Holistic Approach? Sustainability 2020, 12, 10228. [Google Scholar] [CrossRef]
- Wu, Y.; Zhang, K.; Xie, J. Bad Greenwashing, Good Greenwashing: Corporate Social Responsibility and Information Transparency. Manag. Sci. 2020, 66, 3095–3112. [Google Scholar] [CrossRef]
- Torelli, R.; Balluchi, F.; Lazzini, A. Greenwashing and environmental communication: Effects on stakeholders’ perceptions. Bus. Strat. Environ. 2020, 29, 407–421. [Google Scholar] [CrossRef] [Green Version]

| # | Question | Coding of Answers |
|---|---|---|
| 1 | Assess the importance of the following measure to promote circular economy principles in product design at the EU level: Establish binding rules on product design (e.g., minimum requirements on “durability” under Ecodesign Directive 2009/1). | From 5 = very important (highest support for CE regulation) to 1 = not important (least support) |
| 2 | Assess the importance of the following measure to promote circular economy principles in product design at the EU level: Encourage industry-led initiatives (i.e., self-regulation). | From 5 = very important (least support for CE regulation) to 1 = not very important (highest support) |
| 3 | Assess the importance of the following measure to promote circular economy principles in product design at the EU level: Develop standards for voluntary use. | From 5 = very important (least support for CE regulation) to 1 = not very important (highest support) |
| 4 | Should the action listed below be given priority at the EU level to promote circular economy solutions in production processes? Address potential regulatory obstacles in EU legislation. | From 5 = very important (least support for CE regulation) to 1 = not very important (highest support) |
| 5 | Should the action listed below be given priority at the EU level to promote circular economy solutions in production processes? Address potential regulatory gaps in EU legislation. | From 5 = very important (highest support for CE regulation) to 1 = not important (least support) |
| 6 | How effective do you think the action at the EU level listed below would be in promoting sustainable production and sourcing of raw materials? Establishing a legally binding framework at the EU level (e.g., sustainability criteria). | From 5 = very effective (highest support for CE) to 1 = not effective (least support) |
| 7 | How effective do you think the action at the EU level listed below would be in promoting sustainable production and sourcing of raw materials? Developing and promoting voluntary compliance schemes. | From 5 = very effective (least support for CE regulation) to 1 = not effective (highest support) |
| # obs. | Mean 1 | SD 1 | CE_Support | Assets | Employees | SlackResources | EUorNot | Diversification | Quoted | |
|---|---|---|---|---|---|---|---|---|---|---|
| CE_Support | 142 | 19.9 | 4.7 | |||||||
| Assets | 142 | 10.2 | 4.9 | Cor: −0.364 (p: 0 ****) | ||||||
| Employees | 142 | 4.7 | 3.7 | Cor: −0.38 (p: 0 ****) | Cor: 0.942 (p: 0 ****) | |||||
| SlackResources | 142 | 73.9 | 424.5 | Cor: −0.02 (p: 0.8151) | Cor: −0.065 (p: 0.4404) | Cor: −0.015 (p: 0.8638) | ||||
| EUorNot | 142 | 0.9 | 0.3 | Cor: −0.064 (p: 0.4521) | Cor: −0.165 (p: 0.0496 **) | Cor: −0.173 (p: 0.0397 **) | Cor: 0.056 (p: 0.5048) | |||
| Diversification | 142 | 1.5 | 1.0 | Cor: 0.03 (p: 0.7226) | Cor: 0.02 (p: 0.8168) | Cor: 0.031 (p: 0.7176) | Cor: −0.022 (p: 0.7983) | Cor: −0.114 (p: 0.1758) | ||
| Quoted | 142 | 0.2 | 0.4 | Cor: −0.223 (p: 0.0075 ***) | Cor: 0.564 (p: 0 ****) | Cor: 0.68 (p: 0 ****) | Cor: −0.063 (p: 0.4567) | Cor: −0.222 (p: 0.0079 ***) | Cor: 0 (p: 0.9976) | |
| SC_Position | 124 | 0.2 | 0.3 | Cor: −0.096 (p: 0.2897) | Cor: 0.098 (p: 0.2813) | Cor: 0.161 (p: 0.0734 *) | Cor: −0.04 (p: 0.6573) | Cor: −0.123 (p: 0.172) | Cor: −0.131 (p: 0.1468) | Cor: 0.169 (p: 0.0607 *) |
| Histograms | (a) CE_Support | (b) Log_Assets2014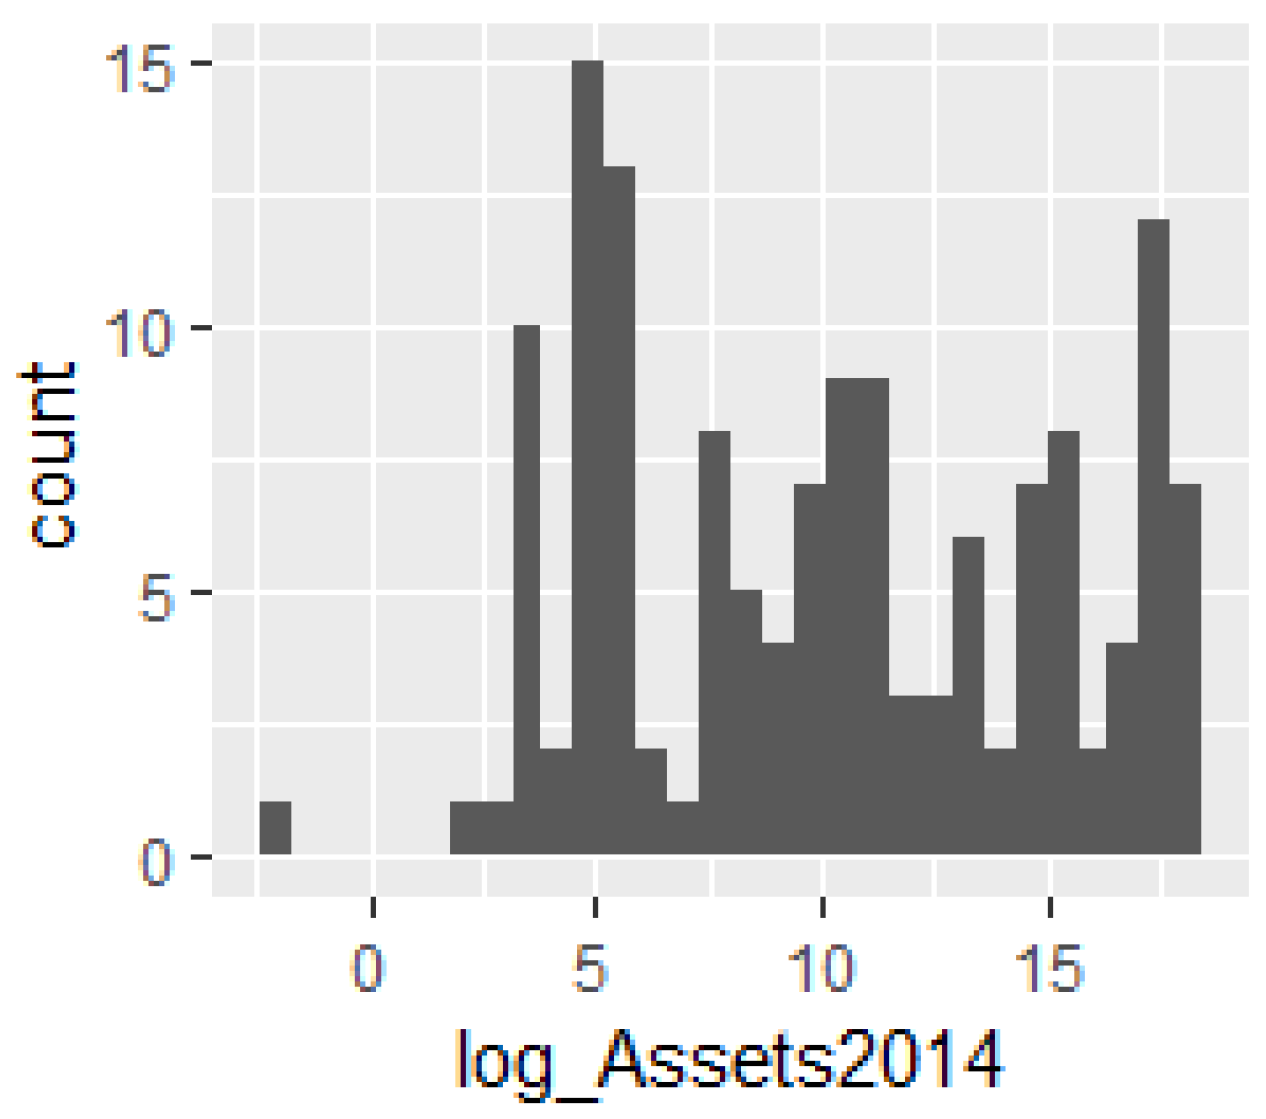 |
| Statistics | W = 0.9866, p-value = 0.1844 | W = 0.9461, p-value = 2.624 × 10⁻⁵ |
| Histograms | (c) Log_Employees2014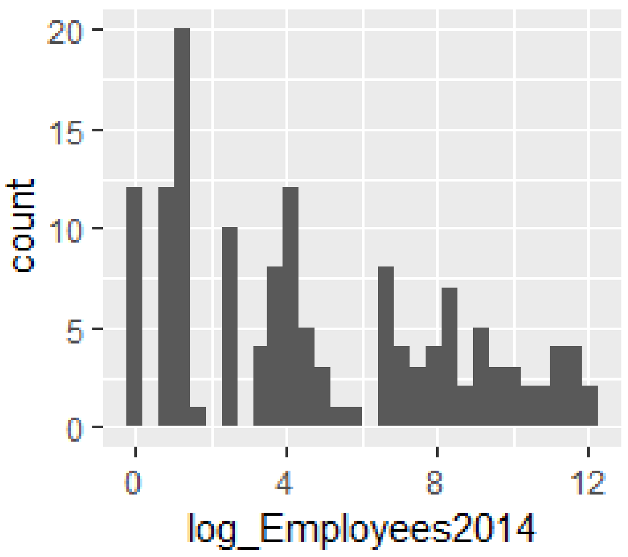 | (d) SlackResources2014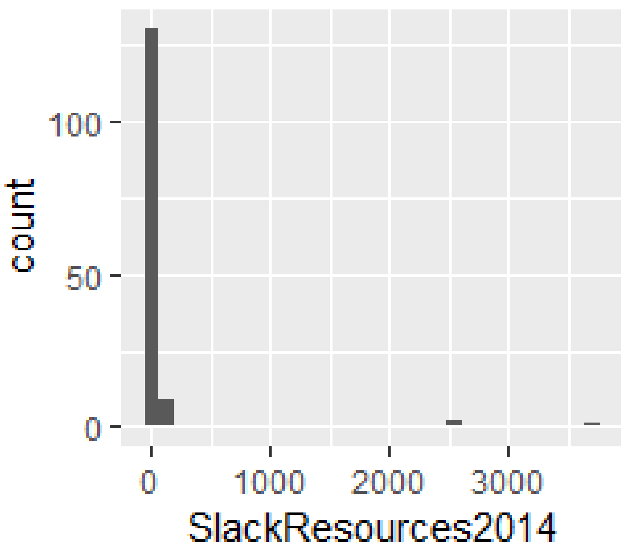 |
| Statistics | W = 0.91988, p-value = 3.894 × 10⁻⁷ | W = 0.15765, p-value < 2.2 × 10⁻¹⁶ |
| Histograms | (e) Diversification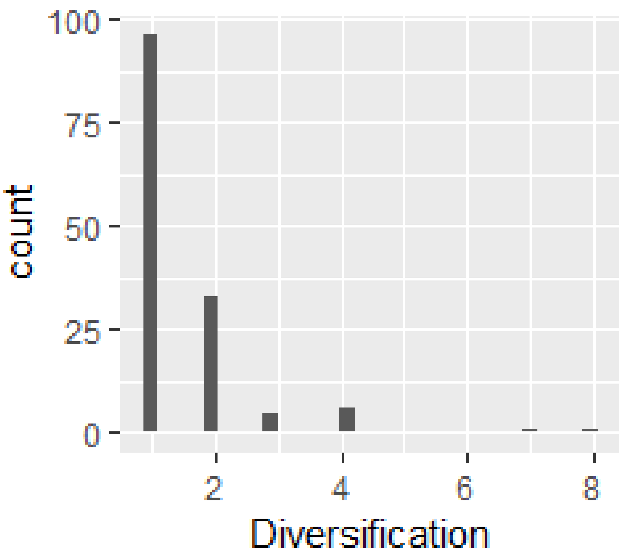 | (f) EU/non-EU 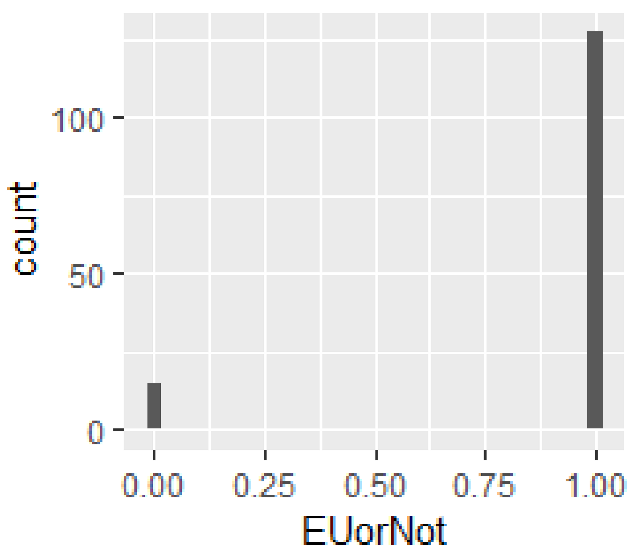 |
| Statistics | W = 0.54351, p-value < 2.2 × 10⁻¹⁶ | W = 0.35296, p-value < 2.2 × 10⁻¹⁶ |
| Histograms | (g) Quoted | (h) Supply Chain Position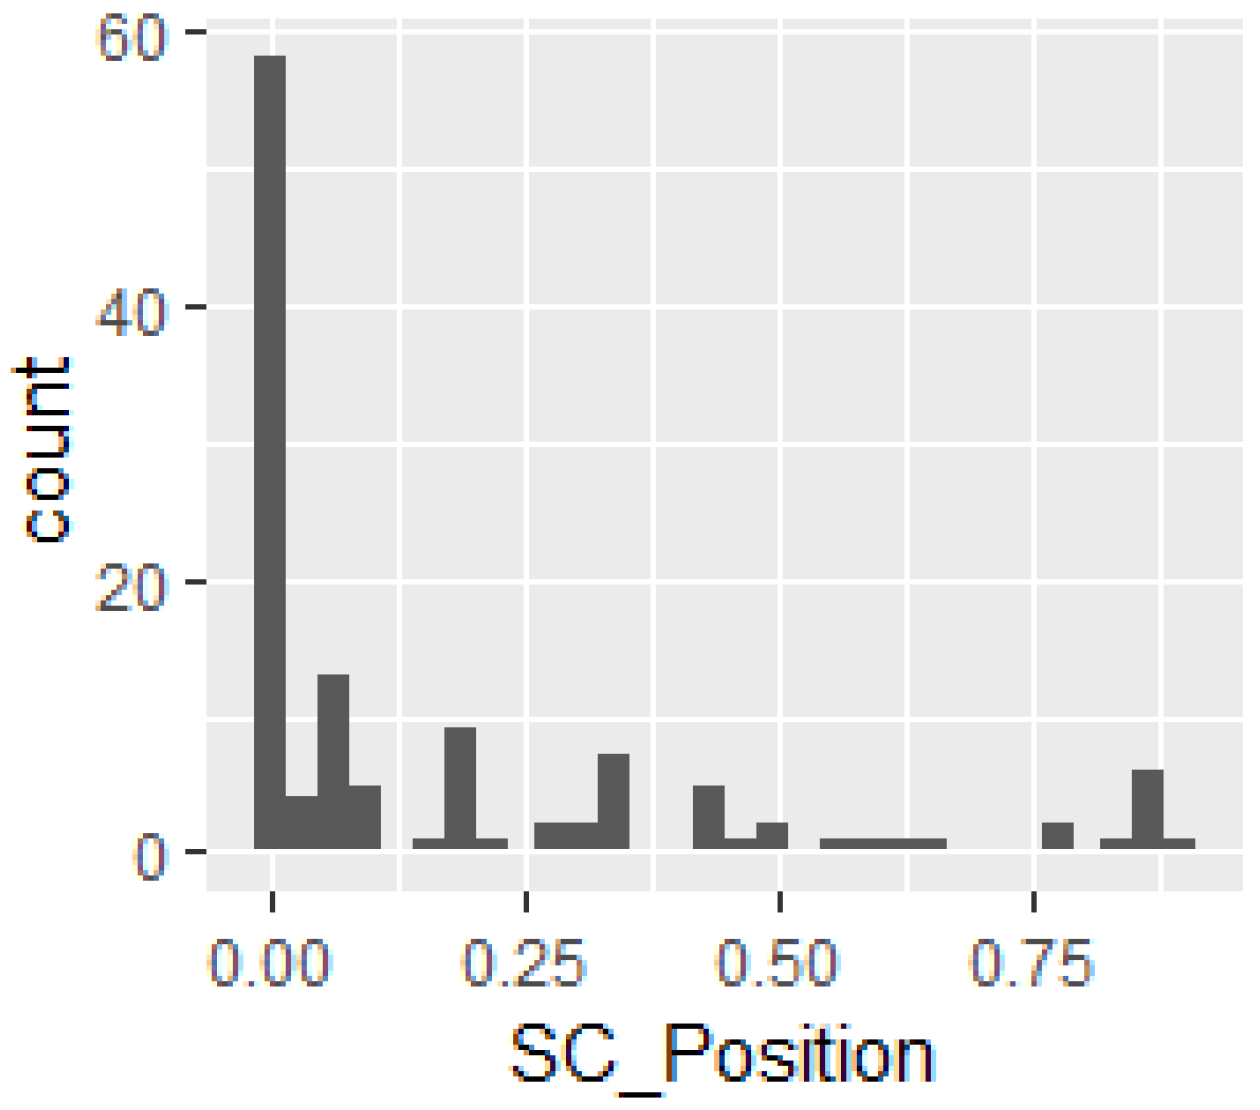 |
| Statistics | W = 0.44293, p-value < 2.2 × 10⁻¹⁶ | W = 0.71204, p-value = 2.791 × 10⁻¹⁴ |
| Control-Variable Model | IV-Only Model | Base Model | Interaction Model | |
|---|---|---|---|---|
| Intercept | 0 (0.08) | 0 (0.08) | 0 (0.08) | 0.41 ** (0.17) |
| Diversification | 0.02 (0.09) | 0.03 (0.08) | 0.05 (0.08) | |
| EUorNot | −0.06 (0.09) | −0.13 (0.08) | −0.09 (0.08) | |
| Employees | −0.38 *** (0.08) | −0.40 *** (0.08) | −0.62 *** (0.13) | |
| SlackResources | −0.03 (0.08) | −0.02 (0.08) | 0.11 (0.44) | |
| Quoted | 0.94 *** (0.34) | |||
| Employees × Quoted | −0.58 *** (0.21) | |||
| SlackResources × Quoted | 0.29 (1) | |||
| R2 | 0 | 0.14 | 0.16 | 0.21 |
| Adj. R2 | −0.01 | 0.13 | 0.14 | 0.17 |
| Num.obs. | 142 | 142 | 142 | 142 |
| Control-Variable Model | IV-Only Model | Base Model | Interaction Model | |
|---|---|---|---|---|
| Intercept | 20.61 *** (1.41) | 23.55 *** (0.86) | 25.26 *** (1.62) | 24.61 *** (1.57) |
| Diversification | 0.1 (0.38) | 0.1 (0.36) | 0.15 (0.34) | |
| EUorNot | −0.93 (1.29) | −1.86 (1.22) | −1.83 (1.19) | |
| Assets | −0.35 *** (0.08) | −0.37 *** (0.08) | −0.30 *** (0.09) | |
| SlackResources | 0 (0) | 0 (0) | 0 (0) | |
| Quoted | 43.34 *** (−12) | |||
| Assets × Quoted | −2.69 *** (−0.72) | |||
| SlackResources × Quoted | −0.01 (−0.03) | |||
| R2 | 0 | 0.13 | 0.15 | 0.23 |
| Adj.R2 | −0.01 | 0.12 | 0.13 | 0.19 |
| Num.obs. | 142 | 142 | 142 | 142 |
| Control-Variable Model | IV-Only Model | Base Model | Interaction Model | |
|---|---|---|---|---|
| Intercept | 20.61 *** (1.41) | 23.98 *** (0.96) | 26.75 *** (1.78) | 25.18 *** (1.71) |
| Diversification | 0.1 (0.38) | −0.03 (0.37) | 0.08 (0.34) | |
| EUorNot | −0.93 (1.29) | −2.73 ** (1.30) | −2.29 ** (1.25) | |
| Assets | −0.37 *** (0.08) | −0.39 *** (0.08) | −0.30 *** (0.10) | |
| SlackResources | 0 (0) | 0 (0) | 0 (0) | |
| SC Position | −1.11 (1.53) | −1.48 (1.55) | −2.10 (1.74) | |
| Quoted | 44.55 *** (11.73) | |||
| Assets × Quoted | −2.80 *** (0.71) | |||
| SlackResources × Quoted | -0.00 (0.02) | |||
| SlackResources × SC Position | −0.06 *** (0.02) | |||
| R2 | 0 | 0.14 | 0.18 | 0.31 |
| Adj.R2 | −0.01 | 0.12 | 0.14 | 0.25 |
| Num.obs. | 142 | 124 | 124 | 124 |
| Basic Models | Test Statistics and Q–Q Plot: Employee Models | Test Statistics and Q–Q Plot: Asset Models |
| Control variable model |  SW:0.99 p-value: 0.35 |  SW:0.99 p-value: 0.35 |
| IV-only model | 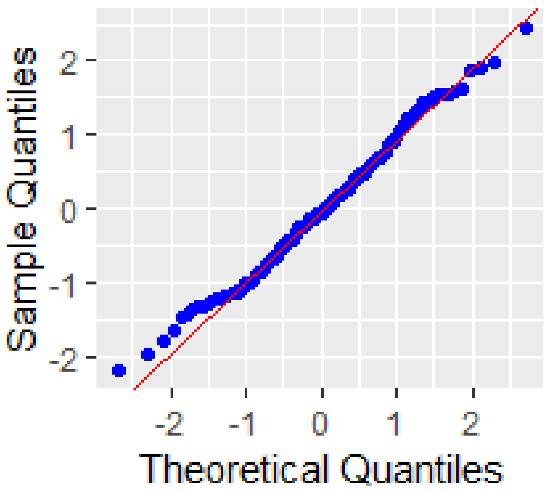 SW:0.99 p-value: 0.44 |  SW:0.99 p-value: 0.31 |
| Base model |  SW:0.99 p-value: 0.38 |  SW:0.99 p-value: 0.37 |
| Interaction model |  SW:0.99 p-value: 0.29 | 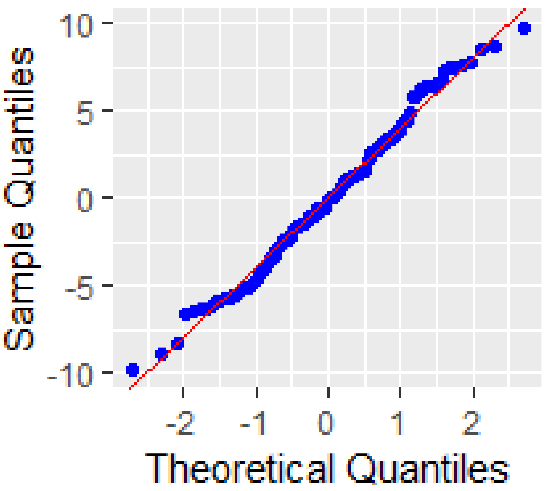 SW:0.99 p-value: 0.36 |
| SC-Deep-Dive Models | Test Statistics and Q–Q Plot: Employee Models | Test Statistics and Q–Q Plot: Asset Models |
| Control variable model | 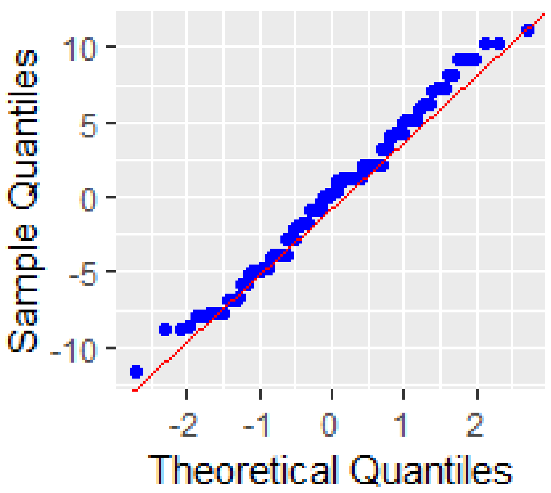 SW:0.99 p-value: 0.35 | 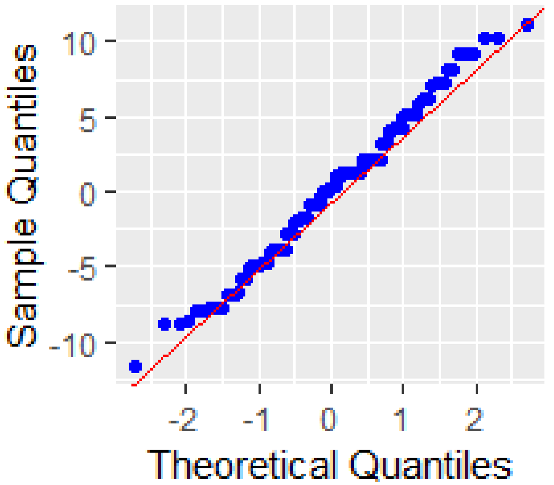 SW:0.99 p-value: 0.35 |
| IV-only model | 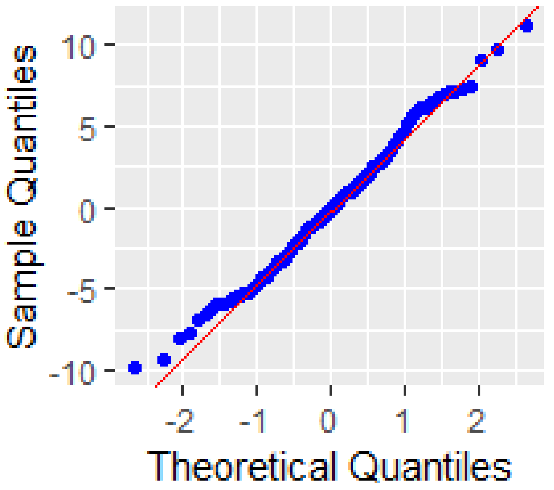 SW:0.99 p-value: 0.63 | 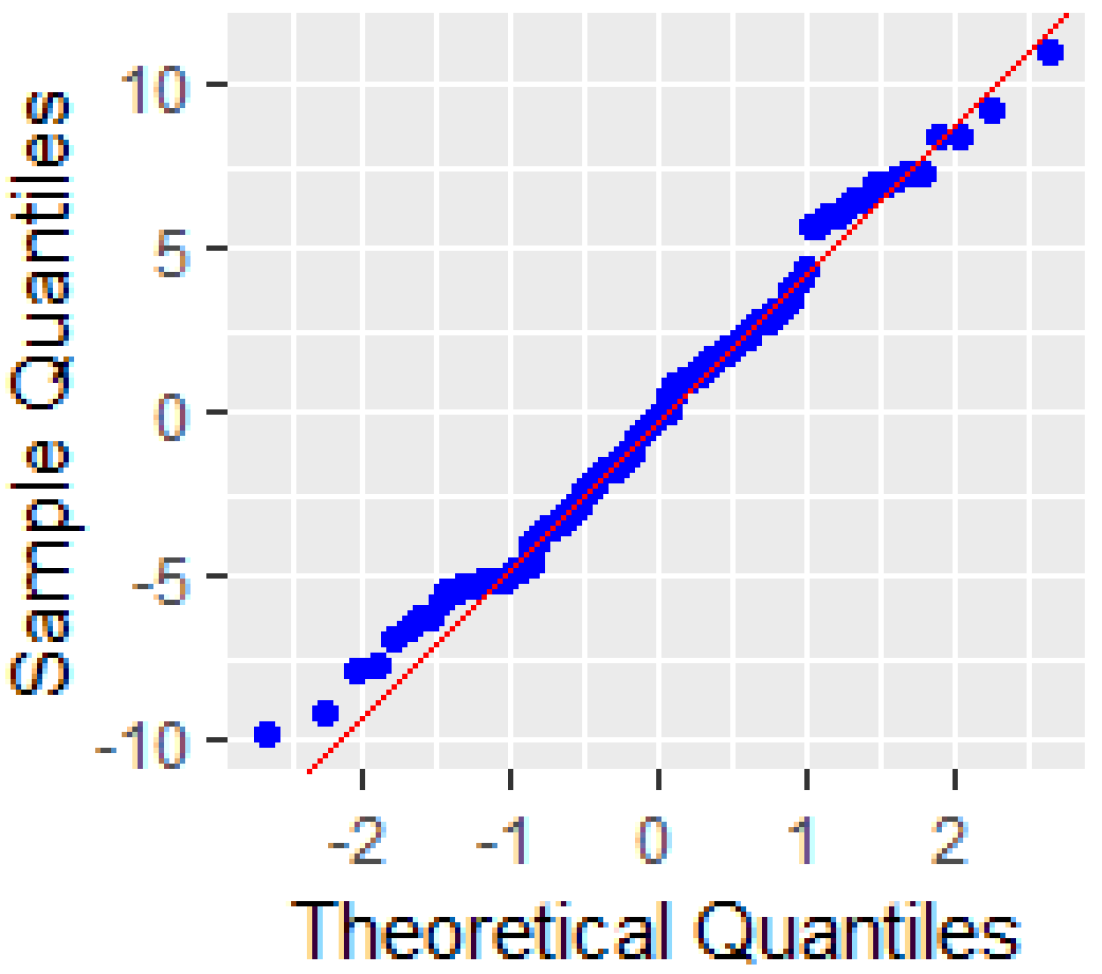 SW:0.99 p-value: 0.34 |
| Base model |  SW:0.99 p-value: 0.43 | 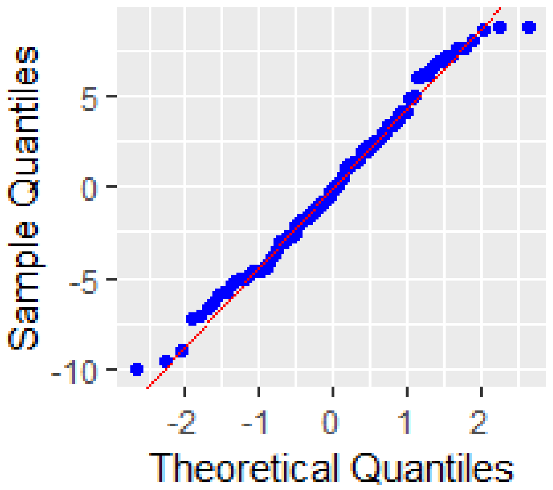 SW:0.99 p-value: 0.32 |
| Interaction model | 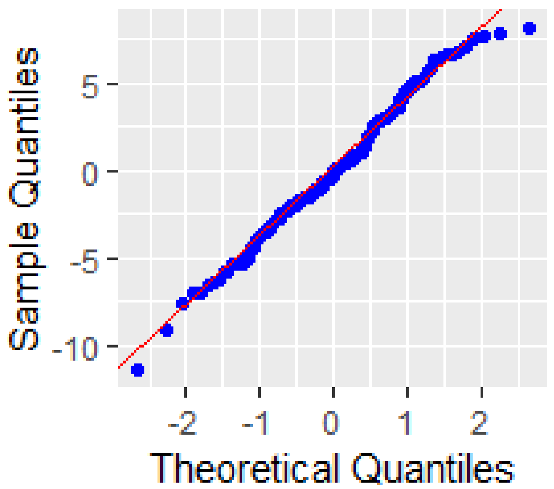 SW:0.99 p-value: 0.41 |  SW:0.99 p-value: 0.64 |
| Basic Models | SC Models | |||||||
|---|---|---|---|---|---|---|---|---|
| Control-Variable Model | IV-Only Model | Base Model | Interaction Model | Control-Variable Model | IV-Only Model | Base Model | Interaction Model | |
| Diversification | 1.01 | 1.01 | 1.03 | 1.01 | 1.04 | 1.06 | ||
| EUorNot | 1.01 | 1.05 | 1.11 | 1.01 | 1.06 | 1.17 | ||
| Employees | 1.00 | 1.03 | 2.76 | 1.04 | 1.06 | 2.32 | ||
| SlackResources | 1.00 | 1.00 | 33.51 | 1.01 | 1.02 | 1.22 | ||
| SC Position | 1.03 | 1.06 | 1.55 | |||||
| Quoted | 19.93 | 64.25 | ||||||
| Employees × Quoted | 13.43 | 65.47 | ||||||
| SlackResources × Quoted | 35.59 | 1.20 | ||||||
| SlackResources × SC Position | 1.60 | |||||||
| Basic Models | SC Models | |||||||
|---|---|---|---|---|---|---|---|---|
| Control-Variable Model | IV-Only Model | Base Model | Interaction Model | Control-Variable Model | IV-Only Model | Base Model | Interaction Model | |
| Diversification | 1.01 | 1.01 | 1.02 | 1.01 | 1.04 | 1.05 | ||
| EUorNot | 1.01 | 1.04 | 1.08 | 1.01 | 1.05 | 1.12 | ||
| Assets | 1.00 | 1.03 | 1.50 | 1.05 | 1.07 | 1.83 | ||
| SlackResources | 1.00 | 1.01 | 1.01 | 1.04 | 1.05 | 1.26 | ||
| SC Position | 1.01 | 1.05 | 1.53 | |||||
| Quoted | 157.10 | 158.20 | ||||||
| Assets × Quoted | 155.67 | 158.61 | ||||||
| SlackResources × Quoted | 1.26 | 1.26 | ||||||
| SlackResources × SC Position | 1.60 | |||||||
| Mean | SD | CE_Support | Assets | Employees | SlackResources | EUorNot | Diversification | Quoted | SME | |
|---|---|---|---|---|---|---|---|---|---|---|
| CE_Support | 19.67 | 4.66 | ||||||||
| Assets 1 | 9,035,061 | 19,712,317 | −0.428 (p: 1 × 10⁻⁴ ****) n = 78 | |||||||
| Employees 1 | 18,634 | 38,892 | −0.422 (p: 3 × 10⁻⁴ ****) n = 68 | 0.69 (p: 0 ****) n = 71 | ||||||
| SlackResources | 94,33 | 513,48 | −0.013 (p: 0.9159) n = 66 | −0.068 (p: 0.5649) n = 74 | −0.058 (p: 0.6541) n = 62 | |||||
| EUorNot | 0.89 | 0.31 | 0.1 (p: 0.1785) n = 182 | −0.137 (p: 0.197) n = 90 | −0.125 (p: 0.284) n = 75 | 0.061 (p: 0.6045) n = 74 | ||||
| Diversification | 1.53 | 1.19 | −0.004 (p: 0.9584) n = 182 | −0.038 (p: 0.7241) n = 90 | 0.146 (p: 0.2117) n = 75 | −0.002 (p: 0.9891) n = 74 | −0.163 (p: 0.0178 **) n = 210 | |||
| Quoted | 0.11 | 0.31 | −0.194 (p: 0.0086 ***) n = 182 | 0.484 (p: 0 ****) n = 90 | 0.67 (p: 0 ****) n = 75 | −0.107 (p: 0.3659) n = 74 | −0.17 (p: 0.0137 **) n = 210 | −0.003 (p: 0.9607) n = 210 | ||
| SME | 0.52 | 0.50 | 0.335 (p: 0 ****) n = 182 | −0.403 (p: 1 × 10⁻⁴ ****) n = 90 | −0.301 (p: 0.0088 ***) n = 75 | 0.006 (p: 0.9603) n = 74 | 0.151 (p: 0.029 **) n = 210 | −0.073 (p: 0.2905) n = 210 | −0.334 (p: 0 ****) n = 210 | |
| SC_Position | 0.11 | 0.22 | −0.001 (p: 0.9871) n = 165 | 0.228 (p: 0.0348 **) n = 86 | 0.368 (p: 0.0015 ***) n = 72 | −0.047 (p: 0.696) n = 71 | −0.092 (p: 0.2032) n = 191 | −0.087 (p: 0.2308) n = 191 | 0.253 (p: 4 × 10⁻⁴ ****) n = 191 | −0.102 (p: 0.1621) n = 191 |
| Control-Variable Model | IV-Only Model | Base Model | Interaction Model | |
|---|---|---|---|---|
| Intercept | −5.07 (7.32) | −0.28 (0.59) | −0.28 (0.58) | −0.85 (0.98) |
| Diversification | 0 (0.44) | 0.20 (0.18) | 0.20 (0.18) | |
| EUorNot | −0.07 (0.49) | −0.07 (0.13) | −0.07 (0.14) | |
| Employees | −0.38 *** (0.12) | −0.41 *** (0.12) | −2.38 (2.14) | |
| SlackResources | -0.09 (0.13) | −0.10 (0.13) | 1.07 (1.44) | |
| Quoted | 0.89 (0.76) | |||
| Employees × Quoted | 0.68 (0.76) | |||
| SlackResources × Quoted | 3.26 (4.10) | |||
| Inverse Mill’s ratio | 8.93 (12.73) | 0.15 (0.69) | 0.15 (0.68) | 0.00 (0.76) |
| R2 | 0.11 | 0.18 | 0.20 | 0.22 |
| Adj. R2 | 0.09 | 0.14 | 0.12 | 0.09 |
| Num.obs. | 193 | 125 | 125 | 125 |
| Control-Variable Model | IV-Only Model | Base Model | Interaction Model | |
|---|---|---|---|---|
| Intercept | −5.07 (7.32) | −0.58 (0.80) | −0.53 (0.79) | −0.53 (0.88) |
| Diversification | 0 (0.44) | 0.01 (0.13) | 0.03 (0.13) | |
| EUorNot | −0.07 (0.49) | −0.10 (0.13) | −0.12 (0.14) | |
| Assets | −0.39 *** (0.12) | −0.41 *** (0.12) | −0.14 (0.17) | |
| SlackResources | −0.04 (0.11) | −0.04 (0.11) | 0.04 (0.14) | |
| Quoted | 0.04 (0.69) | |||
| Assets × Quoted | −0.17 ** (0.08) | |||
| SlackResources × Quoted | 0.23 (4.11) | |||
| Inverse Mill’s ratio | 8.93 (12.73) | 0.65 (0.99) | 0.59 (0.97) | 0.78 (1.04) |
| R2 | 0.11 | 0.19 | 0.20 | 0.26 |
| Adj.R2 | 0.09 | 0.15 | 0.13 | 0.16 |
| Num.obs. | 193 | 134 | 134 | 134 |
| Control-Variable Model | IV-Only Model | Base Model | Interaction Model | |
|---|---|---|---|---|
| Intercept | −5.07 (7.32) | −1.49 (0.92) | −1.49 (0.92) | −1.45 (1.50) |
| Diversification | 0 (0.44) | 0.18 (0.19) | 0.20 (0.19) | |
| EUorNot | −0.07 (0.49) | −0.0 6(0.13) | −0.06 (0.14) | |
| Employees | −0.39 (0.12) | −0.41 *** (0.12) | −1.92 (2.17) | |
| SlackResources | −5.45 (3.09) | −5.44 (3.11) | −1.11 (8.33) | |
| SC Position | 0.04 (0.13) | 0.05 (0.13) | −1.17 (0.50) | |
| Quoted | 1.21 (0.82) | |||
| Employees × Quoted | 0.51 (0.77) | |||
| SlackResources × Quoted | 5.33 (4.30) | |||
| SlackResources × SC Position | −0.93 (2.90) | |||
| Inverse Mill’s ratio | 8.92 (12.73) | 0.48 (0.78) | 0.48 (0.77) | 0.49 (0.89) |
| R2 | 0.11 | 0.22 | 0.24 | 0.27 |
| Adj.R2 | 0.09 | 0.16 | 0.14 | 0.10 |
| Num.obs. | 193 | 122 | 122 | 122 |
| Control-Variable Model | IV-Only Model | Base Model | Interaction Model | |
|---|---|---|---|---|
| Intercept | −5.07 (7.32) | −0.62 (0.93) | −0.54 (0.91) | −1.09 (1.16) |
| Diversification | 0 (0.44) | 0 (0.13) | 0.04 (0.15) | |
| EUorNot | −0.07 (0.49) | −0.15 (0.13) | −0.11 (0.16) | |
| Assets | −0.49 *** (0.13) | −0.52 *** (0.13) | −0.28 (0.33) | |
| SlackResources | 0.03 (0.19) | 0.04 (0.19) | −0.14 (1.54) | |
| SC Position | −0.03 (0.11) | −0.06 (0.11) | −0.28 * (0.15) | |
| Quoted | 0.39 (0.74) | |||
| Assets × Quoted | −0.12 (0.13) | |||
| SlackResources × Quoted | 2.05 (4.30) | |||
| SlackResources × SC Position | −1.79 ** (0.87) | |||
| Inverse Mill’s ratio | 8.92 (12.73) | 0.65 (1.13) | 0.56 (1.10) | 1.30 (1.35) |
| R2 | 0.11 | 0.24 | 0.26 | 0.32 |
| Adj.R2 | 0.09 | 0.19 | 0.19 | 0.19 |
| Num.obs. | 193 | 131 | 131 | 131 |
Publisher’s Note: MDPI stays neutral with regard to jurisdictional claims in published maps and institutional affiliations. |
© 2022 by the author. Licensee MDPI, Basel, Switzerland. This article is an open access article distributed under the terms and conditions of the Creative Commons Attribution (CC BY) license (https://creativecommons.org/licenses/by/4.0/).
Share and Cite
Pietrulla, F. Private Firm Support for Circular Economy Regulation in the EU Policy Context. Sustainability 2022, 14, 8427. https://doi.org/10.3390/su14148427
Pietrulla F. Private Firm Support for Circular Economy Regulation in the EU Policy Context. Sustainability. 2022; 14(14):8427. https://doi.org/10.3390/su14148427
Chicago/Turabian StylePietrulla, Felicitas. 2022. "Private Firm Support for Circular Economy Regulation in the EU Policy Context" Sustainability 14, no. 14: 8427. https://doi.org/10.3390/su14148427
APA StylePietrulla, F. (2022). Private Firm Support for Circular Economy Regulation in the EU Policy Context. Sustainability, 14(14), 8427. https://doi.org/10.3390/su14148427