Article

Determination of the Risk on Human Health of Heavy Metals Contained by Ship Source Bilge and Wastewater Discharged to the Sea on the Mediterranean by Monte Carlo Simulation

by
Ömer Harun Özkaynak
*,
Gönül Tuğrul İçemer
and
Hasan Merdun
Environmental Engineering, Akdeniz University, Antalya 07000, Turkey
*
Author to whom correspondence should be addressed.
Sustainability 2022, 14(14), 8408; https://doi.org/10.3390/su14148408
Submission received: 13 May 2022 / Revised: 28 June 2022 / Accepted: 6 July 2022 / Published: 8 July 2022

Abstract

:
Discharge of bilge and wastewater from ships into the sea poses a risk to human health due to the heavy metals. In this study, shipborne bilgewater and wastewater carcinogenic and non-carcinogenic human health risks determine by using the measured and literature values of heavy metals copper, iron, vanadium, chromium, manganese, cobalt, nickel, zinc, arsenic, cadmium, and mercury in the shipborne bilgewater and wastewater. The heavy metal contents of seawater were selected from 11 points determined in Antalya Bay, wastewater, and bilge samples taken from two ships. The human health risk was determined using the Monte Carlo Simulation (MCS) method using these measured values and the heavy metal concentrations in the Mediterranean Sea in the literature. The risk of carcinogenicity of heavy metals from wastewater by dermal route, ingestion, and from bilge water by dermal way and ingestion were evaluated. The wastewater is dermal Ni > As > Cr, the wastewater is Ni > Cr > As by ingestion, the dermal Ni > As > Cr in the bilge, and the risk of ingestion is Ni > Cr > As. It has been determined that the non-carcinogenic Cr, Co, Hg, and As values in the wastewater and bilge water are above the acceptable 1 and therefore expose a risk to human health. The human health carcinogenic risk caused by heavy metals generating from the bilge and wastewater is much higher than the standard values determined by the WHO. For the first time in this study, it was determined that bilge water exposes a high risk for both swimmers and ship personnel in the health risk assessment of shipborne wastewater and bilge water.

1. Introduction

It is known that heavy metals have serious adverse effects on human health. As a result of the discharge of bilge and wastewater generating from ships in the seas, the removal of the heavy metal contained in these wastes by the marine species, or the exposure of people to these heavy metals because of their activities in the sea poses a risk to human health. Bilgewater may contain fuel, hydraulic oils, lubricating oils, volatile organic compounds, metals, detergents, degreasers, other chemicals derived from activities on a ship [1].
Mediterranean coasts are among the marine areas where the risk of leakage of oil and petroleum-derived wastes is high due to approximately 25% of the world’s ship traffic [2]. According to the Barcelona Convention, 22 Mediterranean countries have also attracted the attention of the world tourism industry with their cultural diversity and natural beauties. For this reason, it is estimated that the population in the coastal and urban areas of the Mediterranean region will increase rapidly and reach 572 million by 2030 [3].
Considering the terrestrial, atmospheric and natural leakage inputs to the Mediterranean, no consensus could be reached on the actual amount of oil. However, the annual volumes (metric ton) of these inputs are reported to be 32,000 [4], between 400,000 and 1,000,000 [5], and between 15,000 [6] and 63,500 t [7] Due to these high inputs, heavy metals from petroleum hydrocarbons have serious adverse effects on human and ecosystem health [8,9]. As a result of the discharge of bilge and wastewater generating from ships in the sea, marine species [10] or human exposure to heavy metals contained in these wastes [11,12] activities in the sea expose a risk to human health.Heavy metal content may be high in these chemicals with the contribution of ship activities. With these metals, some parts of the Mediterranean coast are polluted by human activities in the sea and on the coast [13,14,15]. Heavy metals such as lead, mercury, cadmium, zinc and copper are found in coastal deposits in the Northern Mediterranean. This is explained by the fact that it is associated with industrial and domestic waste discharges and activities in the Ports [16].
Marine animals can take heavy metals in seawater, transferring to lower levels in the food chain with biomagnification through direct mouth or skin contact [17]. Even in small amounts, heavy metals can harm marine species, so their access to seawater should be controlled. Heavy metals are also called trace or trace elements. Generally, its commonly found in seawater are Sb, Ag, As, Be, Cd, Cr, Pb, Mn, Hg, Ni, Se, T, U, V, Zn, Al, and Cu. The severe increase of heavy metal accumulation in the seas due to human activities is an important issue due to environmental pollution, risks to human health, sea fauna and flora [18,19].
Heavy metals cause severe sea pollution [20] and can accumulate in large quantities on the coasts. It has been determined that people on the beaches can be easily affected by heavy metals by body contact with beach sand and swallowing seawater [21,22]. In the study conducted by [23], in the Antalya Kemer region, it was determined that Ca, Cr, Fe, Ti, and Pb were abnormally concentrated in the samples taken from 47 points and Cr, Pb, and Cu showed high-risk levels as contaminants in some samples. In addition, it was stated that the formation of high Cr concentration was caused by biological activities, while Pb and Cu were formed due to human activities.
The amounts of heavy metals (Cd, Fe, Cu, Pb, Zn, Co, Cr, Al, Mn, and Ni) in seawater in the Iskenderun Bay were investigated by Turkmen (2011) [24]. Author found that the concentrations of Al, Cr, Fe, Cu, and Se elements were found above the limit values. Similary in the same region, Göycıncık et al. (2018) [25] measured the concentration of 8 heavy metals (B, Al, Cr, Fe, Ni, Cu, As, Se) in seawater samples. According to the results obtained from their studies, it was determined that the concentrations of B, Al, Cr, Fe, Cu, and Se elements were above the limit values, and Ni and As elements were below the limit values. According to Yalcin et al. (2016) [26], in a study conducted in Mersin and Alanya, sediments at 44 points were compared with literature data based on the examination of the samples; It has been determined that the average heavy metal concentrations in Turkey are large enough to be considered toxic and above acceptable value.Wastewater from ships contains high concentrations of pollutants such as heavy metals, nutrients and suspended solids [27]. It has been reported that wastewater from many ships contains heavy metals and their discharge into the sea damages the marine ecosystem [28]. Heavy metals [29] and heavy metal concentrations [30] were determined in studies on the content of bilge water. In the western Mediterranean, [31] compared the amounts of heavy metals in summer and winter seasons, and it was determined that the values measured in the winter months were higher. In the Baltic Sea study conducted by Tiselius and Magnusson (2017) [32], the bilge water’s oil and heavy metal content was estimated to be 4 to 8 times lower.
Environmental risk is the possibility that the activity carried out will adversely affect human health or the environment directly or indirectly; the risk assessment for estimating the magnitude of this risk. In 13 different reports containing data on pollutant concentrations in gray waters formed on ships, it is stated that there are 44 (28 organic, 16 metal) different pollutants in gray waters [33]. As a result of their studies, it has been determined that zinc and copper metals pose the highest environmental risk in grey wastewater.
Regarding the evaluation of ecological risk with Monte Carlo analysis, Dang et al. [34] determined the highest contamination risk in water with a value of Cd, 2.06 ± 0.78 mg L−1, whereas Kuang et al. [35] determined the risk of heavy metals as, respectively, As > Cd > Cr in sediment and marine organisms. Soleimani et al. [36] estimated the risk of heavy metals Cr, Pb, and Cd in drinking water with 10,000 iterations using the same method.
Arikibe and Prasad [37] was found heavy metal concentrations Ni 0.23–0.80 mg L−1, Zn 0.08–1.45 mg L−1, Cd 0.15–0.25 mg at the sampling site in Suva Fiji Pb 0.88–1.77 mg L−1 and Cu 0.88–10.29 mg L−1 and no risk analysis was performed. According to the WHO guideline, only the measured values were evaluated. It was determined that the Cd and Pb values were above the accepted values [38].
Heavy metal concentrations were calculated using MCS to determine risk calculations from 36 samples taken from Lake Nancy [39]. Risk analysis was performed using the SPSS program and measuring seven heavy metals (Cr, Cu, Ni, Zn, As, Pb and Cd). It was calculated with the potential ecological risk index (RI) formula. Cu and Cd values were above the accepted values and posed a risk.
The spatial distribution, potential sources, and ecological risks of 8 heavy metals (Zn, Cu, Cr, Ni, As, Cd, Hg, and Pb) in Meishan Bay, the Zhejiang coast of China with a high pollution load, were investigated. It is accepted that Zn is mainly caused by ship transportation; pesticides and Hg from sewage wastewater are considered the primary sources. In contrast with the MCS, the Geo-accumulation index was used, and it was determined that Cu, Zn, Cr, Pb, and As pollution was limited, while Cd and Hg caused light to moderate pollution [40].
The Mining factory found that the potential health risk (through ingestion and skin contact) calculated for lifetime exposure is cumulative for workers, tourists, and residents (including children and adults) depending on the magnitude of heavy metal pollution in the surrounding Qixia landscape site [21]. Carcinogenic and non-carcinogenic risks were determined using the MCS method. The method selects the values of the parameters from the distributions fitted to the input data and, as a result, calculates both the point value and the exposure and risk distribution [41,42,43].
As seen in the reviewed literature, no study has been found on the human health risk of wastewater and bilge water generating from ships. This study determines the carcinogenic and non-carcinogenic risk to human health caused by the heavy metals in the shipborne wastewater and bilge water mixing with the seawater in the short term through the skin and ingestion for the first time.
There is no study evaluating the health risk from the bilge and wastewater of ships in Antalya Bay. For this reason, the primary objective is to calculate the health risks of heavy metals, the amount of which increases in seawater due to possible illegal discharges of bilge and wastewater and other inputs. In this context, calculations were made using the current measurement values and the literature values in the Mediterranean.

2. Material and Methods

2.1. Study Area

Antalya’s coastal length extends from Eşen Stream in the west to Kaledron (Kaldıran) Stream in the east at 640 km. This coast length is 40% of the Mediterranean Region’s coastal line. This region is the center of tourism with a population of close to 3 million and natural beauties.
There is a “fisherman port” and a “harbor” that houses a “fisherman port” and a “harbor” house cargo ships, cruise ships, and a marina among the coastal structures within the area. The Antalya port is among the top 10 ports where the most cargo is handled [44]. When we examine the number of ships arriving at Antalya port in the last three years, 1109 ships in 2019, 728 in 2020, and 778 in 2021.
There is also a filling facility on the shore transported by oil pipelines. The world-famous Konyaaltı beach (6.5 km.) is one of the recreational areas for public use in the coastal region and the beach welcomes about 5000 people daily in high season [45].

2.2. Sample Collection and Preparation

In this case, 44 seawater samples were taken from 11 selected points in the Antalya Bay in February, April, July, and November, covering all four seasons. The sampled sea area is given in Figure 1. Bilgewater and wastewater samples were taken from a daily excursion boat larger than 12 m and a commercial vessel larger than 100 m in length. The samples taken for heavy metal analysis were stored in the refrigerator at +4 °C by adding nitric acid. Heavy metal analyzes were performed with an Energy dispersed NEX CG X-ray fluorescence spectrometer (XRF) with a 50W artificial X-ray tube from Rigaku. Approximately 50 mL of sample was put into the device for heavy metal analysis, and measurements were made in mg L−1.
The accuracy and precision of the heavy metal analysis results were checked with standard reference material analysis [46]. Measurement limits were determined using the reference standard value for each heavy metal.
Quality assurance and control measures were adopted. The accuracy of the measurements was checked using the standard solution and heavy metal reference values. The measurements were statistically controlled for each heavy metal measurement as maximum, minimum, and standard deviation (S.D.).

2.3. Determination of Human Health Risk Caused by Bilge and Wastewater with MCS

Ideally, probability distributions of variables should be based on underlying physical processes or mechanisms that are considered key in causing the observed variability. For example, if the exposure variable results from many other random variables, choose a lognormal distribution for testing [47]. Since risk was calculated as a distribution using MCS, the risk was calculated using the lognormal distribution in this study.
MCS is a common method used to evaluate uncertainty through probability distribution functions. In this study, the heavy metals Cu, Fe, S, V, Cr, Mn, Fe, Co, Ni, Zn, As, Cd, Hg, and Pb in the contents of the bilges and wastewaters originating from the ships were measured with MCS using the values in the literature and the concentration values in the Mediterranean to determine human health risk.
Since it is known that people will be exposed to heavy metals in the sea by the risk equation provided in RAGS (Risk Assessment Guidance for Superfund), Volume 3 [48], the formula used to calculate this risk is [49,50,51]; and the carcinogenic risk was determined using the following formulas;
R i s k   ( ingestion ) = C S F C × I R × E F × E D B W × A T
R i s k   ( d e r m a l ) = C S F C × S A × K p × E T × E F × E D × 10 B W × A T
where C is the concentration of the chemical in an exposure environment mg L−1, SA is the area of the exposed surface (m2), EF is the exposure frequency (days year−1), ED is the exposure time (years), BW is the body weight (kg), AT is the meantime. (Admitted as 70 years for carcinogen and 30 years for others), ET exposure time (h day−1), Kp, skin permeation coefficient through underwater exposure (cm h−1), IR, uptake rate (L day−1), and CSF expresses the cancer slope factor (linear low dose cancer potential factor) (mg kg−1day−1)−1 for the chemical.
In this study, CSF, AT, ED, and Kp values were entered into MCS as constant. Five elements (Cr, Cd, As, Ni, and Co) are classified as possible carcinogens by the International Agency for Research on Cancer [52]. The CSF values used in calculating heavy metals with MCS are given in Table A1. The non-carcinogenic risk of heavy metals was determined using the following formulas;
R i s k   ( ingestion ) = C × I R × E F × E D B W × A T / R f D
R i s k   ( d e r m a l ) = C × S A × K p × E T × E F × E D × 10 B W × A T / R f D
where C is the concentration of the chemical in an exposure environment (mg L−1), IR is the uptake rate (L day−1), EF exposure frequency (days year−1), ED exposure time (years), BW is body weight. (kg), AT meantime (accepted as 70 years for carcinogens and 30 years for others), SA area of exposed surface (m2), Kp, coefficient of permeability of skin through underwater exposure (cm h−1), ET exposure time (h day−1), and RfD (mg kg−1day−1)−1 refer to the reference dose.
The lognormal distribution was chosen as the exposure variable for heavy metal concentrations and is also the result of many other random variables [47]. In the study conducted by Chen et. Al [53], it was determined that the distribution of V was close to the normal distribution, while other potentially harmful elements showed non-normal distribution characteristics. The constant values obtained from the literature and used in the risk formula in this study are given in Table A2.
In this study, some values were taken from the literature to calculate risk assessment by skin and ingestion. Kp values (1 × 10⁻³ for Cd, Cr, As, Fe, Mn, Co, V, and Hg; 1 × 10⁻⁴ for Pb; 6 × 10⁻⁴ for Zn; 2 × 10⁻⁴ cm for Ni) are taken from the Exposure Factors Handbook [54]. CSF is the pollution factor of an element calculated using values measured in the past [55]. CSF values expressed as IR, and uptake rate (L day−1) were taken from Javed and Usmani [56] and Chen [53]. For the AT value in this formula, 70 years for carcinogenic substances were used as 30 years for non-carcinogenic substances [53]. Five of the heavy metals (Cr, Cd, As, Ni, and Co) were classified as possible carcinogens by the International Agency for Research on Cancer [52]. Calculations were made by considering the same metals as carcinogens in this study. Similarly, Custodio et al. [53,57] made calculations with the acceptance of literature values in the studies of determining the risk to human health.

3. Results and Discussion

3.1. Measured Values

According to the heavy metal analysis results of seawater samples taken from 11 selected points in Antalya Bay in February, April, July, and November, covering four seasons, the average values of heavy metals were Fe 5.78 mg L−1, Cu 2.67 mg L−1, and Zn 3.97 mg L−1. Among other heavy metals, Cr could be measured in winter at station 2 and in summer at station 11, while Hg was within the measurement limits at station 5 in winter and spring, at station 10, and at stations 3 and 4 in summer. The results of the studies on heavy metal concentrations of seawater in the Mediterranean and the comparison of the limit values of these metals in Turkey and the World Health Organization [38] are given in Table 1.
Measurement results in the literature and samples in bilge water are given in Table 2. The measurement results in wastewater and in the literature are shown in Table 3.
When the Cu, V, and Zn values measured in the bilge water in this study are compared, it is seen in Table 2 that the importance of other researchers is much higher.
The values of Cu, Fe, and Zn measured in this study in wastewater were higher than those determined by Ytreberg [33], Onwuegbuchunam et al. [59], and Mearns et al. [60], as it is shown in Table 3. In addition, the measurement method used in this study could not determine S, V, Mn and Hg values in wastewater. Therefore, risk distributions were also calculated.
In this study, the averages of heavy metal values measured based on stations are given in Table A3. The values of Cu and Cr measured in this study in seawater were 2–3 times higher than those determined by Türkmen [24] and Göycıncık et al. [25]. The Zn values were 4 mg L−1, much higher than the value (0.0709 mg L−1) measured by Türkmen (2011).
Fe amount was measured as 5.84 mg L−1 in this study. Göycıncık et al. [25] (2018) determined the Fe value as lower than 7.142 mg L−1 measured in this study.In addition, the amount of Fe measured in this study was found to be 0.29 mg L−1 measured by Turkmen [24], and Morley et al. [31] were determined to be much higher than the 0.00088 mg L−1 measured. It was observed that the Hg value measured at four stations was 15.11 mg L−1 and could not be determined or remained below the measurement limits in the studies given in Table 1.
Table 2. Heavy metal values measured in the bilge water in this study and the literature.
Studies on Bilge WaterTiselius and Magnusson [32]
mg L−1
Olorunfemi et al. [30]
mg L−1
EPA [61]
mg L−1
Present Study Passenger Boat
mg L−1
Present Study Merchant Ship
mg L−1
Cu0.0254 ± 0.01310.50.2775–0.4262.853.87
Fe3.204 ± 0.132n/d *0.432–0.531n/d81.8
V0.0378 ± 0.0234n/dn/dn/d1.51
Cr0.0192 ± 0.008531.4n/dn/dn/d
Mn0.161 ± 0.05883.9n/dn/dn/d
Co0.0897 ± 0.0604n/dn/dn/dn/d
Ni0.0754 ± 0.01920.30.09775–0.245n/dn/d
Zn0.310 ± 0.06611.60.514–1.334.1813.6
As0.00191 ± 0.00034n/dn/dn/dn/d
Cd<0.00020.1n/dn/dn/d
Hg0.00279 ± 0.00114n/d0.03205–0.0798n/dn/d
Pb<0.004n/dN/An/dn/d
* n/d = Not Detected.
Table 3. Heavy metal values measured in the wastewater in this study and the literature.
Studies on Heavy Metal in WastewaterYtreberg et al. [33]
mg L−1
Onwuegbuchunam et al. [59]
mg L−1
Mearns et al. [60]
mg L−1
Present Study Passenger Boat
mg L−1
Present Study Merchant Ship
mg L−1
Cu0.2670.0012 0.08292.471.68
Fen/d *0.00202n/dn/d8.7
Vn/dn/dn/dn/dn/d
Cr0.0073n/d0.00342n/dn/d
Mnn/dn/dn/dn/dn/d
Con/dn/dn/dn/dn/d
Ni0.025n/dn/dn/dn/d
Zn0.5170.000040.134.634.64
As0.006n/d0.0092n/dn/d
Cd0.000160.00025n/dn/dn/d
Hg0.00016n/dn/dn/dn/d
Pb0.0256n/d0.00296n/dn/d
* n/d = Not Detected.

3.2. Determination of Human Health Risk Caused by Bilge and Wastewater with MCS

In this study, the heavy metal data of Cu, Fe, S, V, Cr, Mn, Fe, Co, Ni, Zn, As, Cd, Hg and Pb in seawater and ship-sourced bilge and wastewater to determine the health risk with MSC, measured in Antalya Bay concentrations and values measured in the literature.
The human health risk of each heavy metal was determined by using the values in the risk formula specified in the Materials and Methods section and the values were given in Table A2, Table A3 and Table A4. In this study’s highest and lowest risk values of carcinogenic and non-carcinogenic heavy metals calculated using MCS are shown in Table 4. The RfD values used in calculating the heavy metals analyzed and obtained from the literature data with MCS are given in Table A1.
Al, Ba, Cu, Fe, Sr, and Zn metals were determined as a result of the study on the integrated environmental assessment of the bioaccumulation of heavy metals in invertebrates and seaweeds from different marine coastal regions of Sardinia inthe Mediterranean [62]. It has been determined that this may affect human health, but the source of heavy metals has not been investigated.
In a study, the total exposure index and cumulative risk resulting from exposure to only trihalomethanes in drinking water were calculated using MCS [63].
When we examine the literature, it is seen that only heavy metal amounts in bilge and wastewater originating from ships are investigated (Table 1, Table 2 and Table 3). In this study, in contrast with the literature, the human health risk of heavy metal amounts was determined using MCS.

3.3. Determination of Carcinogenic Risk Distribution

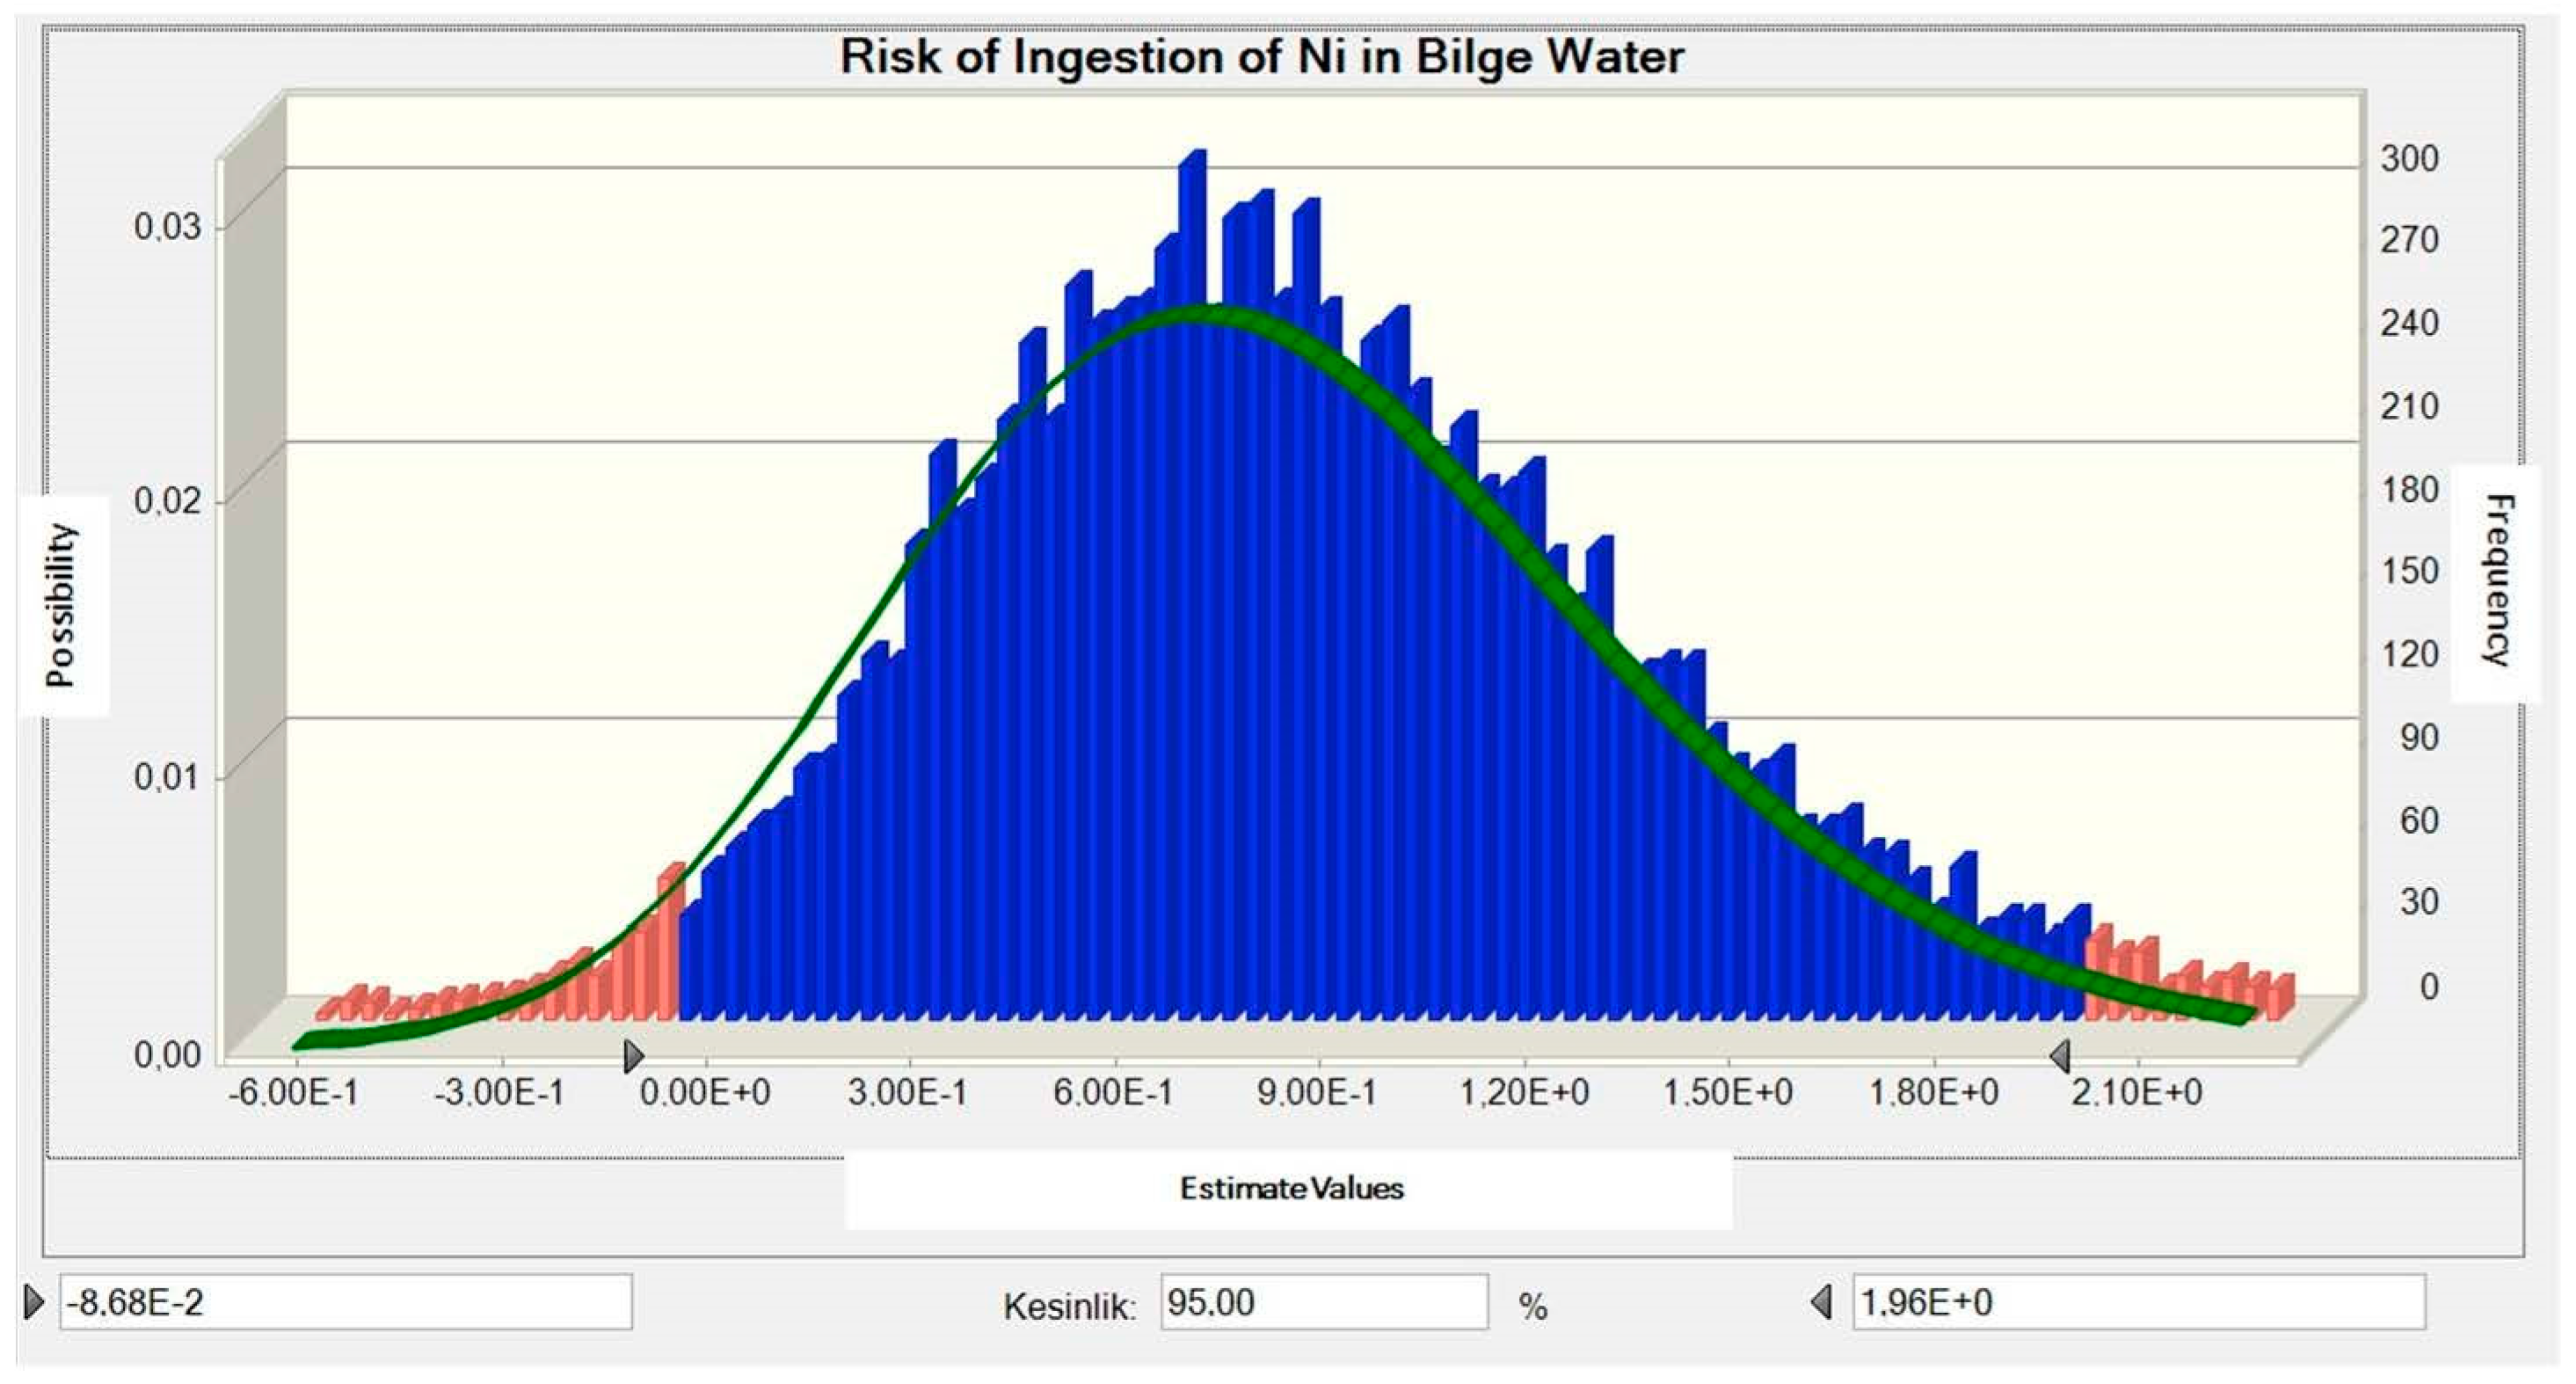
The human health carcinogenic risk values calculated by the MCS method originating from heavy metals in the bilge and wastewater contents are given in Table A4.Our results showed Table A4 that the highest carcinogenic risk to human health was Ni in the bilge water taken by swallowing with 8.06 × 10⁻¹ and the lowest risk was determined the Cr in wastewater with 5.32 × 10⁻⁴ by ingestion. Considering that the limit value defined by WHO for Ni from these values is 0.5 mg L−1, it is seen that the 0.81 mg L−1 value calculated by MCS using the values in the literature poses a significant risk for human health as a carcinogen. For Cr, the risk of ingestion of wastewater ingestion is 0.29 mg L−1, and the risk of ingestion through the skin from the bilge water is 0.38 mg L−1, which is above the limit value of 0.05 mg L−1 determined by WHO.
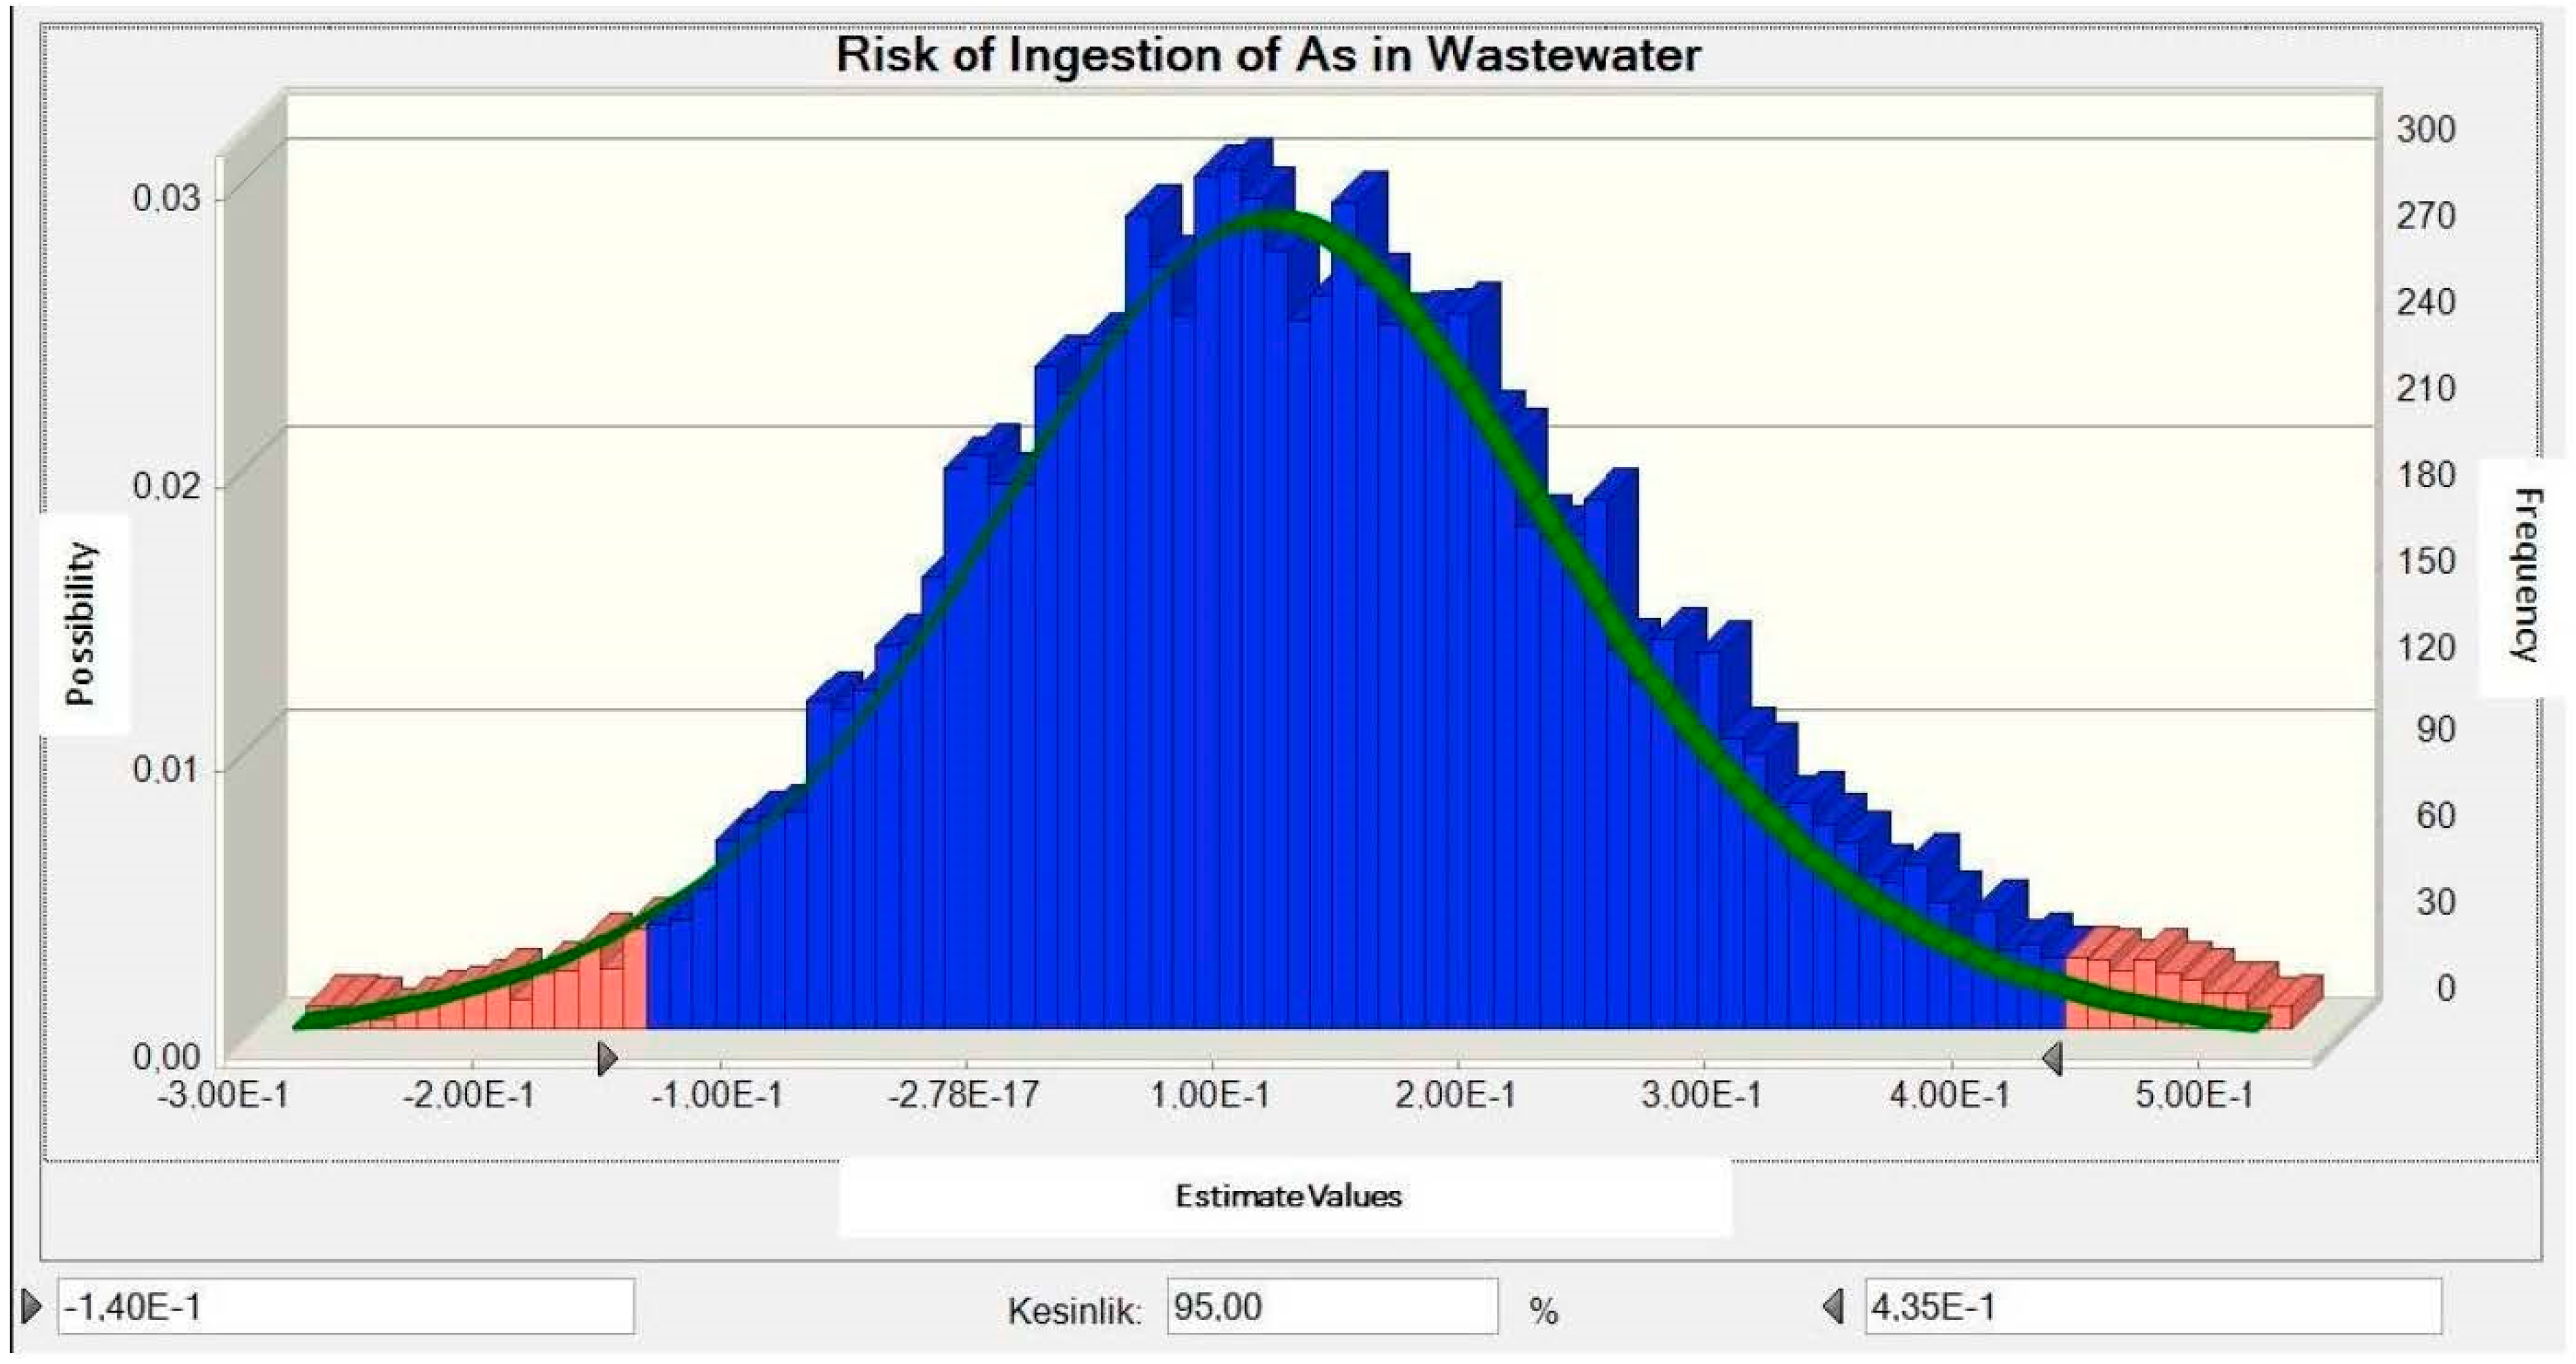
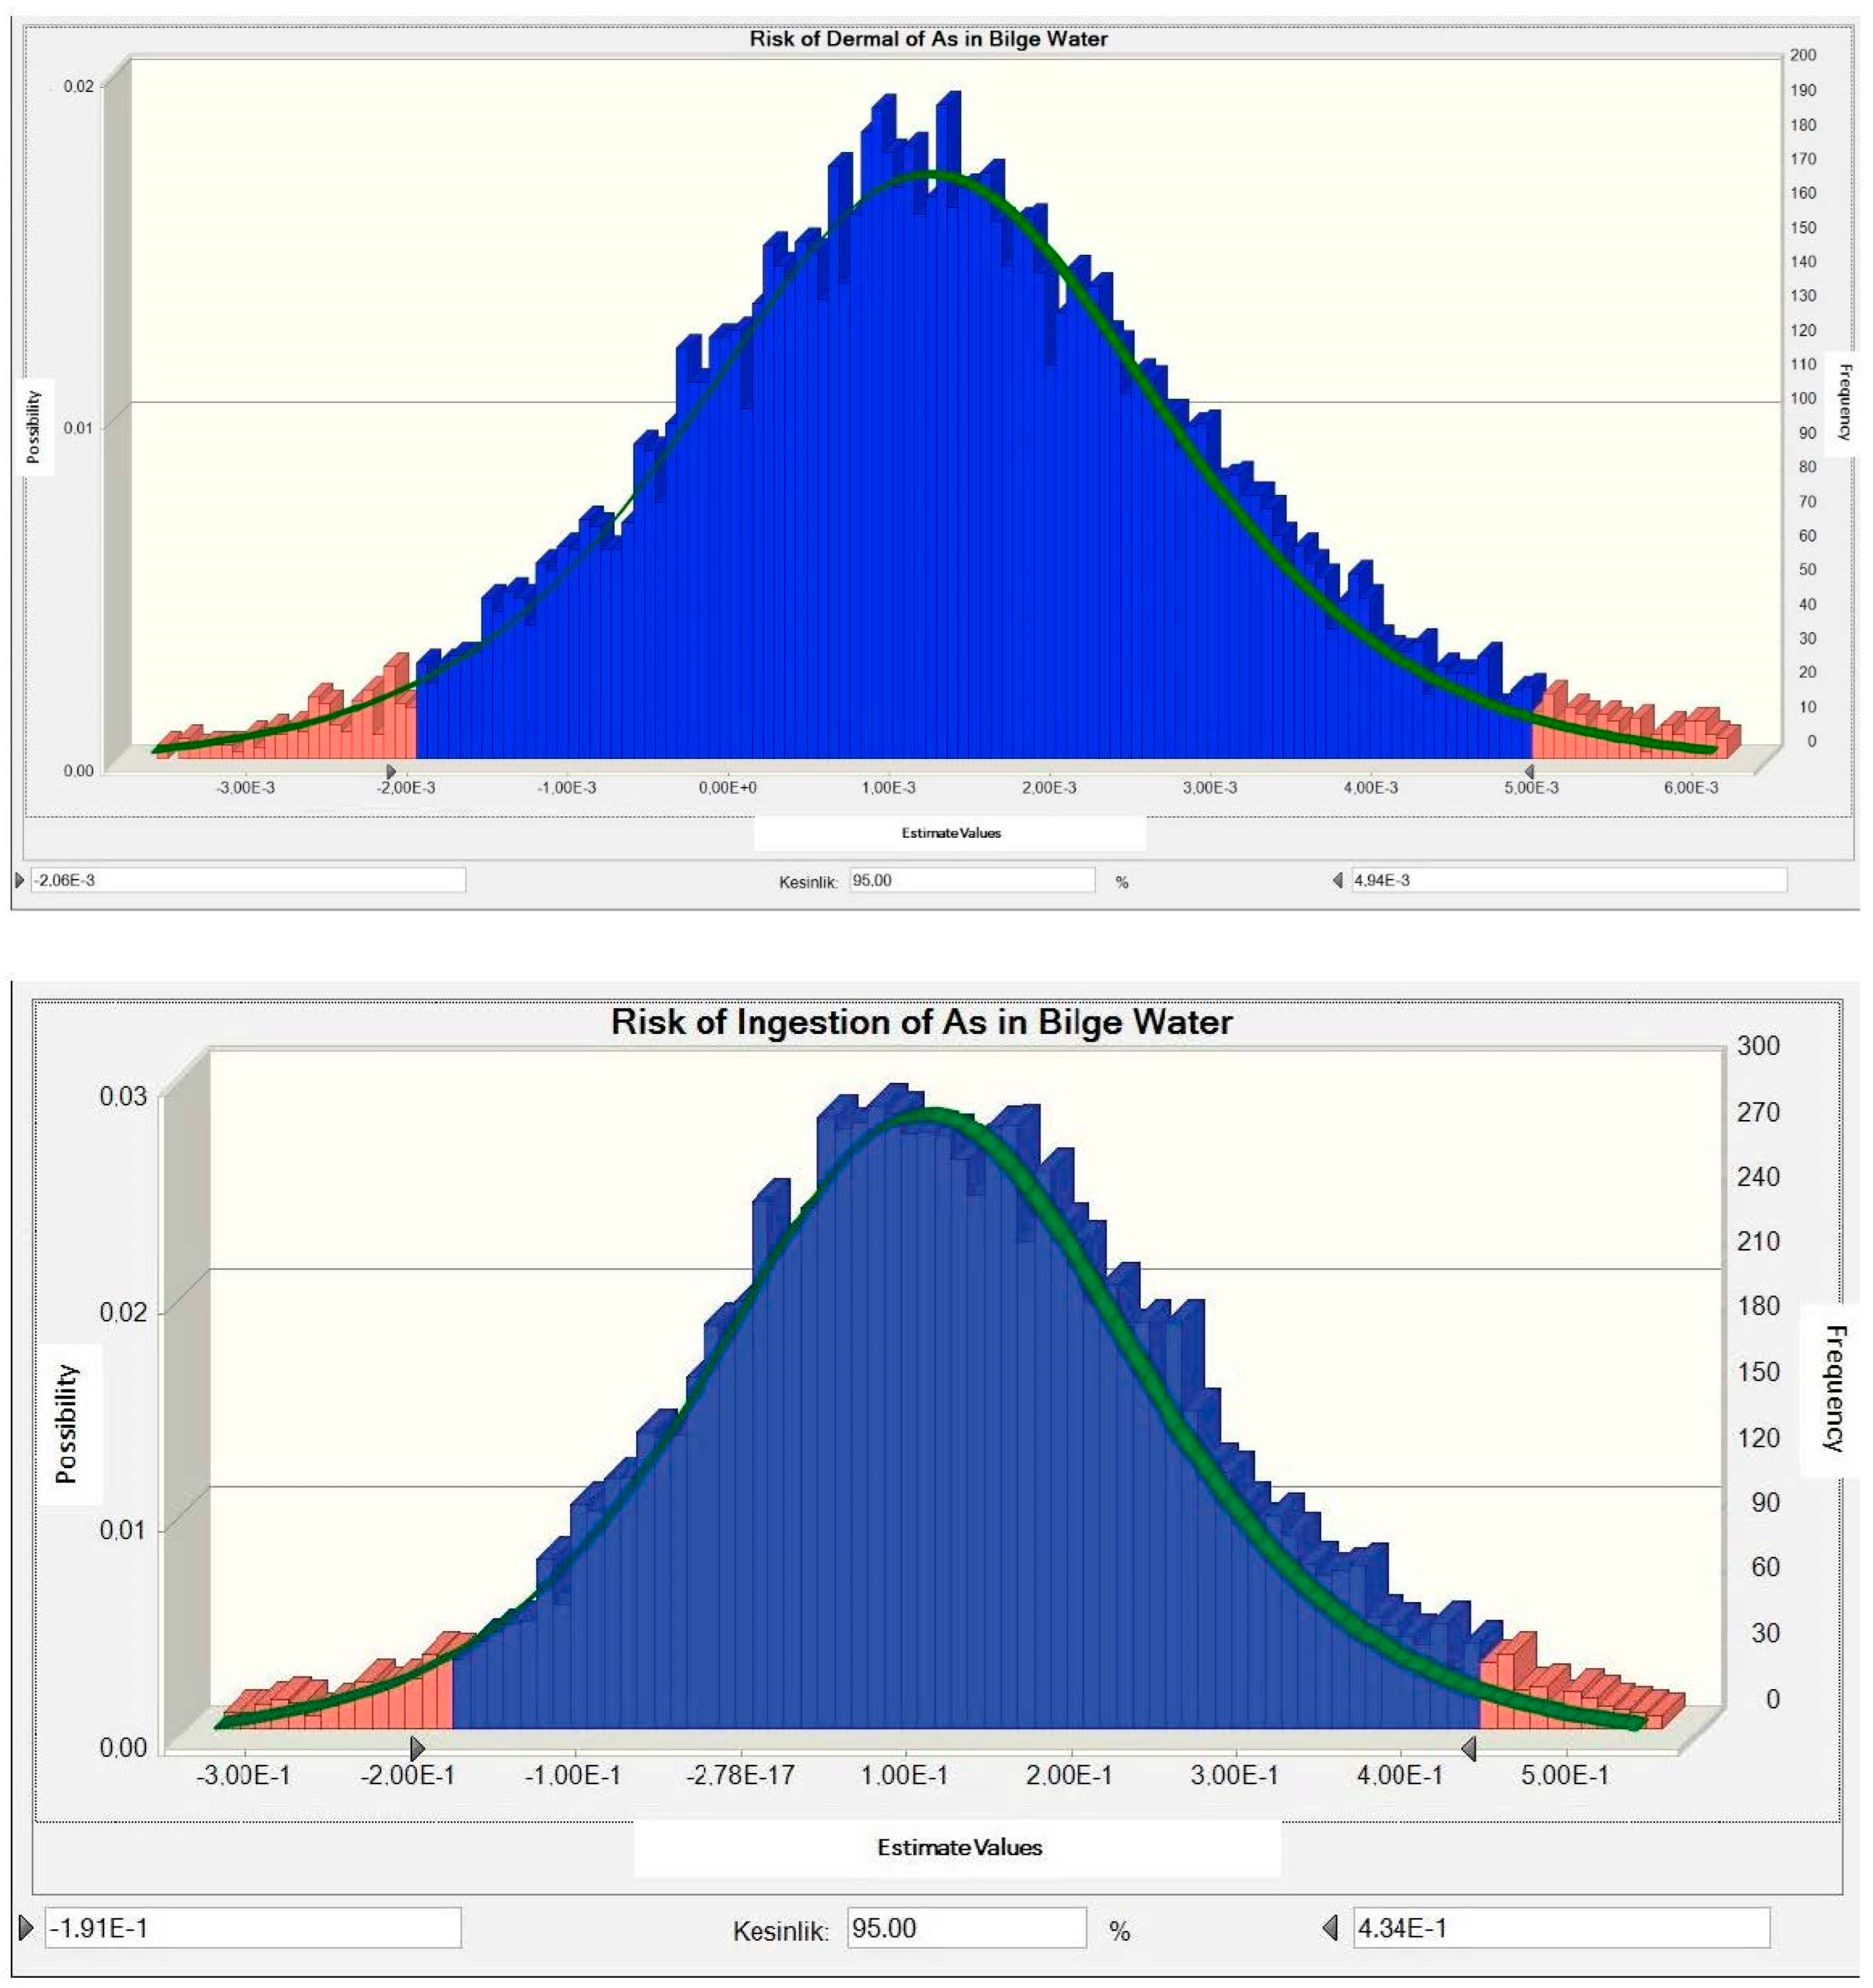
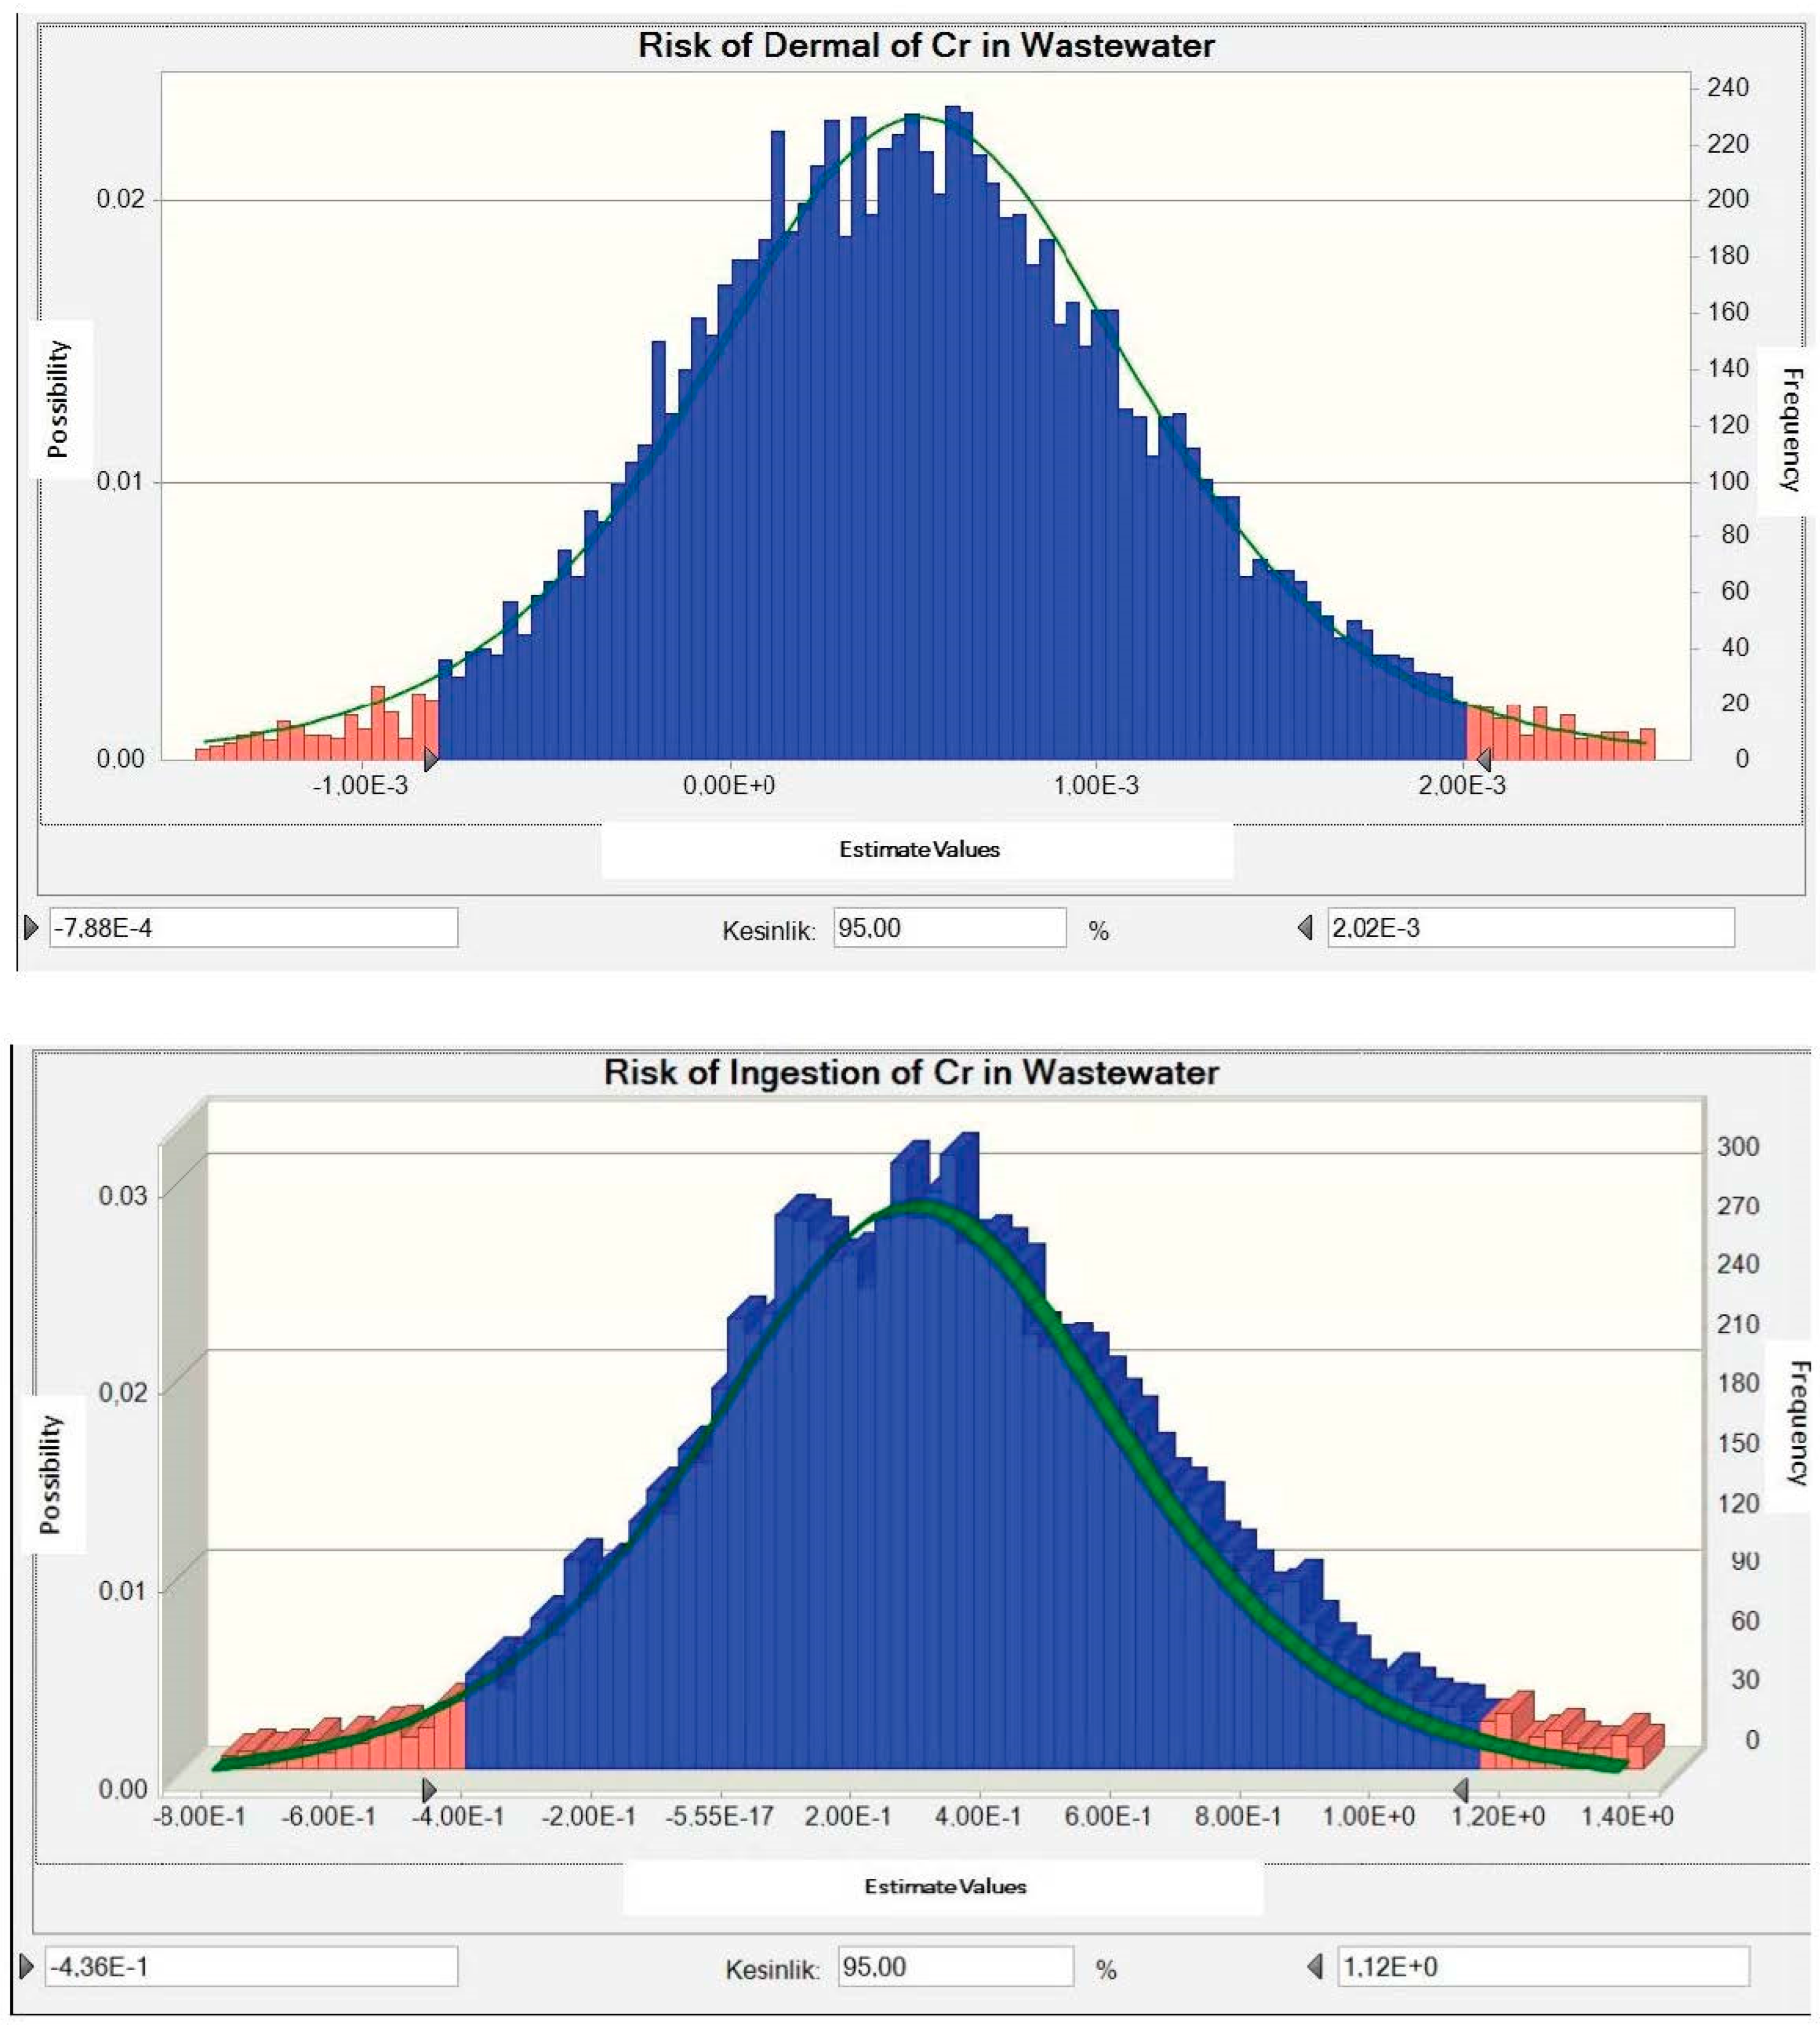
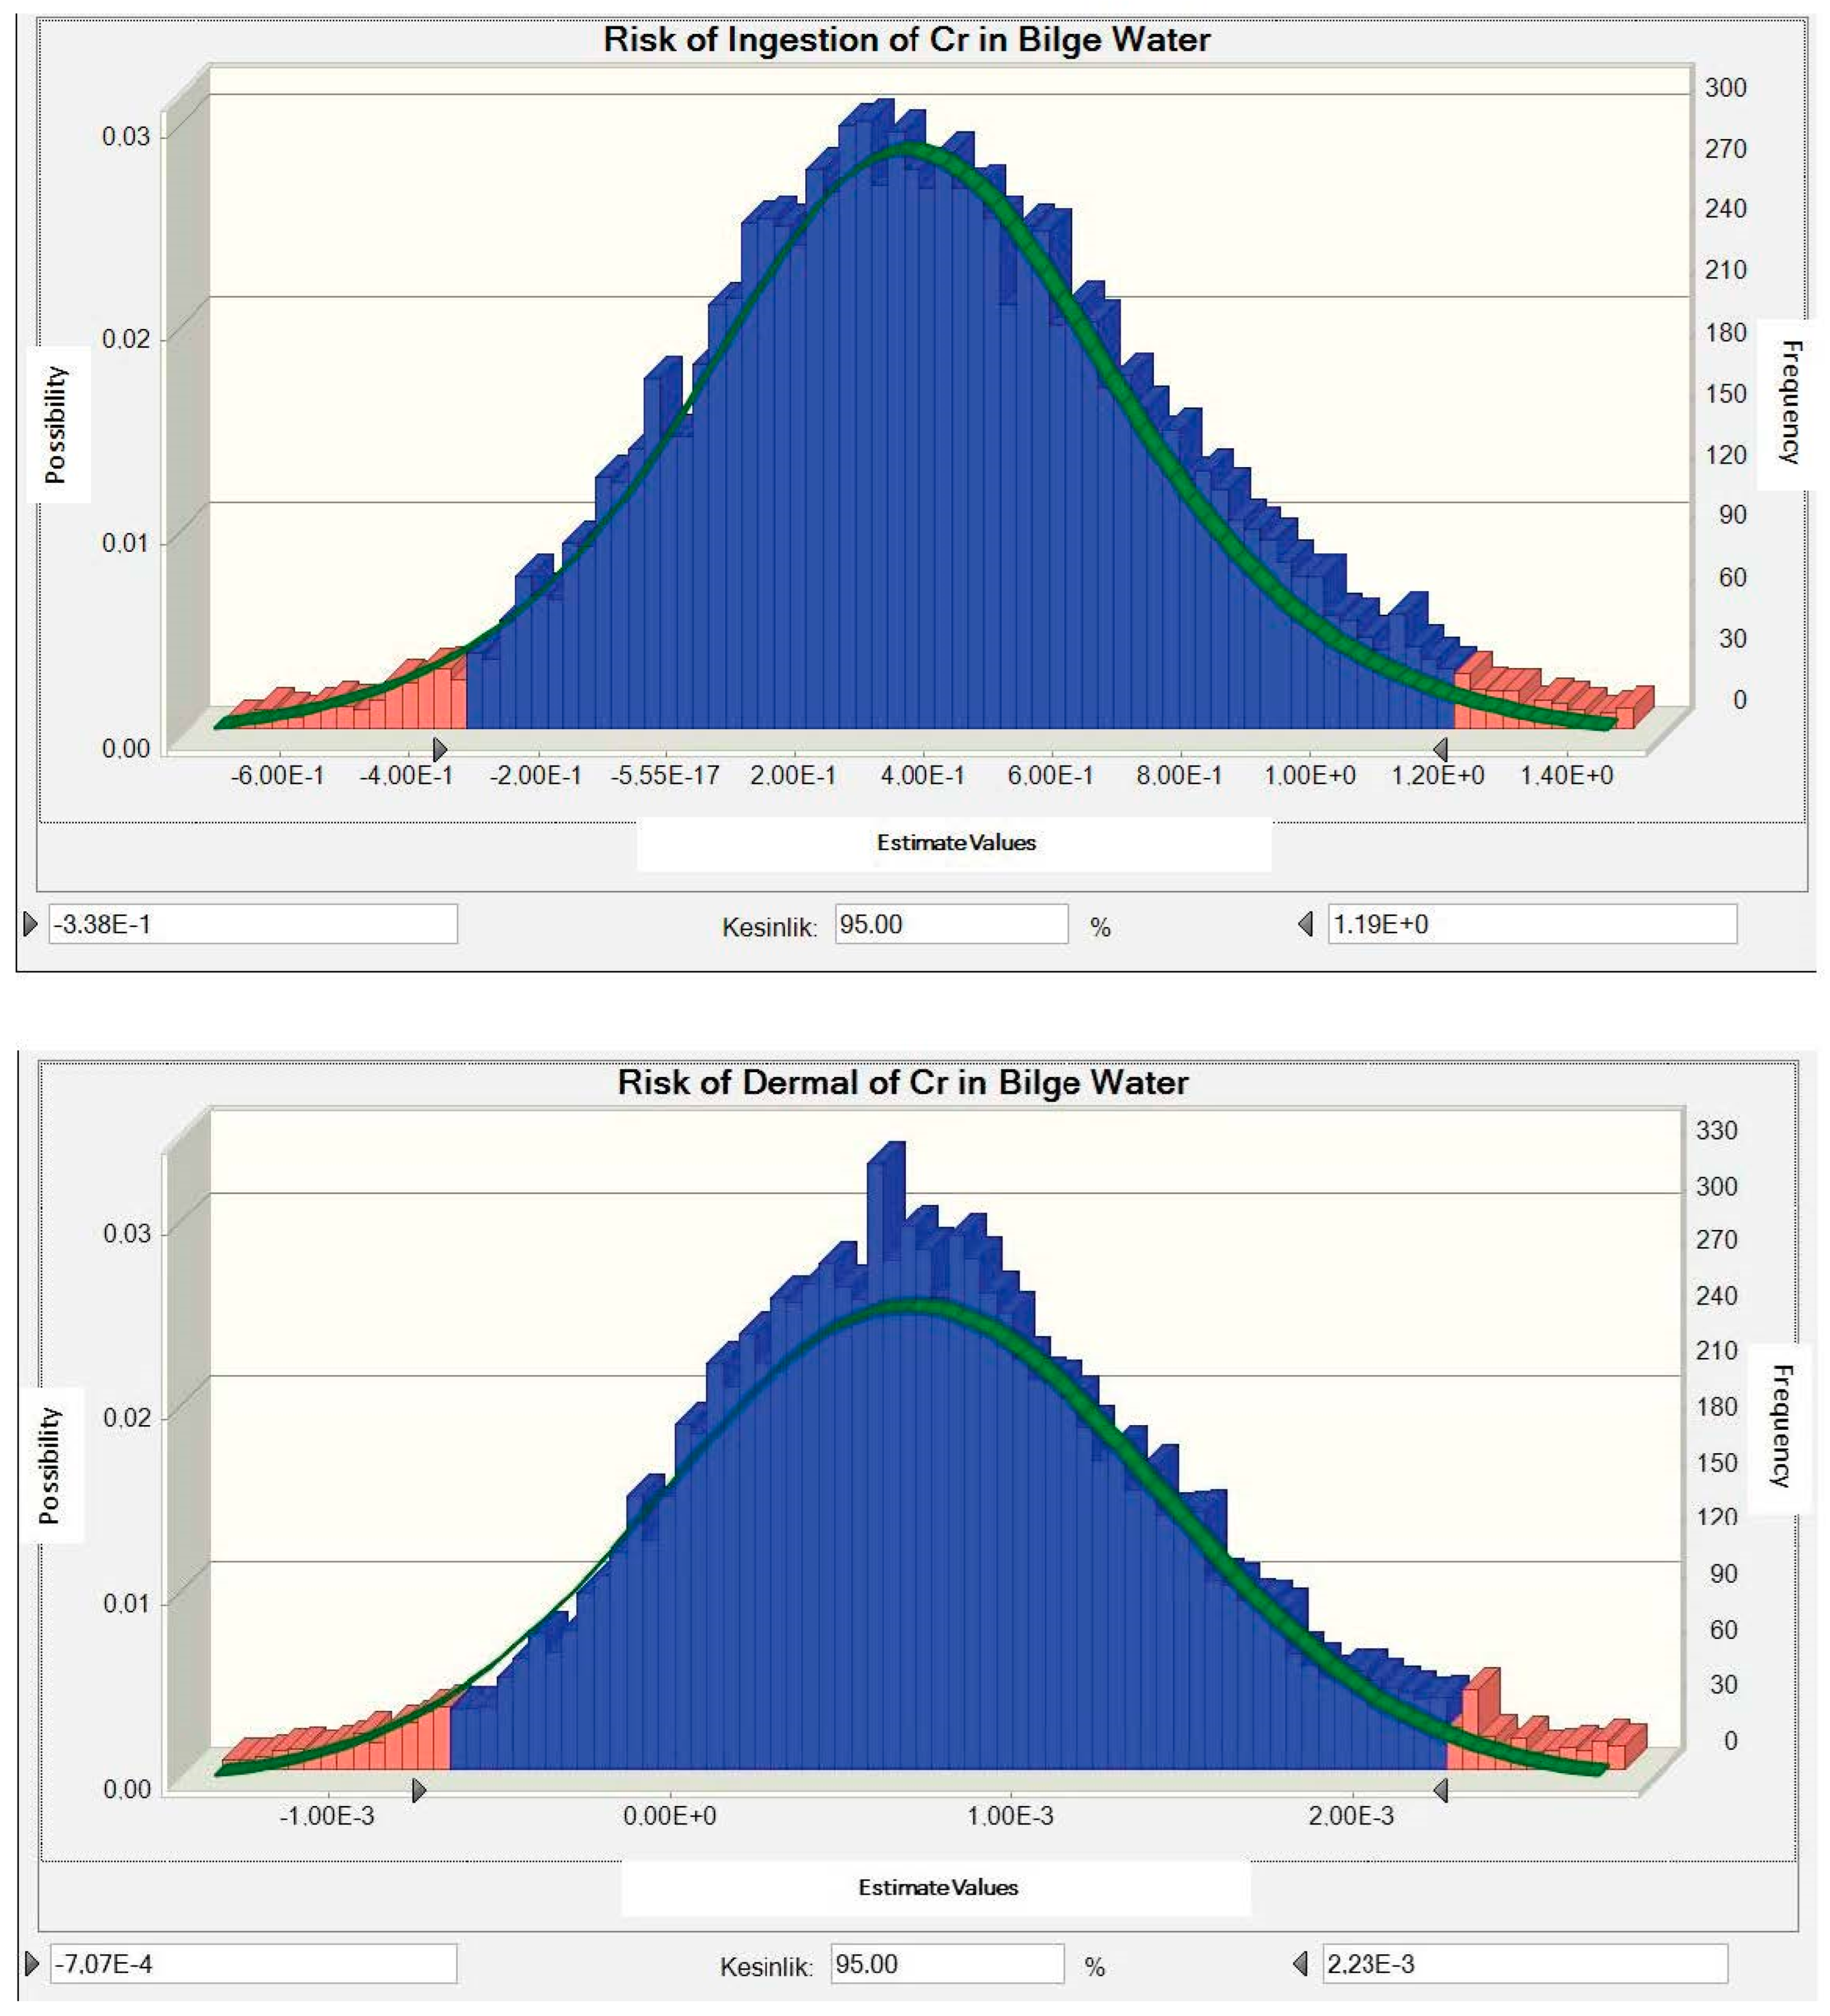
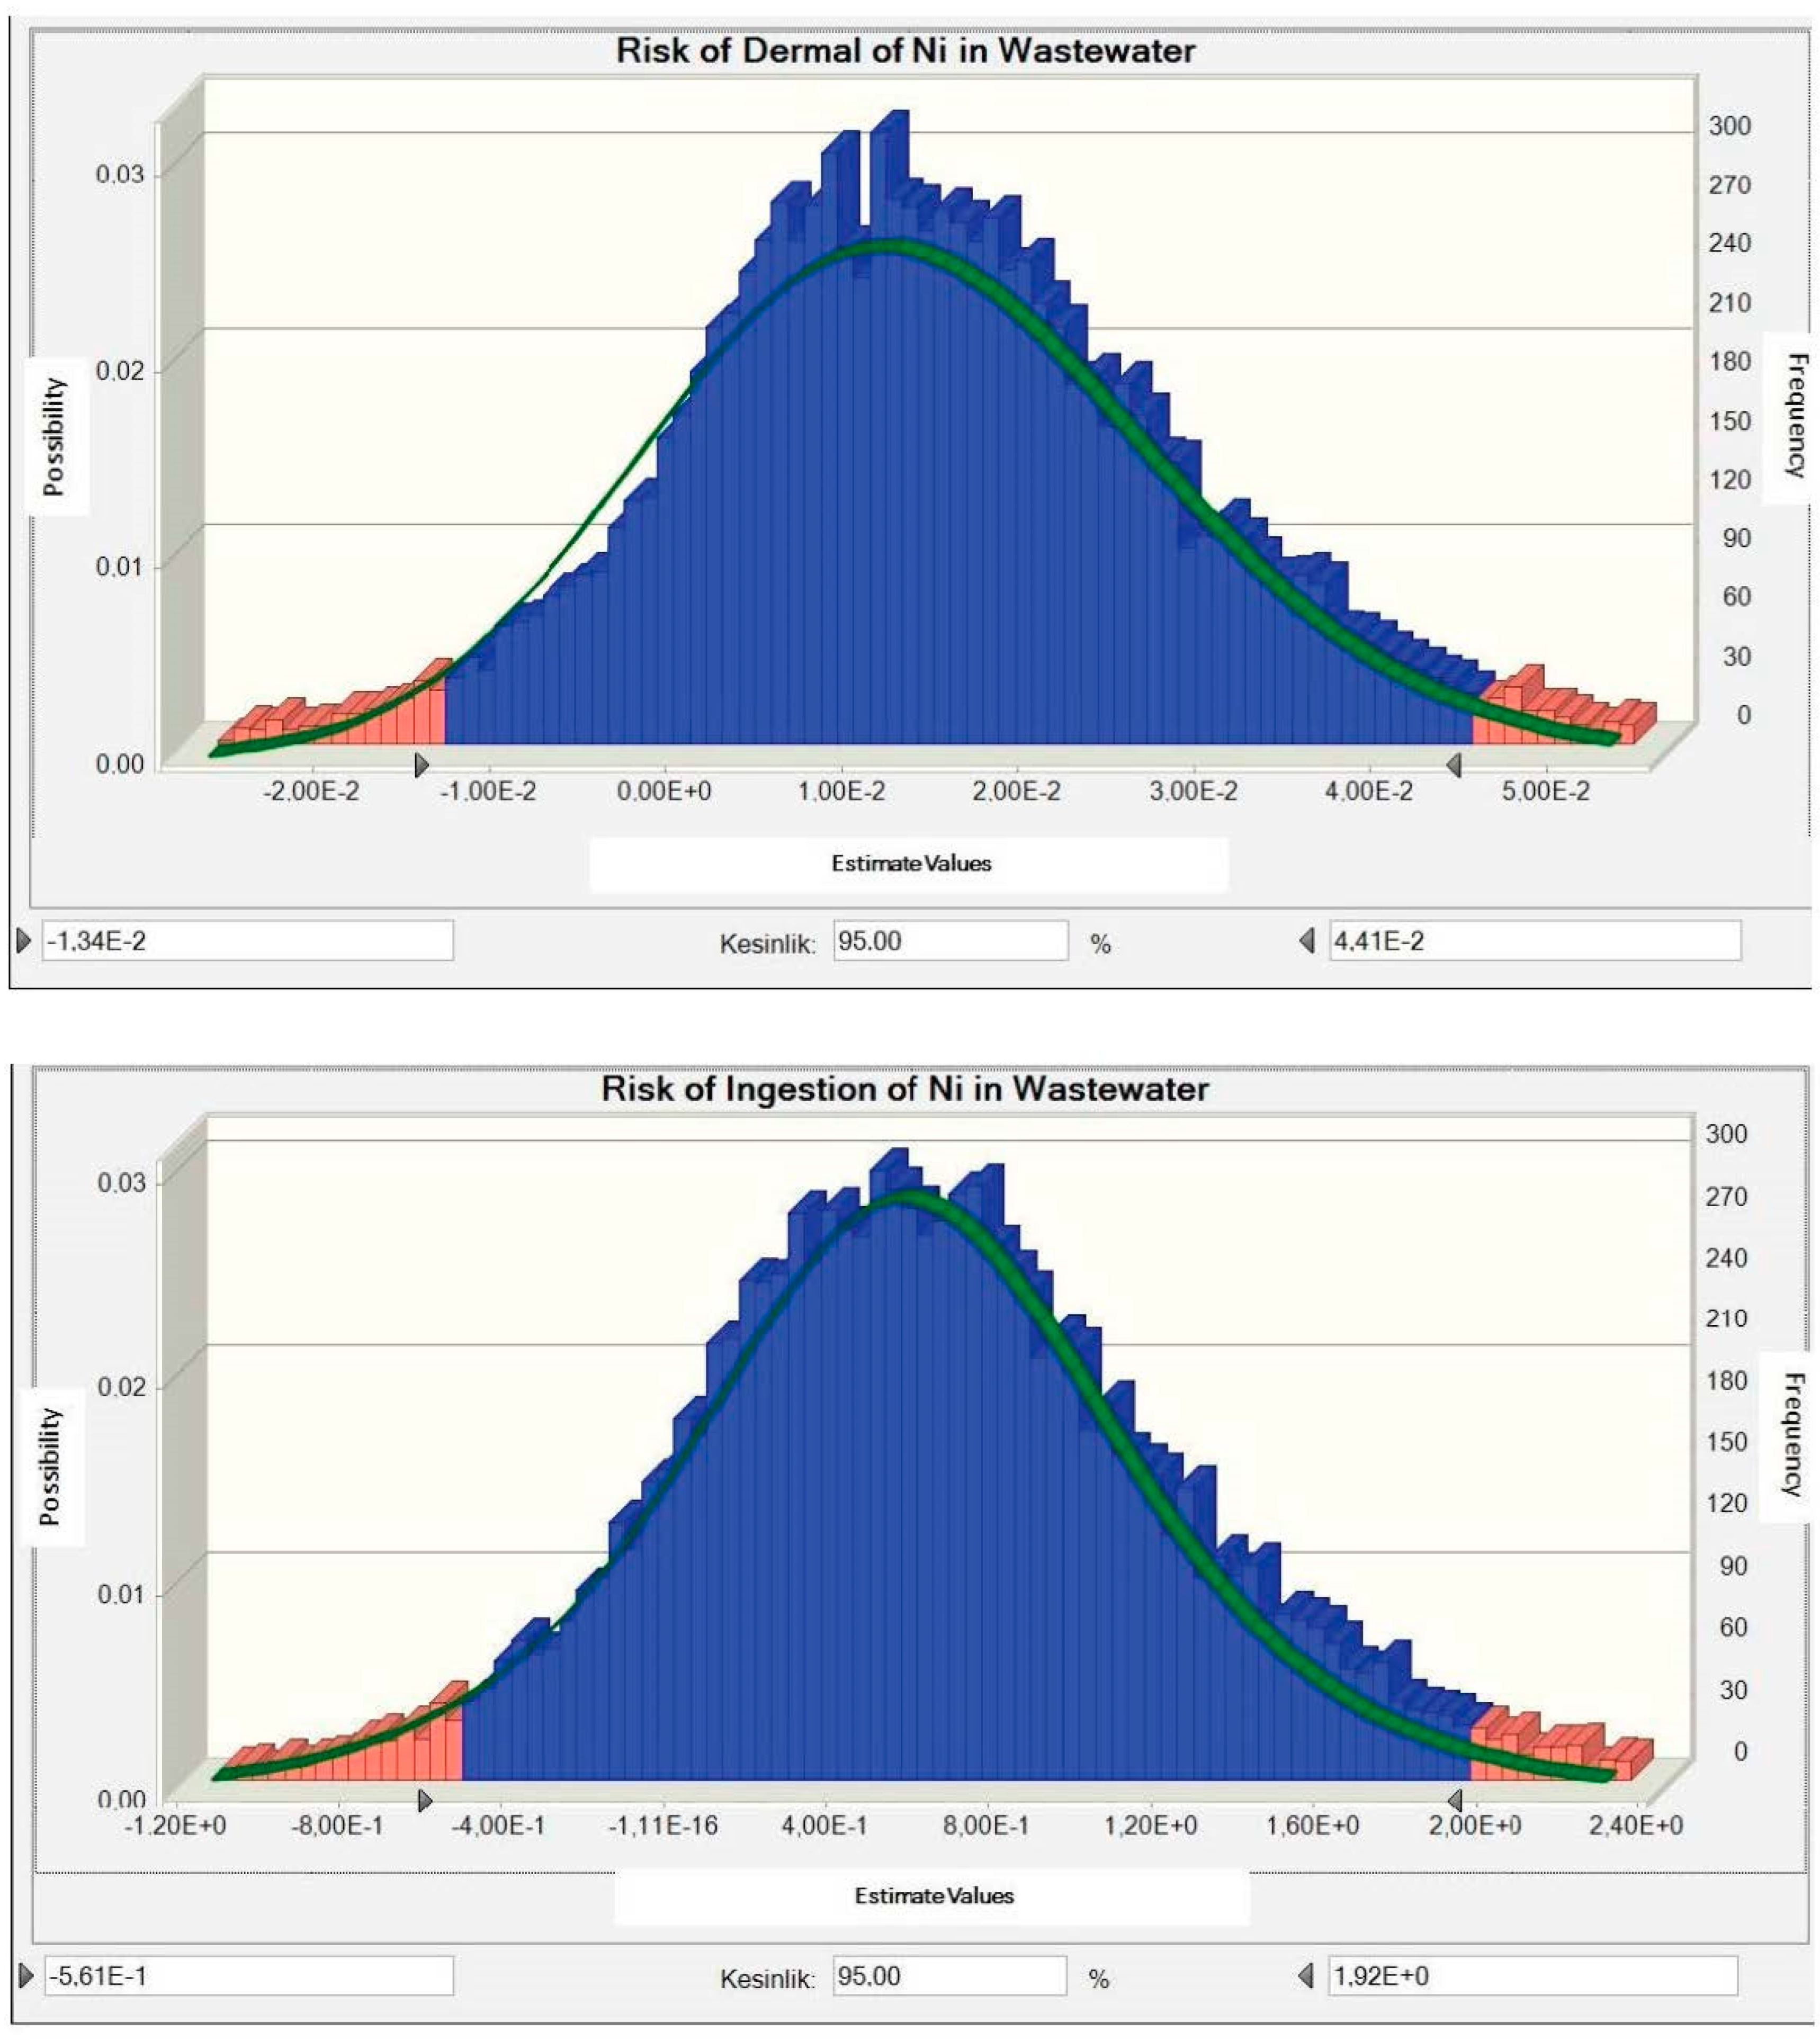
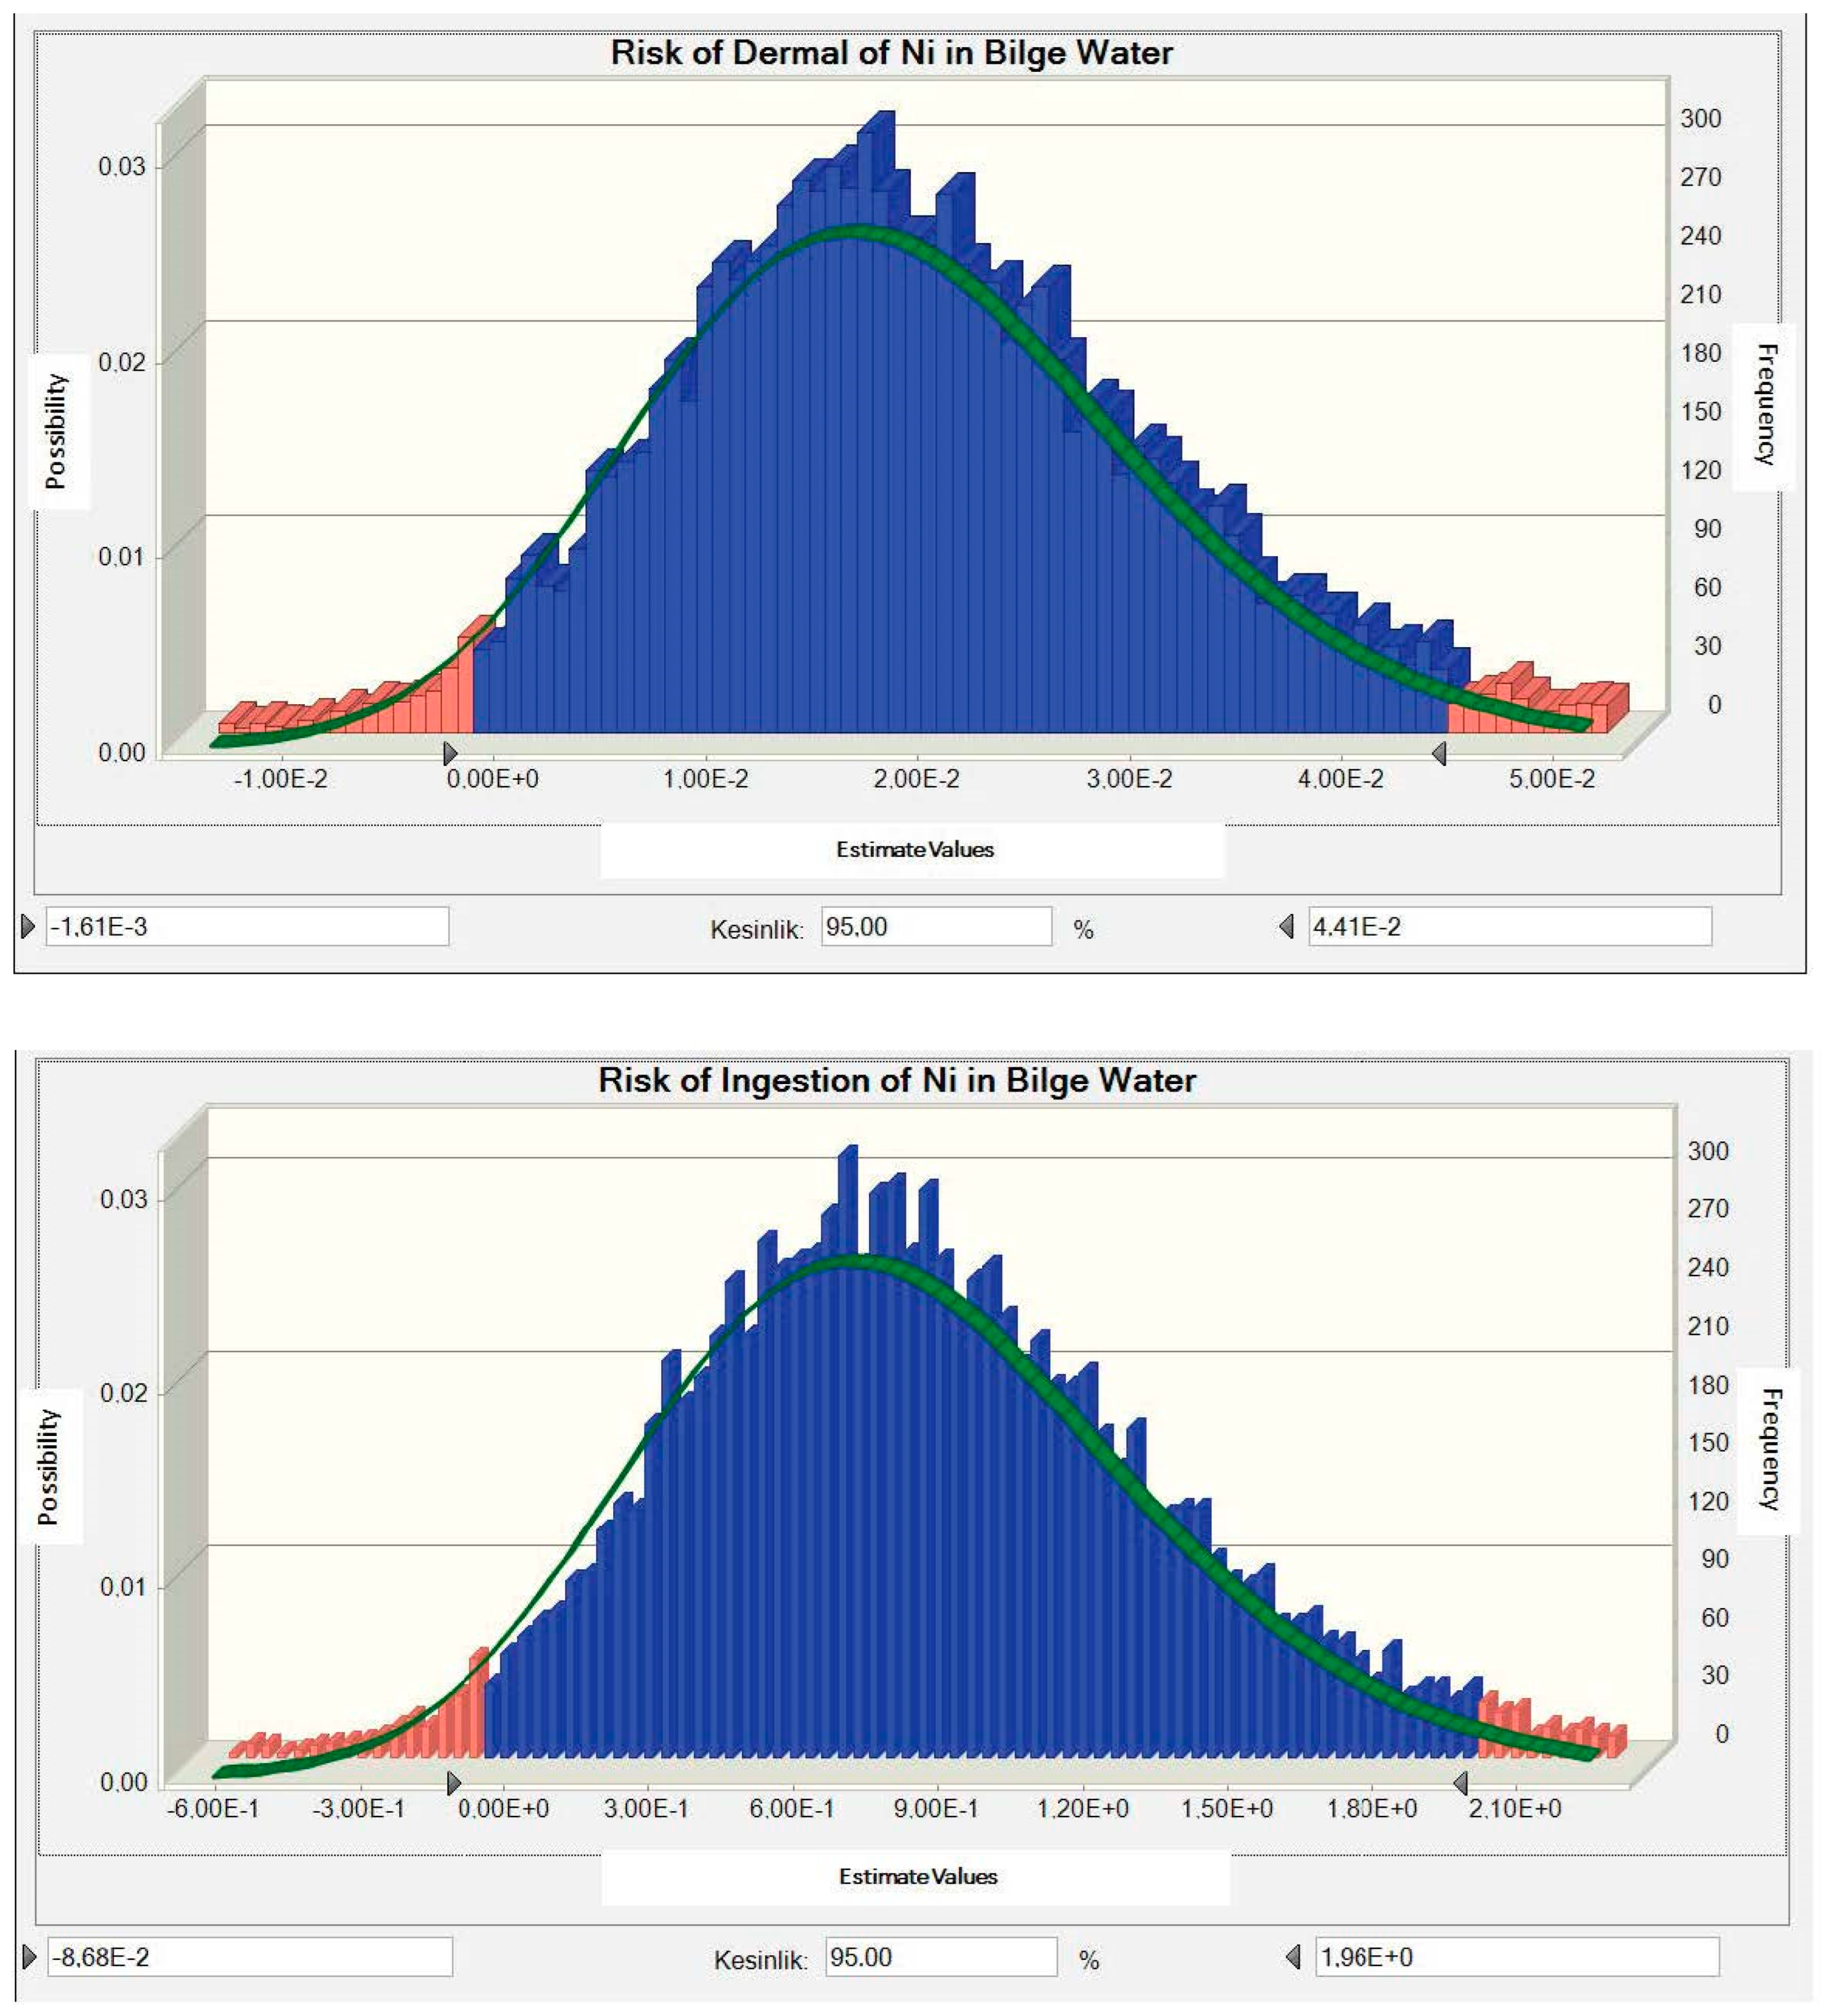
It was determined that all of the calculated risk values for Ni were above 0.5 mg L−1, which is the limit value determined by the WHO. The limit value As determined by the WHO is 0.01 mg L−1, the wastewater ingestion risk is 0.13 mg L−1, and the risk of ingestion of bilge water is calculated as 0.11 mg L−1. It is seen that these values are well above the limit value. The MSC risk distribution of the contamination of Ni in the bilge water by ingestion is given in Figure 2. MCS risk distribution graphs of other heavy metals are shown in Figure A1. The carcinogenic risk distributions of Cd and Co could not be calculated since they did not have CSF values.
In the study using MCS, non-carcinogenic oral (1.10 × 10⁻⁴) and dermal (1.47 × 10⁻⁴) and carcinogenic oral (1.88 × 10⁻⁶) and dermal (1.41 × 10⁻⁶) children exposed to arsenic in petroleum-derived oils on beaches, it was determined that the risk of carcinogen by the dermal route is higher in the risk assessment. The overall risk estimates are highest (2.88 × 10⁻⁵) for the dermal exposure route [64].
The study determined the health risk that may occur only by swallowing drinking water. In addition, carcinogenic and non-carcinogenic risk has not been examined [65].
When the risk of dermal uptake of heavy metals from wastewater is evaluated, it is determined that the order is Ni > As > Cr, and the risk of ingestion from wastewater is Ni > Cr > As. The risk of dermal ingestion of heavy metals in the bilge is Ni > As > Cr, and the risk of ingestion is Ni > Cr > As.

3.4. Determination of Non-Carcinogenic Risk Distribution

Non-carcinogenic risk values for human health calculated by the MCS method originating from heavy metals in bilgewater, wastewater, and seawater are given in Table A5. This study found that the heavy metal, which constitutes the highest non-carcinogenic risk for human health, was 3.39 and Hg in the bilge water content, and the lowest risk was 5.12 × 10⁻⁵ and Zn in the wastewater content. It has been determined that there is a risk of transmission through the skin. If the calculated heavy metal non-carcinogenic risk is greater than 1, it indicates the probability of adverse health effects, and less than 1 shows no adverse health effects [54]. It was determined that the Cu, Fe, V, Mn, Ni, Cd, and Pb values were below one and did not have a negative effect on human health.
It has been determined that the human health risk caused by ingestion of Cr in the wastewater content is 1.69 mg L−1, and the human health risk caused by ingestion in the bilge content is 2.85. Similarly, it has been determined that the human health risk caused by ingestion of Co in the wastewater content is 2.56, and the human health risk caused by ingestion in the bilge content is 1.7. In addition, it has been determined that the human health risk caused by ingestion of As in the wastewater content is 3.06 mg L−1, and the human health risk caused by ingestion of Hg in the bilge content is 3.4, which is the highest risk. It has been determined that the order of the non-carcinogenic total risk values in the bilge and wastewater content is As > Cr > Co > Hg. Since the values are above the acceptable value of 1, it has been determined that it poses a human health risk.

3.5. Results Analysis

The study conducted in Meishan Bay in 2020 determined that the leading cause of Zn was shipborne, and Hg was caused by wastewater [40]. Similarly, in this study, as given in Table 1, the Zn value was measured as 3.99 mg L−1 and the Hg value as 15.11 mg L−1. Therefore, it is considered that ship activities may cause heavy metal pollution in the Mediterranean. It has been determined that Zn in wastewater from ships poses a severe environmental risk. Similarly, this study measured 4.63 mg L−1 and 4.64 mg L−1 values in wastewater samples taken from ships [33].
Several studies evaluated that human activities cause heavy metal pollution in the seas [13,18,19]. However, these studies did not examine heavy metals at sea from which human activity originates.
In the study conducted the Northern Mediterranean, heavy metal pollution of Hg, Zn, Cd, and Cu was determined [16]. It was determined that this could be due to the ship activities in the ports. Similarly, in this study, as seen in Table 1, Hg, Zn, and Cu values were measured above the acceptable limits [38,58]. Therefore, it has been evaluated that the heavy metal pollution values obtained in this study may be caused by ships.
As stated above, this environmental risk caused by heavy metals can also pose a severe risk to human health. This study determined that there may be a health risk if people are exposed to heavy metals that may originate from ships in the Mediterranean. However, the effects of these wastes on heavy metals in sea water were not investigated in the studies given in Table 2 and Table 3 about heavy metals in sea water and the bilge and wastewater from ships. Therefore, the study is the first to examine the human health risk of bilge and wastewater discharged into sea water. To better understand the results of this study, more detailed studies should be carried out by taking these results as a reference.

4. Conclusions

Based on the European Parliament’s Water Framework Directive (WFD) (Directive 2000/60/EC), the heavy metal concentrations that should be in seawater have been determined according to the “Surface waters management regulation” issued within the scope of the European Union harmonization in the formation of water policy in our country. According to this legislation, the heavy metal concentrations measured in seawater were evaluated, chromium was 16 times higher, zinc 7.5 times higher, and iron 162 times higher.
In the carcinogenic risk calculation, the dermal ingestion of heavy metals from wastewater is listed as Ni > As > Cr from the highest to the lowest, and the risk of ingestion from the wastewater as Ni > Cr > As from the highest to the lowest. The dermal ingestion of heavy metals in the bilge is determined as Ni > As > Cr from highest to lowest and Ni > Cr > As for ingestion risk.
The non-carcinogenic risk assessment calculated that the Cu, Fe, V, Mn, Ni, Cd, and Pb values were below 1 and did not harm human health. However, it can be predicted that it can cause other diseases. Non-carcinogenic risk calculations of the specified heavy metals in the bilge and wastewater were totally evaluated by skin and ingestion.It has been determined that the order of the non-carcinogenic total risk values in the bilge and wastewater content is As > Cr > Co > Hg. Since the values are above the acceptable value of 1, it has been determined that it poses a human health risk.
It has been calculated that the human health risk of Cr, Ni and As is much higher than the values determined by WHO and that the bilge and wastewater have carcinogenic risks for human health. It is thought that this risk will be pretty high for the personnel working as technical personnel on the ship and the swimmers due to illegal discharges. This study recommended taking and controlling protective measures to reduce the risk of carcinogens in dermal and inhalation.
Since the human health risk of heavy metals in the contents of wastewater and bilge waste from ships was evaluated with the MCS method for the first time in the study, the results of the current research should be assessed as a basis. When the results obtained from this study were evaluated, it was seen that the bilge and wastewater wastes from ships on our seas and coasts pose a serious human health risk. It is considered that this risk can only be avoided by taking adequate measures and carrying out strict controls. It has emerged that there is a need for research, including measures such as prevention of wastewater and bilge water leakage discharges and re-examination of waste reception systems in ports and marinas.

Author Contributions

Conceptualization, Ö.H.Ö.; data curation, Ö.H.Ö.; investigation, Ö.H.Ö.; methodology, G.T.İ.; supervision, G.T.İ. and H.M.; validation, H.M.; visualization, H.M.; writing—review & editing, G.T.İ. All authors have read and agreed to the published version of the manuscript.

Funding

This work was supported by Research Fund of Akdeniz University. Project Number: 5415.

Institutional Review Board Statement

Not applicable.

Informed Consent Statement

Not applicable.

Data Availability Statement

Not applicable.

Conflicts of Interest

The authors declare no conflict of interest.

Appendix A

Table A1. The CSF values used in calculating heavy metals with MCS.
Contaminant of Potential ConcernOral CSF
(Chen, 2019)
Dermal CSF
(Chen, 2019)
Oral CSF
(Soleimani vd. 2020)
Oral RfD
(Chen, 2019)
Dermal RfD
(Chen, 2019)
(mgkg−1day−1)−1(mgkg−1day−1)−1(mgkg−1day−1)−1(mgkg−1day−1)−1(mgkg−1day−1)−1
Pbn/dn/d0.0021.40 × 10−35.25 × 10⁻⁴
Cr5.01 × 10−12.00 × 101n/d3.00 × 10−33.00 × 10⁻³
Cdn/dn/d0.0055.00 × 10−41.00 × 10⁻⁵
Mnn/dn/dn/d1.40 × 10−12.33 × 10⁻²
Con/dn/dn/d3.00 × 10−46.00 × 10⁻⁵
Ni1.704.25 × 101n/d2.00 × 10−25.40 × 10⁻³
Znn/dn/dn/d3.00 × 10−16.00 × 10⁻²
Vn/dn/dn/d9.00 × 10−39.00 × 10⁻³
Fen/dn/dn/d7.00 × 10−11.40 × 10⁻¹
As1.503.66n/d3.00 × 10−41.23 × 10⁻⁴
Hgn/dn/dn/d3.00 × 10−42.10 × 10⁻⁵
Cun/dn/dn/d4.00 × 10−21.20 × 10⁻²
n/d (not detected).
Table A2. The constant values obtained from the literature and used in the risk formula.
ParametersDistribution (Saha vd. 2017)MeanSDUnitUncertainty Range
IR (daily intake rate) (L/day)Log-normal2.200.34L−30% to 10%
BW (body weight) (kg)Log-normal7010.71kg−30% to 20%
SA (surface area of the skin (m2)Log-normal1.80.092m2−10% to 10%
EF (exposure frequency) (day/year)Triangular--day350 (180–365)
ET (exposure time) Triangular--h0.58 (0.4–0.7)
Kp (cm h−1)Cd, Cr, As, Fe, Mn, Cu, V ve Hg 1 × 10⁻³ cm h−1;
Pb 1 × 10⁻⁴ cm h−1;
Zn 6 × 10⁻⁴ cm h−1;
Ni 2 × 10⁻⁴ cm h−1;
Co 4 × 10⁻⁴ cm h−1
USEPA, 2011. Risk assessment guidance for superfund. In: Part A: Human Health Evaluation Manual; Part E, Supplemental Guidance for Dermal Risk Assessment; Part F, Supplemental Guidance for Inhalation Risk Assessment, vol. 1.
ED (Exposure Duration) (year)considered 70 years for carcinogen and 30 years for othersCr, Cd, As, Ni and Co are carcinogenic.
AT (Average Time)AT = 365 × ED
Table A3. The averages of heavy metal values measured on a station basis.
MetalsCrFeCuZnHg
Stations
1n/d *6.52.694.19n/d
20.9016.012.433.99n/d
3n/d5.573.044.0515
4n/d5.612.9753.6317.9
5n/d5.592.233.6613.95
6n/d5.92.784.02n/d
7n/d6.172.894.18n/d
8n/d5.472.763.73n/d
9n/d6.462.94.67n/d
10n/d5.172.064.0613.6
11n/d5.812.613.77n/d
* n/d (not detected): It could not be measured because it was below the limit values of the measuring device. V, Mn, Co, Ni, As, Cd and Pb values could not be measured as they were below the limit values at all stations.
Table A4. The human health carcinogenic risk values.
StatisticsWastewater IngestionWastewater DermalBilge WaterBilge WaterSum of Row
IngestionDermal
CrMEAN2.78 × 10−15.07 × 10−43.51 × 10−16.35 × 10−49.80 × 10−1
SD3.89 × 10−16.97 × 10−43.98 × 10−17.36 × 10−47.89 × 10−1
95%2.95 × 10−15.32 × 10−43.77 × 10−16.80 × 10−46.47 × 10⁻¹
NiMEAN5.53 × 10−11.26 × 10−27.64 × 10−11.76 × 10−21.39 × 100
SD6.27 × 10−11.39 × 10−25.16 × 10−11.17 × 10−21.17 × 100
95%5.92 × 10−11.33 × 10−28.06 × 10−11.86 × 10−21.43 × 100
AsMEAN1.12 × 10−11.29 × 10−31.06 × 10−11.20 × 10−32.21 × 10−1
SD1.45 × 10−11.61 × 10−31.53 × 10−11.73 × 10−33.02 × 10−1
95%1.21 × 10−11.36 × 10−31.13 × 10−11.27 × 10−32.37 × 10⁻¹
Sum of mean9.82 × 10−11.44 × 10−21.22 × 1001.95 × 10−22.24 × 100
Sum of 95%1.01 × 1001.51 × 10−21.27 × 1002.06 × 10−22.31 × 100
Table A5. Non-carcinogenic risk values for human health.
StatisticsWastewater IngestionWastewater DermalBilge WaterBilge WaterSum of Row
IngestionDermal
CuMEAN0.01376760.00020620.01323930.0002010.0274141
SD0.0234010.00035010.02136410.00032580.045441
95%0.01470420.00021860.01397330.00021220.0291083
FeMEAN0.00489070.00011080.00350960.0000837210.0085947
SD0.00897120.00021090.00829780.00018970.0176696
95%0.00526760.00011610.00369230.0000879920.009164
VMEANn/dn/d0.88325090.00400420.8872551
SDn/dn/d1.54500670.00709641.5521031
95%n/dn/d0.95030960.00432960.9546392
CrMEAN1.59386080.00715532.58476510.01216054.1979417
SD4.1883050.01917944.72271340.02160548.9518031
95%1.68698730.00745312.84371820.01307734.5512359
MnMEANn/dn/d0.05957950.00161970.0611993
SDn/dn/d0.12612460.00343310.1295577
95%n/dn/d0.06279490.00176680.0645617
CoMEAN2.35999870.02818291.57102460.01493183.974138
SD3.41286980.02516172.82708330.02567076.2907855
95%2.55638370.02990131.69193980.01565854.2938832
NiMEAN0.05947410.00019520.03359370.00011380.0933768
SD0.12674510.000430.09480590.00032260.2223036
95%0.06424190.00020520.03544110.00012420.1000124
ZnMEAN0.00371130.0000485160.00574770,0000831860.0095908
SD0.00664150.0000907620.00714250,0000964700.0139712
95%0.00398960.000051160.00621950,0000865540.0103468
AsMEAN2.78184640.03415682.91264790.03261035.7612614
SD5.61621130.06223895.53120110.062263811.271915
95%3.05388070.03570443.09631490.03446576.2203658
CdMEAN0.02411060.00560220.03574840.00824880.07371
SD0.0354650.00803730.03349680.00761380.0846128
95%0.02545780.00585540.03818720.00885430.0783547
HgMEANn/dn/d3.23466630.20388073.438547
SDn/dn/d6.85241510.44568667.2981017
95%n/dn/d3.39151520.21577733.6072926
PbMEAN0.35468920.00042490.47278350.0013750.8292725
SD0.70981010.00085950.81279130.00231611.525777
95%0.37613640.00045840.50456010.00146530.8826202
Sum of mean7.19634940.0760827511.810550.2793126919.36230
Sum of 95%7.78704930.0799637112.6386660.2959057220.801585
n/d (not detected).
Figure A1. MCS risk distribution graphs of other heavy metals.
Sustainability 14 08408 g0a1aSustainability 14 08408 g0a1bSustainability 14 08408 g0a1cSustainability 14 08408 g0a1dSustainability 14 08408 g0a1eSustainability 14 08408 g0a1f

References

  1. EPA. Cruise Ship Discharge Assessment Report; Environmental Protection Agency, Office of Water: Washington, DC, USA, 2008. [Google Scholar]
  2. Zodiatis, G.; Lardner, R.; Spanoudaki, K.; Sofianos, S.; Radhakrishnan, H.; Coppini, G.; Liubartseva, S.; Kampanis, N.; Krokos, G.; Hoteit, I.; et al. Operational oil spill modelling assessments. In Marine Hydrocarbon Spill Assessments; Elsevier: Amsterdam, The Netherlands, 2021; pp. 145–197. [Google Scholar]
  3. UNEP MAP. Barcelona Convention—Mediterranean 2017 Quality Status Report Land and Sea-Based Pollution: Common Indicator 19 etc. Conclusions (CI19). 2017. Available online: https://www.medqsr.org/conclusions-ci19 (accessed on 2 October 2021).
  4. UNEP MAP. Barcelona Convention—Mediterranean 2017 Quality Status Report. Results and Status, Including Trends (CI19). 2017. Available online: https://www.medqsr.org/results-and-status-including-trends-ci19 (accessed on 1 March 2022).
  5. UNESCO. The Integrated, Strategic Design Plan for the Coastal Ocean Observations Module of the Global Ocean Observing System. In IOC Information Documents Series 1183; GOOS Report N 125; United Nations Educational, Scientific and Cultural Organization: Paris, France, 2003; 190p. [Google Scholar]
  6. Cucco, A.; Daniel, P. Numerical modeling of oil pollution in the Western Mediterranean Sea. In Oil Pollution in the Mediterranean Sea: Part I—The International Context; Carpenter, A., Kostianoy, A.G., Eds.; Springer: New York, NY, USA, 2018. [Google Scholar] [CrossRef]
  7. Girin, M.; Daniel, P. Oil pollution in French waters. In Oil Pollution in the Mediterranean Sea: Part II—National Case Studies; Handbook of Environmental Chemistry; Carpenter, A., Kostianoy, A.G., Eds.; Springer: Berlin, Germany, 2018. [Google Scholar]
  8. Sajjadi, S.A.; Mohammadi, A.; Khosravi, R.; Zarei, A. Distribution, exposure, and human health risk analysis of heavy metals in drinking groundwater of Ghayen County, Iran. Geocarto Int. 2022, 1–16. [Google Scholar] [CrossRef]
  9. Seifi, M.; Mahvi, A.H.; Hashemi, S.Y.; Arfaeinia, H.; Pasalari, H.; Zarei, A.; Changani, F. Spatial distribution, enrichment and geo-accumulation of heavy metals in surface sediments near urban and industrial areas in the Persian Gulf. Desalination Water Treat. 2019, 158, 130–139. [Google Scholar] [CrossRef] [Green Version]
  10. Chan, M.W.H.; Hasan, K.A.; Balthazar-Silva, D.; Mirani, Z.A.; Asghar, M. Evaluation of heavy metal pollutants in salt and seawater under the influence of the Lyari River and potential health risk assessment. Mar. Pollut. Bull. 2021, 166, 112215. [Google Scholar] [CrossRef]
  11. Bat, L.; Arici, E.; Öztekin, A. Human Health Risk Assessment of Heavy Metals in the Black Sea: Evaluating Mussels. Curr. World Environ. 2018, 13, 15–31. [Google Scholar] [CrossRef] [Green Version]
  12. Yu, B.; Wang, X.; Dong, K.F.; Xiao, G.; Ma, D. Heavy metal concentrations in aquatic organisms (fishes, shrimp and crabs) and health risk assessment in China. Mar. Pollut. Bull. 2020, 159, 111505. Available online: https://www.sciencedirect.com/science/article/pii/S0025326X20306238 (accessed on 28 November 2021). [CrossRef]
  13. Mulsow, S.; Povince, P.; Wyse, E.; Benmansour, M.; Sammir, B.; Cahfik, A. Trace elements, heavy metals and Pb isotopic ratios in marine sediments of the south Mediterranean Sea (Morroco). Rapp. Comm. Int. Mer Me’Diterranee 2001, 36, 147. [Google Scholar]
  14. Rouibah, M. Etat de pollution par les me’taux lourds dans le port de Djen-Djen et le port de Jijel (Alge’rie). Rapp. Comm. Int. Mer Me’Diterranee 2001, 36, 160. [Google Scholar]
  15. Yoshida, M.; Hamdi, H.; Abdulnasser, I.; Jedidi, N. Contamination of potentially toxic elements (PTEs) in Bizerte lagoon bottom sediments, surface sediment and sediment repository. In Study on Environmental Pollution of Bizerte Lagoon; Ghrabi, A., Yoshida, M., Eds.; INRST-JICA Press: Tunis, Tunisia, 2004; pp. 31–54. [Google Scholar]
  16. Unep/Map. State of the Mediterranean marine and coastal environment. In United Nations Environment Programme/Mediterranean Action Plan (UNEP/MAP); Barcelona Convention: Athens, Greece, 2012; p. 96. [Google Scholar]
  17. EPA. Risk Assessment Guidance for Superfund; Volume I: Human Health Evaluation Manual (Part E, Supplemental Guidance for Dermal Risk Assessment); Office of Emergency and Remedial Response, US Environmental Protection Agency: Washington, DC, USA, 2004; Volume 5. [Google Scholar]
  18. Botté, S.E.; Freije, R.H.; Marcovecchio, J.E. Distribution of several heavy metals in tidal flats sediments within Bahía Blanca Estuary (Argentina). Water Air Soil Pollut. 2010, 210, 371–388. [Google Scholar] [CrossRef]
  19. Dessai, D.V.; Nayak, G.N. Distribution and speciation of selected metals in surface sediments, from the tropical Zuari estuary, central west coast of India. Environ. Monit. Assess. 2009, 158, 117–137. [Google Scholar] [CrossRef] [PubMed]
  20. Tom, N.F.Y.; Wong, Y.S. Hong Kong Mangroves; City University of Hong Kong Press: Hong Kong, China, 2000. [Google Scholar]
  21. Qu, C.; Sun, K.; Wang, S.; Huang, L.; Bi, J. Monte carlo simulation-based health risk assessment of heavy metal soil pollution: A case study in the Qixia mining area, China. Hum. Ecol. Risk Assess. Int. J. 2012, 18, 733–750. [Google Scholar] [CrossRef]
  22. Qu, C.; Ma, Z.; Yang, J.; Lie, Y.; Bi, J.; Huang, L. Human Exposure Path ways of Heavy Metal in a Lead-Zinc Mining Area. In Heavy Metal Contamination of Water and Soil: Analysis, Assessment, and Remediation Strategies; Srari, E.A., Ed.; Apple Academic Press: Oakville, ON, Canada, 2014; pp. 129–156. ISBN 9781771880046. [Google Scholar]
  23. Yalcin, F. Data Analysis of Beach Sands’ Chemical Analysis Using Multivariate Statistical Methods and Heavy Metal Distribution Maps: The Case of Moonlight Beach Sands, Kemer, Antalya, Turkey. Symmetry 2020, 12, 1538. [Google Scholar] [CrossRef]
  24. Türkmen, A. Investıgation of Heavy Metal Accumulation Occured in Seawater and Sediment from the Gulf of Iskenderun. Karadeniz Fen Bilimleri Derg. 2011, 2, 1–23. [Google Scholar]
  25. Göycincik, S.; Danahaliloğlu, H.; Karayiğit, H.B. Research of Trace Element Levels of Sea Water in İskenderun Bay. Karadeniz Fen Bilimleri Derg. 2018, 8, 39–48. [Google Scholar] [CrossRef]
  26. Yalçın, F.; Nyamsari, D.G.; Paksu, E.; Yalcin, M.G. Statistical assessment of heavy metal distribution and contamination of beach sands of Antalya-Turkey: An approach to the multivariate analysis techniques. Filomat 2016, 30, 945–952. [Google Scholar] [CrossRef]
  27. Yiğit, F. Gemi Kaynaklı Kirleticiler ve Trabzon Limanına Gelen Bazı Gemilerin Atıksularının Incelenmesi. Ph.D. Dissertation, Karadeniz Teknik Üniversitesi/Fen Bilimleri Enstitüsü, Trabzon, Turkey, 2006. [Google Scholar]
  28. Şahin, V.; Vardar, N. Determination of Wastewater Behavior of Large Passenger Ships Based on Their Main Parameters in the Pre Design Stage. J. Mar. Sci. Eng. 2020, 8, 546. [Google Scholar] [CrossRef]
  29. Asselin, M.; Drogui, P.; Brar, S.K.; Benmoussa, H.; Blais, J.F. Organics removal in oily bilgewater by electrocoagulation process. J. Hazard. Mater. 2008, 151, 446–455. [Google Scholar] [CrossRef]
  30. Olorunfemi, D.I.; Duru, L.; Olorunfemi, O.P. Genotoxic effects of bilge water on mitotic activity in Allium cepa L. Caryologia 2015, 68, 265–271. [Google Scholar] [CrossRef]
  31. Morley, N.H.; Burton, J.D.; Tankere, S.P.C.; Martin, J.M. Distribution and behavior of some dissolved trace metals in the western Mediterranean Sea. Deep Sea Res. 1997, 2, 675–691. [Google Scholar] [CrossRef]
  32. Tiselius, P.; Magnusson, K. Toxicity of treated bilge water: The need for revised regulatory control. Mar. Pollut. Bull. 2017, 114, 860–866. [Google Scholar] [CrossRef]
  33. Ytreberg, E.; Eriksson, M.; Maljutenko, I.; Jalkanen, J.P.; Johansson, L.; Hassellöv, I.M.; Granhag, L. Environmental impacts of grey water discharge from ships in the Baltic Sea. Mar. Pollut. Bull. 2020, 152, 110891. [Google Scholar] [CrossRef]
  34. Dang, P.; Gu, X.; Lin, C.; Xin, M.; Zhang, H.; Ouyang, W.; Liu, X.; He, M.; Wang, B. Distribution, sources, and ecological risks of potentially toxic elements in the Laizhou Bay, Bohai Sea: Under the long-term impact of the Yellow River input. J. Hazard. Mater. 2021, 413, 125429. [Google Scholar] [CrossRef] [PubMed]
  35. Kuang, Z.; Gu, Y.; Rao, Y.; Huang, H. Biological Risk Assessment of Heavy Metals in Sediments and Health Risk Assessment in Marine Organisms from Daya Bay, China. J. Mar. Sci. Eng. 2020, 9, 17. [Google Scholar] [CrossRef]
  36. Soleimani, H.; Azhdarpoor, A.; Hashemi, H.; Radfard, M.; Nasri, O.; Ghoochani, M.; Azizi, H.; Ebrahimzadeh, G.; Mahvi, A.H. Probabilistic and deterministic approaches to estimation of non-carcinogenic human health risk due to heavy metals in groundwater resources of torbat heydariyeh, southeastern of Iran. Int. J. Environ. Anal. Chem. 2020, 100, 1–15. [Google Scholar] [CrossRef]
  37. Arikibe, J.E.; Prasad, S. Determination and comparison of selected heavy metal concentrations in seawater and sediment samples in the coastal area of Suva, Fiji. Mar. Pollut. Bull. 2020, 157, 111157. [Google Scholar] [CrossRef]
  38. WHO. WHO Guidelines for Drinking-Water Quality, 4th ed.; WHO: Geneva, Switzerland, 2011; p. 398. [Google Scholar]
  39. Cao, Q.; Song, Y.; Zhang, Y.; Wang, R.; Liu, J. Risk analysis on heavy metal contamination in sediments of rivers flowing into Nansi Lake. Environ. Sci. Pollut. Res. 2015, 24, 26910–26918. [Google Scholar] [CrossRef]
  40. Zhang, M.; Chen, G.; Luo, Z.; Sun, X.; Xu, J. Spatial distribution, source identification, and risk assessment of heavy metals in seawater and sediments from Meishan Bay, Zhejiang coast, China. Mar. Pollut. Bull. 2020, 156, 111217. [Google Scholar] [CrossRef]
  41. Abbasnia, A.; Ghoochani, M.; Yousefi, N.; Nazmara, S.; Radfard, M.; Soleimani, H.; Yousefi, M.; Barmar, S.; Alimohammadi, M. Prediction of human exposure and health risk assessment to trihalomethanes in indoor swimming pools and risk reduction strategy. Hum. Ecol. Risk Assess. Int. J. 2019, 25, 2098–2115. [Google Scholar] [CrossRef]
  42. Dehghani, M.H.; Baghani, A.N.; Fazlzadeh, M.; Ghaffari, H.R. Exposure and risk assessment of BTEX in indoor air of gyms in Tehran, Iran. Microchem. J. 2019, 150, 104135. [Google Scholar] [CrossRef]
  43. Shalyari, N.; Alinejad, A.; Hashemi, A.H.G.; RadFard, M.; Dehghani, M. Health risk assessment of nitrate in groundwater resources of Iranshahr using Monte Carlo simulation and geographic information system (GIS). MethodsX 2019, 6, 1812–1821. [Google Scholar] [CrossRef]
  44. Republic of Turkey Ministry of Transport and Infrastructure. 2021. Available online: https://denizcilikistatistikleri.uab.gov.tr/gemi-istatistikler (accessed on 23 December 2021).
  45. Antalya Provincial Directorate of Culture and Tourism. Antalya from Yesterday to Today; Part 2. Antalya: Geographical Situation; Antalya Provincial Directorate of Culture and Tourism: Antalya, Türkiye, 2019; Volume 1. [Google Scholar]
  46. Rubio, B.; Gago, L.; Vilas, F.; Nombela, M.; Garcia-Gil, S.; Alejo, I.; Pazos, O. Interpretacion de tendencias historicas de contaminacion por metales pesados en tesigos de sedimentos de la Ria de Pontevedra. Thalassas 2000, 12, 137–152. [Google Scholar]
  47. EPA (Environmental Protection Agency). Guiding Principles for Monte Carlo Analysis (EPA/630/R-97/001); Risk Assessment Forum US Environmental Protection Agency: Washington, DC, USA, 1997. [Google Scholar]
  48. EPA. RAGS Volume 3 Part A—Process for Conducting Probabilistic Risk Assessment Chapter 1. 31 December 2001. Available online: https://www.epa.gov/sites/default/files/2015-09/documents/rags3adt_complete.pdf (accessed on 10 May 2022).
  49. Zheng, X.-W.; Yuan, J.-G.; Mai, B.-X. Heavy metals in food, house dust, and water from an e-waster recycling area in South China and the potential risk to human health. Ecotoxicol. Environ. Saf. 2013, 96, 205–212. [Google Scholar] [CrossRef] [PubMed]
  50. Cao, S.Z.; Duan, X.L.; Ma, Y.Q.; Zhao, X.G.; Qin, Y.W.; Liu, Y.; Li, S.; Zheng, B.H.; Wei, F.S. Health benefit from decreasing exposure to potentially harmful elements ct pollution control measures near a typical river basin area in China. Chemosphere 2017, 184, 866–878. [Google Scholar] [CrossRef] [PubMed]
  51. Saha, N.; Rahman, M.S.; Ahmed, M.B.; Zhou, J.L.; Ngo, H.H.; Guo, W.S. Industrial metal pollution of water and probabilistic assessment of human health risk. J. Environ. Manag. 2017, 185, 70–78. [Google Scholar] [CrossRef]
  52. IARC. Agents Classified by the IARC Monographs; International Agency for Research on Cancer: Lyon, France, 2013; pp. 1–108. [Google Scholar]
  53. Chen, G.; Wang, X.; Wang, R.; Liu, G. Health risk assessment of potentially harmful elements in subsidence water bodies using a Monte Carlo approach: An example from the Huainan coal mining area, China. Ecotoxicol. Environ. Saf. 2019, 171, 737–745. [Google Scholar] [CrossRef] [PubMed]
  54. USEPA. Part A: Human Health Evaluation Manual; Part E, Supplemental Guidance for Dermal Risk Assessment; Part F, Supplemental Guidance for Inhalation Risk Assessment. In Risk Assessment Guidance for Superfund; Office of Emergency and Remedial Response, US Environmental Protection Agency: Washington, DC, USA, 2011; Volume 1. [Google Scholar]
  55. Turekian, K.K.; Wedepohl, K.H. Distribution of the elements in some major units of the earth’s crust. Geol. Soc. Am. Bull. 1961, 72, 175–192. [Google Scholar] [CrossRef]
  56. Javed, M.; Usmani, N. Accumulation of heavy metals and human health risk assessment via the consumption of freshwater fish Mastacembelus armatus inhabiting, thermal power plant effluent loaded canal. SpringerPlus 2016, 5, 776. [Google Scholar] [CrossRef] [Green Version]
  57. Custodio, M.; Cuadrado, W.; Peñaloza, R.; Montalvo, R.; Ochoa, S.; Quispe, J. Human risk from exposure to heavy metals and arsenic in water from rivers with mining influence in the Central Andes of Peru. Water 2020, 12, 1946. [Google Scholar] [CrossRef]
  58. Surface Water Quality Management Regulation (SWQMR). Number of Official Newspapers: 29327. 2015. Available online: https://www.resmigazete.gov.tr/eskiler/2015/04/20150415-18.htm (accessed on 10 May 2022).
  59. Onwuegbuchunam, D.E.; Ebe, T.E.; Okoroji, L.I.; Essien, A.E. An analysis of ship-source marine pollution in Nigeria seaports. J. Mar. Sci. Eng. 2017, 5, 39. [Google Scholar] [CrossRef] [Green Version]
  60. Mearns, A.; Krause, C.J.B.; Stekoll, M.; Hall, K.; Watson, M.; Atkinson, M. Biological and ecological effects of wastewater discharges from cruise ships in Alaska. In Oceans 2003. Celebrating the Past... Teaming toward the Future; IEEE Cat. No. 03CH37492; IEEE: Piscataway, NJ, USA, 2003; Volume 2, pp. 737–747. [Google Scholar]
  61. EPA. Phase I Uniform National Discharge Standards for Vessels. 1999. Available online: https://www.epa.gov/sites/default/files/2015-08/documents/vessels.pdf (accessed on 12 April 2022).
  62. Corrias, F.; Atzei, A.; Addis, P.; Secci, M.; Russo, M.; Angioni, A. Integrated environmental evaluation of heavy metals and metalloids bioaccumulation in invertebrates and seaweeds from different marine coastal areas of sardinia, mediterranean sea. Environ. Pollut. 2020, 266, 115048. [Google Scholar] [CrossRef]
  63. Arı, H. Çevresel Risk Azaltma Yöntemleri İçin Toplam Maruziyet İndeksinin Kullanılması. Nevşehir Üniversitesi Fen Bilimleri Enstitüsü Derg. 2012, 1. [Google Scholar]
  64. Altomare, T.K. Estimating Children’s Health Risks from Recreatıonal Beach Play followıng an Oil Spill UT School of Public Health Dissertations (Open Access). 2020. Available online: https://digitalcommons.library.tmc.edu/uthsph_dissertsopen/153 (accessed on 14 November 2021).
  65. Kentel, E.; Aral, M.M. 2D Monte Carlo versus 2D fuzzy Monte Carlo health risk assessment. Stoch. Environ. Res. Risk Assess. 2005, 19, 86–96. [Google Scholar] [CrossRef]
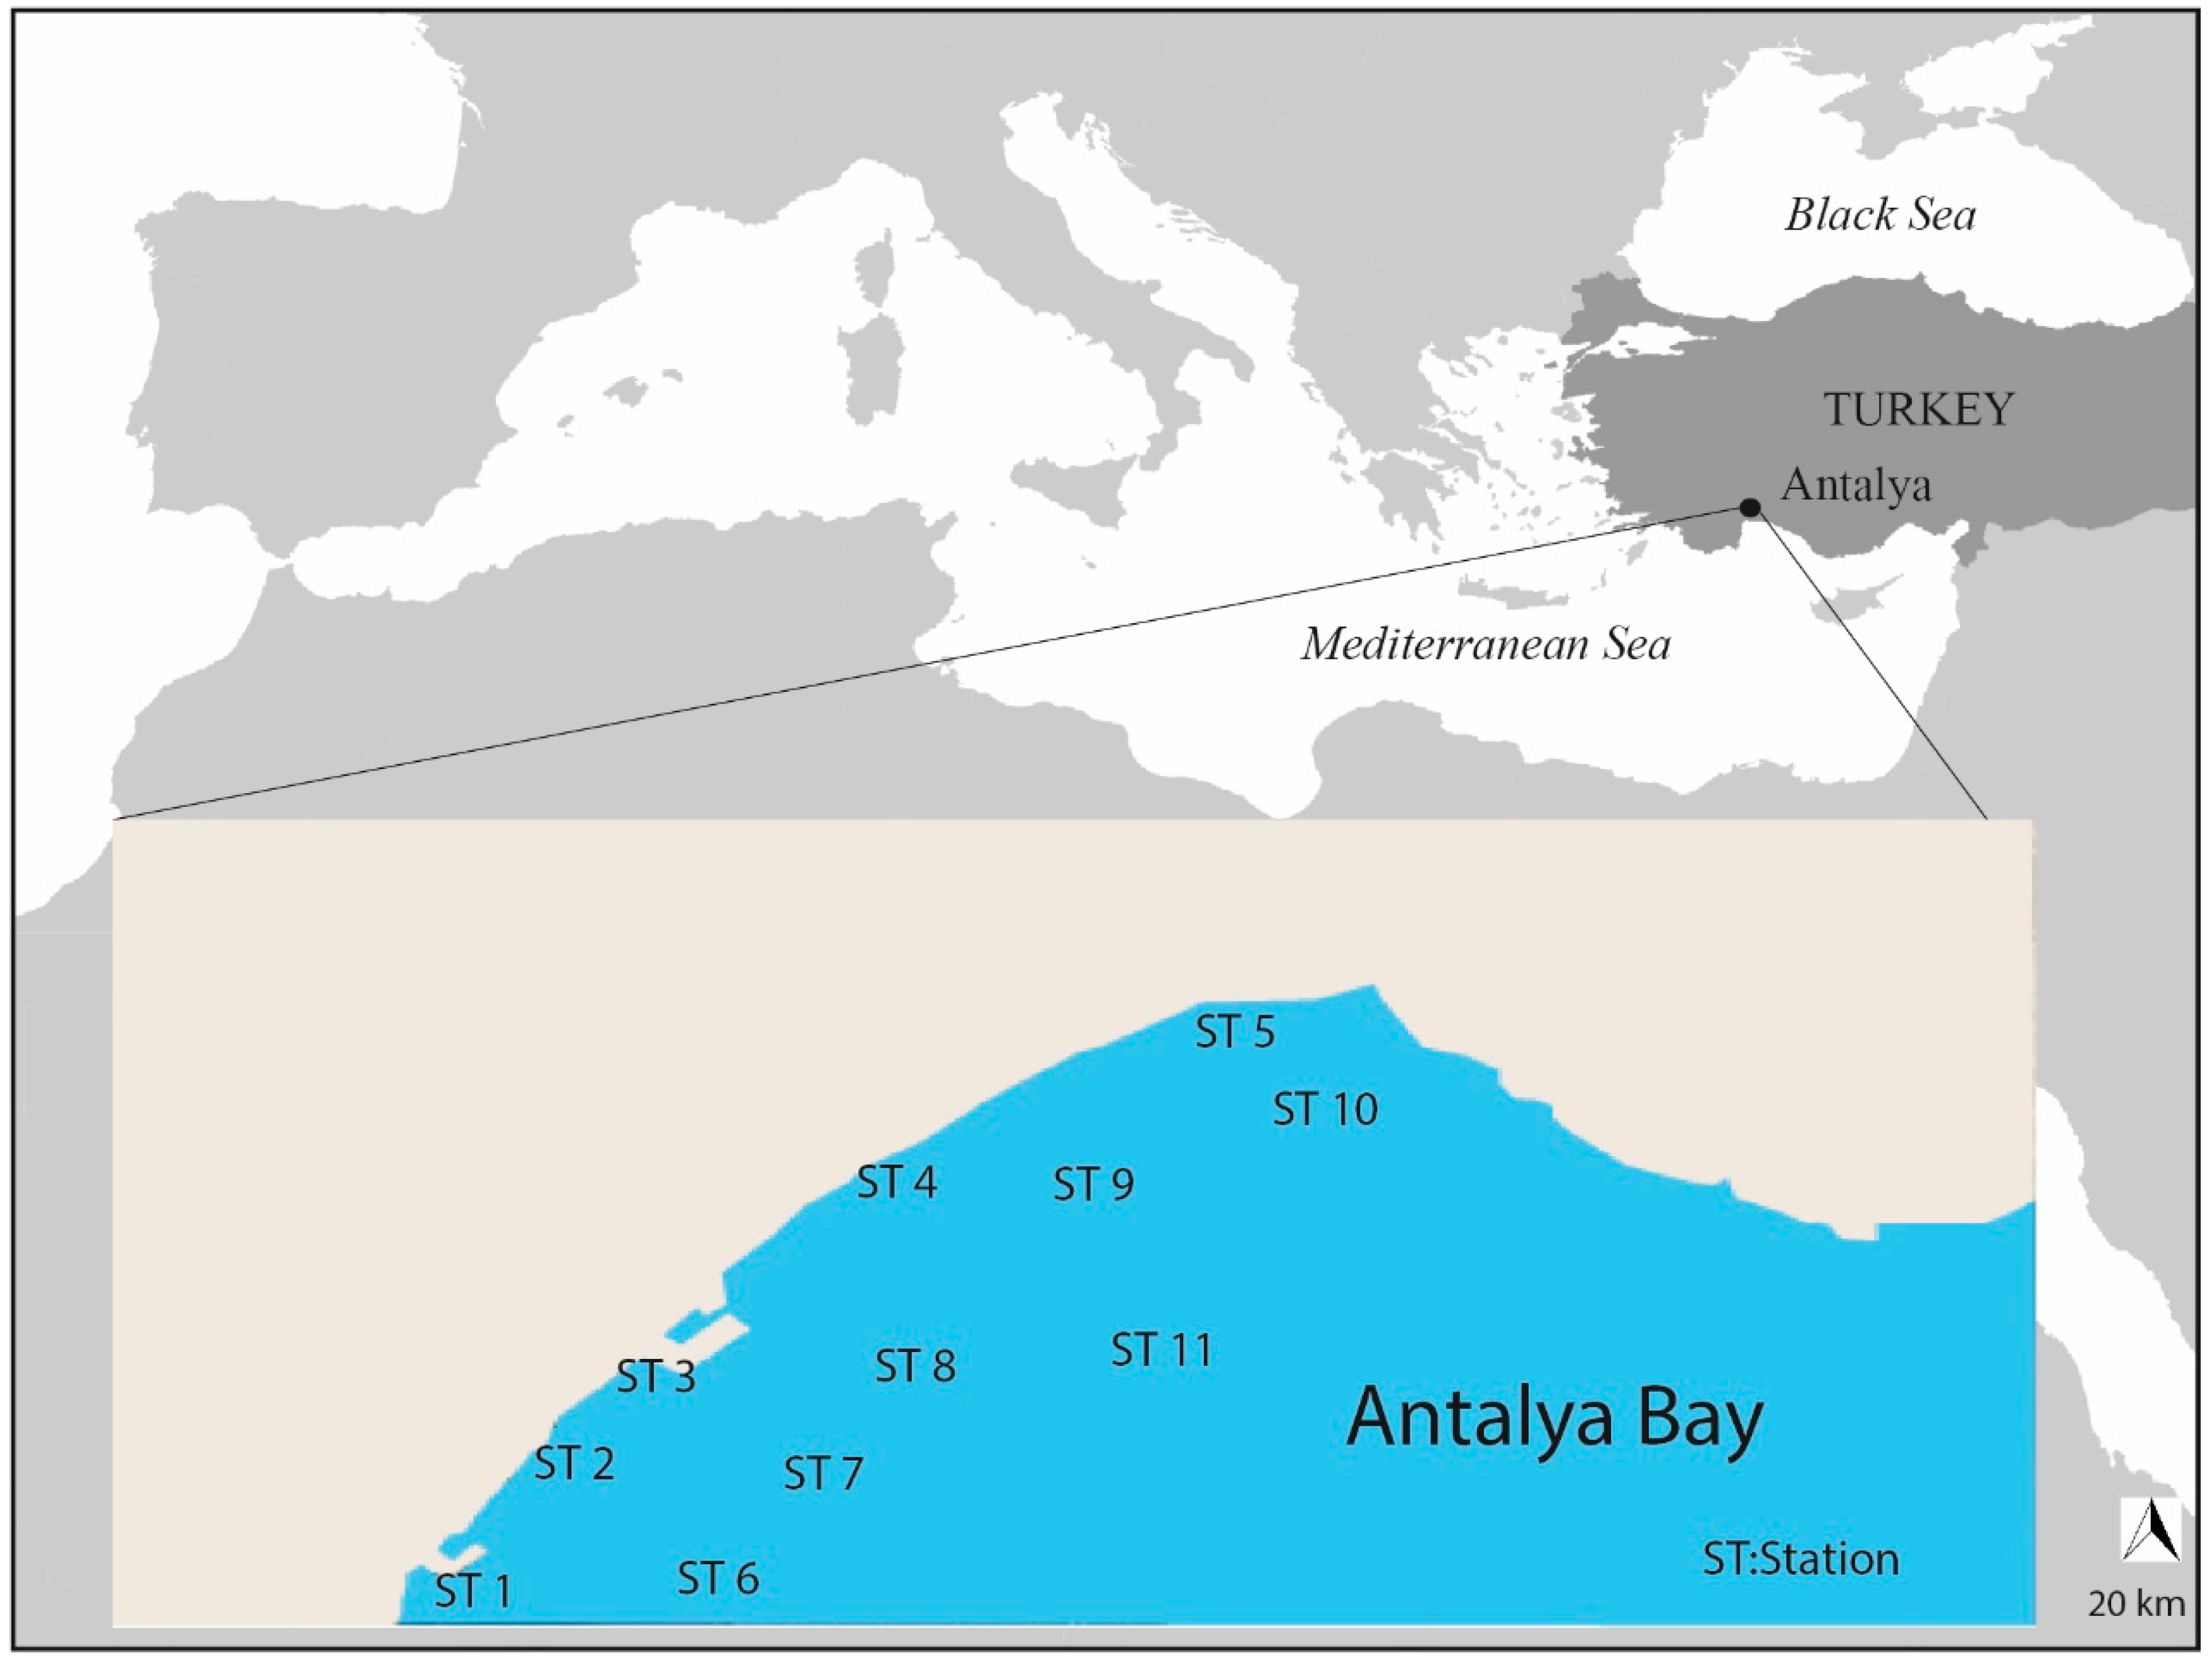
Figure 1. Study area and sampling points in the study area.
Sustainability 14 08408 g001
Figure 2. Contamination risk distribution by ingestion of Ni in the bilge water calculated by MCS.
Sustainability 14 08408 g002
Table 1. Results of studies on heavy metal concentrations in seawater in the Mediterranean.
MetalTürkmen [24]
mg L−1
Göycincik et al. [25]
mg L−1
Morley et al. [31]
mg L−1
Present Study
mg L−1
Standard Values (Surface Water Quality Management Regulation (SWQMR)) Annual Average [58]
mg L−1
WHO ** [38]
mg L−1
Cr0.170.24n/d0.690.0420.05
Cu0.070.36n/d2.670.013NGL
Ni0.280.090.013n/d0.0860.5
Pb0.62n/d0.01n/d0.0130.01
Zn0.07n/dn/d3.990.533NGL ***
Fe0.307.140.015.840.036NGL
As* n/d0.05n/dn/d0.010.01
Vn/dn/dn/dn/d0.016NGL
Mn0.11n/dn/dn/d0.1–0.5 NGL
Co0.26n/d0.01n/d0.003NGL
Cd0.06n/dn/dn/d0.0020.03
Hgn/dn/dn/d15.110.007 0.06
* n/d = Not Detected, ** Converted from µg/L to mg/L, *** NGL = no guideline limit.
Table 4. The highest and lowest risk values of carcinogenic and non-carcinogenic heavy metals were calculated using MCS.
StatisticsWastewater IngestionBilge Water IngestionWastewater IngestionBilge Water Ingestion
Carcinogenic Risk Non-Carcinogenic Risk
Cr0.30.381.692.85
Ni0.590.81n/cn/c *
As0.120.113.060.03
Con/cn/c2.561.7
Hgn/cn/cn/d **3.4
* n/c: not calculated, ** n/d = not detected.
Publisher’s Note: MDPI stays neutral with regard to jurisdictional claims in published maps and institutional affiliations.