
Maximum Take-Off Mass Estimation of a 19-Seat Fuel Cell Aircraft Consuming Liquid Hydrogen


Abstract
:1. Introduction
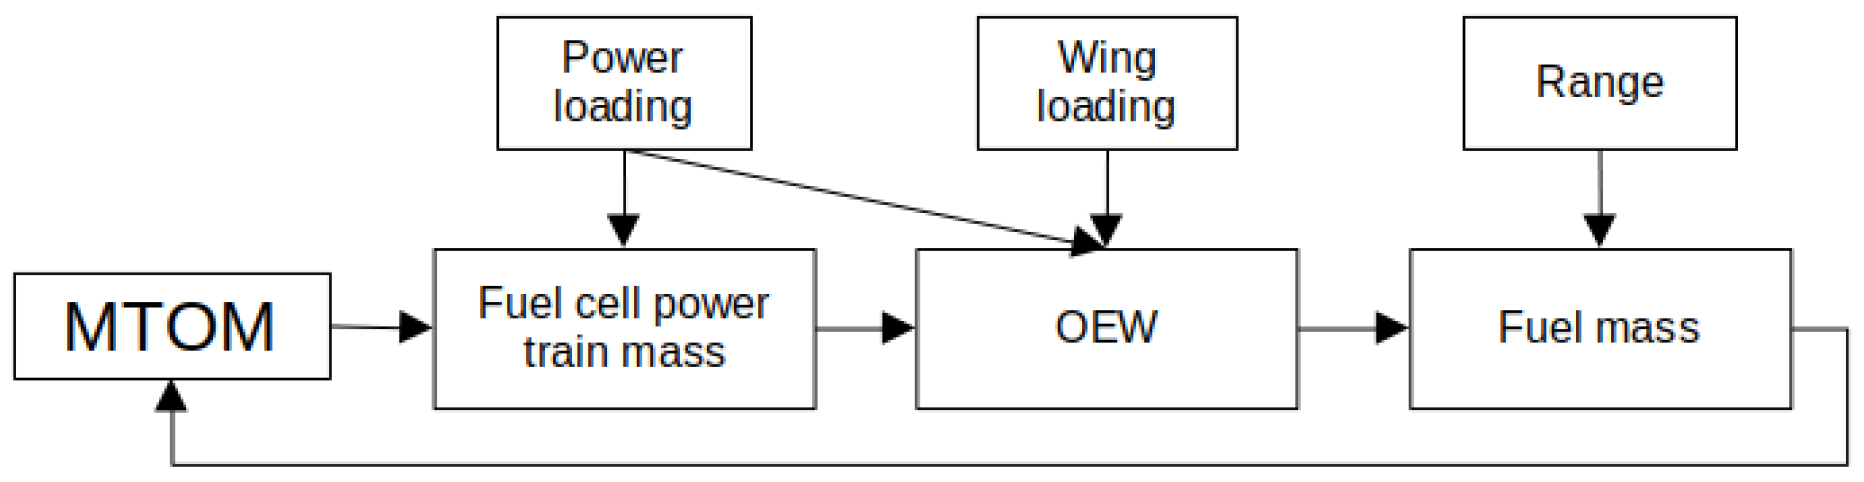
2. Methodology
2.1. Calculation of Operational Empty Weight
2.2. Fuel Cell Aircraft Power-Train Parametrization
2.3. Calculation of Fuel Mass
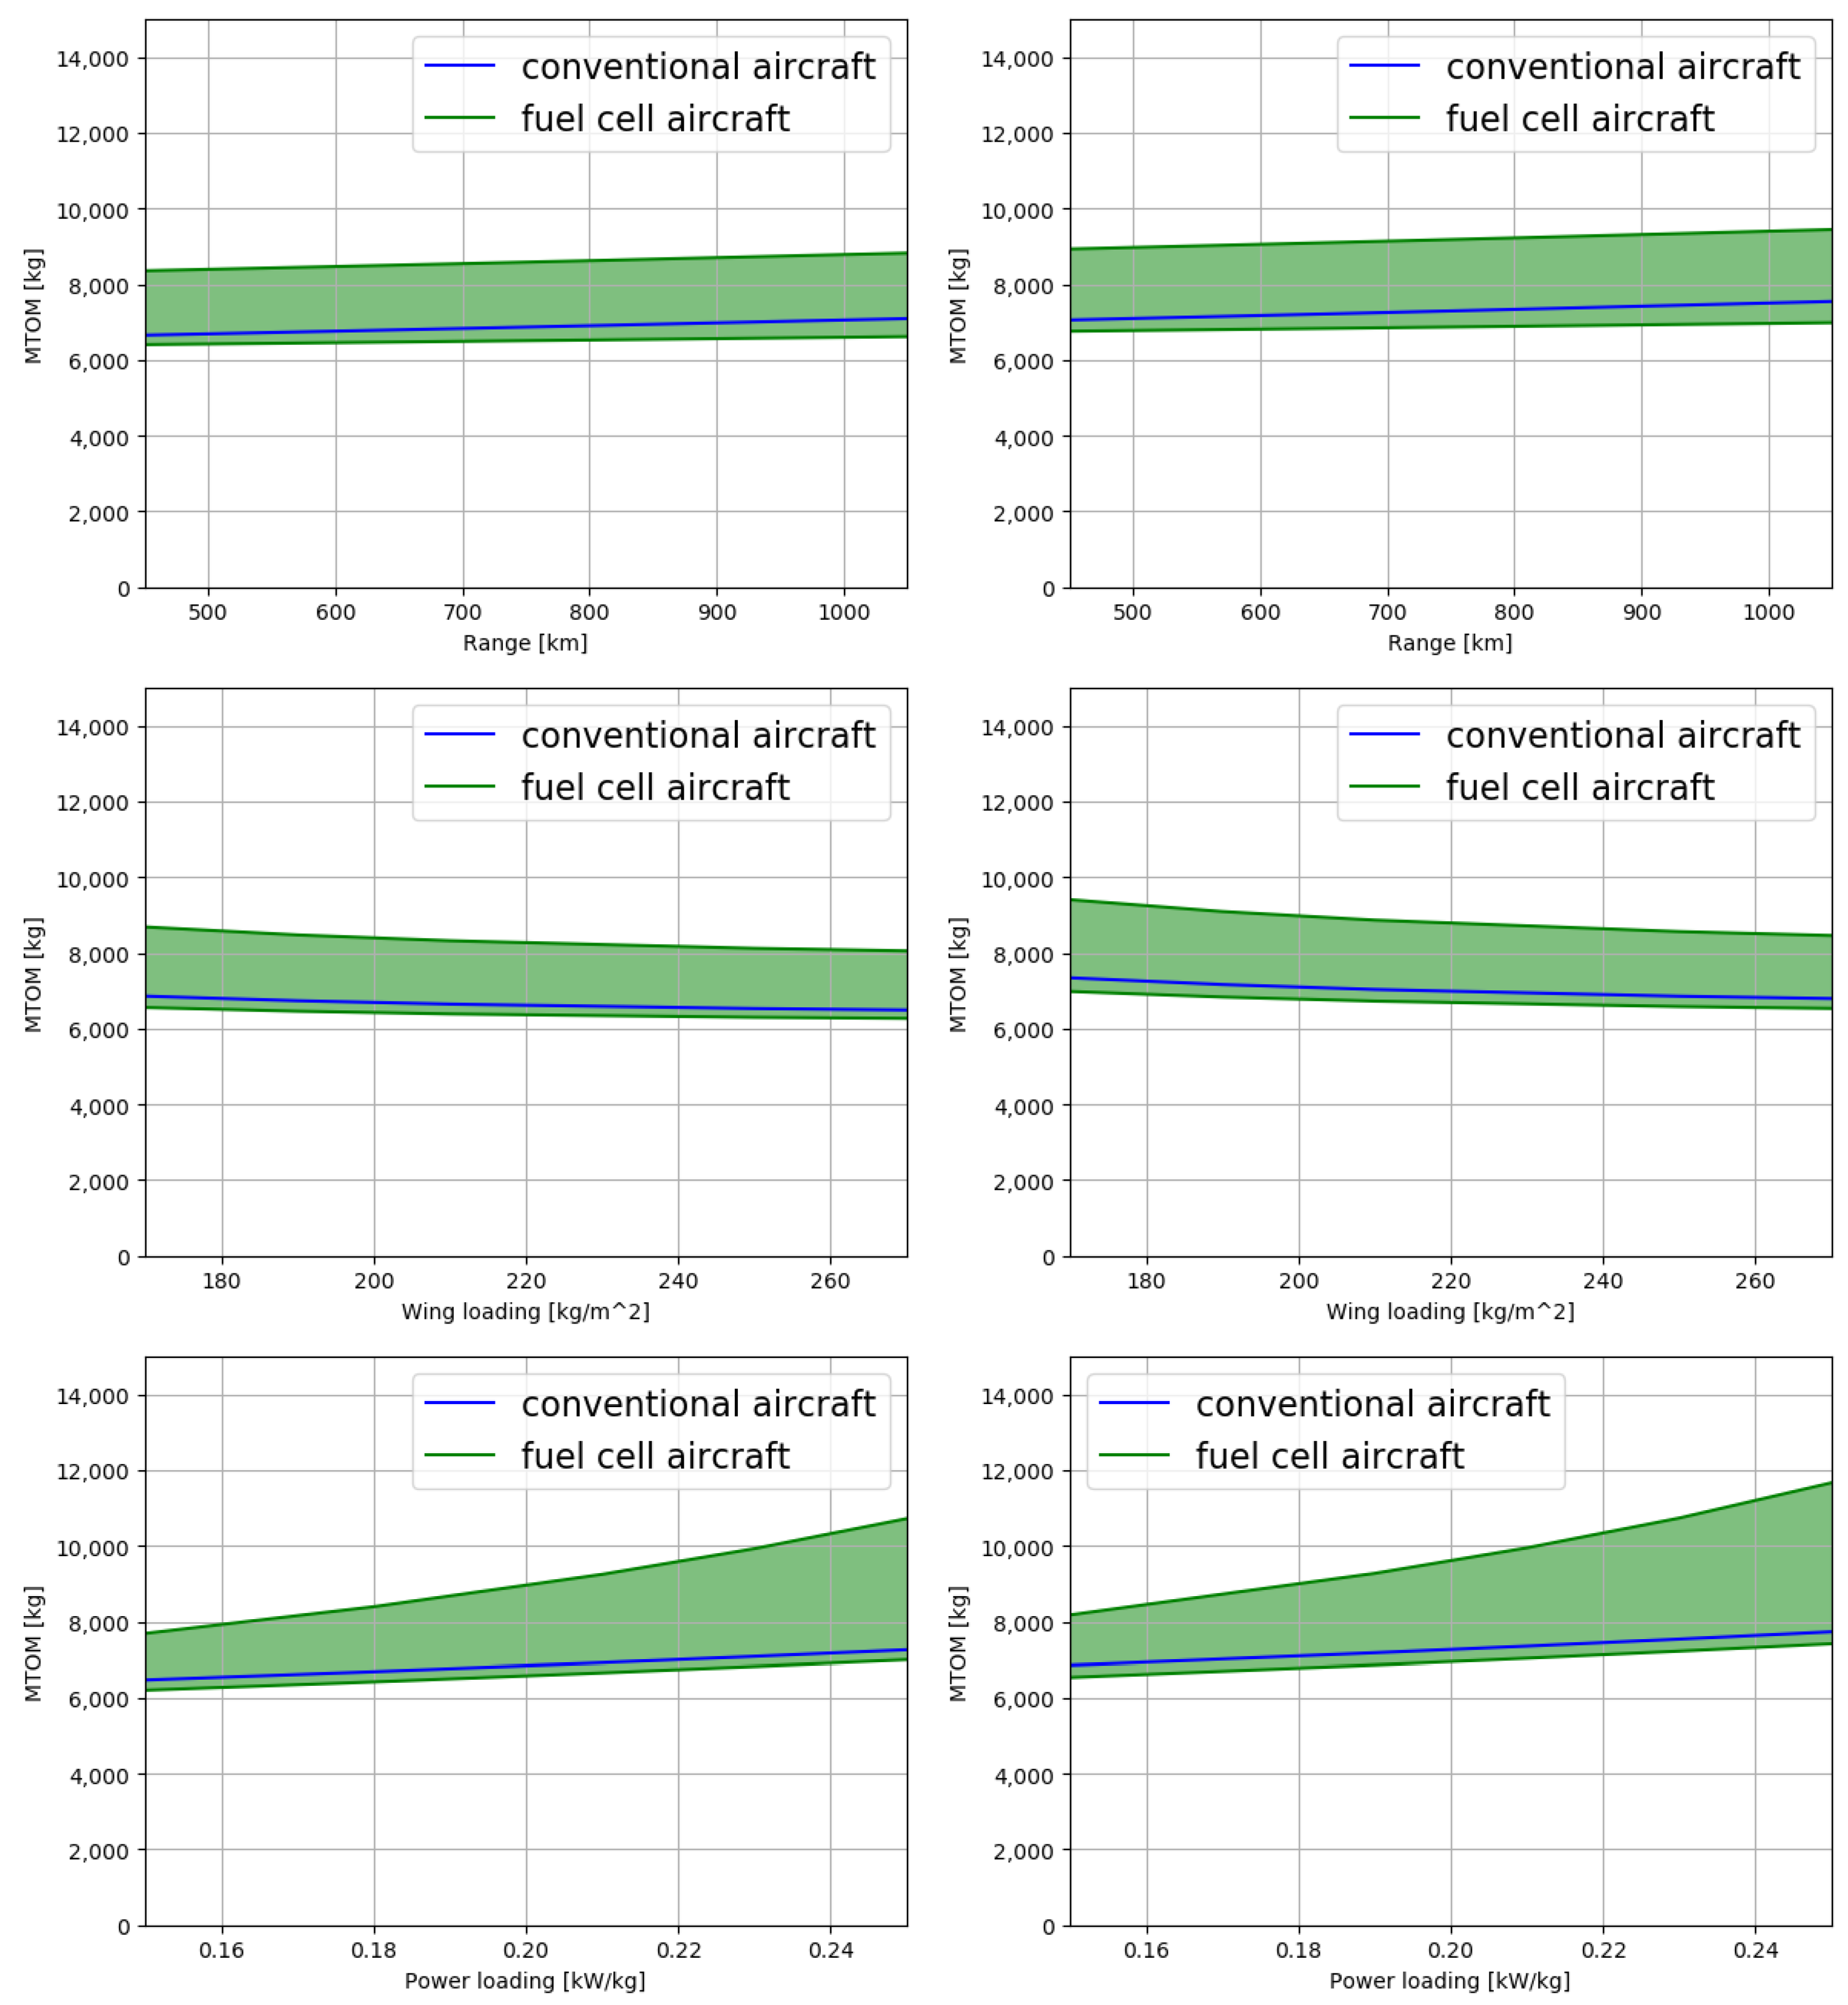
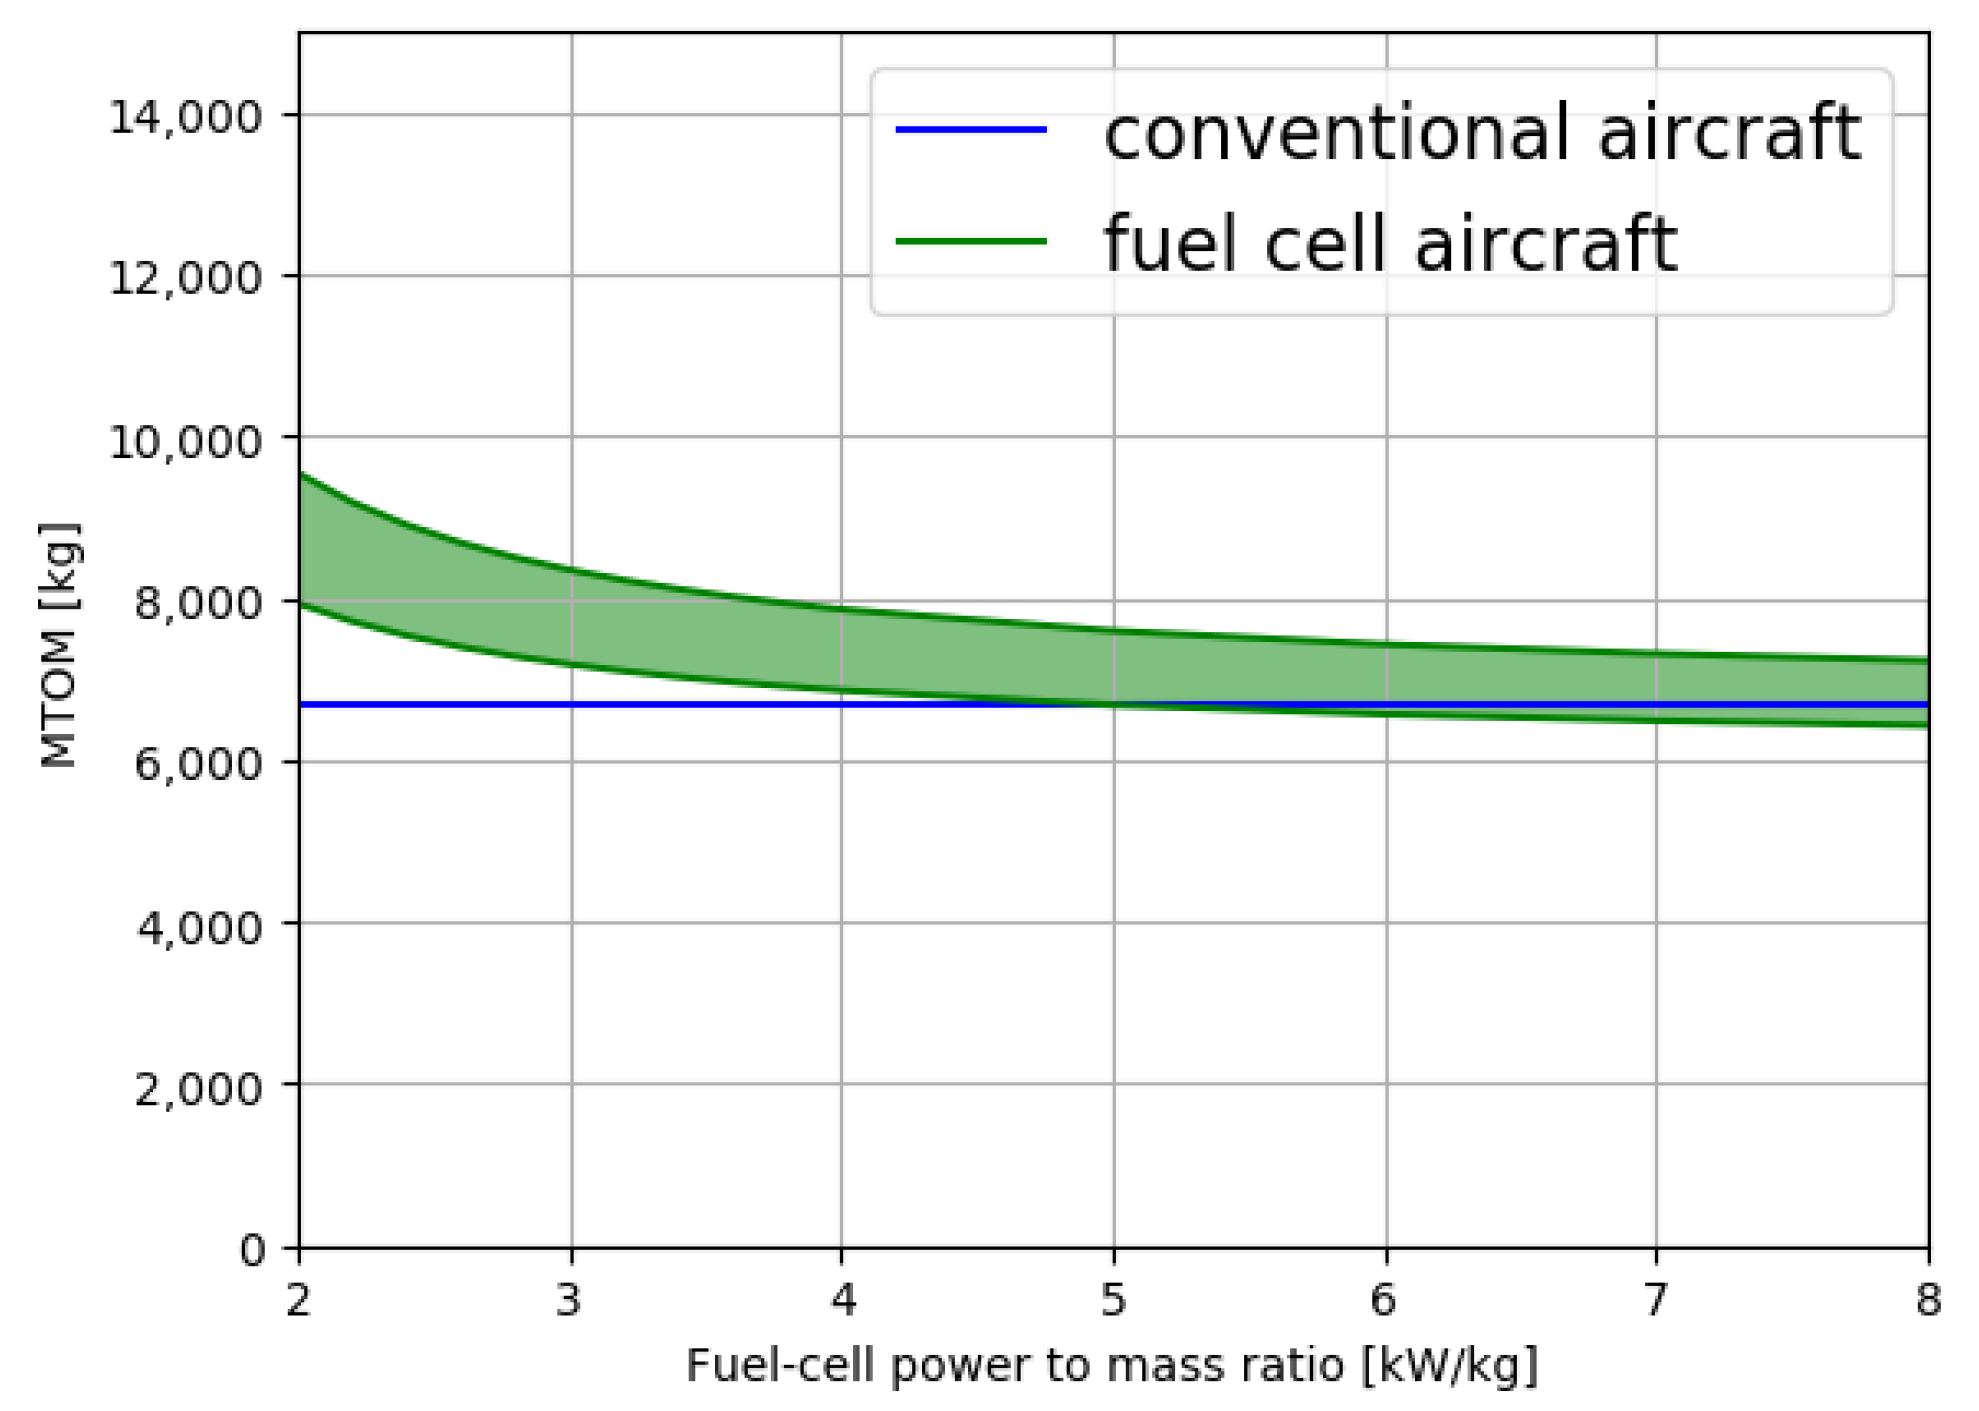
3. Results and Discussion
4. Conclusions
Author Contributions
Funding
Institutional Review Board Statement
Informed Consent Statement
Data Availability Statement
Acknowledgments
Conflicts of Interest
Abbreviations
| Maximal take-off mass | |
| Operating empty mass | |
| EU | European Union |
| PEMFCs | Polymer electrolyte membrane fuel cells |
| SOFCs | Solid oxide fuel cells |
| MAHEPA | Modular Approach to Hybrid-Electric Propulsion Architecture |
| av. | Average |
| H-tail | Horizontal tail |
| V-tail | Vertical tail |
| ECS | Environmental control system |
References
- Brasseur, G.P.; Gupta, M.; Anderson, B.E.; Balasubramanian, S.; Barrett, S.; Duda, D.; Fleming, G.; Forster, P.M.; Fuglestvedt, J.; Gettelman, A. Impact of aviation on climate: FAA’s Aviation Climate Change Research Initiative (ACCRI) Phase II. Bull. Am. Meteorol. Soc. 2016, 97, 561–583. [Google Scholar] [CrossRef] [Green Version]
- Owen, B.; Lee, D.S.; Lim, L. Flying into the future: Aviation emissions scenarios to 2050. Environ. Sci. Technol. 2010, 44, 2255–2260. [Google Scholar] [CrossRef] [PubMed]
- European Commission. Sustainable and Smart Mobility Strategy—Putting European Transport on Track for the Future. 2020. Available online: https://eur-lex.europa.eu/legal-content/EN/TXT/?uri=COM:2020:789:FIN (accessed on 24 May 2022).
- Airbus, Global Market Forecast: Flying By Numbers 2015–2034. Available online: https://espas.secure.europarl.europa.eu/orbis/sites/default/files/generated/document/en/Global_Market_Forecast_2015_Book.pdf (accessed on 24 May 2022).
- Boeing Commercial Airplanes, Current Marker Outlook 2014–2033. Available online: http://i2.cdn.turner.com/cnn/2015/images/09/02/boeing_current_market_outlook_2014.pdf (accessed on 24 May 2022).
- Prapotnik Brdnik, A.; Kamnik, R.; Maršenka, M.; Božičnik, S. Market and technological perspectives for the new generation of regional passenger aircraft. Energies 2019, 12, 1864. [Google Scholar] [CrossRef] [Green Version]
- Verstraete, D.; Hendrick, P.; Pilidis, P.; Ramsden, K. Hydrogen fuel tanks for subsonic transport aircraft. Int. J. Hydrogen Energy 2010, 35, 11085–11098. [Google Scholar] [CrossRef]
- Winnefeld, C.; Kadyk, T.; Bensmann, B.; Krewer, U.; Hanke-Rauschenbach, R. Modelling and Designing Cryogenic Hydrogen Tanks for Future Aircraft Applications. Energies 2018, 11, 105. [Google Scholar] [CrossRef] [Green Version]
- Sirosh, N.; Abele, A.; Niedzwiecki, A. Hydrogen composite tank program. In Proceedings of the 2002 U.S. DOE Hydrogen and Fuel Cells Annual Program/Lab R&D Review, Golden, CO, USA, 6–10 May 2002; Volume 2000, pp. 1–7. [Google Scholar]
- Khandelwal, B.; Karakurt, A.; Sekaran, P.R.; Sethi, V.; Singh, R. Hydrogen powered aircraft: The future of air transport. Prog. Aerosp. Sci. 2013, 60, 45–59. [Google Scholar] [CrossRef]
- AeroVironment Tested the First Unmanned Aerial Vehicle Powered by Fuel Cells, Fuel Cells Bulletin, Volume 2005, Issue 9. Available online: https://www.sciencedirect.com/science/article/abs/pii/S1464285905707318 (accessed on 24 May 2022).
- DLR, Antares DLR-H2—Out of Operation. Available online: https://www.dlr.de/content/en/articles/aeronautics/research-fleet-infrastructure/dlr-research-aircraft/antares-dlr-h2-out-of-operation.html (accessed on 24 May 2022).
- Gong, A.; Verstraete, D. Fuel cell propulsion in small fixed-wing unmanned aerial vehicles: Current status and research needs. Int. J. Hydrogen Energy 2017, 42, 21311–21333. [Google Scholar] [CrossRef]
- Romeo, G.; Borello, F.; Correa, G.; Cestino, E. ENFICA-FC: Design of transport aircraft powered by fuel cell & flight test of zero emission 2-seater aircraft powered by fuel cells fueled by hydrogen. Int. J. Hydrogen Energy 2013, 38, 469–479. [Google Scholar]
- Vertraete, D. Long range transport aircraft using hydrogen fuel. Int. J. Hydrogen Energy 2013, 38, 14824–14831. [Google Scholar] [CrossRef]
- Verstraete, D. On the energy efficiency of hydrogen-fuelled transport aircraft. Int. J. Hydrogen Energy 2015, 40, 7388–7394. [Google Scholar] [CrossRef]
- Mukhopadhaya, J.; Rutherford, D. Performance Analysis of Evolutionary Hydrogen-Powered Aircraft; International Council on Clean Transportation: Washington, DC, USA, 2022; Available online: https://theicct.org/wp-content/uploads/2022/01/LH2-aircraft-white-paper-A4-v4.pdf (accessed on 24 May 2022).
- Trainelli, L.; Salucci, F.; Comincini, D.; Riboldi, C.E.D.; Rolando, A. Italian Association of Aeronautic and Astronautic, XXV International Congress, Italy. 2019. Available online: https://mahepa.eu/wp-content/uploads/2020/06/Sizing-and-Performance-of-Hydrogen-Driven-Airplanes.pdf (accessed on 24 May 2022).
- Vonhoff, G.L.M. Conceptual Design of Fuel Cell Aircraft. Ph.D. Thesis, Delft University of Technology, Delft, The Netherlands, 2021. Available online: https://repository.tudelft.nl/islandora/object/uuid%3A8bd63dec-b67b-496b-92bc-3d5c07ff859f (accessed on 24 May 2022).
- Mahepa Project. Available online: https://mahepa.eu/ (accessed on 24 May 2022).
- Kundu, A.J. Aircraft Design, Cambridge Aerospace Series, 1st ed.; Cambridge University Press: New York, NY, USA, 2010. [Google Scholar]
- Torenbeek, E. Synthesis of Subsonic Airplane Design, 1st ed.; Delft University Press: Amsterdam, The Netherlands, 1982. [Google Scholar]
- Roskam, J. Airplane Design. Vol. 8: Airplane Cost Estimation, Design, Development, Manufacturing and Operation, 1st ed.; University of Kansas: Lawrence, KS, USA, 1990. [Google Scholar]
- Raymer, D.P. Aircraft Design: A Conceptual Approach, 6th ed.; American Institute of Aeronautics and Astronautics, Inc.: Washington, DC, USA, 2018. [Google Scholar]
- Nicolai, L.M.; Carichner, G. Fundamentals of Aircraft and Airship Design. Volume I, Aircraft Design, 1st ed.; American Institute of Aeronautics and Astronautics, Inc.: Washington, DC, USA, 2010. [Google Scholar]
- Stinton, D. The Design of the Airplane, 1st ed.; Van Nostrand Reinhold: New York, NY, USA, 1983. [Google Scholar]
- ASTM F2245-20. Standard Specification for Design and Performance of a Light Sport Airplane; ASTM International: West Conshohocken, PA, USA, 2020. [Google Scholar]
- British Aerospace Jetstream Technical Data. Available online: https://en.wikipedia.org/wiki/British_Aerospace_Jetstream (accessed on 24 May 2022).
- British Aerospace Jetstream Technical Data. Available online: https://www.globalair.com/aircraft-for-sale/Specifications?specid=529 (accessed on 24 May 2022).
- British Aerospace Jetstream Technical Data. Available online: http://www.flugzeuginfo.net/acdata_php/acdata_js31_en.php (accessed on 24 May 2022).
- Dornier 228 Technical Data. Available online: https://web.archive.org/web/20160301232353/http://www.dornier228.com/fileadmin/ruag/DO228NG/PDFs/broschueren/Facts_Booklet_Dornier_228_MR.pdf (accessed on 24 May 2022).
- Dornier 228 Technical Data. Available online: https://en.wikipedia.org/wiki/Dornier_228 (accessed on 24 May 2022).
- De Havilland Canada DHC-6 Twin Otter Technical Data. Available online: https://www.vikingair.com/twin-otter-series-400/technical-description (accessed on 24 May 2022).
- De Havilland Canada DHC-6 Twin Otter Technical Data. Available online: https://en.wikipedia.org/wiki/De_Havilland_Canada_DHC-6_Twin_Otter (accessed on 24 May 2022).
- Beechcraft 1900 Technical Data. Available online: https://web.archive.org/web/20161223060857/http://www.airweb.faa.gov/Regulatory_and_Guidance_Library/rgMakeModel.nsf/0/6be5914ffaf7db0b86257f24005636e2/$FILE/A24CE_Rev_113.pdf (accessed on 24 May 2022).
- Beechcraft 1900 Technical Data. Available online: https://en.wikipedia.org/wiki/Beechcraft_1900 (accessed on 24 May 2022).
- Let-410 Turbolet Technical Data. Available online: https://web.archive.org/web/20190423024417/http://www.let.cz/files/file/KeStazeni/2016/EN_Brochure_L410_UVP-E20.pdf (accessed on 24 May 2022).
- Let-410 Turbolet Technical Data. Available online: https://en.wikipedia.org/wiki/Let_L-410_Turbolet (accessed on 24 May 2022).
- ASTM F3082/F3082M–17. Standard Specification for Weights and Centers of Gravity of Aircraft; ASTM International: West Conshohocken, PA, USA, 2017. [Google Scholar]
- List of Regional Airliners. Available online: https://en.wikipedia.org/wiki/List_of_regional_airliners (accessed on 24 May 2022).
- Mital, S.K.; Gyekenyesi, J.Z.; Arnold, S.M.; Sullivan, R.M.; Manderscheid, J.M.; Murthy, P.L. Review of Current State of the Art and Key Design Issues With Potential Solutions for Liquid Hydrogen Cryogenic Storage Tank Structures for Aircraft Applications. 2006. Available online: https://ntrs.nasa.gov/api/citations/20060056194/downloads/20060056194.pdf (accessed on 24 May 2022).
- Silberhorn, D.; Atanasov, G.; Walther, J.-N.; Zill, T. Assesment of Hydrogen Fuel Tank Integration at Aircraft Level. Available online: https://core.ac.uk/download/pdf/237080603.pdf (accessed on 24 May 2022).
- Kadyk, T.; Winnefeld, C.; Hanke-Rauschenbach, R.; Krewer, U. Analysis and Design of Fuel Cell Systems for Aviation. Energies 2018, 11, 375. [Google Scholar] [CrossRef] [Green Version]
- Adolf, J.; Balzer, C.; Louis, J.; Schabla, U. Shell Hydrogen Study: Energy of the Future; Technical Report; Shell Deuchland Oil GmbH: Hamburg, Germany, 2017; Available online: https://epub.wupperinst.org/frontdoor/deliver/index/docId/6786/file/6786_Hydrogen_Study.pdf (accessed on 24 May 2022).
- PowerCell Technical Data. Available online: https://bumhan.com/wp-content/uploads/sites/126/2021/02/PowerCell-S3.pdf (accessed on 24 May 2022).
- SOFT Fuel Cells Technical Data. Available online: https://web.archive.org/web/20130218040819/https://technology.grc.nasa.gov/documents/auto/Solid-Oxide-Fuel-Cells.pdf (accessed on 24 May 2022).
- Chapman, J.W.; Schnulo, S.L.; Nitzsche, M.P. Development of a Thermal Management System for Electrified Aircraft. 2020. Available online: https://ntrs.nasa.gov/api/citations/20200001620/downloads/20200001620.pdf (accessed on 24 May 2022).
- Integral Powertrain Technical Data. Available online: https://integralp.com/communication/product/ultra-high-speed-spm-platform/ (accessed on 24 May 2022).
- Integral Powertrain Technical Data. Available online: https://integralp.com/communication/product/spm-236e-aero/ (accessed on 24 May 2022).
- Onlivne Charts. Available online: https://www.onlinecharttool.com/graph?selected_graph=multipie (accessed on 20 June 2022).
- Scholz, D. Lecture Notes: Aircraft Design, Hamburg University of Applied Sciences. 2015. Available online: http://HOOU.ProfScholz.de (accessed on 24 May 2022).


| Component | Fuselage | Wing | H-tail | V-tail |
| Fraction | 10% to 11% | 10% to 12% | 1.5% to 2% | 1% to 1.5% |
| Component | Nacelle and Pylon | Undercarriage | Engine | Engine control |
| Fraction | 1.9% to 2.3% | 4% to 6% | 7% to 10% | 1.5% to 2% |
| Component | Fuel system | Oil system | Flight control sys. | Hydraulics |
| Fraction | 1% to 1.2% | 0.3% to 0.5% | 1.5% to 2% | 0.5% to 1.5% |
| Component | Electrical sys. | Instrument | Avionic | ECS |
| Fraction | 2% to 4% | 0.5% to 1% | 0.3% to 0.5% | 2% to 3% |
| Component | Oxygen | Furnishing | Miscellaneous | Contingency |
| Fraction | 0.3% to 0.5% | 6% to 8% | 0% to 0.5% | 1% to 2% |
| Aircraft | Dornier 228 | Twin Otter | Beechcraft 1900 | Let L-410 |
|---|---|---|---|---|
| Year of production | 1981 | 2010 | 1982 | 1969 |
| (kg) | 6575 | 5670 | 7764 | 6600 |
| Performance characteristics | ||||
| Power loading (kW/kg) | 0.176 | 0.2 | 0.246 | 0.17 |
| Wing loading (kg/m2) | 200 | 245 | 270 | 189 |
| Geometrical characteristics | ||||
| Taper ratio | 0.7 | 1 | 0.4 | 0.4 |
| Aspect ratio | 9 | 10 | 10.8 | 11.45 |
| Length (m) | 16.54 | 15.77 | 17.62 | 14.4 |
| Av. fuselage diameter (m) | 1.7 | 1.63 | 1.59 | 1.81 |
| Fuel in the wing (kg) | 1958 | 1175 | 2022 | 1045 |
| (kg) | ||||
| Model | 3910 | 3894 | 4736 | 4170 |
| Data | 3900 | 3363 | 4732 | 4200 |
| Mission Segment | SP | TP | RT | BJ |
|---|---|---|---|---|
| start and taxi-out () | 0.992 | 0.988 | 0.985 | 0.985 |
| takeoff () | 0.998 | 0.996 | 0.995 | 0.995 |
| climb () | 0.992 | 0.990 | 0.985 | 0.980 |
| landing and taxi-in () | 0.986 | 0.985 | 0.98 | 0.982 |
| total () | 0.968 | 0.960 | 0.946 | 0.943 |
| d | ||||||||||||
|---|---|---|---|---|---|---|---|---|---|---|---|---|
| (kW/kg) | (kW/kg) | (kW/kg) | (kW/kg) | (kW/kg) | (cm) | |||||||
| present/pessimistic | 0.6 | 0.8 | 0.05 | 0.076 | 2.9 | 2 | 2 | 5 | 10 | 0.9 | 0.9 | 14 |
| future/optimistic | 0.7 | 0.8 | 0.04 | 0.076 | 8.0 | 2 | 2 | 40 | 15 | 0.95 | 0.95 | 14 |
Publisher’s Note: MDPI stays neutral with regard to jurisdictional claims in published maps and institutional affiliations. |
© 2022 by the authors. Licensee MDPI, Basel, Switzerland. This article is an open access article distributed under the terms and conditions of the Creative Commons Attribution (CC BY) license (https://creativecommons.org/licenses/by/4.0/).
Share and Cite
Marksel, M.; Prapotnik Brdnik, A. Maximum Take-Off Mass Estimation of a 19-Seat Fuel Cell Aircraft Consuming Liquid Hydrogen. Sustainability 2022, 14, 8392. https://doi.org/10.3390/su14148392
Marksel M, Prapotnik Brdnik A. Maximum Take-Off Mass Estimation of a 19-Seat Fuel Cell Aircraft Consuming Liquid Hydrogen. Sustainability. 2022; 14(14):8392. https://doi.org/10.3390/su14148392
Chicago/Turabian StyleMarksel, Maršenka, and Anita Prapotnik Brdnik. 2022. "Maximum Take-Off Mass Estimation of a 19-Seat Fuel Cell Aircraft Consuming Liquid Hydrogen" Sustainability 14, no. 14: 8392. https://doi.org/10.3390/su14148392
APA StyleMarksel, M., & Prapotnik Brdnik, A. (2022). Maximum Take-Off Mass Estimation of a 19-Seat Fuel Cell Aircraft Consuming Liquid Hydrogen. Sustainability, 14(14), 8392. https://doi.org/10.3390/su14148392