Article

Response of Bread Wheat Cultivars Inoculated with Azotobacter Species under Different Nitrogen Application Rates

by
Gawhara A. El-Sorady
1,
Aly A. A. El-Banna
1,
Ahmed M. Abdelghany
2,
Ehab A. A. Salama
3,
Hayssam M. Ali
4,
Manzer H. Siddiqui
4,
Nafiu Garba Hayatu
5,
Lidia Sas Paszt
6 and
Sobhi F. Lamlom
1,*
1
Plant Production Department, Faculty of Agriculture Saba Basha, Alexandria University, Alexandria 21531, Egypt
2
Crop Science Department, Faculty of Agriculture, Damanhour University, Damanhour 22516, Egypt
3
Agricultural Botany Department, Faculty of Agriculture Saba Basha, Alexandria University, Alexandria 21531, Egypt
4
Botany and Microbiology Department, College of Science, King Saud University, P.O. Box 2455, Riyadh 11451, Saudi Arabia
5
Department of Soil Science and Agricultural Engineering, Faculty of Agriculture, Usmanu Danfodiyo University, Sokoto 2346, Nigeria
6
The National Institute of Horticultural Research, Konstytucji 3 Maja 1/3, 96-100 Skierniewice, Poland
*
Author to whom correspondence should be addressed.
Sustainability 2022, 14(14), 8394; https://doi.org/10.3390/su14148394
Submission received: 10 June 2022 / Revised: 5 July 2022 / Accepted: 6 July 2022 / Published: 8 July 2022

Abstract

:
A field trial was conducted to investigate the productivity of three bread wheat cultivars, namely Giza-168, Shandawel-1, and Misr-2, under different fertilization treatments, i.e., azotobacter inoculation, 25% nitrogen (N) + azotobacter, 50%N + azotobacter, 75%N + azotobacter, and 100%N of the recommended level (180 kg/ha). The treatments were laid in a split-plot design, and each was replicated three times. The findings showed that wheat cultivars examined in the two seasons exhibited significant variations (p ≤ 0.05) in plant height (PH, cm), number of tillers m−2 (NTM), number of spikelets per spike (NSS), 1000-grain weight (TGW, g), spike length (SL, cm), biological yield (BY, ton ha−1), grain yield (GY, ton ha−1), straw yield (SY, ton ha−1), harvest index (HI, %), protein content (PC, %), days to 50% heading (DTH), and chlorophyll content (CC, SPAD). As a result, Giza-168 had a higher GY (14%), HI (27%), and TGW (10%) than any of the other two cultivars in both growing seasons. Furthermore, Misr-2 exhibited the highest PH (16%), NTM (26%), NSS (28%), SL (10%), BY (30%), SY (46%), and CC (3%). The application of the two treatments of 100%N and N75% + azotobacter exhibited high and statistically similar performance, resulting in an increase in all studied traits by greater than 30–50% compared to the other three treatments. According to the findings of the current investigation, the application of N fertilizer combined with azotobacter increased wheat yield more than either solely azotobacter or N application. We concluded that the application of nitrogen combined with azotobacter reduced the quantity of applied nitrogen by 25%.

1. Introduction

Wheat is one of the most widely grown crops in the world, providing a staple diet for one-third of the world’s population. It is grown in a variety of climates and agricultural systems, which leads to a wide range of yields [1]. The global average of grain yield productivity is currently at 3.3 t ha−1, but this rate will need to nearly double in order to meet rising food demands [2,3]. Wheat has emerged as Egypt’s most important grain crop, contributing significantly to the country’s gross domestic product [4]. Importantly, wheat is an essential grain crop for the purpose of establishing local food security [5]. Furthermore, it is consumed on a daily basis by the whole population of Egypt and contributes about 82% of the total calories and proteins consumed in the country. Egypt’s national goal is to increase wheat production in order to fill the gap between the production of 9 million tons and the consumption of 16 million tons, according to FAO 2019 (https://www.fao.org/statistics/en/, accessed on 25 April 2022). This may be accomplished by using new cultivars of wheat that have the potential to produce a higher grain yield, as well as by introducing new agricultural methods, technologies, and practices. The quality of grain and yield in cereal crops is strongly dependent on the nitrogen (N) fertilizer. Numerous researchers reported that N fertilizers’ application generally has positive and significant impacts on the crop growth and yield [6].
Nitrogen fertilizers are critical in maximizing crop productivity in intensive agriculture systems. Synthetic N-based fertilizers were estimated to produce about half of the world’s food supply, with a projected consumption rate of 80 to 180 million tons of N fertilizer by the year 2050 [7]. However, conventional N-based fertilizers can lose up to 50% of their application into the soil and environment [8]. Crop productivity relies heavily on N, while its excess levels can be damaging to ecosystems and human health, as well [9]. To accomplish both agronomic and environmental objectives simultaneously, farmers are recommended to use N management in agriculture. Both grain yield and grain quality, such as protein content, can be improved by the application of N fertilizer [10]. However, the energy used to produce this kind of fertilizers accounts for the majority of the energy used in agricultural output, surpassing even soil tillage [11]. According to previous research on maize [12] and wheat [11,12], energy efficiency is influenced by fertilizer dosage and fertilization strategy. Effective usage of N is therefore a vital signal for long-term plant production [13]. Both N fertilizer efficiency and crop N efficiency are the two most important components of efficiency in the agricultural industry. According to Barraclough et al. [14], the new varieties encouraged excessive use of fertilizer with environmental consequences that have become all too apparent. Moreover, N fertilization management has a significant impact on N efficiency [15,16,17]. An important aspect of N management is determining how much N will be applied, as well as what type of N will be used (organic or inorganic: urea, ammonium nitrate, and carbamide nitrate).
Agroecosystems, bio-chemical variety, and the ability to ameliorate the negative effects of inadequate soil fertility, abiotic stressors, diseases, and pests must be taken into consideration in the development of sustainable agricultural intensification [18,19]. Plants and the microorganisms that live in their rhizospheres often form mutualistic connections with one another [20]. It has been shown that rhizobacteria boost plant nutrition and, in certain situations, increase plant tolerance to drought and salt stresses [21,22]. Plant growth may be stimulated by N-fixation, nutrient supplementation, or the synthesis of phytohormones such as auxins, gibberellins, and cytokinins, all of which are beneficial to the plant [4,20,23]. Plant hormones can also be produced by bacteria like Pseudomonas azotobacter and azospirillum [24,25,26]. Azotobacter, a Gamma proteobacteria member of the plant growth-promoting rhizobacteria “PGPR” group, can fix N from the atmosphere and thrive in N-free environments. They use N from the atmosphere to produce biological proteins. After the mineralization of the cellular protein, N availability is linked to cell death [27]. Furthermore, azotobacter strains have been shown to improve plant growth, production, and N use efficiency for horticultural crops [25,28,29]. There were significant increases in lettuce plant height, number of leaves, and fresh weight when the plants were treated with biofertilizers such as the Azotobacter chroococcum and Azospirillum lipoferum [30]. Furthermore, the application of N-fixing bacteria such as Azotobacter and Beijerinckia led to an increase in protein content in the leaves of mulberry plants [28,31]. The chlorophyll content of hydroponically grown strawberries was found to be significantly increased by Azotobacter spp. and Azospirillum spp. at various N concentrations [25]. Hence, we aimed in this investigation to examine the role of the individual and combined applications of N and azotobacter on growth and yield parameters of three wheat cultivars under field conditions, as well as to evaluate the effects of azotobacter inoculation and its role in reducing N addition.

2. Materials and Methods

2.1. Description of the Study Area

The current study was carried out at the Experimental Station Farm (31°12′20.71″ N, 29°55′28.2936″ E), Faculty of Agriculture, (Saba–Basha), Alexandria University during the two growing seasons 2019/2020 and 2020/2021. Three Egyptian bread wheat cultivars were used in this study, namely Giza-168, Shandawel-1, and Misr-2. These cultivars are characterized by high productivity; tolerance of different environmental stresses, such as heat, salinity, and drought; and resistance to diseases [32]. The three cultivars were released by Wheat Research Department, Field Crops Research Institute, Agricultural Research Center (ARC), Egypt. The three wheat cultivars were planted on 10 and 15 November in 2019/2020 and 2020/2021, respectively. The pedigree, origin, and year of release of the three wheat cultivars used in this study were listed in Table 1.

2.2. Soil Sampling and Analyses

The initial physicochemical properties of the soil were determined during both seasons (Table 2). Soil samples were collected from each plot at two depths (i.e., 0–25 cm and 25–40 cm) using a 2.5 cm diameter spiral auger. Three sub-samples from each plot were taken to make a composite sample per plot. The samples were transported to the laboratory, oven-dried at 40 °C, crushed to pass through a 2 mm sieve, and then ground to <60 µm to determine the soil organic matter (SOM%), N, P-available (mg·kg−1), and K-exchangeable (mg·kg−1) [33]. Furthermore, E.C. (dS m−1) and soil pH were estimated through standard procedures [34].

2.3. Treatments and Experimental Design

In this experiment, the five N fertilization treatments included: 100%N (the recommended dose 180 kg N/ha), 75%N + azotobacter, 50%N + azotobacter, 25%N + azotobacter, and azotobacter. They were randomly assigned to the main plots, where the three wheat cultivars (Shandwel-1, Misr-2, and Giza-168) were allocated to the subplot in a split-plot design. Each treatment was replicated three times. The soil was prepared by plowing twice orthogonally, then flattening the soil and dividing the experimental plots (4 × 3 m). Mineral N fertilizer was added in the form of Urea (46.5%N). Superphosphate fertilizer (15.5% P2O5) was applied before sowing at the rate of 300 kg/ha, and potassium fertilizer was applied before sowing (during seedbed preparation) at a rate of 125 kg/ha in the form of potassium sulfate (48% K2O). Wheat grains were inoculated before sowing with Azotobacter chroococcum bacteria (Biogen), conc.106 cells/ml. Biogein is produced by the Bio-fertilizers Unit, General Organization of Agriculture Equalization Fund, Agricultural Research Centre, Giza, Egypt.

2.4. Crop Sampling and Measurements

During both growing seasons, chlorophyll content (SPAD), days to 50% heading, and number of tillers/m−2 were recorded. At the tillering stage (Zadoks scale 22 to 25—Z22 to Z25), ten fertile tillers were randomly selected from each subplot, and SPAD values were taken three times from three different parts (the leaf base, the middle, and the top) of each tiller’s flag leaf [35]. The SPAD values were averaged to get a reading of chlorophyll content (Konica Minolta Optics Inc., Tokyo, Japan). At harvest time, plant height (PH, cm) of 10 plants from each subplot was measured from the soil surface to the tip of the main stem spike. Spike length (SL, cm) was estimated as an average length of random samples of ten spikes. The number of spikelets per spike (NSS) was determined as the number of both fertile and sterile spikelets of ten random spikes, and then the mean number of spikelets per spike was calculated. 1000-grain weight (TGW, g) was expressed as the weight of 1000 clean grains in grams. Grain yield (GY) was obtained by harvesting each subplot which were bundled, threshed, and then converted to ton ha−1. Straw yield (SY) was estimated as the weight of the straw, which was harvested from an area of subplot after threshing and then converted to ton ha−1. Biological yield (BY) was estimated as the weight of the plants which were harvested from an area of each subplot before threshing and then recorded in ton ha−1. The harvest index (HI) was computed using the following formula:
Harvest index (HI) = (Biological yield/Grain yield Harvest) × 100

2.5. Statistical Analysis

The analysis of variance (ANOVA) for all studied traits was performed using the general linear model (GLM) procedure of the SAS (Statistical Analysis System, version 9.4, SAS Institute, Cary, NC, USA) [36]. Data were statistically analyzed using Fisher’s least significant difference (LSD) test at p ≤ 0.05. Boxplots were drawn to show the variation in the application of foliar spraying and biofertilizer. In R project (version 3.4.5), ggplot2 package was used to draw boxplots. Pearson correlation coefficients were used to access the associations among growth, yield, and kernels biochemical composition parameters. Principle component analysis (PCA) analysis was conducted to reveal the interrelationship of studied traits with fertilization treatments.

3. Results

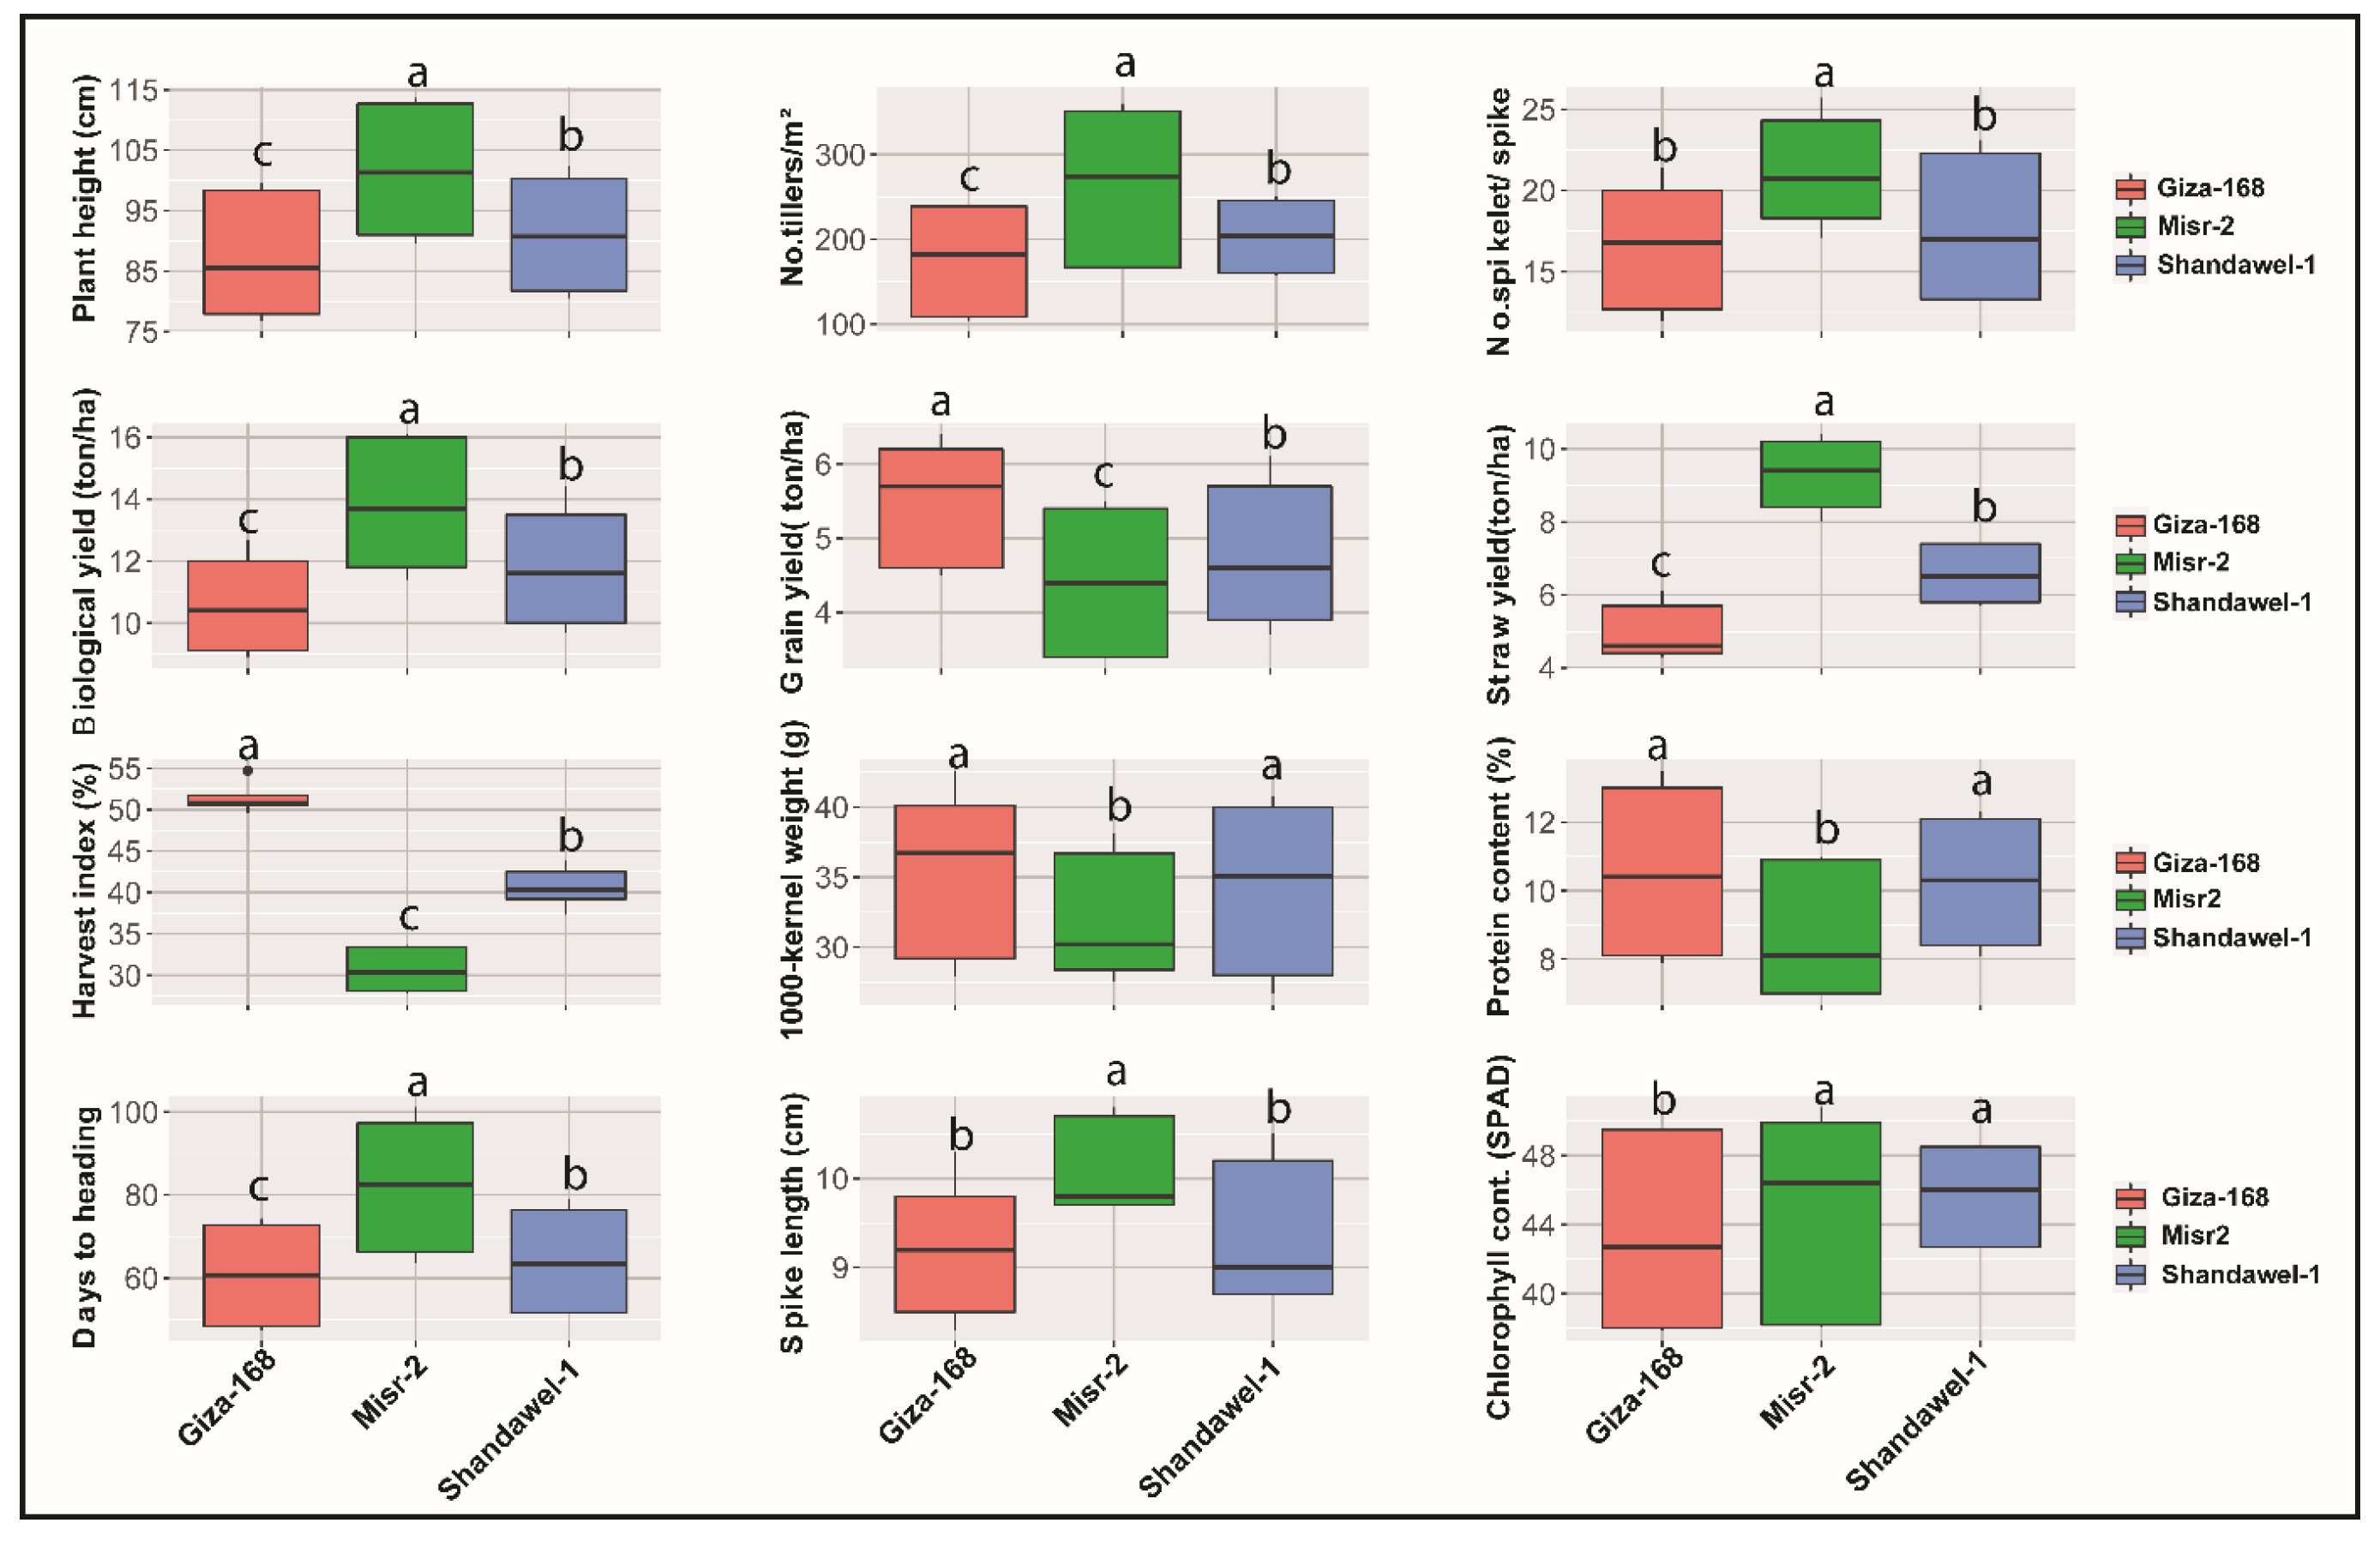
3.1. Plant Growth and Yield Parameters

The analysis of variance (ANOVA) for the variation between cultivars, fertilizers, and cultivars × fertilizers interaction is shown in Table 3. The results showed that cultivars and N fertilization exhibited highly significant differences (p ≤ 0.01) on PH, NTM, NSS, BY, GY, SY, HI, and TGW, PC, DTH, SL, and CC in the two seasons of study. In addition, interaction between cultivars and the N fertilizer combined with azotobacter showed a highly significant effect (p ≤ 0.05) on all studied traits in both seasons.

3.1.1. Plant Height, Number of Tillers/m2, and Days to 50% Heading

The results of the mean effect showed that Misr-2 recorded the highest wheat plants (101.6 cm), followed by shandawel-1 (91.1 cm), and Giza-168 (87.6 cm) (Figure 1). Accordingly, an overall plant height increase of 15 and 4% was achieved by Misr-2 and shandawel-1, respectively, compared to Giza-168. For fertilization treatments, 100%N produced the tallest wheat plants (105.2 cm) followed by 75% + azotobacter (103.8 cm), which recorded 28 and 26% increase as compared with 25%N + azotobacter or azotobacter treatments. The interactions of a cultivar with fertilizer showed that Misr-2 combined with 100%N recorded the highest values of plant height (113.7 and 116.7 cm) in both seasons, respectively, whereas the values were statistically similar for 75%N + azotobacter treatments (112.77 and 114.6 cm) over the two growing seasons (Table 4). In contrast, the interactive effect of azotobacter with the three cultivars exhibited the shortest plants (82.2 cm) during both seasons. Regarding the number of tillers/m2, Misr-2 yielded the maximum number of tillers (236) with an increase of 26%, followed by shandawel-1, which had a tiller number of 201 with an increase of 8% in compared with Giza-168 (Figure 1). On the other hand, a non-significant difference was found between 100%N and 75%N + azotobacter, which recorded the highest number of tillers/m2 (242 and 240 respectively). In contrast, the treatments “25%N + azotobacter” and “azotobacter” exhibited the lowest number of tillers/m2 (173 and 171 respectively) which showed a decrease in tillers number/ m2 by 28 and 29%, respectively, compared with 100%N. For the interaction effect of cultivars and fertilization treatment, Misr-2 along with 100%N recorded the highest No. of tillers /m2 (283 and 280), whereas it recorded 279 and 278 with the combination of 75%N + azotobacter in both growing seasons, resulting in an increase in tillers number/m2 greater than 50% compared with Giza-168 combined with azotobacter.
With regard to days to 50% heading, the findings showed that Giza-168 significantly was the earliest by 35.4% and 6.1% compared to Misr-2 and shandawel-1, respectively, as shown in Figure 1. Regarding fertilizer treatments, azotobacter inoculation exhibited the earliest heading date by 54.1%, followed by 25%N + azotobacter (49.1%), and 50%N + azotobacter (25.2%) compared to 100%N and 75%N + azotobacter (Figure 2). The effect of cultivar and fertilization interaction showed that Giza-168 with azotobacter was earlier by 45.6 and 46.3% compared to the other two cultivars, Misr-2 and shandawel-1, under azotobacter inoculation in both seasons, respectively (Table 4).

3.1.2. Number of Spikelets/Spike and Spike Length

The findings indicated that Misr-2 recorded the highest overall average of number of spikelets/spike (21.2, Figure 1). The 100%N treatment, followed by 75%N + azotobacter treatment recorded 23.3 and 22.2 spikelets/spike, respectively, which was higher than that recorded with the other treatments (Figure 2). In addition, Giza-168 recorded the highest number of spikelets /spike (25.6 and 25, respectively) when 100%N treatment was applied in the two growing seasons in comparison with the rest of the treatments (Table 4). With regard to spike length, Misr-2 had the highest spike length in the two growing seasons, with an overall average of 9.9 cm. With regard to fertilization treatment, the tallest spike length (11.9 cm) was obtained by the application of 100%N treatment, followed by 75%N + Azotobacter (11.5 cm). As regard to best combinations between cultivar and fertilization, the highest spike length obtained with the combination of Giza-168 with each of 100%N (13.5 and 13.5) and with 75%N + azotobacter (12.9 and 13.2 cm) in the first and second seasons, respectively (Table 5).

3.1.3. Yield and Yield-Related Traits

Among the wheat cultivars, Misr-2 was suppressed in biological yield by 29.9% and 14% compared to Giza-168 and shandawel-1, respectively, whereas Misr-2 was superior by 45% and 29% in comparison with Giza-168 and shandawel-1, respectively, for straw yield. Moreover, Giza-168 exhibited an increase in grain yield and harvest index greater than 13% and 26%, respectively, compared to Misr-2, which recorded the lowest grain yield and harvest index as shown in Figure 1. Such improvement in yield and harvest index was observed with increasing the N fertilization as shown in Figure 1. The highest level of applied N (100%N) produced maximum biological, grain, and straw yields compared to the solely azotobacter treatment. For instance, the application of 100%N was far better in biological yield than other treatments (75%N + azotobacter, 50%N + azotobacter, and 25%N + azotobacter) by 5, 24 and 43% respectively. With the application of 100%N and 75%N + azotobacter, Giza-168 exhibited the highest harvest index as it recorded 50.8 and 51.7% in the first season and 50.7 and 51.8% in the second season, respectively. In contrast, Misr-2 combined with the application of 100%N recorded the highest biological and straw yields as shown in Table 5.
In comparison to Misr-2, Giza-168 had a relatively higher 1000-grain weight increase of 9.6%, followed by Shandwel-1 (5.8%). Results in Figure 2 also revealed that 100%N treatment gave significant increases in 1000-grain weight (47.8%), followed by 75%N + azotobacter treatment (42.1%) in both seasons. By contrast, the azotobacter and 25%N + azotobacter treatments led to a reduction in grain weight by 33 and 27%, respectively. With respect to the interactive effect of cultivars and fertilization treatment, Giza-168 with 100%N recorded the highest values of 1000-grain weight (42.6 g and 40.4 g) in 2020/2021 and 2021/2022, respectively, whereas the lowest values were obtained by each of Misr-2 and shandawel-1 with azotobacter treatment (Table 5).

3.1.4. Chlorophyll and Protein Content

Results shown in Figure 1 indicated that a significant increase was achieved by Misr-2 (3%) and Shandawel-1 (5%) in the chlorophyll content compared to Giza-168. Results also showed that combined application of N with the azotobacter inoculation resulted in a significant increase in the chlorophyll content. The two treatments of 100%N and 75%N + azotobacter recorded the highest chlorophyll content in comparison with the other treatments (Figure 2). Furthermore, a significant effect of the interaction between wheat cultivars and N levels was observed for chlorophyll content (Table 4) where Misr-2 exhibited the highest chlorophyll content at high N levels (100%N and 75%N + aztobacter), whereas Giza-168 displayed the lowest value under 25%N + azotobacter and azotobacter treatments in both growing seasons (Table 4). For protein content, cultivars and N application had significant effects on such grain quality parameter. Results in Figure 1 showed that cultivars Shandawel-1 (10%) and Giza-168 (11%) exhibited the highest protein content compared with Misr-2 (9%). Among fertilization treatments, there was no significant difference in protein content between 100%N and 75%N + azotobacter (12% and 12% respectively), while individual applications of azotobacter recorded the lowest significant protein content (8%) in both seasons (Figure 2). A significant interaction effect between wheat cultivars and N levels was observed for protein content (Table 4). For the interaction between cultivars and fertilization treatment, the three cultivars recorded the highest protein content from 10 to 11% in both growing seasons when 100%N and 75%N + azotobacter were applied, respectively (Table 4).

3.2. Correlation Coefficients

The results of correlation coefficients among 12 studied traits were presented in Table 6. According to these findings, most of the correlation coefficients were found to be highly significantly positive. Among all, the strongest correlation coefficients were exhibited by PH with each of BY (0.99 ***), DTH (0.99 ***), NSS (0.98 **), NTM (0.97 ***), SL (0.94 ***). Moreover, other strong coefficients of correlation were observed between NTM with BY (0.96 ***) and DTH (0.98 ***). In addition, other highly significant and positive associations were observed between NSS and BY (0.97 ***), NSS and SL (0.97 ***), TGW and PC (0.97 ***), NSS and DTH (0.96 ***), GY and PC (0.97 ***). The only significant and negative correlation was found between HI and SY (−0.79 ***).

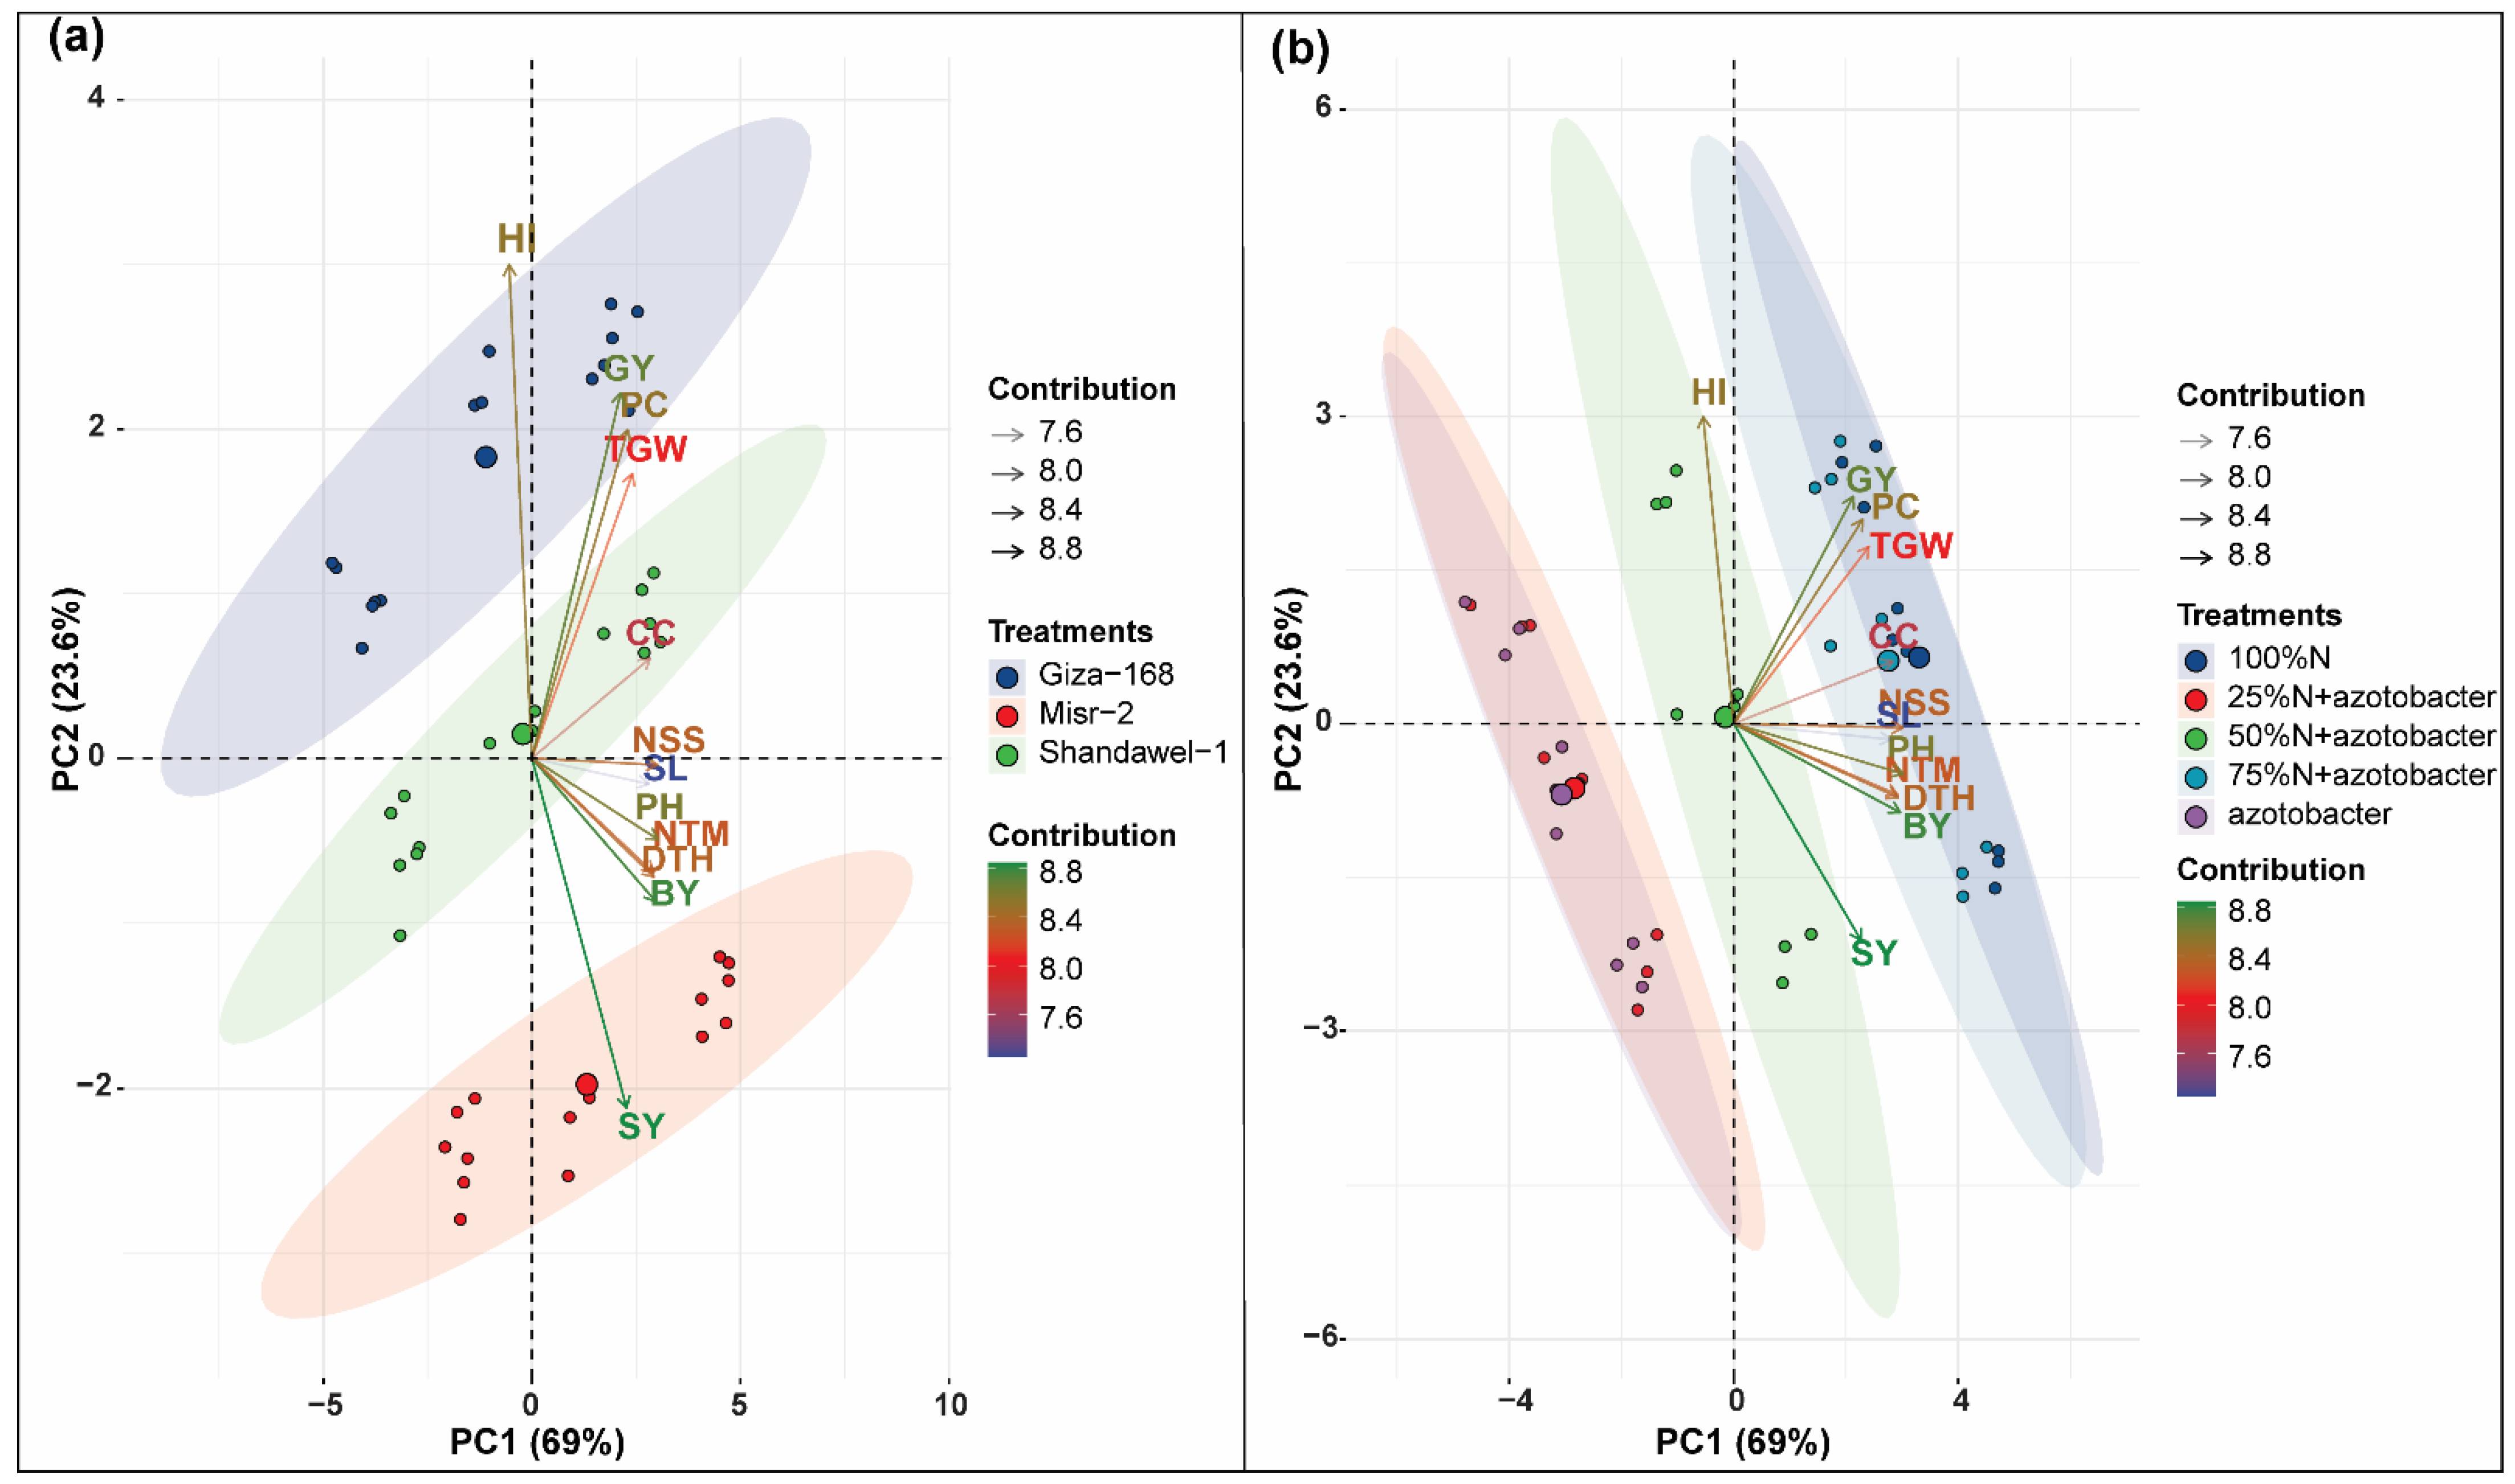
3.3. Principal Component Analysis (PCA)

To minimize the data dimensionality and show the possible correlations among the observed features in this research, principal component analysis (PCA) was undertaken using the dataset of 3 wheat cultivars and 5 fertilization variables (Figure 3). Since the first two PCs revealed the largest proportion of variance (92.6%), the PCA-biplot was constructed using PC1 (69%) and PC2 (23.6%). There was a slight separation between genotypes in the growing season, and these were directly related to the agronomic traits (Figure 3a). Giza-168 was located on the upper left side of the figure, exhibiting the highest grain yield and harvest index, while Misr-2, at the bottom right of the figure, had the highest level of other traits. Shandawel-1 cultivar was placed in the distance between the two other cultivars, with an intermediate level of all studied traits, excluding harvest index and grain yield. Regarding fertilization treatments (Figure 3b), the results of the biplot indicated that a strong distinction occurred between the mineral N and azotobacter treatments (Figure 3b). The five treatments were separated on the biplot side where 100%N and 75N% + azotobacter were located in the upper right side of the figure which exhibited the highest values of yield and growth characters. While azotobacter treatment and 25N% + azotobacter were plotted at the bottom left of the figure with the lowest values. For the treatment 50%N + azotobacter, it was placed between these two groups, with an intermediate value of growth and yield traits.

4. Discussion

In the current investigation, significant cultivar distinctions were observed among the three wheat cultivars, being Shandwel-1, Misr-2, and Giza-168 in terms of the following characteristics: plant height, number of tiller /m2, spike length, number of spikelets per spike, 1000-grain weight, grain yield/ha, straw and biologicals yield, harvest index, days to 50% heading and grain protein contents. The results clearly indicate that the Misr-2 cultivar produced markedly greater mean values over both cultivars Shandwel-1 and Giza-168 as for the following parameters: plant height, tillering number /m2, number of spikelets per spike, spike length, straw, and biological yield. On the other hand, respecting grain yield, harvest index, protein content, and 1000-grain weight, where Giza-168 and Shandwel-1 wheat cultivars ranked first in this regard. Such a trend existed in both seasons of study. It is clear from these results that the ranking of wheat cultivars in respect to the final yields (grain, straw, biological, and protein content) was similar to that of yield attributes. given that the cultivar variations in such yields were not enough to change the ranking of yield attributes in all the studied cultivars [14]. In this regard, these findings reflect the wide variation among the three wheat cultivars in both growth and yield parameters due to the response of each cultivar to the environmental conditions that existed during the two growing seasons, in addition to being controlled by the genetic factor [37]. Some researchers denoted that genetic makeup among wheat cultivars could be responsible much for such changes in yield attributes, yield, and quality as they documented significant variations among cultivars in the majority of yield traits and grain yield as well as grain quality [5,38,39,40].
Regarding the findings of our current research, using biofertilizers in conjunction with N led to an increase in grain yield, in addition to a notable decrease in N fertilizer applied by 25%. These findings are in agreement with previous reports that pinpointed the positive and economic impacts of combining biofertilizers with mineral N fertilizers [41,42]. These studies were also undertaken to investigate the efficacy of combining biofertilizer with conventional mineral fertilizers and their impact on the quantitative plant attributes. According to the results of a study conducted on sunflower, the integrated application of mineral N fertilizer and Azotobacter had a substantial influence on enhancing seed yield and yield components [43]. Such beneficial impact of a combination between mineral biofertilizers could be attributed to rising root development, water availability, nutrient absorption, and increased plant height, due to the use of biofertilizers, especially Azotobacter [44,45]. Because of their capacity for N bio-fixation and the expansion of the root area, the bacteria that are contained in biofertilizer provide a significant contribution to the optimal absorption of water and nutrients, as well as the production of growth hormones and certain vitamins. With respect to improved seed output in plants that had been fed with N-containing biofertilizers, researchers have claimed that when plants take N and other nutrients, they will be in a better position for nutrient uptake, since they will be in a more balanced state [46]. This contribution of biofertilizers ultimately results in a high yield as a direct consequence [47,48,49,50]. Moreover, biofertilizers’ bacteria improve the structure and activity of beneficial soil microbes, which in turn provide plants with optimal access to water and nutrients, which in turn increase yields [51]. In this manner, seed inoculation with Azotobacter and Pseudomonas led to an increase in seed production compared to control [52]. Therefore, plant height, number of tillers per m2, number of spikelets per spike, biological yield, straw yield, and grain yield all increased as a result of the symbiotic relationship between N-fixing bacteria and the large root system. For protein content and plant height, previous investigations [53,54] reported that combining N with biological fertilizers increased protein content and plant height due to the addition of N and pseudomonas, which is in line with findings of the current study. Consistent with previous studies, the findings of the current research indicated that there is an increase in harvest index, which could be owing to an increase in the translocation of photosynthates due to enhanced root growth, water and nutrient intake, and photosynthesis with the application of biofertilizers [55]. A previous study revealed that the combined chemical and biofertilizer application resulted in the maximum harvest index, but that there were no statistically significant differences between N as a biofertilizer and N as a chemical fertilizer [56]. When organic and biofertilizers are used in conjunction with fennel, the harvest index of fennel is lowered when compared to the control [57], which is not consistent with the findings of the current research.
In the current study, findings of the Pearson correlation analysis among 12 studied traits showed interesting significant and strong correlations between grain yield and several attributes, such as plant height, No. spikeletes/spike, 1000-grain weight, protein content, and chlorophyll content. Moreover, grain yield had a significantly moderate positive correlation with spike length and harvest index. These traits are of great importance for selection and breeding criteria for grain yield improvement, which highlights the role of those yield components in contributing to high grain yield. Many researchers indicated that wheat grown in the different environments grain yield was significantly correlated with No. spikeletes/spike and 1000-grain weight [58,59,60,61]. Contrary to our research, Shahid et al. [62], Akram et al. [58], and Joshi et al. [63] reported that grain yield was negatively correlated with plant height.
The principal component analysis (PCA) was utilized in the current study to visualize effects of both cultivar and fertilization treatments on growth, yield, and yield related traits in wheat under field conditions. Basically, PCA is usually used to identify the traits that accounted for the majority of the variation existing; therefore, it is widely implemented in several studies to confirm the influential factors that affect the studied parameters [64,65,66,67,68,69]. In the current study, the results of PCA confirmed the findings of ANOVA as the first two PCs accounted for 92.6% of the total variation among the three wheat cultivars and the five fertilization treatments. A notable distinction was observed among the three wheat cultivars subjected to the five fertilization treatments, implying the usefulness of PCA as a robust and fast visualizing tool in investigating the influence of studied factors on measured traits. According to the finding of PCA-biplot in this study, Giza-168 possessed the highest level of both grain yield, harvest index, and protein content, while Misr-2 had the highest level of other traits, including spike length, No. spikelets /spike, plant height, days to 50% heading, No. tillers/m2, and biological yield. Moreover, results showed that the cultivar Shandawel-1 exhibited high values of chlorophyll content and 1000-grain weight. Similarly, PCA-biplot was successfully used in the current study to differentiate among the five treatments with respect to their influence on all measured parameters. In this context, 100%N and 75N% + azotobacter treatments were superior in yield and growth characters, while azotobacter treatment and 25N% + azotobacter showed a reverse pattern with the same traits.

5. Conclusions

Wheat production, especially in semiarid regions, is largely influenced by N management. Using the increased level of N in this study resulted in a substantial rise in all studied characters except for spike length. The two treatments of solely 100%N and 75% + azotobacter produced the best results for all the agronomic traits tested. Furthermore, it was clear that the studied wheat cultivars differed significantly in all studied parameters. Moreover, Misr-2 had the highest straw and biological yields, followed by Shandawel-1, while Giza-168, on the other hand, had the highest grain yield than the other two cultivars. Such findings of the interactive effect of wheat cultivars with fertilization treatments revealed that Misr-2 performed better with 100%N and 75% + azotobacter in terms of GY and SY, while Giza-168 showed the best effect with the same fertilization combinations in terms of HI and BY. As a result, the cultivars Giza-168 and Misr-2 may have the potential to be economically viable and useful in wheat breeding projects aimed at increasing N efficiency and its impact on final yield.

Author Contributions

Conceptualization, G.A.E.-S. and S.F.L.; Data curation, E.A.A.S.; Formal analysis, G.A.E.-S. and S.F.L.; Investigation, G.A.E.-S. and S.F.L.; Methodology, A.M.A., E.A.A.S., L.S.P. and G.A.E.-S.; Project administration, A.A.A.E.-B., G.A.E.-S., N.G.H. and S.F.L.; Funding acquisition, H.M.A. and M.H.S.; Resources, A.A.A.E.-B., E.A.A.S., A.M.A., H.M.A., M.H.S. and N.G.H.; Supervision, S.F.L.; Visualization, A.M.A. and S.F.L.; Writing—original draft, S.F.L.; Writing—review & editing, A.M.A., N.G.H., H.M.A., M.H.S., L.S.P. and S.F.L. All authors have read and agreed to the published version of the manuscript.

Funding

This research was funded by Researchers Supporting Project number (RSP-2021/123) King Saud University, Riyadh, Saudi Arabia.

Institutional Review Board Statement

Not applicable.

Informed Consent Statement

Not applicable.

Data Availability Statement

Not applicable.

Acknowledgments

The authors would like to extend their sincere appreciation to the Researchers Supporting Project (RSP-2021/123) King Saud University, Riyadh, Saudi Arabia.

Conflicts of Interest

The authors declare no conflict of interest.

References

  1. Marris, E. Agronomy: Five crop researchers who could change the world. Nature 2008, 456, 563–569. [Google Scholar] [CrossRef] [PubMed] [Green Version]
  2. Dixon, J.; Braun, H.-J.; Kosina, P.; Crouch, J.H. Wheat Facts and Futures 2009; Cimmyt: Veracruz, Mexico, 2009. [Google Scholar]
  3. Vessey, J.K. Plant growth promoting rhizobacteria as biofertilizers. Plant Soil 2003, 255, 571–586. [Google Scholar] [CrossRef]
  4. El-Naggar, M.E.; Abdelsalam, N.R.; Fouda, M.M.G.; Mackled, M.I.; Al-Jaddadi, M.A.M.; Ali, H.M.; Siddiqui, M.H.; Kandil, E.E. Soil Application of Nano Silica on Maize Yield and Its Insecticidal Activity Against Some Stored Insects After the Post-Harvest. Nanomaterials 2020, 10, 739. [Google Scholar] [CrossRef] [PubMed]
  5. Abdelsalam, N.R.; Kandil, E.E.; Al-Msari, M.A.; Al-Jaddadi, M.A.; Ali, H.M.; Salem, M.Z.; Elshikh, M.S. Effect of foliar application of NPK nanoparticle fertilization on yield and genotoxicity in wheat (Triticum aestivum L.). Sci. Total Environ. 2019, 653, 1128–1139. [Google Scholar] [CrossRef]
  6. Amanullah; Iqbal, A.; Ali, A.; Fahad, S.; Parmar, B. Nitrogen Source and Rate Management Improve Maize Productivity of Smallholders under Semiarid Climates. Front. Plant Sci. 2016, 7, 1773. [Google Scholar] [CrossRef] [Green Version]
  7. Bindraban, P.S.; Dimkpa, C.; Nagarajan, L.; Roy, A.; Rabbinge, R. Revisiting fertilisers and fertilisation strategies for improved nutrient uptake by plants. Biol. Fertil. Soils 2015, 51, 897–911. [Google Scholar] [CrossRef] [Green Version]
  8. Singh, B.; Ryan, J. Managing fertilizers to enhance soil health. Int. Fertil. Ind. Assoc. 2015, 1. [Google Scholar] [CrossRef]
  9. Liu, Z.; Sun, K.; Liu, W.; Gao, T.; Li, G.; Han, H.; Li, Z.; Ning, T. Responses of soil carbon, nitrogen, and wheat and maize productivity to 10 years of decreased nitrogen fertilizer under contrasting tillage systems. Soil Tillage Res. 2020, 196, 104444. [Google Scholar] [CrossRef]
  10. Dachler, M.; Köchl, A. Der einfluss von fruchtfolge, vorfrucht, stickstoffdüngung und einarbeitung der ernterückstände auf ertrag und rohproteingehalt von winterweizen und nachfolgender sommergerste. Die Bodenkult. 2003, 54, 23–34. [Google Scholar]
  11. Moitzi, G.; Neugschwandtner, R.W.; Kaul, H.-P.; Wagentristl, H. Energy efficiency of winter wheat in a long-term tillage experiment under Pannonian climate conditions. Eur. J. Agron. 2019, 103, 24–31. [Google Scholar] [CrossRef]
  12. Moitzi, G.; Thünauer, G.; Robier, J.; Gronauer, A. Energieeinsatz und Energieeffizienz in der Körnermaisproduktion bei unterschiedlicher Stickstoffdüngung in der Südsteiermark. Die Bodenkult. 2015, 66, 25–37. [Google Scholar]
  13. Fageria, N.K.; Baligar, V. Enhancing nitrogen use efficiency in crop plants. Adv. Agron. 2005, 88, 97–185. [Google Scholar]
  14. Barraclough, P.B.; Howarth, J.R.; Jones, J.; Lopez-Bellido, R.; Parmar, S.; Shepherd, C.E.; Hawkesford, M.J. Nitrogen efficiency of wheat: Genotypic and environmental variation and prospects for improvement. Eur. J. Agron. 2010, 33, 1–11. [Google Scholar] [CrossRef]
  15. Yang, X.; Lu, Y.; Ding, Y.; Yin, X.; Raza, S. Optimising nitrogen fertilisation: A key to improving nitrogen-use efficiency and minimising nitrate leaching losses in an intensive wheat/maize rotation (2008–2014). Field Crops Res. 2017, 206, 1–10. [Google Scholar] [CrossRef]
  16. Tian, Z.-W.; Liu, X.-X.; Gu, S.-L.; Yu, J.-H.; Zhang, L.; Zhang, W.-W.; Jiang, D.; Cao, W.-X.; Dai, T.-B. Postponed and reduced basal nitrogen application improves nitrogen use efficiency and plant growth of winter wheat. J. Integr. Agric. 2018, 17, 2648–2661. [Google Scholar] [CrossRef] [Green Version]
  17. Yin, L.; Dai, X.; He, M. Delayed sowing improves nitrogen utilization efficiency in winter wheat without impacting yield. Field Crops Res. 2018, 221, 90–97. [Google Scholar] [CrossRef]
  18. Tilman, D.; Balzer, C.; Hill, J.; Befort, B.L. Global food demand and the sustainable intensification of agriculture. Proc. Natl. Acad. Sci. USA 2011, 108, 20260–20264. [Google Scholar] [CrossRef] [Green Version]
  19. Bargaz, A.; Lyamlouli, K.; Chtouki, M.; Zeroual, Y.; Dhiba, D. Soil microbial resources for improving fertilizers efficiency in an integrated plant nutrient management system. Front. Microbiol. 2018, 9, 1606. [Google Scholar] [CrossRef] [Green Version]
  20. Ahmad, F.; Ahmad, I.; Khan, M. Screening of free-living rhizospheric bacteria for their multiple plant growth promoting activities. Microbiol. Res. 2008, 163, 173–181. [Google Scholar] [CrossRef]
  21. Anastasio, M.; Pepe, O.; Cirillo, T.; Palomba, S.; Blaiotta, G.; Villani, F. Selection and use of phytate-degrading LAB to improve cereal-based products by mineral solubilization during dough fermentation. J. Food Sci. 2010, 75, M28–M35. [Google Scholar] [CrossRef]
  22. Van Oosten, M.J.; Pepe, O.; De Pascale, S.; Silletti, S.; Maggio, A. The role of biostimulants and bioeffectors as alleviators of abiotic stress in crop plants. Chem. Biol. Technol. Agric. 2017, 4, 1–12. [Google Scholar] [CrossRef] [Green Version]
  23. Joseph, B.; Patra, R.R.; Lawrence, R. Characterization of plant growth promoting rhizobacteria associated with chickpea (Cicer arietinum L.). Int. J. Plant. Prod. 2007, 1, 141–152. [Google Scholar]
  24. Lee, S.; Lee, J. Beneficial bacteria and fungi in hydroponic systems: Types and characteristics of hydroponic food production methods. Sci. Hortic. 2015, 195, 206–215. [Google Scholar] [CrossRef]
  25. Rueda, D.; Valencia, G.; Soria, N.; Rueda, B.B.; Manjunatha, B.; Kundapur, R.R.; Selvanayagam, M. Effect of Azospirillum spp. and Azotobacter spp. on the growth and yield of strawberry (Fragaria vesca) in hydroponic system under different nitrogen levels. Appl. Pharm. Sci. 2016, 6, 48–54. [Google Scholar] [CrossRef] [Green Version]
  26. Hanafy Ahmed, A.; Mishriky, J.; Khalil, M. Reducing nitrate accumulation in lettuce (Lactuca sativa L.) plants by using different biofertilizers. Ann. Agric. Sci. 2002, 47, 27–42. [Google Scholar]
  27. Arough, Y.K.; Sharifi, R.S.; Sedghi, M.; Barmaki, M. Effect of zinc and bio fertilizers on antioxidant enzymes activity, chlorophyll content, soluble sugars and proline in triticale under salinity condition. Not. Bot. Horti Agrobot. Cluj-Napoca 2016, 44, 116–124. [Google Scholar] [CrossRef] [Green Version]
  28. Sudhakar, P.; Chattopadhyay, G.; Gangwar, S.; Ghosh, J. Effect of foliar application of Azotobacter, Azospirillum and Beijerinckia on leaf yield and quality of mulberry (Morus alba). J. Agric. Sci. 2000, 134, 227–234. [Google Scholar] [CrossRef] [Green Version]
  29. Aasfar, A.; Bargaz, A.; Yaakoubi, K.; Hilali, A.; Bennis, I.; Zeroual, Y.; Meftah Kadmiri, I. Nitrogen fixing Azotobacter species as potential soil biological enhancers for crop nutrition and yield stability. Front. Microbiol. 2021, 12, 354. [Google Scholar] [CrossRef]
  30. Razmjooei, Z.; Etemadi, M.; Eshghi, S.; Ramezanian, A.; Mirazimi Abarghuei, F.; Alizargar, J. Potential Role of Foliar Application of Azotobacter on Growth, Nutritional Value and Quality of Lettuce under Different Nitrogen Levels. Plants 2022, 11, 406. [Google Scholar] [CrossRef]
  31. Gurav, R.G.; Jadhav, J.P. A novel source of biofertilizer from feather biomass for banana cultivation. Environ. Sci. Res. 2013, 20, 4532–4539. [Google Scholar] [CrossRef]
  32. Abdelmageed, K.; Chang, X.-H.; Wang, D.-M.; Wang, Y.-J.; Yang, Y.-S.; Zhao, G.-C.; Tao, Z.-Q. Evolution of varieties and development of production technology in Egypt wheat: A review. J. Integr. Agric. 2019, 18, 483–495. [Google Scholar] [CrossRef] [Green Version]
  33. Carter, M. Characterization of soil physical properties and organic matter under long-term primary tillage in a humid climate. Soil Tillage Res. 1996, 38, 251–263. [Google Scholar] [CrossRef]
  34. soil and allow regrowth of natural vegetation. Environ. Pollut. 2006, 139, 40–52. [CrossRef]
  35. Liu, X.-J.; Yin, B.-Z.; Hu, Z.-H.; Bao, X.-Y.; Wang, Y.-D.; Zhen, W.-C. Physiological response of flag leaf and yield formation of winter wheat under different spring restrictive irrigation regimes in the Haihe Plain, China. J. Integr. Agric. 2021, 20, 2343–2359. [Google Scholar] [CrossRef]
  36. SAS. The SAS system for Windows. Release 9.4; SAS Institute: Cary, NC, USA, 2013. [Google Scholar]
  37. Koua, A.P.; Oyiga, B.C.; Baig, M.M.; Léon, J.; Ballvora, A. Breeding driven enrichment of genetic variation for key yield components and grain starch content under drought stress in winter wheat. Front. Plant Sci. 2021, 12, 684205. [Google Scholar] [CrossRef]
  38. Atia, M.A.; Shaban, K.A.; Sallam, A.M. Role of Humic, Ascorbic Acids with or without Compost to Improve Nutrients Content, Yield Components, and Seed Quality of Sesame. J. Soil Sci. Agric. Eng. 2014, 5, 1049–1066. [Google Scholar] [CrossRef]
  39. Ash-Shormillesy, S.M.; Yasin, M. Effectiveness of Organic and Bio-Fertilization on Reduce Rates of Mineral Nitrogen Fertilizers and Impact on Productivity of some Wheat Cultivars. J. Plant. Prod. 2021, 12, 909–919. [Google Scholar] [CrossRef]
  40. Abdou, E.-S.M.; Ghanem, S.; Zeiton, O.; Omar, A. Effect of some bio-fertilizers on the yield and quality of three bread wheat cultivars under differed nitrogen levels. Zagazig J. Agric. Res. 2018, 45, 1581–1597. [Google Scholar] [CrossRef]
  41. Namvar, A.; Khandan, T. Response of wheat to mineral nitrogen fertilizer and biofertilizer (Azotobacter sp. and Azospirillum sp.) inoculation under different levels of weed interference. Ekologija 2013, 59, 85–94. [Google Scholar] [CrossRef]
  42. El-Khateeb, N.M.; Metwaly, M.M. Influence of some bio-fertilizers on wheat plants grown under graded levels of nitrogen fertilization. Int. J. Environ. 2019, 8, 43–56. [Google Scholar]
  43. Arif, M.S.; Riaz, M.; Shahzad, S.M.; Yasmeen, T.; Akhtar, M.J.; Riaz, M.A.; Jassey, V.E.; Bragazza, L.; Buttler, A. Associative interplay of plant growth promoting rhizobacteria (Pseudomonas aeruginosa QS40) with nitrogen fertilizers improves sunflower (Helianthus annuus L.) productivity and fertility of aridisol. Appl. Soil Ecol. 2016, 108, 238–247. [Google Scholar] [CrossRef]
  44. Vafa, Z.N.; Sohrabi, Y.; Sayyed, R.; Luh Suriani, N.; Datta, R. Effects of the Combinations of Rhizobacteria, Mycorrhizae, and Seaweed, and Supplementary Irrigation on Growth and Yield in Wheat Cultivars. Plants 2021, 10, 811. [Google Scholar] [CrossRef] [PubMed]
  45. Rostami, A.; Mohammadi, K. Effect of nitrogen and Aztobactor fertilizers on the grain yield and nitrogen use efficiency of Moroccan single cross corn. Plant Ecophysiol. 2020, 12, 200–210. [Google Scholar]
  46. Du Jardin, P. Plant biostimulants: Definition, concept, main categories and regulation. Sci. Hortic. 2015, 196, 3–14. [Google Scholar] [CrossRef] [Green Version]
  47. Yasari, E.; Patwardhan, A. Effects of (Azotobacter and Azosprillium) inoculants and chemical fertilizers on growth and productivity of canola (Brassica napus L.). Asian J. Plant. Sci. 2007, 6, 77–82. [Google Scholar] [CrossRef] [Green Version]
  48. Abdelghany, A.M.; El-Banna, A.A.A.; Salama, E.A.A.; Ali, M.M.; Al-Huqail, A.A.; Ali, H.M.; Paszt, L.S.; El-sorady, G.; Lamlom, S.F. The Individual and Combined Effect of Nanoparticles and Biofertilizers on Growth, Yield, and Biochemical Attributes of Peanuts (Arachis hypogea L.). Agronomy 2022, 12, 398. [Google Scholar] [CrossRef]
  49. Abdelghany, A.M.; Zhang, S.; Azam, M.; Shaibu, A.S.; Feng, Y.; Qi, J.; Li, J.; Li, Y.-F.; Tian, Y.; Hong, H.-l.; et al. Exploring the Phenotypic Stability of Soybean Seed Compositions Using Multi-Trait Stability Index Approach. Agronomy 2021, 11, 2200. [Google Scholar] [CrossRef]
  50. Youssef, M.A.; Yousef, A.F.; Ali, M.M.; Ahmed, A.I.; Lamlom, S.F.; Strobel, W.R.; Kalaji, H.M. Exogenously applied nitrogenous fertilizers and effective microorganisms improve plant growth of stevia (Stevia rebaudiana Bertoni) and soil fertility. AMB Express 2021, 11, 133. [Google Scholar] [CrossRef]
  51. Akhtar, M.; Siddiqui, Z. Effects of phosphate solubilizing microorganisms and Rhizobium sp. on the growth, nodulation, yield and root-rot disease complex of chickpea under field condition. Afr. J. Biotechnol. 2009, 8, 3489–3496. [Google Scholar]
  52. Dan, C.; Liang-Gang, Z.; Jun, X.; Qian, Z.; Yan, Z. Effects of biofertilizer on organically cultured cucumber growth and soil biological characteristics. Yingyong Shengtai Xuebao 2010, 21, 2587–2592. [Google Scholar]
  53. Sharifi, R.S.; Namvar, A.; Sharifi, R.S. Grain filling and fatty acid composition of safflower fertilized with integrated nitrogen fertilizer and biofertilizers. Pesqui. Agropecuária Bras. 2017, 52, 236–243. [Google Scholar] [CrossRef] [Green Version]
  54. Stefan, M.; Munteanu, N.; Stoleru, V.; Mihasan, M. Effects of inoculation with plant growth promoting rhizobacteria on photosynthesis, antioxidant status and yield of runner bean. Rom. Biotechnol. Lett. 2013, 18, 8132–8143. [Google Scholar]
  55. Emam, Y.; Eilkaie, M. Effect of plant density and chlormequat chloride (CCC) on morphological characteristics and grain yield of winter rape seed cv. Talayeh. Iran. J. Crop. Sci. 2002, 4, 1–8. [Google Scholar]
  56. Naik, P.; Chanemougasoundharam, A.; Khurana, S.P.; Kalloo, G. Genetic manipulation of carotenoid pathway in higher plants. Curr. Sci. 2003, 85, 1423–1430. [Google Scholar]
  57. Kapoor, R.; Giri, B.; Mukerji, K.G. Improved growth and essential oil yield and quality in Foeniculum vulgare mill on mycorrhizal inoculation supplemented with P-fertilizer. Bioresour. Technol. 2004, 93, 307–311. [Google Scholar] [CrossRef]
  58. Akram, Z.; Ajmal, S.U.; Munir, M. Estimation of correlation coefficient among some yield parameters of wheat under rainfed conditions. Pak. J. Bot 2008, 40, 1777–1781. [Google Scholar]
  59. Aycicek, M.; Yildirim, T.J.P.J.o.B. Path coefficient analysis of yield and yield components in bread wheat (Triticum aestivum L.) genotypes. Pak. J. Bot. 2006, 38, 417. [Google Scholar]
  60. Kashif, M.; Khaliq, I. Heritability, correlation and path coefficient analysis for some metric traits in wheat. Int. J. Agric. Biol. 2004, 6, 138–142. [Google Scholar]
  61. Mandic, V.; Krnjaja, V.; Tomic, Z.; Bijelic, Z.; Simic, A.; Ruzic Muslic, D.; Gogic, M. Nitrogen fertilizer influence on wheat yield and use efficiency under different environmental conditions. Chil. J. Agric. Res. 2015, 75, 92–97. [Google Scholar] [CrossRef] [Green Version]
  62. Shahid, M.; Mohammad, F.; Tahir, M. Path coefficient analysis in wheat. Sarhad J. Agric. 2002, 18, 383–388. [Google Scholar]
  63. Joshi, B.K.; Mudwari, A.; Thapa, D.B. Correlation and path coefficients among quantitative traits in wheat (Triticum aestivum L.). Nepal J. Sci. Technol. 2008, 9, 1–5. [Google Scholar] [CrossRef] [Green Version]
  64. Janmohammadi, M.; Navid, A.; Segherloo, A.E.; Sabaghnia, N. Impact of nano-chelated micronutrients and biological fertilizers on growth performance and grain yield of maize under deficit irrigation condition. Biologija 2016, 62. [Google Scholar] [CrossRef] [Green Version]
  65. Rathnathilaka, T.; Premarathna, M.; Madawala, S.; Pathirana, A.; Karunaratne, K.; Seneviratne, G. Biofilm biofertilizer application rapidly increases soil quality and grain yield in large scale conventional rice cultivation: A case study. Plant. Nutr. 2022, 1–11. [Google Scholar] [CrossRef]
  66. Meena, S.K.; Rakshit, A.; Meena, V.S. Effect of seed bio-priming and N doses under varied soil type on nitrogen use efficiency (NUE) of wheat (Triticum aestivum L.) under greenhouse conditions. Biocatal. Agric. Biotechnol. 2016, 6, 68–75. [Google Scholar] [CrossRef]
  67. Al-Suhaibani, N.; Selim, M.; Alderfasi, A.; El-Hendawy, S. Comparative performance of integrated nutrient management between composted agricultural wastes, chemical fertilizers, and biofertilizers in improving soil quantitative and qualitative properties and crop yields under arid conditions. Agronomy 2020, 10, 1503. [Google Scholar] [CrossRef]
  68. Dal Cortivo, C.; Ferrari, M.; Visioli, G.; Lauro, M.; Fornasier, F.; Barion, G.; Panozzo, A.; Vamerali, T. Effects of seed-applied biofertilizers on rhizosphere biodiversity and growth of common wheat (Triticum aestivum L.) in the field. Front. Plant Sci. 2020, 11, 72. [Google Scholar] [CrossRef] [Green Version]
  69. Lu, P.; Bainard, L.D.; Ma, B.; Liu, J. Bio-fertilizer and rotten straw amendments alter the rhizosphere bacterial community and increase oat productivity in a saline–alkaline environment. Sci. Rep. 2020, 10, 19896. [Google Scholar] [CrossRef]
Figure 1. Wheat cultivars performance on 12 studied traits for wheat determined at field experiments combined data from 2020 and 2021 seasons. Different lowercase letters on boxes indicate statistically significant differences between treatments (p ≤ 0.05), as performed by the least significant difference (Fisher’s LSD) test.
Sustainability 14 08394 g001
Figure 2. Effect of five fertilization treatments on 12 studied traits for wheat determined at field experiments combined data from 2020 and 2021 seasons. Different lowercase letters on boxes indicate statistically significant differences between treatments (p ≤ 0.05), as performed by the least significant difference (Fisher’s LSD) test.
Sustainability 14 08394 g002
Figure 3. Principal Component Analysis (PCA)−biplot of 3 wheat cultivars (a) and 5 fertilizer treatments (b) based on the variance in 12 morphological and yield traits. The first two components explained 69% and 23.6% of the variances, respectively. Arrows indicate the strength of the trait influence on the first two PCs. The different color intensities and lengths of the arrows denote the contribution of the traits to the first two components in the PCA. The darker green and longer arrows indicate a higher contribution, while the darker blue and shorter arrows indicate the lower contribution of the variables.
Sustainability 14 08394 g003
Table 1. Pedigree, origin, and year of release of the three bread wheat cultivars used in this study.
CultivarsPedigreeOriginYear of Release
Giza-168MRL/BUC//SERI-CM93046-8M-0Y-0M-2Y-0B-0SHEgypt1999
Misr-2SKAUZ/BAV92-CMSS96M03611S-1M-010SY-010M-010SY-8M-0Y-0SEgypt2010
Shandawel-1SITE/MO/4/NAC/TH.AC//3*PVN/3/MIRLO/BUC-CMSS93B00567S-72Y-010M-010Y-010M-3Y-0M-0HTY-0SHEgypt2011
* Asterisk indicates a back cross.
Table 2. Initial soil properties of the experimental soil during 2019/2020 and 2020/2021 seasons.
ParametersValues
2019/20 Season2020/21 Season
Particle size distributionClay %17.519.6
Sand %7068.5
Silt %12.511.9
Texture gradeSilt loamSilt loam
Available nutrientsN (mg kg−1)77.589.3
P (mg kg−1)30.435.8
K (mg kg−1)379436
Soluble cations
and anions
(cmol kg−1 soil)
Ca++2.081.94
Mg++4.694.7
Na+18.118.5
K+0.720.77
HCO33.673.73
Cl15.5315.66
SO46.416.57
Chemical propertiespH (Susp. 1:2.5 soil-water)7.237.26
EC (dSm−1)2.692.7
C.E.C (cmol kg−1)18.819.4
Organic matter (%)1.381.73
CaCO3 (%)43.242.3
Table 3. Analysis of variance showing effect of cultivars, fertilizers, and their interaction on 12 studied traits.
SOVPHNTMDTHNSSSLBY
2019/20202020/20212019/20202020/20212019/20202020/20212019/20202020/20212019/20202020/20212019/20202020/2021
Cultivars************************************
Fertilizer************************************
C × F********************************
CV0.960.701.191.100.750.693.153.062.953.012.686.31
R20.980.990.990.990.990.990.980.980.930.920.990.97
RMSE0.860.642.312.170.750.650.600.6100.2880.290.100.12
SOVGYSYHITGWPCCC
2019/20202020/20212019/20202020/20212019/20202020/20212019/20202020/20212019/20202020/20212019/20202020/2021
Cultivars*********************************
Fertilizer************************************
C × F********************************
CV2.306.314.614.968.473.760.700.990.370.512.112.20
R20.990.980.970.970.910.870.991.310.990.990.970.97
RMSE0.040.120.090.109.531.780.250.410.0410.0560.940.98
ns, *, **, *** indicate not significant, significant at 5% (p ≤ 0.05), significant at 1% (p ≤ 0.01) and significant at 0.1% (p ≤ 0.001), respectively. CV, coefficient of variation (%); RMSE, root mean square error; R2, coefficient of determination. C, cultivars; NF, fertilizers. PH, Plant height; NTM, No. tillers m−2; DTH, days to 50% heading; NSS, No. spikelets/spike; SL, Spike length (cm); BY, Biological yield (ton/ha), GY, Grain yield (ton/ha); SY, Straw yield (ton/ha); HI, Harvest index (%); TGW, 1000-grain weight (g); PC, Protein content (%); CC, Chlorophyll content (SPAD).
Table 4. Growth and yield traits of wheat cultivars treated with different combinations of N fertilizer and azotobacter across two successive seasons (2019/2020 and 2020/2021).
CFPHNTMDTHNSSSLBY
2019/20202020/20212019/20202020/20212019/20202020/20212019/20202020/20212019/20202020/20212019/20202020/2021
Misr-2100%N113.7 a116.7 a283 a280 a101.1 a102.1 a21.8 bcd22.1 abcd11.4 cd11.18 cde15.54 a16.1 a
75%N + AZ112.7 a114.6 a279 a278 a97.3 a98.3 a20.0 cde21.4 bcde10.8 d10.9 de15.3 a15.9 a
50%N + AZ101.3 b101.3 b248 b243 b82.4 b83.8 b16.8 e17.2 fg8.2 ef8.2 fg13.5 b13.6 b
25%N + AZ91 cde91.1 cd187 ef183 ef63.7 e64.3 e12.7 f13.1 h7.1 f7.1 g11.6 ed11.8 de
azotobacter89.5 def89.5 de183 ef182 ef66.3 de67.0 de11.9 f13.0 h7.1 f7.1 g11.1 e11.4 e
Shandawel-1100%N102.3 b104.4 b225 c219 c79.1 bc80.4 bc23.1 abc24.1 abc12.3 ab12.4 abc13.2 bc14.4 b
75%N + AZ100.3 b102.1 b222 cd217 cd76.3 bc78.0 bc22.3 bcd23.2 abc12.1 bc12.1 bcd12. 8 bc13.5 bc
50%N + AZ90.7 cde90.7 cde201 de197 ed63.4 e64.8 e17.0 e19.5 def10.3 d10.4 e10.9 ef11.6 e
25%N + AZ81.7 efg82.2 def179 f178 ef63.4 e52.7 f13.3 f14.1 gh8.4 e8.8 f9.4 gh10.1 fg
azotobacter80.5 gf82.1 ef179 f176 f51.3 f52.0 f13.2 f13.9 gh8.1 ef8.1 fg9. 3 gh9.7 gh
Giza-168100%N99.6 bc101.0 b220 cd218 c74.3 bcd75.7 bcd25.7 a25.0 a13.4 a13.5 a12.5 cd12.7 cd
75%N + AZ98.4 bc98.4 bc219 cd216.33 cd72.7 cd74.1 cd24. 3 ab24.2 ab12.9 ab13.1 ab11.8 de12.1 de
50%N + AZ85.5 efg88.3 de190 ef185 ef60.7 e62.8 e20.66 cd20.8 cde10.4 d10.6 e10.1 fg10.4 f
25%N + AZ77.9 g78.1 f154 g150 g48.3 f48.5 f18.33 ed18.3 ef8.1 ef8.1 fg8.9 h9.1 gh
azotobacter76.8 g78.1 f152 g198 g47.5 f48.5 f17.14 e16. 9 fd7.8 f7.9 fg8.5 h8.9 h
Different lowercase letters on error bars indicate statistically significant differences between treatments (p ≤ 0.05), as performed by the least significant difference (Fisher’s LSD) test. C, cultivars; NF, fertilizers. PH, Plant height (cm); NTM, No. tillers m−2; DTH, days to 50% heading; NSS, No. spikelets/spike; SL, Spike length(cm); BY, Biological yield(ton/ha).
Table 5. Yield and yield components of wheat cultivars treated with different combinations of N fertilizer and azotobacter accross two successive seasons (2020 and 2021).
aBGYSYHITGWPCCC
2019/20202020/22012019/20202020/20212019/20202020/20212019/20202020/20212019/20202020/20212019/20202020/2021
Misr-2100%N6.3 a6.4 a10.3 a10.6 a33.4 def34.1 cd38.1 bc36.3 ab10.8 a11.12 a50.8 a51.0 a
75%N + AZ5.1 de5.4 c10.2 a10.6 a33.6 de33.9 cde36.7 bc35.5 b10.6 ab10.8 a49.9 a50.0 a
50%N + AZ4.1 fg4.4 d9.4 ab9.3 b30.3 ef31.9 de30.2 d28.2 c9.6 cd9.8 abc46.4 b46.6 b
25%N + AZ3.3 h3.4 fg8.4 bc8.4 bc27.8 f29.1 e28.4 d28. 1 c9.8 bcd9.8 abc38.2 d39.5 d
Azotobacter3.1 h3.3 g7.9 cd8.0 c28.1 ef29.5 de27.6 d27.6 c9.6 cd9.8 abc38.12 d39.5 d
Sandawel-1100%N5.8 abc6.1 ab7.4 cde8.2 c48.8 b42.6 b40.6 ab39.4 ab10.2 abc10.7 a48.6 ab48.77 ab
75%N + AZ5.4 cd5.7 ab7.3 de7.7 cd42.5 bc42.4 b39.9 ab38.5 ab10.5 abc10.7 a48.5 ab48.6 ab
50%N + AZ4.4 f4.6 d6.5 ef7.0 de40.3 bc39.7 b39.9 ab34.7 b9.0 de9.3 bcd46.1 b46.4 b
25%N + AZ3.7 gh3.9 ef5.7 f6.3 ef39.3 bc39.1 b27.9 d27.2 c8.7 e8.8 cd42.7 c42.6 c
Azotobacter3.5 h3.7 fg5.8 f5.9 f37.3 cd38.4 bc26.7 d26.2 c8.7 e8.8 cd42.7 c43.1 c
Giza-168100%N6.1 ab6.2 ab6.1 f6.2 ef50.8 a50. a42.6 a40.4 a10.3 abc10.5 ab49.5 a50.1 a
75%N + AZ5.2 d5.5 c5.7 f5.8 f51.7 a51.8 a40.1 ab39.1 ab9.8 bcd10.3 ab49.5 ab49.7 a
50%N + AZ5.5 bcd5.7 bc4.5 g7.7 g50.7 a50.6 a36.7 bc35.4 b9.2 de9.3 bcd42.7 c43.1 c
25%N + AZ4.5 ef4.6 d4.4 g4.5 g50.6 a50.5 a29.2 d28.1 c8.5 e8.7 cd37.9 d38.7 d
Azotobacter4.2 gf4.5 d4.3 g4.4 g49.6 a50.2 a27.9 d27.7 c8.33 e8.50 d37.89 d38.26 d
Different lowercase letters on error bars indicate statistically significant differences between treatments (p ≤ 0.05), as performed by the least significant difference (Fisher’s LSD) test. GY, Grain yield (ton/ha); SY, Straw yield (ton/ha); HI, Harvest index%; TGW, 1000-grain weight (g); PC, Protein content%; CC, Chlorophyll content (SPAD).
Table 6. Correlation coefficients among 12 studied traits under different cultivars and fertilizers combinations.
PHNTMNSSBYGYSYHITGWPCDTHSL
NTM0.97 ***
NSS0.98 ***0.92 ***
BY0.99 ***0.96 ***0.97 ***
GY0.54 *0.50 ns0.60 *0.47 ns
SY0.82 ***0.82 ***0.77 ***0.87 ***−0.02
HI−0.32 ns−0.33 ns−0.25 ns−0.4 ns0.61 *−0.79 ***
TGW0.68 **0.60 *0.75 **0.62 *0.94 ***0.17 ns0.41 ns
PC0.59 *0.53 *0.64 **0.52 *0.95 ***0.05 ns0.49 ns0.97 ***
DH0.99 ***0.98 ***0.96 ***0.98 ***0.49 ns0.85 ***−0.36 ns0.61 *0.52 *
SL0.94 ***0.86 ***0.97 ***0.93 ***0.53 *0.77 **−0.31 ns0.69 **0.59 *0.92 ***
CC0.83 ***0.85 ***0.82 ***0.79 ***0.76 **0.46 ns0.07 ns0.83 ***0.85 ***0.79 ***0.73 **
ns, *, **, *** indicate not significant, significant at 5% (p ≤ 0.05), significant at 1% (p ≤ 0.01) and significant at 0.1% (p ≤ 0.001) probability level, respectively. PH. Plant height (cm); NTM, No. tillers m−2; NSS, No. spikelets/spike; SL, Spike length (cm); BY, Biological yield(ton/ha); GY, Grain yield (ton/ha); SY, Straw yield (ton/ha); HI, Harvest index%; TGW, 1000-grain weight (g); PC, Protein content%; DTH, days to 50% heading; CC, Chlorophyll content (SPAD).
Publisher’s Note: MDPI stays neutral with regard to jurisdictional claims in published maps and institutional affiliations.

