
Does Digital Transformation in Manufacturing Affect Trade Imbalances? Evidence from US–China Trade

Abstract
:1. Introduction
2. Methods
2.1. Sample and Data Collection
2.2. Measures
2.2.1. Digital Transformation in Manufacturing (DTM)
2.2.2. Other Variables
2.3. Estimation Methods
3. Results
3.1. Main Results
3.2. Robustness Test
3.3. IV Estimation
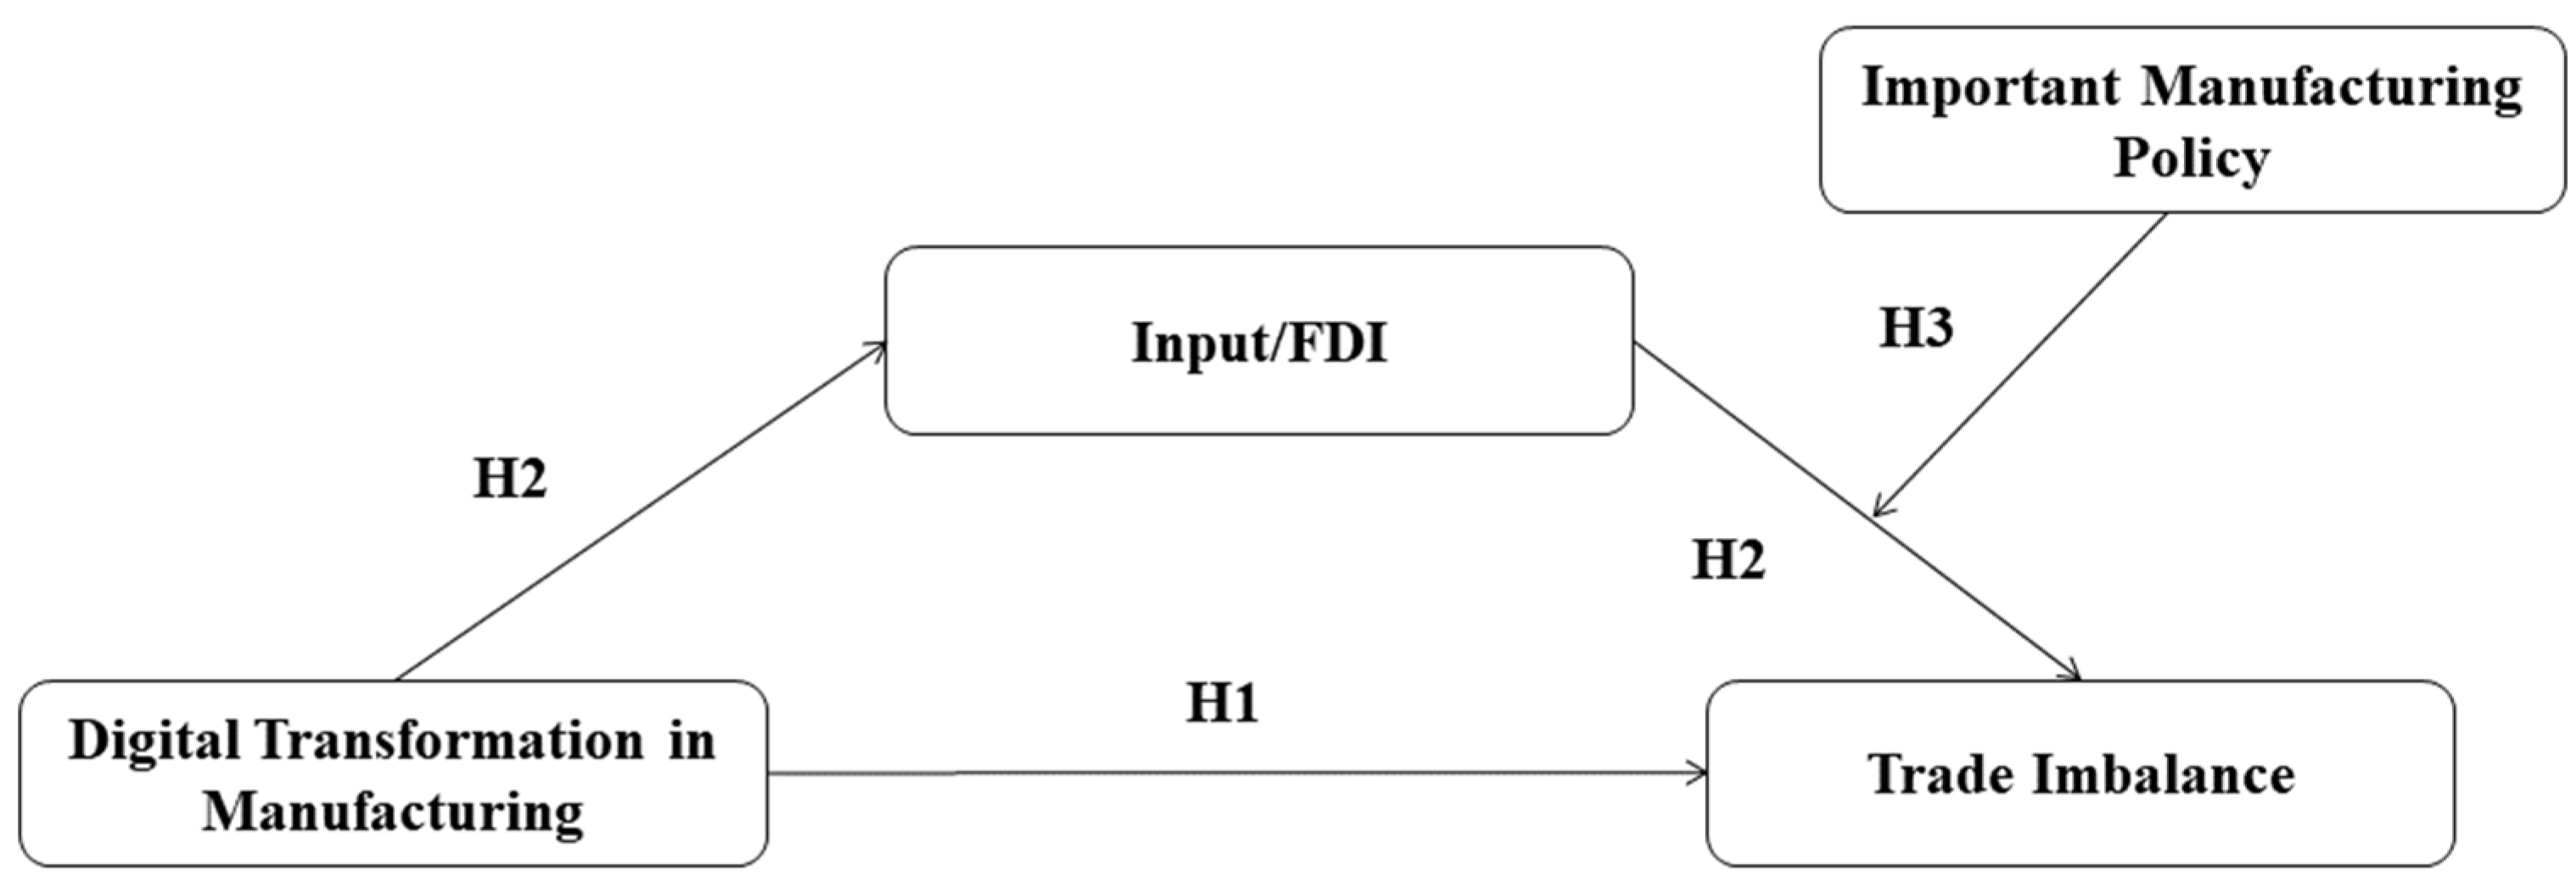
4. Mechanism
4.1. Mediation Analysis
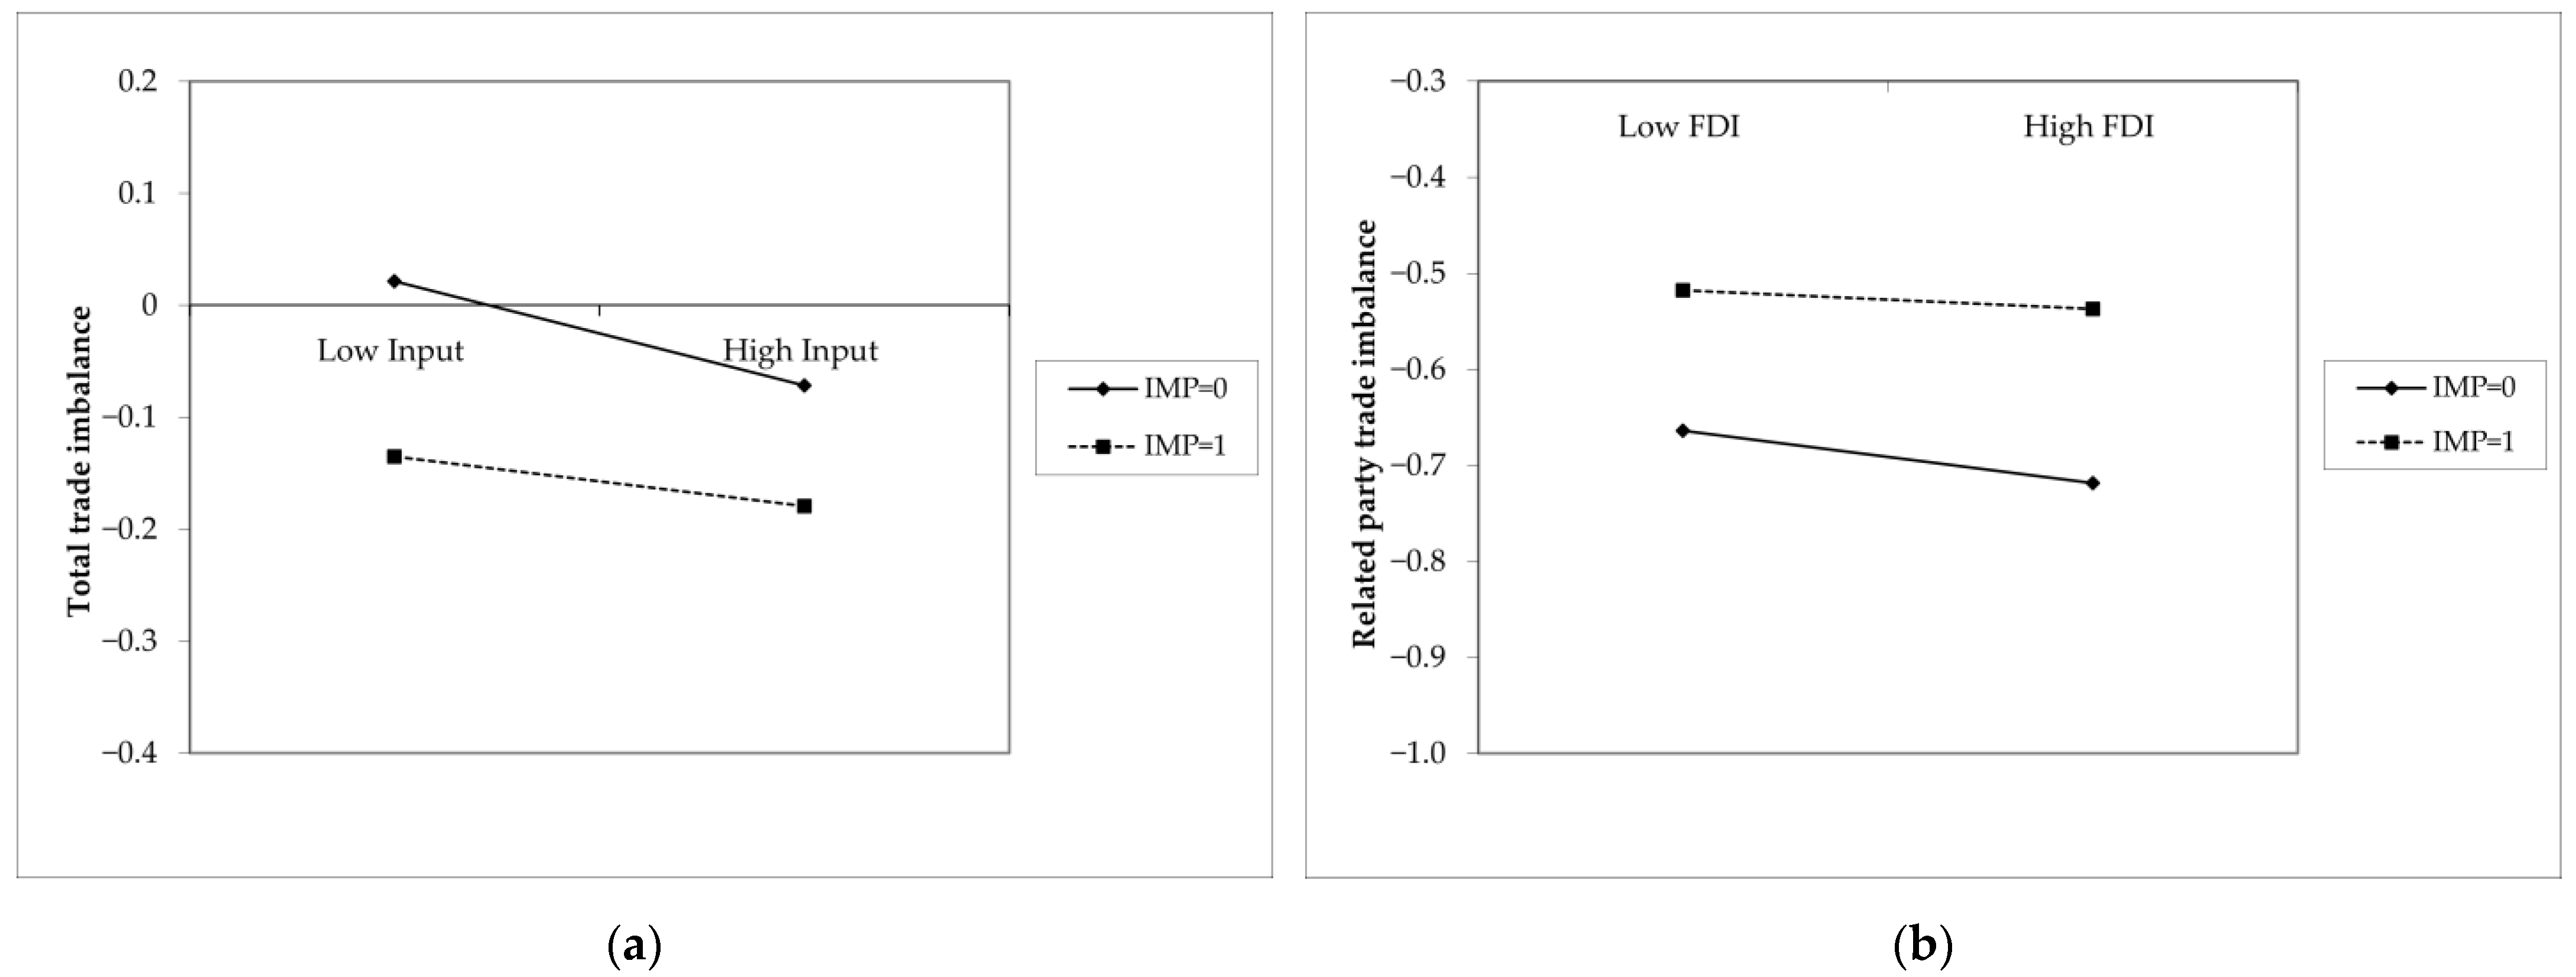
4.2. Moderated Mediation Effect
5. Conclusions and Discussion
5.1. Conclusions
5.2. Limitations and Implications for Future Research
Author Contributions
Funding
Institutional Review Board Statement
Informed Consent Statement
Data Availability Statement
Conflicts of Interest
References
- Gal, P.; Nicoletti, G.; Renault, T.; Sorbe, S.; Timiliotis, C. Digitalisation and Productivity: In Search of the Holy Grail—Firm-Level Empirical Evidence from EU Countries; OECD: Paris, France, 2019. [Google Scholar]
- UN. The Impact of Digital Technologies. Available online: https://www.un.org/en/un75/impact-digital-technologies (accessed on 20 May 2022).
- Feroz, A.K.; Zo, H.; Chiravuri, A. Digital Transformation and Environmental Sustainability: A Review and Research Agenda. Sustainability 2021, 13, 1530. [Google Scholar] [CrossRef]
- Matt, C.; Hess, T.; Benlian, A. Digital Transformation Strategies. Bus. Inf. Syst. Eng. 2015, 57, 339–343. [Google Scholar] [CrossRef]
- Vial, G. Understanding Digital Transformation: A Review and a Research Agenda. J. Strateg. Inf. Syst. 2019, 28, 118–144. [Google Scholar] [CrossRef]
- Hanelt, A.; Bohnsack, R.; Marz, D.; Antunes Marante, C. A Systematic Review of the Literature on Digital Transformation: Insights and Implications for Strategy and Organizational Change. J. Manag. Stud. 2021, 58, 1159–1197. [Google Scholar] [CrossRef]
- Ghobakhloo, M.; Fathi, M. Industry 4.0 and Opportunities for Energy Sustainability. J. Clean. Prod. 2021, 295, 126427. [Google Scholar] [CrossRef]
- Delaram, J.; Houshamand, M.; Ashtiani, F.; Fatahi Valilai, O. A Utility-Based Matching Mechanism for Stable and Optimal Resource Allocation in Cloud Manufacturing Platforms Using Deferred Acceptance Algorithm. J. Manuf. Syst. 2021, 60, 569–584. [Google Scholar] [CrossRef]
- Guo, L.; Xu, L. The Effects of Digital Transformation on Firm Performance: Evidence from China’s Manufacturing Sector. Sustainability 2021, 13, 12844. [Google Scholar] [CrossRef]
- Wang, X.; Gu, Y.; Ahmad, M.; Xue, C. The Impact of Digital Capability on Manufacturing Company Performance. Sustainability 2022, 14, 6214. [Google Scholar] [CrossRef]
- Li, L.; Ye, F.; Zhan, Y.; Kumar, A.; Schiavone, F.; Li, Y. Unraveling the Performance Puzzle of Digitalization: Evidence from Manufacturing Firms. J. Bus. Res. 2022, 149, 54–64. [Google Scholar] [CrossRef]
- Oztemel, E.; Gursev, S. Literature Review of Industry 4.0 and Related Technologies. J. Intell. Manuf. 2020, 31, 127–182. [Google Scholar] [CrossRef]
- Sun, Y.; Li, L.; Shi, H.; Chong, D. The Transformation and Upgrade of China’s Manufacturing Industry in Industry 4.0 Era. Syst. Res. Behav. Sci. 2020, 37, 734–740. [Google Scholar] [CrossRef]
- Freund, C.L.; Weinhold, D. The Effect of the Internet on International Trade. J. Int. Econ. 2004, 62, 171–189. [Google Scholar] [CrossRef] [Green Version]
- Liu, L.; Nath, H.K. Information and Communications Technology and Trade in Emerging Market Economies. Emerg. Mark. Financ. Trade 2013, 49, 67–87. [Google Scholar] [CrossRef]
- Wang, Y.; Li, J. ICT’s Effect on Trade: Perspective of Comparative Advantage. Econ. Lett. 2017, 155, 96–99. [Google Scholar] [CrossRef]
- Shen, J.H.; Long, Z.; Lee, C.-C.; Zhang, J. Comparative Advantage, Endowment Structure, and Trade Imbalances. Struct. Chang. Econ. Dyn. 2022, 60, 365–375. [Google Scholar] [CrossRef]
- Chiu, Y.-B.; Lee, C.-C.; Sun, C.-H. The U.S. Trade Imbalance and Real Exchange Rate: An Application of the Heterogeneous Panel Cointegration Method. Econ. Model. 2010, 27, 705–716. [Google Scholar] [CrossRef]
- Cheung, C.; Furceri, D.; Rusticelli, E. Structural and Cyclical Factors behind Current Account Balances. Rev. Int. Econ. 2013, 21, 923–944. [Google Scholar] [CrossRef]
- Kim, M.H. The U.S.–China Trade Deficit. Int. Trade J. 2014, 28, 65–83. [Google Scholar] [CrossRef]
- Yilmazkuday, H. Accounting for Trade Deficits. J. Int. Money Financ. 2021, 115, 102385. [Google Scholar] [CrossRef]
- FORT, T.C. Technology and Production Fragmentation: Domestic versus Foreign Sourcing. Rev. Econ. Stud. 2017, 84, 650–687. [Google Scholar]
- Hwang, C.-L.; Yoon, K. (Eds.) Methods for Multiple Attribute Decision Making. In Multiple Attribute Decision Making: Methods and Applications A State-of-the-Art Survey; Lecture Notes in Economics and Mathematical Systems; Springer: Berlin/Heidelberg, Germany, 1981; pp. 58–191. ISBN 978-3-642-48318-9. [Google Scholar]
- Zavadskas, E.K.; Mardani, A.; Turskis, Z.; Jusoh, A.; Nor, K.M. Development of TOPSIS Method to Solve Complicated Decision-Making Problems—An Overview on Developments from 2000 to 2015. Int. J. Inf. Technol. Decis. Mak. 2016, 15, 645–682. [Google Scholar] [CrossRef]
- Li, Y.; Yang, J.; Wen, J. Entropy-Based Redundancy Analysis and Information Screening. Digit. Commun. Netw. 2021; in press. [Google Scholar] [CrossRef]
- Markusen, J.R.; Venables, A.J. Multinational Firms and the New Trade Theory. J. Int. Econ. 1998, 46, 183–203. [Google Scholar] [CrossRef] [Green Version]
- Bernard, A.B.; Jensen, J.B.; Schott, P.K. Importers, Exporters, and Multinationals: A Portrait of Firms in the U.S. That Trade Goods; Working Paper Series; National Bureau of Economic Research: Cambridge, MA, USA, 2005. [Google Scholar]
- Egger, H.; Egger, P.; Greenaway, D. Intra-Industry Trade with Multinational Firms. Eur. Econ. Rev. 2007, 51, 1959–1984. [Google Scholar] [CrossRef] [Green Version]
- Antràs, P.; Yeaple, S.R. Chapter 2—Multinational Firms and the Structure of International Trade. In Handbook of International Economics; Gopinath, G., Helpman, E., Rogoff, K., Eds.; Elsevier: Amsterdam, The Netherlands, 2014; Volume 4, pp. 55–130. [Google Scholar]
- Ruhl, K.J. How Well Is US Intrafirm Trade Measured? Am. Econ. Rev. 2015, 105, 524–529. [Google Scholar] [CrossRef] [Green Version]
- Xu, Y.; Lin, G.; Sun, H. Accounting for the China–US Trade Imbalance: An Ownership-Based Approach. Rev. Int. Econ. 2010, 18, 540–551. [Google Scholar] [CrossRef]
- Sato, K.; Shimizu, J.; Shrestha, N.; Zhang, S. Industry-Specific Exchange Rate Volatility and Intermediate Goods Trade in Asia. Scott. J. Polit. Econ. 2016, 63, 89–109. [Google Scholar] [CrossRef] [Green Version]
- Markusen, J.R.; Maskus, K.E. Discriminating Among Alternative Theories of the Multinational Enterprise. Rev. Int. Econ. 2002, 10, 694–707. [Google Scholar] [CrossRef]
- Barattieri, A. Comparative Advantage, Service Trade, and Global Imbalances. J. Int. Econ. 2014, 92, 1–13. [Google Scholar] [CrossRef] [Green Version]
- Song, E.Y.; Zhao, C. Does Specialization Matter for Trade Imbalance at Industry Level? East Asian Econ. Rev. 2012, 16, 227–247. [Google Scholar] [CrossRef]
- Clark, D.P. Intra-Industry Specialization in United States–China Trade. Int. Trade J. 2013, 27, 225–242. [Google Scholar] [CrossRef]
- Buchinsky, M. Estimating the Asymptotic Covariance Matrix for Quantile Regression Models a Monte Carlo Study. J. Econom. 1995, 68, 303–338. [Google Scholar] [CrossRef]
- Tomlin, B.; Fung, L. The Effect of Exchange Rate Movements on Heterogeneous Plants: A Quantile Regression Analysis; Bank of Canada: Ottawa, ON, Canada, 2010. [Google Scholar]
- Gebka, B.; Wohar, M.E. Causality between Trading Volume and Returns: Evidence from Quantile Regressions. Int. Rev. Econ. Finance 2013, 27, 144–159. [Google Scholar] [CrossRef]
- Fordham, B.O.; Kleinberg, K.B. International Trade and US Relations with China. Foreign Policy Anal. 2011, 7, 217–236. [Google Scholar] [CrossRef]
- Wu, D.; Zhu, S.; Memon, A.A.; Memon, H. Financial Attributes, Environmental Performance, and Environmental Disclosure in China. Int. J. Environ. Res. Public. Health 2020, 17, 8796. [Google Scholar] [CrossRef]
- Wu, D.; Memon, H. Public Pressure, Environmental Policy Uncertainty, and Enterprises’ Environmental Information Disclosure. Sustainability 2022, 14, 6948. [Google Scholar] [CrossRef]
- Zhao, Y.; Liu, X.; Wang, S.; Ge, Y. Energy Relations between China and the Countries along the Belt and Road: An Analysis of the Distribution of Energy Resources and Interdependence Relationships. Renew. Sustain. Energy Rev. 2019, 107, 133–144. [Google Scholar] [CrossRef]
- Johnson, R.C.; Noguera, G. Accounting for Intermediates: Production Sharing and Trade in Value Added. J. Int. Econ. 2012, 86, 224–236. [Google Scholar] [CrossRef] [Green Version]
- Ahn, J.; Khandelwal, A.K.; Wei, S.-J. The Role of Intermediaries in Facilitating Trade. J. Int. Econ. 2011, 84, 73–85. [Google Scholar] [CrossRef] [Green Version]
- Bas, M.; Strauss-Kahn, V. Does Importing More Inputs Raise Exports? Firm-Level Evidence from France. Rev. World Econ. 2014, 150, 241–275. [Google Scholar] [CrossRef] [Green Version]
- Halpern, L.; Koren, M.; Szeidl, A. Imported Inputs and Productivity. Am. Econ. Rev. 2015, 105, 3660–3703. [Google Scholar] [CrossRef] [Green Version]
- Goldberg, P.K.; Khandelwal, A.K.; Pavcnik, N.; Topalova, P. Imported Intermediate Inputs and Domestic Product Growth: Evidence from India. Q. J. Econ. 2010, 125, 1727–1767. [Google Scholar] [CrossRef]
- Liu, Q.; Qiu, L.D. Intermediate Input Imports and Innovations: Evidence from Chinese Firms’ Patent Filings. J. Int. Econ. 2016, 103, 166–183. [Google Scholar] [CrossRef]
- Xu, J.; Mao, Q. On the Relationship between Intermediate Input Imports and Export Quality in China. Econ. Transit. Inst. Chang. 2018, 26, 429–467. [Google Scholar] [CrossRef]
- Schumacher, S.; Bildstein, A.; Bauernhansl, T. The Impact of the Digital Transformation on Lean Production Systems. Procedia CIRP 2020, 93, 783–788. [Google Scholar] [CrossRef]
- Zhang, T.; Shi, Z.-Z.; Shi, Y.-R.; Chen, N.-J. Enterprise Digital Transformation and Production Efficiency: Mechanism Analysis and Empirical Research. Econ. Res.-Ekon. Istraživanja 2021, 2021, 1–12. [Google Scholar] [CrossRef]
- Pantulu, J.; Poon, J.P.H. Foreign Direct Investment and International Trade: Evidence from the US and Japan. J. Econ. Geogr. 2003, 3, 241–259. [Google Scholar] [CrossRef]
- Martínez-San Román, V.; Bengoa, M.; Sánchez-Robles, B. Foreign Direct Investment, Trade Integration and the Home Bias: Evidence from the European Union. Empir. Econ. 2016, 50, 197–229. [Google Scholar] [CrossRef]
- Maza, A.; Gutiérrez-Portilla, P. Outward FDI and Exports Relation: A Heterogeneous Panel Approach Dealing with Cross-Sectional Dependence. Int. Econ. 2022, 170, 174–189. [Google Scholar] [CrossRef]
- Co, C.Y. Intra- and Inter-Firm US Trade. Int. Rev. Econ. Financ. 2010, 19, 260–277. [Google Scholar] [CrossRef]
- Wang, J.-Y.; Blomström, M. Foreign Investment and Technology Transfer: A Simple Model. Eur. Econ. Rev. 1992, 36, 137–155. [Google Scholar] [CrossRef]
- Ketteni, E.; Kottaridi, C.; Mamuneas, T.P. Information and Communication Technology and Foreign Direct Investment: Interactions and Contributions to Economic Growth. Empir. Econ. 2015, 48, 1525–1539. [Google Scholar] [CrossRef]
- Newman, C.; Rand, J.; Talbot, T.; Tarp, F. Technology Transfers, Foreign Investment and Productivity Spillovers. Eur. Econ. Rev. 2015, 76, 168–187. [Google Scholar] [CrossRef] [Green Version]
- Razzaq, A.; An, H.; Delpachitra, S. Does Technology Gap Increase FDI Spillovers on Productivity Growth? Evidence from Chinese Outward FDI in Belt and Road Host Countries. Technol. Forecast. Soc. Chang. 2021, 172, 121050. [Google Scholar] [CrossRef]
- Vujanović, N.; Radošević, S.; Stojčić, N.; Hisarciklilar, M.; Hashi, I. FDI Spillover Effects on Innovation Activities of Knowledge Using and Knowledge Creating Firms: Evidence from an Emerging Economy. Technovation 2022, 118, 102512. [Google Scholar] [CrossRef]
- Sobel, M.E. Asymptotic Confidence Intervals for Indirect Effects in Structural Equation Models. Sociol. Methodol. 1982, 13, 290–312. [Google Scholar] [CrossRef]
- Aghion, P.; Cai, J.; Dewatripont, M.; Du, L.; Harrison, A.; Legros, P. Industrial Policy and Competition. Am. Econ. J. Macroecon. 2015, 7, 1–32. [Google Scholar] [CrossRef] [Green Version]
- Landesmann, M.A.; Stöllinger, R. Structural Change, Trade and Global Production Networks: An ‘Appropriate Industrial Policy’ for Peripheral and Catching-up Economies. Struct. Chang. Econ. Dyn. 2019, 48, 7–23. [Google Scholar] [CrossRef]
- Mao, J.; Tang, S.; Xiao, Z.; Zhi, Q. Industrial Policy Intensity, Technological Change, and Productivity Growth: Evidence from China. Res. Policy 2021, 50, 104287. [Google Scholar] [CrossRef]
- Du, L.; Harrison, A.; Jefferson, G. FDI Spillovers and Industrial Policy: The Role of Tariffs and Tax Holidays. World Dev. 2014, 64, 366–383. [Google Scholar] [CrossRef] [Green Version]

| Indicator | Variable | Source | Attribute |
|---|---|---|---|
| Hardware | Capital expenditures for computers and peripheral data-processing equipment (CP) | ASM | Positive |
| Expense on computer hardware and other equipment (CH) | ASM | Positive | |
| Service | Expense on purchases of software (PS) | ASM | Positive |
| Expense on data processing and other purchased computer services (DP) | ASM | Positive | |
| Expense on communication services (CS) | ASM | Positive | |
| Expense on purchased professional and technical services (TS) | ASM | Positive | |
| Expense on taxes and license fees (TL) | ASM | Positive | |
| Research | Numbers of patent applications (PAT) | WIPO | Positive |
| Total business enterprises R&D (RD) | OECD | Positive |
| Variables | (1) | (2) | (3) | (4) |
|---|---|---|---|---|
| Tot | Rel | |||
| DTM | 0.0210 *** | 0.0219 *** | −0.1766 *** | −0.1492 *** |
| (3.2592) | (2.6258) | (−5.0039) | (−3.2829) | |
| Wage | 0.0045 *** | −0.0004 | ||
| (7.6079) | (−0.1362) | |||
| Vadd | 0.0000 *** | 0.0000 *** | ||
| (5.3824) | (3.1440) | |||
| Invest | −0.0378 *** | −0.1006 *** | ||
| (−5.5236) | (−2.6954) | |||
| Matcost | −0.0064 *** | −0.0048 | ||
| (−4.5662) | (−0.6281) | |||
| TFP | 0.0182 | 0.2763 *** | ||
| (1.1088) | (3.0890) | |||
| Income | −0.0001 ** | −0.0002 | ||
| (−2.0271) | (−0.5798) | |||
| Tariff | −0.0343 | −0.5676 *** | ||
| (−1.4276) | (−4.3331) | |||
| RER | −0.0163 | 0.0078 | ||
| (−0.8407) | (0.0738) | |||
| Constant | 0.0780 *** | 0.3475 | −0.4619 *** | −0.1222 |
| (3.8276) | (1.5086) | (−4.1463) | (−0.0972) | |
| Industry-fixed effects | Yes | Yes | Yes | Yes |
| Time-fixed effects | Yes | Yes | Yes | Yes |
| N | 3256 | 1990 | 3256 | 1990 |
| adj. R2 | 0.2130 | 0.2690 | 0.1650 | 0.1600 |
| Variables | (1) | (2) | (3) | (4) | (5) | (6) |
|---|---|---|---|---|---|---|
| q = 0.25 | q = 0.50 | q = 0.75 | q = 0.25 | q = 0.50 | q = 0.75 | |
| Tot | Rel | |||||
| DTM | 0.0080 * | 0.0029 * | 0.0024 * | −0.0813 *** | −0.0146 *** | −0.0049 *** |
| (1.8641) | (1.7485) | (1.8601) | (−11.2217) | (−14.6142) | (−7.7151) | |
| Controls | Yes | Yes | Yes | Yes | Yes | Yes |
| Constant | 0.1167 | 0.1070 *** | 0.0637 *** | −0.9615 *** | −0.1777 *** | −0.0837 *** |
| (1.5397) | (3.2872) | (2.7870) | (−10.9891) | (−25.0885) | (−9.7537) | |
| Industry-fixed effects | Yes | Yes | Yes | Yes | Yes | Yes |
| Time-fixed effects | Yes | Yes | Yes | Yes | Yes | Yes |
| N | 2518 | 2518 | 2518 | 2518 | 2518 | 2518 |
| Variables | (1) | (2) | (3) | (4) |
|---|---|---|---|---|
| Tot | Rel | |||
| DTM | 0.0226 *** | 0.0238 ** | −0.1468 *** | −0.1847 *** |
| (2.6853) | (2.4373) | (−3.1929) | (−3.3140) | |
| Controls | Yes | Yes | Yes | Yes |
| Constant | 0.3498 | 0.2143 | −0.1103 | −0.0044 |
| (1.5186) | (0.7274) | (−0.0878) | (−0.0026) | |
| Industry-fixed effects | Yes | Yes | Yes | Yes |
| Time-fixed effects | Yes | Yes | Yes | Yes |
| N | 1990 | 1576 | 1990 | 1576 |
| adj. R2 | 0.2690 | 0.2820 | 0.1600 | 0.1680 |
| Variables | (1) | (2) | (3) | (4) |
|---|---|---|---|---|
| Tot | Rel | |||
| DTM | 0.0203 ** | 0.0222 *** | −0.1814 *** | −0.1464 *** |
| (2.4304) | (2.6678) | (−3.5198) | (−3.2225) | |
| TR | 0.0001 *** | 0.0000 | ||
| (4.1709) | (0.4630) | |||
| DI | 0.0162 | 0.1334 ** | ||
| (1.5843) | (2.3895) | |||
| Controls | Yes | Yes | Yes | Yes |
| Constant | 0.2961 | 0.2234 | 0.2930 | −1.1424 |
| (1.2782) | (0.9185) | (0.2085) | (−0.8617) | |
| Industry-fixed effects | Yes | Yes | Yes | Yes |
| Time-fixed effects | Yes | Yes | Yes | Yes |
| N | 1973 | 1990 | 1792 | 1990 |
| adj. R2 | 0.2760 | 0.2690 | 0.1670 | 0.1620 |
| Variables | (1) | (2) | (3) | (4) |
|---|---|---|---|---|
| Tot | Rel | |||
| Lag | Elec | Lag | Elec | |
| DTM | 0.0191 ** | 0.1002 ** | −0.1687 *** | −0.3188 ** |
| (2.2196) | (2.3713) | (−3.3398) | (−2.0635) | |
| Controls | 0.0154 | 0.2641 ** | −0.2174 | −0.7120 |
| Constant | (0.5153) | (2.0181) | (−1.0560) | (−1.3745) |
| 1896.16 *** | 80.02 *** | 1687.31 *** | 168.50 *** | |
| LM statistic | 8601.94 *** | 81.57 *** | 6818.09 *** | 177.83 *** |
| Wald F statistic | 0.0191 ** | 0.1002 ** | −0.1687 *** | −0.3188 ** |
| Industry-fixed effects | Yes | Yes | Yes | Yes |
| Time-fixed effects | Yes | Yes | Yes | Yes |
| N | 2423 | 2511 | 2232 | 2635 |
| adj. R2 | 0.2580 | 0.2170 | 0.1590 | 0.1590 |
| Variables | (1) | (2) | (3) | (4) |
|---|---|---|---|---|
| Input | FDI | Tot | Rel | |
| DTM | 0.2722 *** | 0.5900 *** | 0.0327 *** | −0.1851 *** |
| (9.7637) | (14.9678) | (5.9721) | (−6.4035) | |
| Input | −0.0606 *** | |||
| (−14.9514) | ||||
| FDI | −0.0312 ** | |||
| (−2.1179) | ||||
| Controls | Yes | Yes | Yes | Yes |
| Constant | −2.5667 *** | 5.8301 *** | −0.4628 *** | −0.7068 *** |
| (−14.4114) | (23.1485) | (−12.9209) | (−3.6071) | |
| Industry-fixed effects | Yes | Yes | Yes | Yes |
| Time-fixed effects | Yes | Yes | Yes | Yes |
| N | 2423 | 2511 | 2232 | 2635 |
| adj. R2 | 0.2580 | 0.2170 | 0.1590 | 0.1590 |
| Variables | Level | Indirect Effect | SE | LL 95% CI | UL 95% CI |
|---|---|---|---|---|---|
| Input | IMP = 0 | −0.0316 *** | 0.0032 | −0.0385 | −0.0255 |
| Input | IMP = 1 | −0.0150 *** | 0.0033 | −0.0217 | −0.0089 |
| FDI | IMP = 0 | −0.0119 *** | 0.0041 | −0.0202 | −0.0039 |
| FDI | IMP = 1 | −0.0043 | 0.0052 | −0.0158 | 0.0057 |
Publisher’s Note: MDPI stays neutral with regard to jurisdictional claims in published maps and institutional affiliations. |
© 2022 by the authors. Licensee MDPI, Basel, Switzerland. This article is an open access article distributed under the terms and conditions of the Creative Commons Attribution (CC BY) license (https://creativecommons.org/licenses/by/4.0/).
Share and Cite
Zu, W.; Gu, G.; Lei, S. Does Digital Transformation in Manufacturing Affect Trade Imbalances? Evidence from US–China Trade. Sustainability 2022, 14, 8381. https://doi.org/10.3390/su14148381
Zu W, Gu G, Lei S. Does Digital Transformation in Manufacturing Affect Trade Imbalances? Evidence from US–China Trade. Sustainability. 2022; 14(14):8381. https://doi.org/10.3390/su14148381
Chicago/Turabian StyleZu, Wenjing, Guoda Gu, and Sihan Lei. 2022. "Does Digital Transformation in Manufacturing Affect Trade Imbalances? Evidence from US–China Trade" Sustainability 14, no. 14: 8381. https://doi.org/10.3390/su14148381