Article

Impact of Canal Encroachment on Flood and Economic Vulnerability in Northern Bangladesh

by
Arifa Yasmin Mukta
1,
Md. Emdadul Haque
1,
Abu Reza Md. Towfiqul Islam
1,
Md. Abdul Fattah
2,
Williamson Gustave
3,
Hussein Almohamad
4,5,*,
Ahmed Abdullah Al Dughairi
4,
Motrih Al-Mutiry
6 and
Hazem Ghassan Abdo
7,8,9
1
Department of Disaster Management, Begum Rokeya University, Rangpur 5400, Bangladesh
2
Department of Urban and Regional Planning, Khulna University of Engineering and Technology, Khulna 9203, Bangladesh
3
School of Chemistry, Environmental & Life Sciences, University of the Bahamas, Nassau 4912, Bahamas
4
Department of Geography, College of Arabic Language and Social Studies, Qassim University, Buraydah 51452, Saudi Arabia
5
Department of Geography, Justus Liebig University of Giessen, 35390 Giessen, Germany
6
Department of Geography, College of Arts, Princess Nourah bint Abdulrahman University, P.O. Box 84428, Riyadh 11671, Saudi Arabia
7
Geography Department, Faculty of Arts and Humanities, University of Tartous, Tartous P.O. Box 2147, Syria
8
Geography Department, Faculty of Arts and Humanities, Damascus University, Damascus P.O. Box 30621, Syria
9
Geography Department, Arts and Humanities Faculty, Tishreen University, Lattakia P.O. Box 30621, Syria
*
Author to whom correspondence should be addressed.
Sustainability 2022, 14(14), 8341; https://doi.org/10.3390/su14148341
Submission received: 18 May 2022 / Revised: 1 July 2022 / Accepted: 5 July 2022 / Published: 7 July 2022
(This article belongs to the Section Hazards and Sustainability)

Abstract

:
River and canal encroachments have become a common problem in Bangladesh. The prevalence of river and canal encroachments has a direct impact on population growth. However, the impacted population appears to be unaware of its negative consequences. To this end, we aimed to investigate the past and present canal scenarios with a focus on canal encroachment as the influencing factor in Ulipur upazila (highly vulnerable) of northern Bangladesh. To examine the impact of this encroachment, the Flood Vulnerability Index (FVI), Adaptive Capacity Index (ACI) and Economic Vulnerability Index (EVI) were used. Our results showed signs of narrowing of the canal structure of Ulipur upazila in 1982 and 1992, while satellite images from 2002 and 2012 showed the presence of encroachment in the middle and lower parts of the canal. The FVI value for Hatia union was 0.703, indicating that this area was highly vulnerable to flooding. According to the ACI, the Pandul union has a high capacity to cope with flood impact, while the Hatia union has less capacity to cope with flood impact. Conversely, Hatia’s union EVI value was 72.8, denoting a high economic vulnerability. Canal encroachments will have negative consequences for these impacted unions. It is critical to reduce the flooding and economic vulnerabilities associated with canal encroachments. It is found that canal excavation is very important for controlling flood water and reducing the damage caused by flooding.

1. Introduction

Rivers have traditionally been valued largely as water sources for cultivation and electricity. Rivers, on the other hand, provide a greater range of services that benefit the environment and people, as well as economies. Rivers and canals support economies, provide food for communities, contribute to flood regulation, and are considered the world’s most productive ecosystems [1,2,3]. However, in recent years, the river, canal, and wetland areas have been decreasing due to human activities and natural events. The encroachment of rivers and canals increases the risk of flood and economic vulnerability by obstructing natural drainage, degrading water quality, impacting habitat and crop production, and destroying river-based economic activities [4,5,6]. Constructing structures in the flood-prone areas causes a reduction in the flood storage capacity of flood plains, and such practices increase the risks to public safety. Recently, unplanned urbanization, construction activities, damming, and reduction in wetlands along with the encroachment of canals in the northern areas of Bangladesh have increased waterlogging, and various economic and agricultural losses. The impact of such phenomena is expected to worsen due to climate change.
Flooding is a challenge and a serious issue for the development of an area. Lack of drainage infrastructure, inadequate apertures, insufficient water storage, heavy rain, encroachment and obstruction in the drainage system, and backwater effects at outfalls are common causes of urban floods. The expansion of structures, roads, improved routes, railroads, utilities and other developments in natural regions such as river corridors, floodplains, lakes, wetlands, ponds, and the buffer zones around these places, is referred to as encroachment [7,8]. Moreover, encroachment intensifies impervious cover around bodies of water, thus leading to enhanced surface water runoff rate and volume, increased water temperature, sediment, and other pollutant loadings [9]. Canals, also known as river channels, allow or help boats and ships to pass from one body of water to another. Furthermore, canals are useful sources of irrigation water and for other human purposes. The cumulative encroachment of canals that help with water flow during floods, irrigation, and transport of boats and ships can result in a persistent degradation of their services over time [10]. The degree to which natural infiltration has been hampered, as well as the extent of encroachment and cumulative impacts of impermeable cover, can all contribute to the stream channel’s instability. Irrigation facilities are primarily what motivates farmers to excavate numerous canals. It also has a significant impact on the local, regional, and national economies [2,11]. Floods have serious impacts on the economy, livelihood, infrastructure, water supply, and drainage. In addition to preventing flooding and draining water, canals help to improve crop growth and quality and maintain landscapes, especially in areas that receive irregular or seasonal rainfall.
Bangladesh is a land of rivers. The rivers of the country have direct or indirect influences on the people of the country in many ways, like as a source of water for crop cultivation, fish, water transport, recreation, and business. The functional waterways and associated transportation sectors work as strong drivers of Bangladesh economy [12]. Besides rivers, the canals in Bangladesh play an important role in the agricultural sector. Since 2000, Bangladesh’s rural sector, particularly agriculture, has been a significant driver of poverty reduction. Agriculture employs about 50% of all Bangladeshi employees, including 67% of those in rural regions, and about 87% of rural households rely on agriculture for at least part of their income. Due to irregular rainfall and drought events, crop production in many parts of Bangladesh, particularly in the northern part of the country, has been facing a serious problem. In order to sustain agriculture, the farmers in this region depend on canals. However, when the monsoons come, the rain from the Himalayas causes flooding in the north of Bangladesh. Previous studies have identified river and canal encroachment as one of the major causes of monsoon floods in the northern region [13,14,15]. In short, the northern part of Bangladesh has been severely exposed to canal encroachment and its consequences. Moreover, this region is more vulnerable to climate change. Therefore, it is important to investigate the flooding and economic vulnerability caused by canal encroachment. This will enable us to identify the susceptible communities and provide support to the affected communities so that they can protect their livelihoods.
Floods affected about 350 million people around the world in 2016, and the number is expected to double by 2050. From 1988 to 2000, natural and man-made disasters in Central America and Asia caused a lot of damage and cost the economy USD 3.64 trillion. Between 2010 and 2020, nearly 3.6 billion people, or 56% of the world’s total population, were flooded. Balica et al. [16] found that since 2010, 52 countries had lost a total of USD 2 billion in buildings, livestock, and crops due to flooding. The damage caused by floods in Southeast Asia, Africa, and North and South America in one year was more than $5 billion. About 26,000 square km, or 10,000 square miles, or about 18% of Bangladesh, floods every year, killing more than 5000 people and destroying more than seven million homes. When floods are very bad, as they were in 1998, they can affect more than 75% of the country. This amount is 95% of the total amount that comes in each year. Most floods in Bangladesh are caused by unexpected rainfall in the southwestern mountains of India; more tropical storms; riverbeds drying out; and rivers with high discharge that can’t handle the water. The river and canal encroachment are also significantly responsible for flooding in Bangladesh. According to Egwumah et al. [17], establishing settlements along the river bank through river encroachment was responsible for around 30% of the 4000 manatee deaths in the Florida River, USA. Dissanayake [18] reported that the river encroachment in the upper Mahaweli River in Sri Lanka has intensified the stream water extremes and the frequency of flooding during the rainy season. According to Tyagi and Sahoo [19], about 18.33% of agricultural land in Gorakhpur District, Uttar Pradesh, India suffered from conversion due to floodwater resulting from the encroachment of waterbodies. The impacts of the encroachment of country land, rivers, and canals and the various causes have been reported in various prior studies, including [9,20,21,22].
Several variables have been recognized as being responsible for canal encroachment. Recent studies have shown that assessment of the causes and impacts of floods has gained increasing attention. To assess the impacts of climatic change and different natural and man-made events on the local communities, the adaptive capacity index (ACI) can be used to provide a better understanding of the existing condition of the community. The flood vulnerability index (FVI) and ACI have been extensively applied in studies of the impact assessment of floods as well as flood management [23,24,25,26,27]. FVI considers the social, physical, environmental, and economic vulnerability of an area to explore the impacts of flooding. ACI considers the methods for selecting, standardizing, and weighting indicators of events, and is as important as the characteristics of indicators have spatial variability [27]. Although many studies have been conducted to assess the flood vulnerability of rivers [28,29,30] and reservoirs, there is a lack of research using FVI to investigate flood vulnerability due to canal encroachment. Moreover, the integration of FVI and ACI has been less studied in flood vulnerability assessment. Most of the prior studies in Bangladesh focus on climate change vulnerability assessment and a limited number of studies focus on flood risk assessment [31,32,33], and most of them illustrate a result on a large scale (regional or national). A truly microscale assessment integrating FVI, ACI, and economic vulnerability index (EVI) along with remote sensing technologies, is therefore still lacking. To the authors’ knowledge, no other studies have focused on how floods and the economy are affected by canal encroachment.
To fill the prior literature gap, this study intends to: (1) identify the past and present canal scenarios using satellite images; (2) assess the impacts of flooding due to canal encroachment using the integrated FVI and ACI; and (3) investigate the economic vulnerability using the EVI in the northern region of Bangladesh. This study will help policymakers to reduce flood and economic vulnerabilities impacted by channel encroachment and identify the most appropriate course of action.

2. Materials and Methods

2.1. Study Area

Ulipur is the largest upazila of the Kurigram district in northern Bangladesh. Ulipur has one municipality (Ulipur Pourasava), 13 unions, 147 mauzas, and 354 villages. Three rivers (Brahmaputra, Tessta, and Dhorla) along with their distributaries, tributaries, and many canals that pass through Upazila. A big canal named Bamni passes through four unions of Ulipur upazila. The canal is 20.468 km in length. Durgapur union owns 2.17 km of the canal, while Dharanibari union owns 3078 km. On the other hand, Pandul union has 9.33 km and Hatia union has 5.89 km of this canal. In the Hatia union, this canal mixes with the Dhorla River (Figure 1). This canal is now in a vulnerable condition which is now being used for housing, cultivation, and many other purposes. This has led to frequent floods as the rain water is unable to efficiently flow into the river. So, the study area was made up of these four unions in the Ulipur upazila: Durgapur, Dharanibari, Pandul, and Hatia.
Ulipur Upazila is a riverine upazila. The eastern part of the upazila is covered by a river. Some canals are spread throughout the Upazila to maintain the normal flow of water. In this study, we take one canal as a representation of the other canals. By the end of 1981, a 90-foot canal was excavated throughout the four unions of Ulipur upazila to maintain the general flow of water. The purpose of canal excavation was to supply water for agricultural activities and maintain the flow of rainwater. Furthermore, this canal was a major source of different types of fish. The surface water from this canal was also used for crop irrigation, thus reducing the cost of farming in the area. Hence, the canal excavation was beneficial for the people in many aspects (Figure 2).

2.2. Sample Size Determination Technique

Cochran [34] developed an equation to calculate a representative sample for a population using the following Equation (1)
n 0 = z 2 p q e 2 ,
where n0 is the sample size,
z is the selected critical value of desired confidence level,
p is the estimated proportion of an attribute that is present in the population,
q = 1 − p and e is the desired level of precision.
Equation (1) is usable for a large population and unknown variables [26]. In this study, we employed it to calculate the sample size of a large population whose degree of variability is not known. Equation (1) is easy to calculate, and the confidence level is high. Assuming the maximum variability, which is equal to 30% (p = 0.3) and taking 95% confidence level with ±5% precision, the calculation for the required sample size was as follows:
p = 0.3 and hence q = 1 − 0.3 = 0.7; e = 0.05; z = 1.96
Now, n 0 = 1.96 2 × 0.3 × 0.7 0.05 2 = 322.69 = 323.
Therefore, a random sample of 323 households in our target population should be enough to give us the confidence levels we need.

2.3. Canal Scenario Identification Using Satellite Images

The main steps of the canal scenario identification process were image processing, image classifying and canal change detection analyzing. This change detection enabled us to quantify the change and also to analyze the change direction that had occurred over course of the study period.
Landsat satellite images of the years 1982, 1992, 2002, 2012 and 2019 were collected from Bangladesh Space Research and Remote Sensing Organization (SPARSO) and these satellite images were analyzed using ArcGIS 10.5. By analyzing the image, we identified the canal’s past and present conditions and its role in flood protection and its economic importance.

Modified Normalized Difference Water Index (MNDWI)

The Modified Normalized Difference Water Index (MNDWI) was used to identify the water-bodies. It is sensitive to built-up land and thus may result in over-estimated water bodies. NDWI was developed by McFeeters [35] to enhance the water related features of the landscapes. This index uses the near infrared (NIR) and the Short-Wave infrared (SWIR) bands. MNDWI can be calculated by the following Equations (2)–(4)
NDWI = (NIR − SWIR)/(NIR + SWIR).
For Landsat 1 to 7 data,
NDWI = (Band 4 − Band 5)/(Band 4 + Band 5).
For Landsat 8 data,
NDWI = (Band 5 − Band 6)/(Band 5 + Band 6).
However, the pure water neither reflects NIR nor SWIR. Equation (2) of NDWI was then modified by Xu [36]. It uses Green and SWIR bands and is called the Modified Normalized Difference Water Index (MNDWI) by using Equations (5)–(7).
MNDWI = (Green − SWIR)/(Green + SWIR).
For Landsat 1 to 7 data,
NDWI = (Band 2 − Band 5)/(Band 2 + Band 5).
For Landsat 8 data,
NDWI = (Band 3 − Band 6)/(Band 3 + Band 6).

2.4. Flood Impacts Assessment

2.4.1. Flood Vulnerability Index (FVI)

The FVI system may be used as an instrument to connect a multidisciplinary topic with a high number of components in a straight line, as well as to give a good vulnerability evaluation [37,38]. This technique assists decision-makers in controlling potential damage and determining the specific procedures to be followed prior to flooding. The Flood Risk Index may be utilized in flood management action plans and can enhance local decision-making procedures by recommending suitable steps to minimize vulnerability at various geographical levels [24]. To generate data for specified target locations, parameters and indices should be created. Balica [39] introduced the most advanced and reliable method—the “Flood Vulnerability Index (FVI)”—to quantify the vulnerability of floods for an area. The general formula for FVI is calculated by classifying the component into three groups of indicators: exposure®, susceptibility (S) and resilience (R) (Table 1 and Table 2). The general flood vulnerability index (FVI) Equation (8) is as follows-
FVI = Exposure Susceptibility Resilience .
With regard to the indicators, the following Equations (9)–(13) were used to calculate different types of vulnerabilities.
FVI Social = PD CH PG % Disables CM PE A P S WS ER ES
FVI Economic = Ind CC UM UG HDI RD FI AmInv DSc D
FVI Environmental = UG Rainfall EV LU
FVI Physical = CC T EV / Rainfall SC / V   year D
Total FVI = FVISocial + FVIEconomic + FVIEnvironmental + FVIPhysical.
The FVI value ranges between 0 and 1, where higher value (FVI > 0.75) indicates the very high vulnerability to floods [24,39].

2.4.2. Adaptive Capacity Index (ACI)

Adaptive capacity is the ability of a system to change its traits or behavior to broaden its coping range in the face of current or future climatic unpredictability [40]. In practice, adaptive capacity is defined as the ability to create and execute effective adaptation strategies or to respond to emerging hazards and pressures to lessen the probability of their occurrence and/or the number of detrimental effects caused by climate-related hazards [41,42]. The ability to learn from prior experiences to manage with the present climate and to use these lessons in order to cope with future climates, including surprises, is required for the adaptation process. This adaptive capacity index technique is likewise based on Metzger’s [27] European application, which is spatially explicit and quantifiable.
The following adaptive capacity index (ACI) was created using criterion weighting. For this application, the overall adaptive capacity index (ACI) is expressed in the following Equation (14)
ACI = (S.Sw) + (E.Ew) + (In.Inw),
where ACI is the overall ACI (scale of 0–10);
S is the socio-cultural score, Sw is the socio-cultural weighting, E is the economic score, Ew is the economic weighting, In is the institution/infrastructure score, and Inw is the institution/infrastructure weighting.
The ACI was also calculated for each of the three themes. For example, the socio-cultural adaptive capacity was obtained as in Equation (15)
Sw = (Ind1) + (Ind2) + … + (Indn),
where Ind is the weighting of all n measures for an indicator.
Each indicator could have one or more measures. Equation (16) was used to derive the weighting for each indicator:
Ind1 = (M1) + (M2) + …….… + (Mn),
where M is the weighting for a measure of an indicator; all measures on an indicator are equal (Table 3).

2.5. Economic Vulnerability Assessment

The Economic Vulnerability Index (EVI) is calculated by using the number of exposed, homeless people, and unstable agricultural products, shock, and location [43]. Homeless people are calculated by the mean annual percentage of their population. EVI uses a 0–100 scale for interpreting the vulnerability, where 50 is the general vulnerable condition [44]. As the values decrease below, the vulnerability also decreases, and as the values increase above 50, the vulnerability also increases [45]. According to the United Nations Committee for Development Policy (UNCDP) review, the EVI (Economic Vulnerability Index) is a simple arithmetic averaging of exposure and shock indexes. It is preferable to consider giving more emphasis to the impact from the two shocks and exposure indices which is greater [46] that can be expressed in the following Equation (17).
EVI = 0.5 × Exposure + 0.5 × Shock.
The specialization sub-index the simple arithmetic average of the following Equation (18)
Specialization = 0.5 × Export concentration + 0.5 × Share of agriculture, forestry, fisheries in GDP.
The Shock Index is the arithmetic average of natural shock and trade shock sub-indexes by the Equation (19)
Shock = 0.5 × Natural shock + 0.5 × Trade shock.
The natural shock sub-index the arithmetic average of homeless and instability in the agricultural production components that can be calculated by Equation (20)
Natural shock = 0.5 × Homeless + 0.5 × Instability in the agricultural production.
The EVI is an index between 0 and 100, since its components are also measured on a 0 to 100 scale. A high score corresponds to a high level of vulnerability while a low score corresponds to a low level of vulnerability.

3. Results

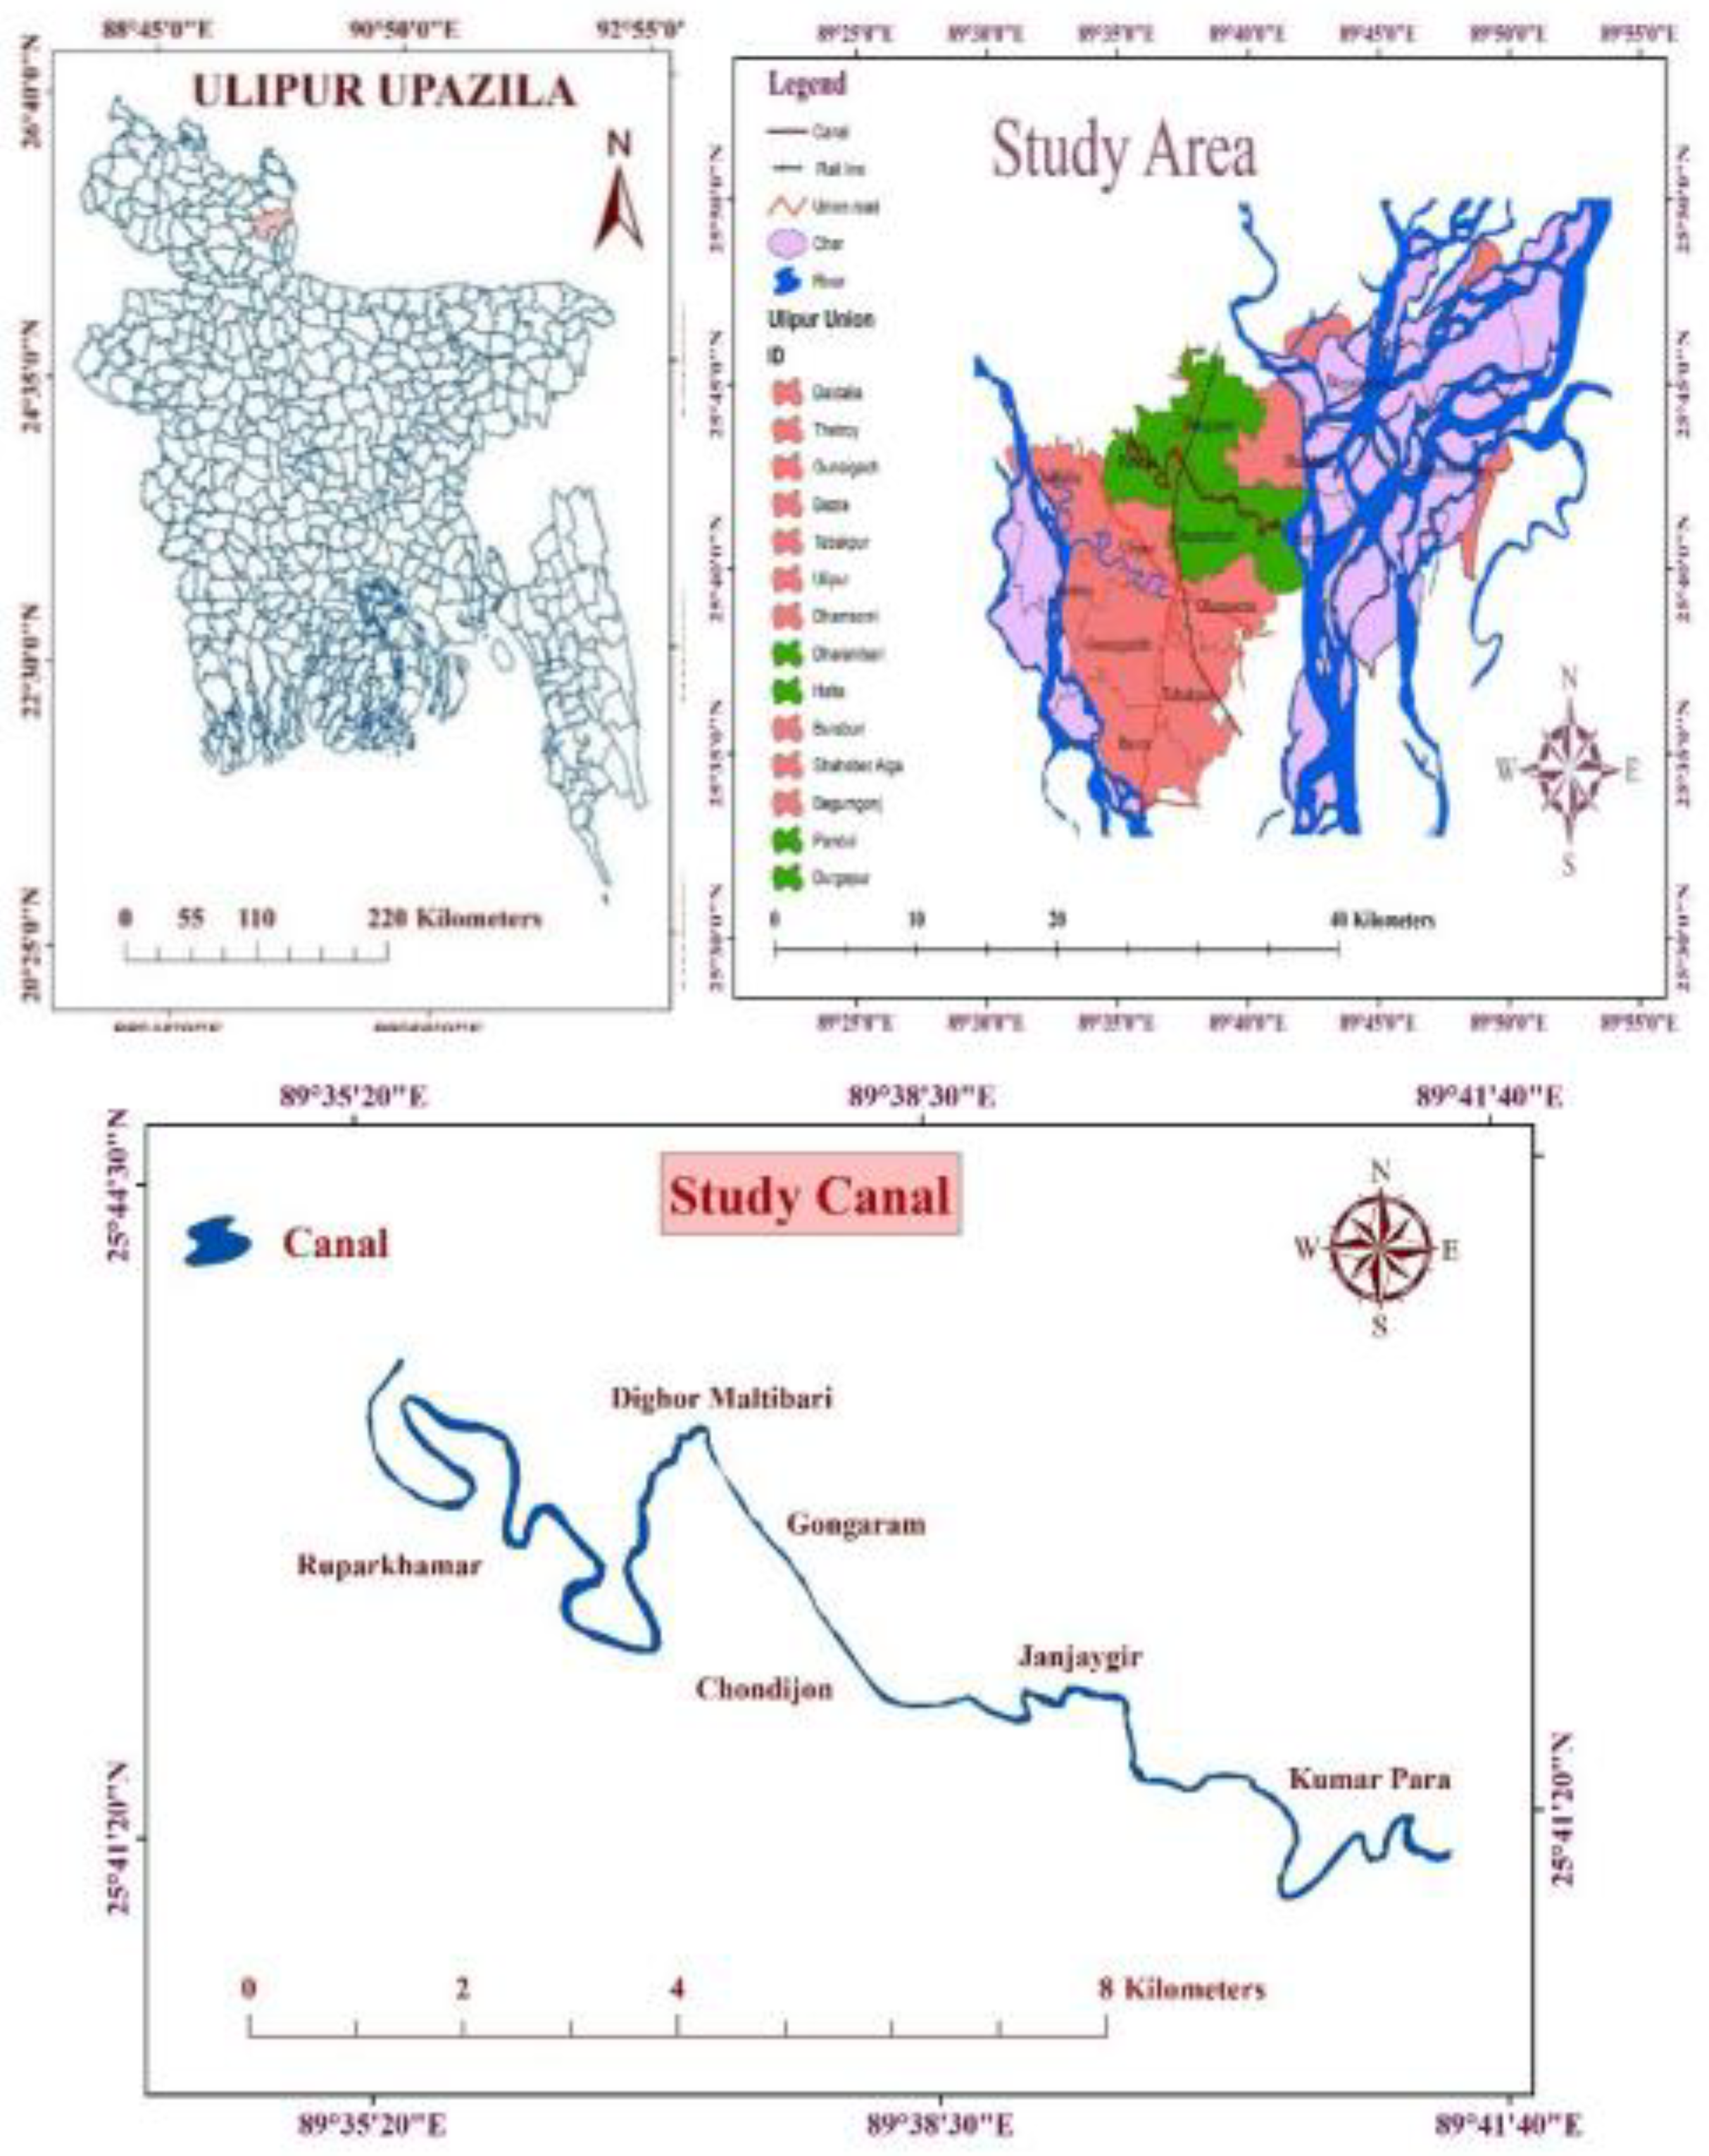
3.1. Past and Present Status Analysis

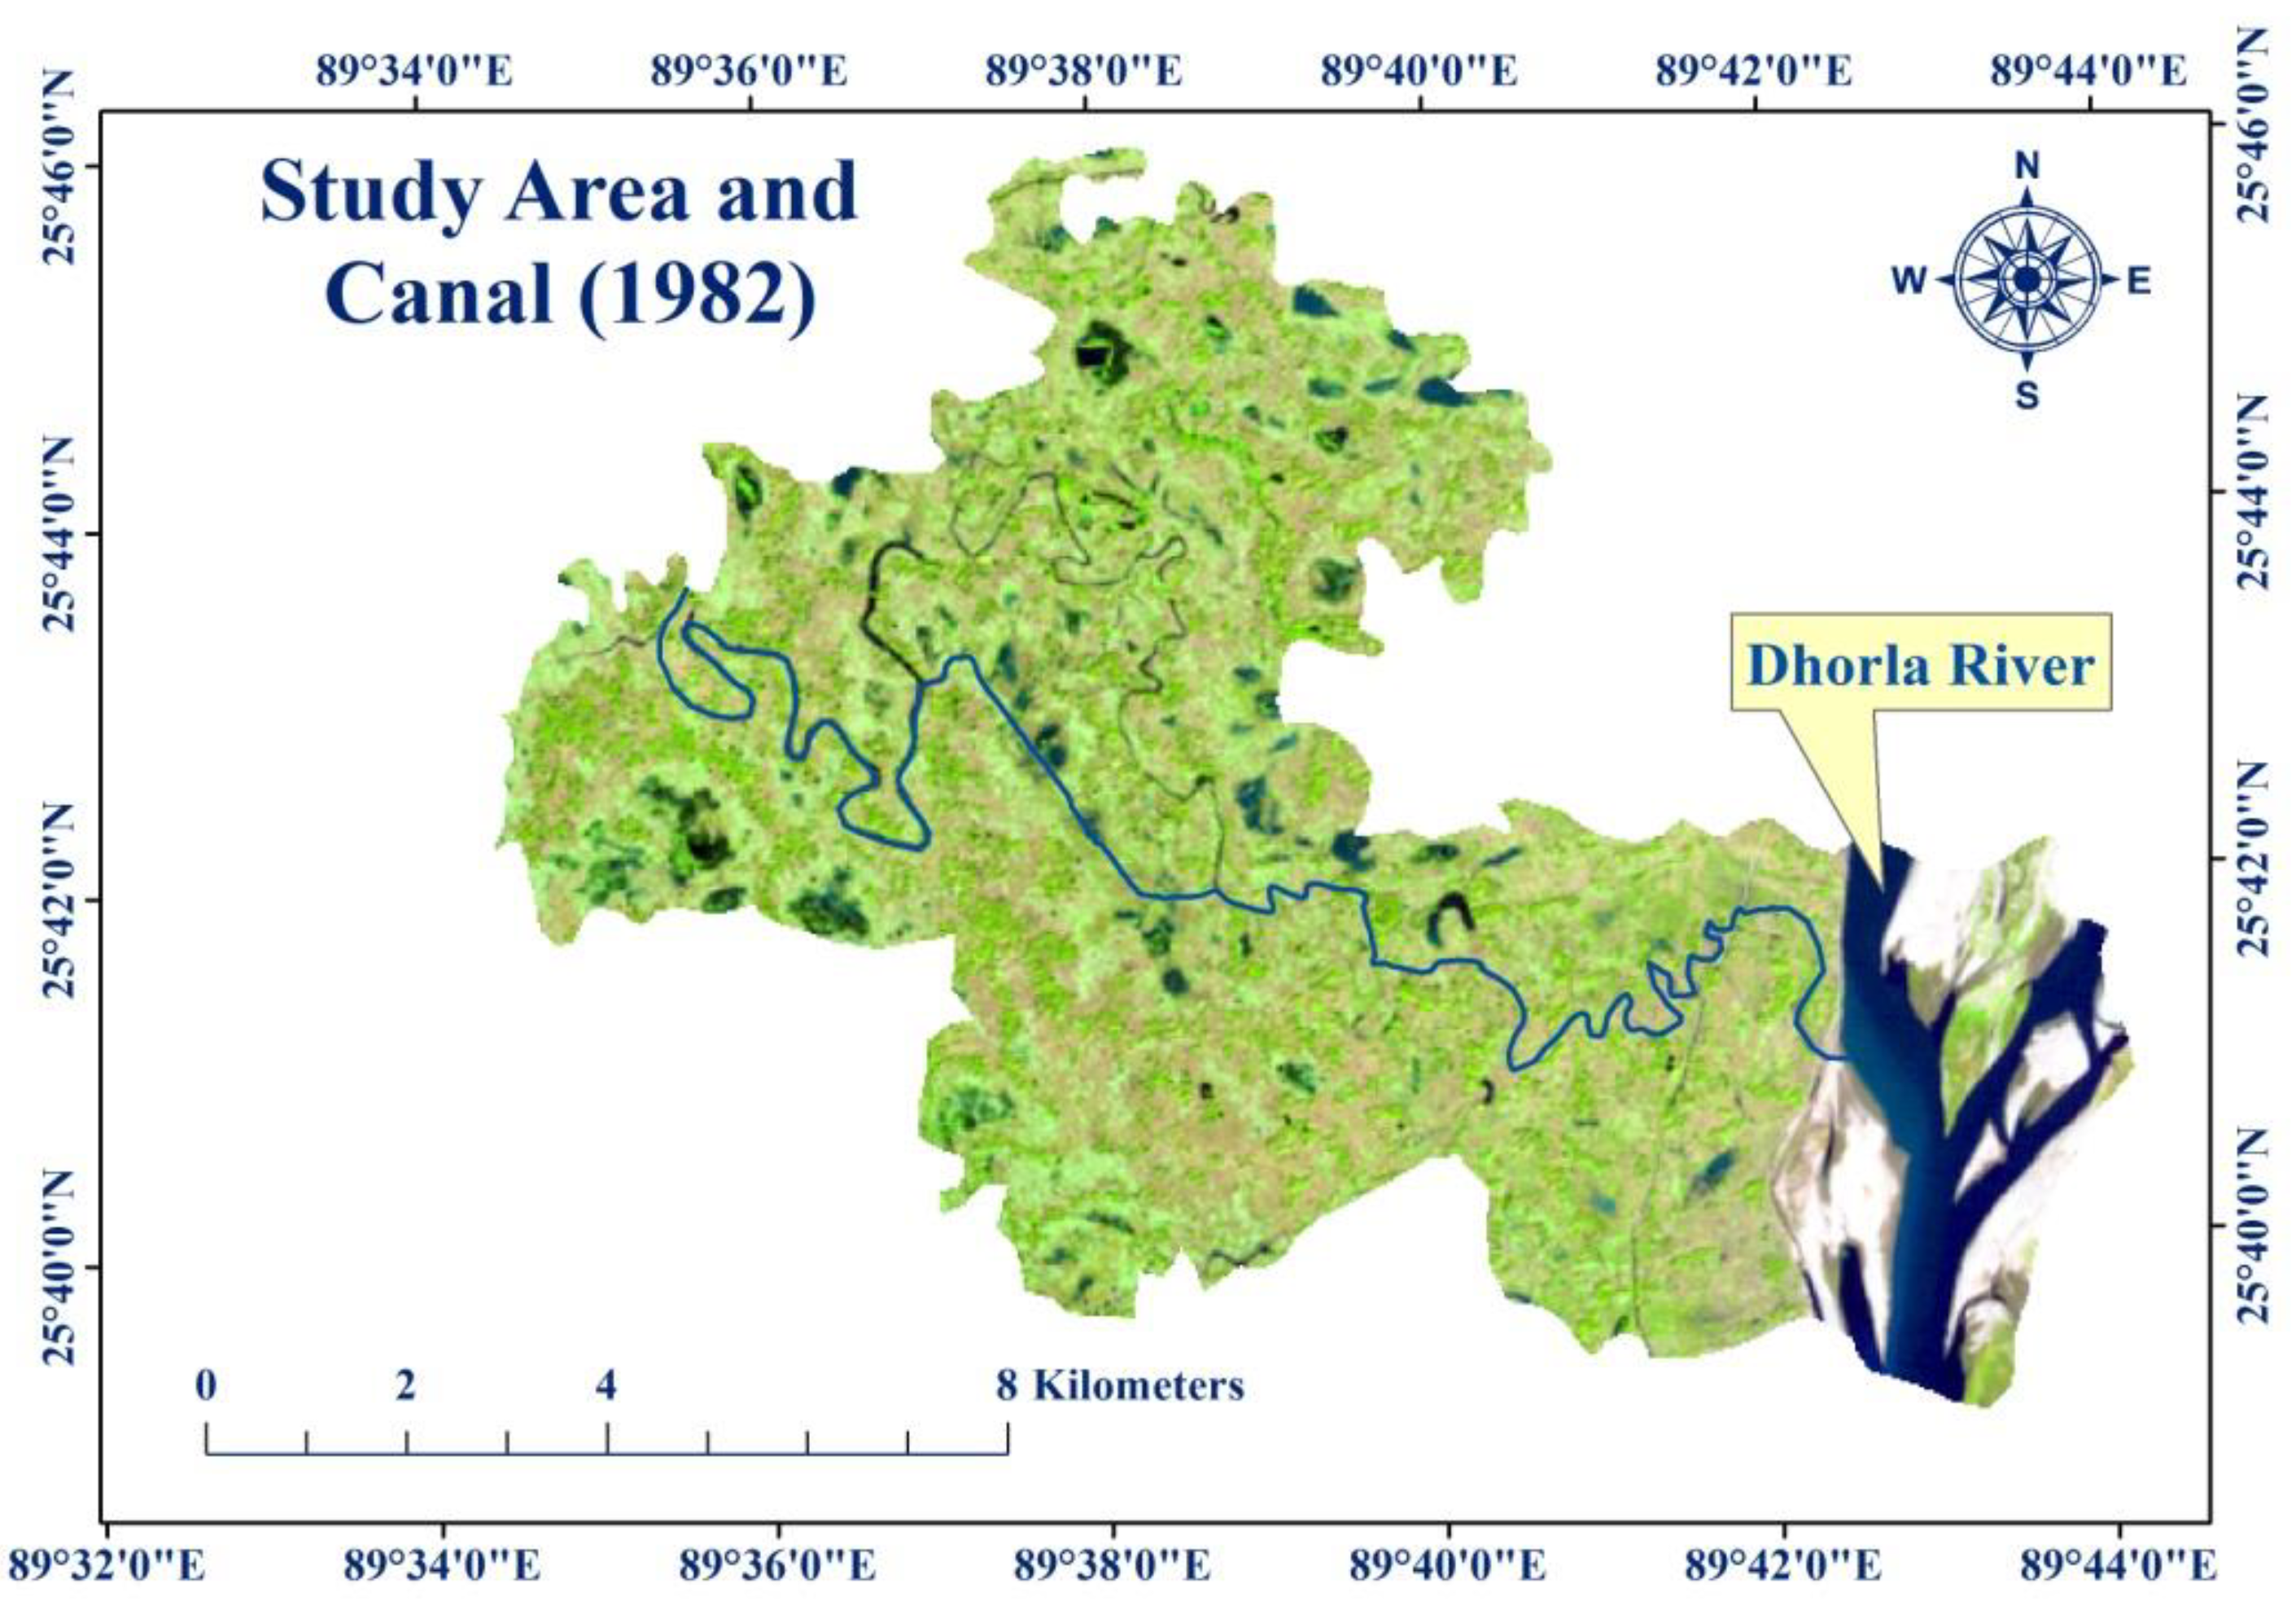
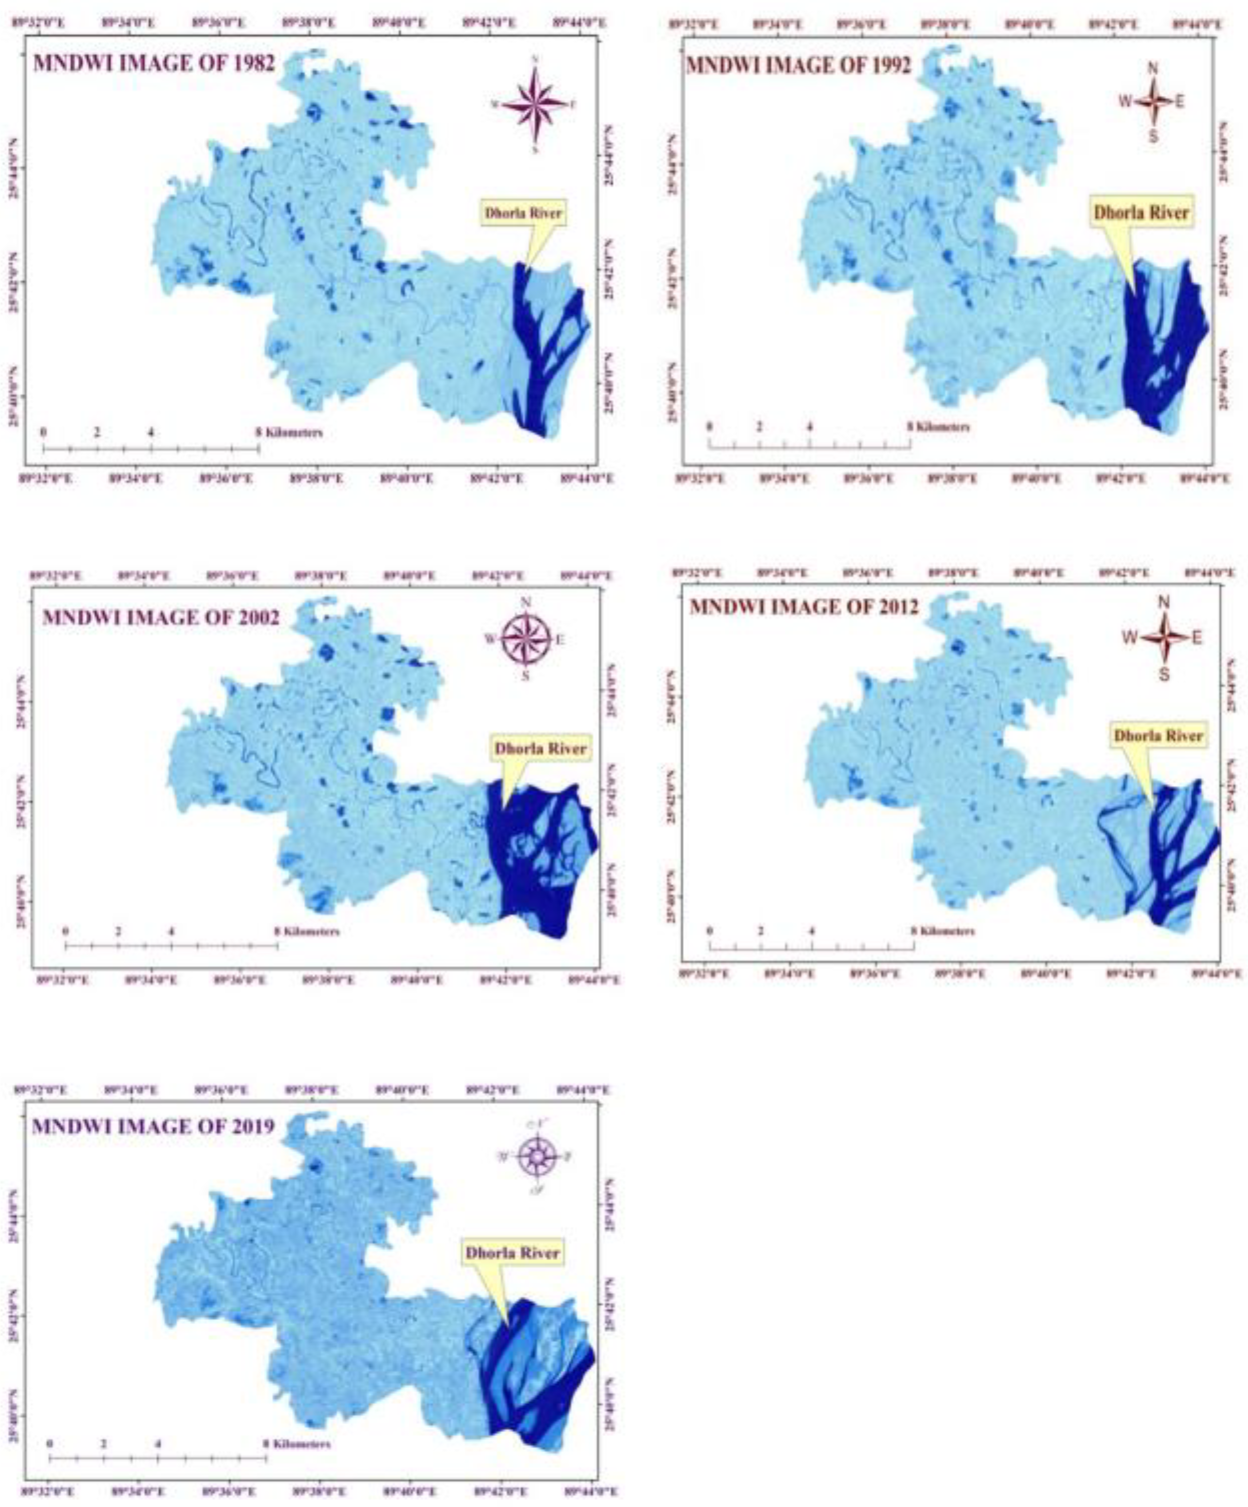
To analyze the past and present status of the canal, in this study we used five satellite images from different years. The interval of 10 years was 10. As the canal was excavated at the end of 1981, the 1982 image was taken for analysis. According to the year interval after 2012, the next year would be 2022, but as it is 2019, we used images from 2019. In this study, we used images from the winter season, because during the winter season, we can obtain the actual width of rivers and canals.
After using the MNDWI, the image of the year 1982 shows a clear picture of the study canal. Through this index, the water body is highlighted in blue for easy understanding, and other land areas are represented in light blue. The canal was 90 feet wide in 1982 and there was no encroachment. Thus, a thin clear structure of the canal was observed in Figure 3.
Figure 3 represents the image of 1992, and the blue color represents the water body. From the color combination, a thin canal similar to the 1982 image is displayed in Figure 3. From this image, it is clear that the canal was in good condition. After the excavation of the canal, no encroachment occurred in the year 1992.
The MNDWI image of 2002 shows the canal condition in the year 2002 (Figure 3). Twenty years after the excavation, the middle part of the canal was not obvious in the image. This means the middle part was at the starting point of encroachment. In 2002, the population size of the area surrounding the Bamni canal increased. Consequently, more people need more places to live and more food to consume. Therefore, the local people started to grab the open spaces alongside the canal for building houses and for agricultural purposes. People started to build houses beside the canal due to the availability of fish. But these activities were hampering the canal’s conditions and function.
A very thin canal was observed, but the ending part of the canal had almost disappeared. The width of the canal was too small to be captured by the satellite. Figure 3 is the image taken in 2012, and the population was more than that in 2002. Hence, it can be easily seen that the local people gradually started to occupy the land around the canal. The locals started to build houses on the banks of the canal. After 30 years of canal excavation, no measure was taken to dredge the canal. Thus, the canal lost its actual depth and width. Consequently, the water holding capacity of the canal was significantly reduced and the surrounded area became prone to floods during the rainy season. The encroachment began after 2002 and has steadily increased, as evidenced by the result obtained from the 2012 image.
Figure 3 represents the MNDWI image of 2019 where the starting point of the canal in the Pandul union appears only. However, the middle and end parts are missing in the image of the Dharanibari, Durgapur, and Hatia unions. The canal was not fully missing, but the width was so narrow that the satellite could not capture it.
After the analysis of the 2019 MNDWI image, it is clear that the encroachment rate has significantly increased (
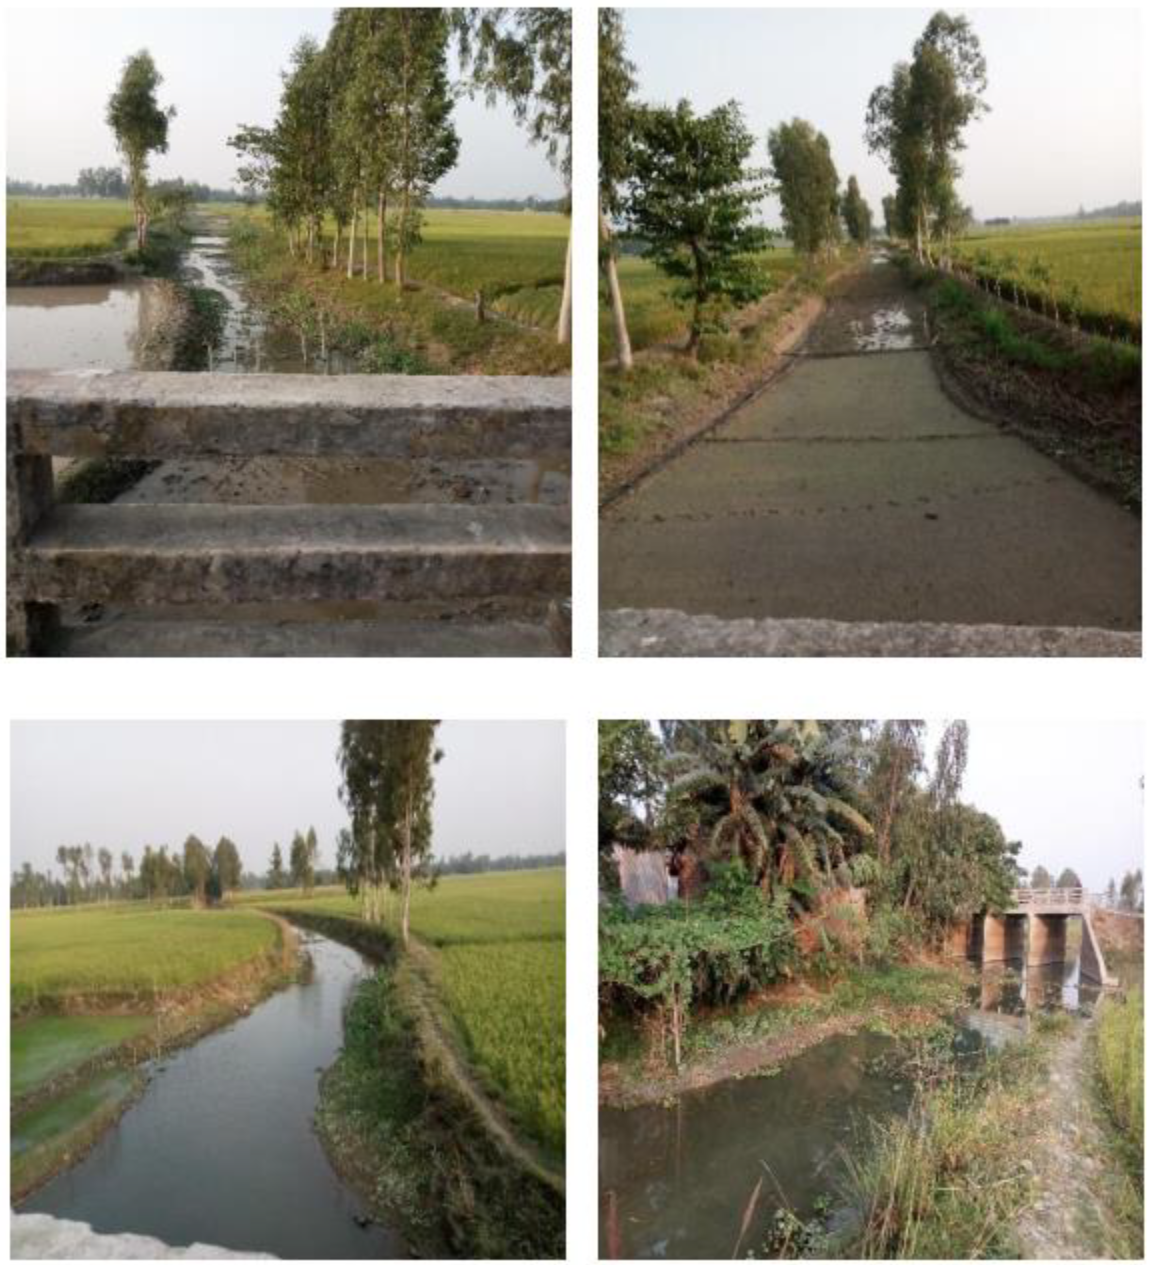
Figure 4). The same canal that had a thin structure in the 1982 image has almost completely disappeared in the satellite image of 2019. The canal was diminishing, and the width is just about 6 feet now. This was why satellite images from 2019 could not capture the canal. These results clearly suggest that encroachment decreases the width of the canal. Moreover, the lack of proper reservation of canals is one of the major reasons for the encroachment. This is not only the scenario of one canal in this Upazila; this is the scenario for almost every canal in Bangladesh. The images below show the actual present condition of the canal used in this study.

3.2. Flood Vulnerability Index (FVI) Assessment

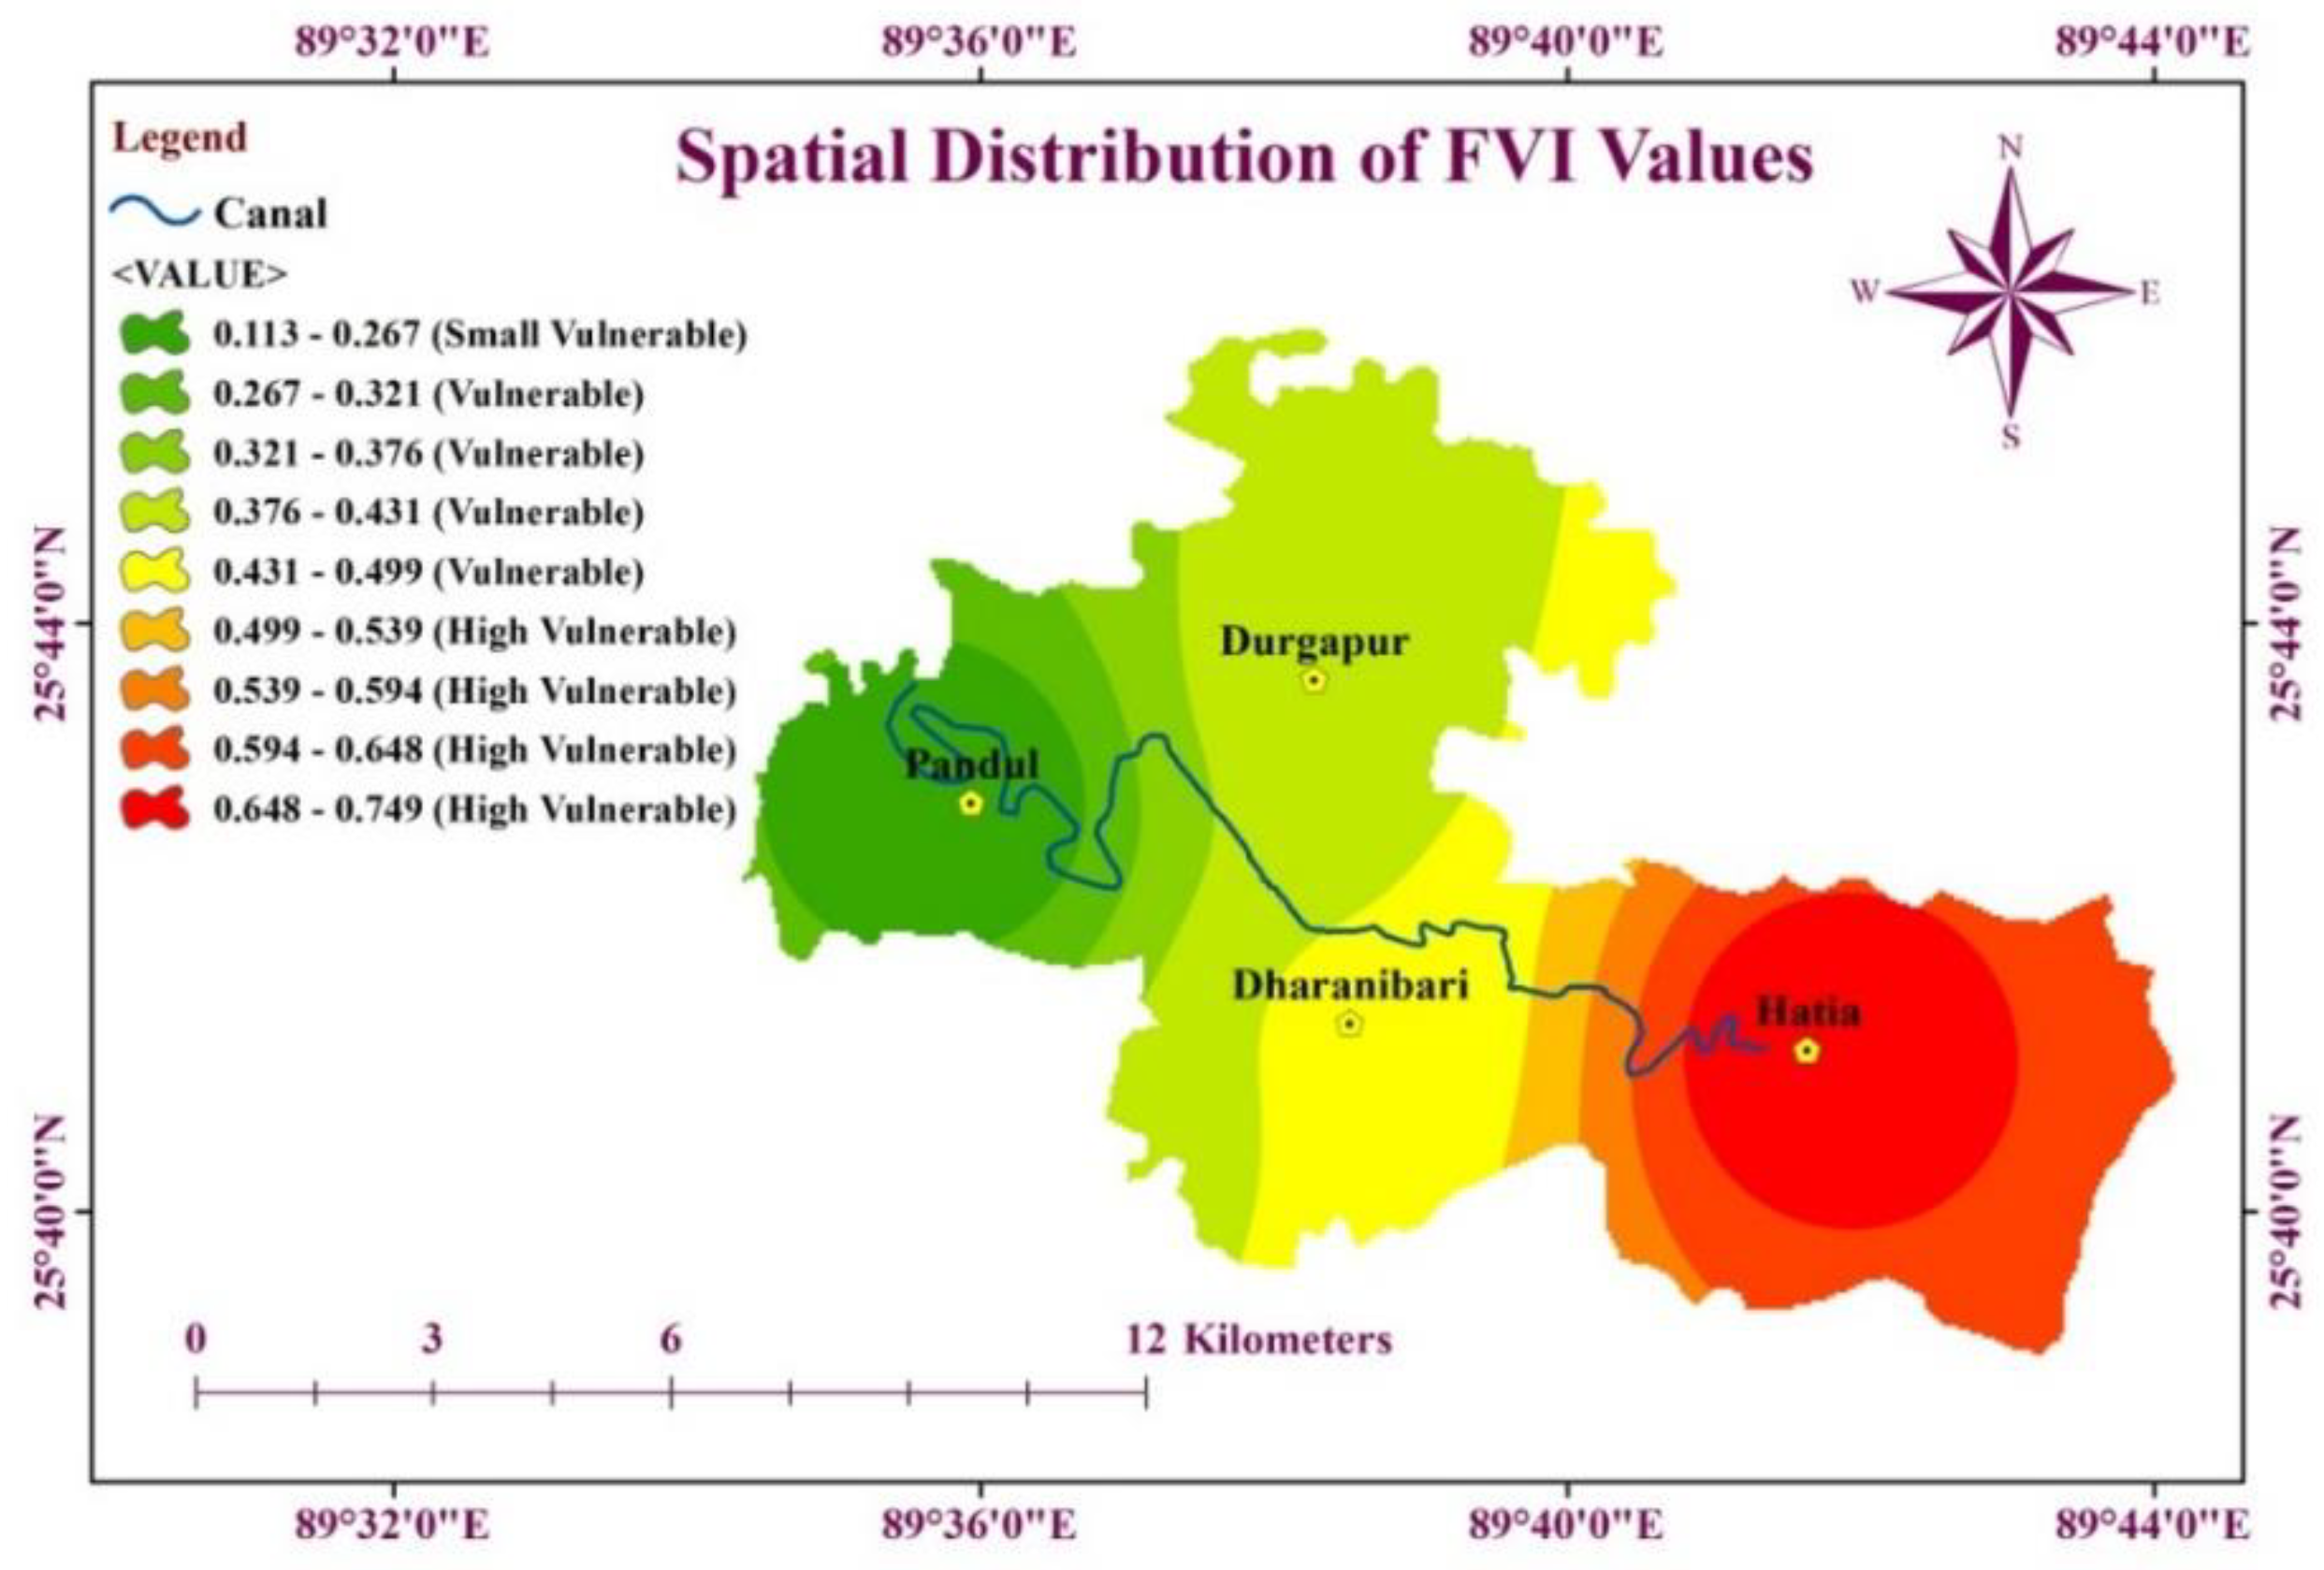
Table 4 represents the FVI values of the Dharanibari union that explain the vulnerability of this union to floods. Here, the total FVI comes from the summation of four types of vulnerability including social, economic, environmental and physical. This table shows a 0.305 value of economic vulnerability, a 0.006 value of social vulnerability, a 0.016 value of environmental vulnerability, and a 0.111 value of physical vulnerability. Dharanibari union was vulnerable to floods with a total FVI value of 0.438. This means this union has a moderate vulnerability to floods. Every year, this union experiences moderate to severe flooding. Dharanibari union is the most vulnerable among four unions due to high population growth and less urbanization. This indicates a low value of social and environmental indicators in the Dharnibari union.
The total FVI value of the Durgapur union was 0.404, which also indicates that this union is vulnerable to flooding similar to the Dharanibari union. Table 4 also shows a social vulnerability of 0.021, an environmental vulnerability of 0.028, an economic vulnerability of 0.192 and a physical vulnerability of 0.163 for the Durgapur union. The Durgapur union is also vulnerable due to high population growth and low infrastructure facility according to last population census report in 2011.
Table 4 represents the FVI values of the Pandul union. The total FVI value for Pandul was 0.213, indicating a small vulnerability to floods. The Pandul union is situated far from the river, and this is the reason for less vulnerability. For the Pandul union, the economic vulnerability is 0.099 and the physical vulnerability is 0.078. This union experiences floods during the rainy season as the canal’s depth is significantly less than before and the water holding capacity of the canal has also significantly decreased.
Hatia is the union that is adjacent to the Brahmaputra River. This river is the main cause of the flood vulnerability of this union. Table 4 represents the FVI values of the Hatia union. The economic and physical vulnerability of Hatia Union were 0.315 and 0.345, respectively. The total FVI of the Hatia union was 0.703, which indicates high vulnerability to floods. Almost every year, this union becomes flooded. Historically, this canal helped to efficiently drain flood water, but nowadays, the union is flooded for 3/4 of the rainy season.
The spatial distribution of FVI values of the four studied unions in Ulipur upazila is shown in Figure 5. The figure indicates the Hatia union has the highest vulnerability to floods among the four unions. Hatia is situated in the north-eastern part of the upazila that is adjacent to the Dhorla River, and for this reason, Hatia is more vulnerable to floods. This canal encroachment also increases the flood vulnerability of the Hatia union. On the other hand, Pandul has a small vulnerability to flooding according to the spatial distribution.

3.3. Adaptive Capacity Index (ACI) Assessment

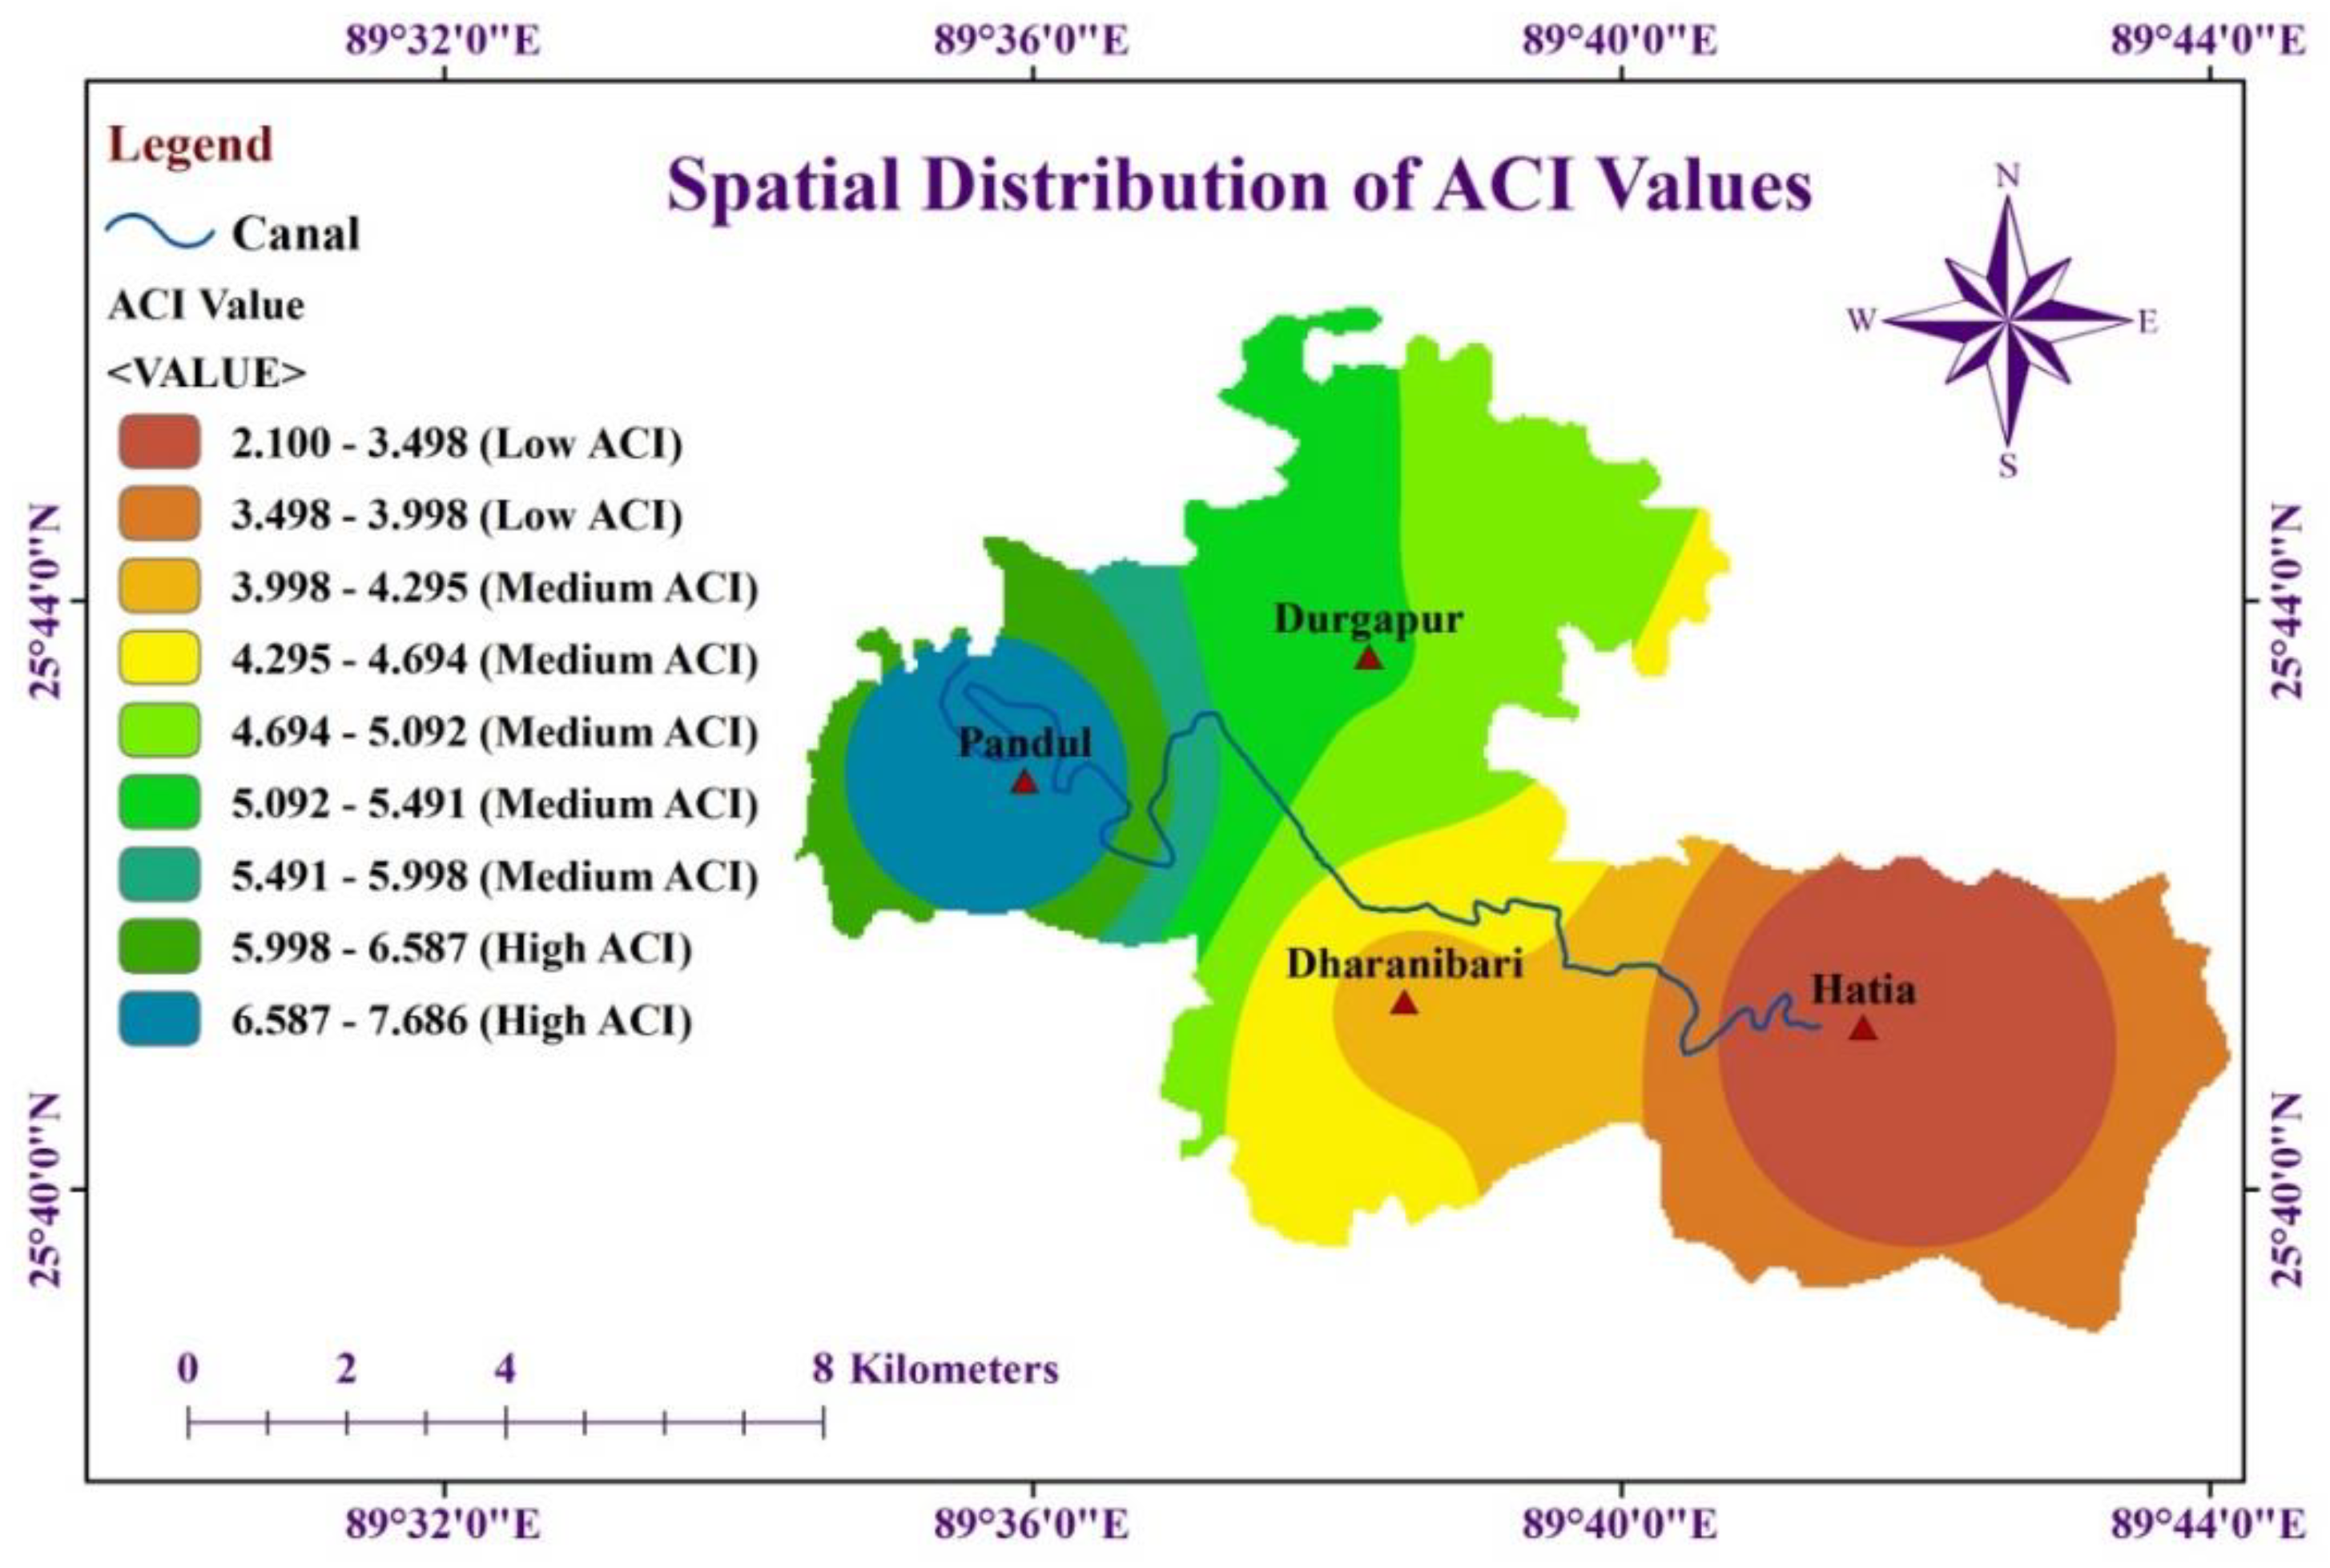
Among the four studied areas, after analyzing surveyed data using the modified ACI model of Sposito et al. [26], it was found that the highest adaptive capacity was at the Pandul union, and the lowest capacity was found at the Hatia union (Table 5). It is worth noting that capacity and vulnerability are reversed in nature, but these results have been accomplished in a qualitative way. Thus, there can be fluctuations in outcomes. However, in this study, vulnerability and capacity are the opposite conditions. According to the FVI values, Hatia union is highly vulnerable to floods, and according to the ACI values, Hatia had the lowest value of 3.1. A low ACI value indicates low adaptive capacity. As Hatia union has low adaptive capacity, this led to the union’s high flood vulnerability. Therefore, both the indexes fit with each other in this study. On the other hand, Pandul had a 6.7 ACI value, which denotes high adaptive capacity. Based on the FVI, Pandul had a small vulnerability to floods. Hence, in this intense situation, both indexes were positively correlated with each other. The canal used in this study passes through these four unions, and the canal was excavated for the benefit of local people. However, the results are different now. Human activities, such as canal encroachment, slowed down the normal flow of rainwater, which led to more and bigger floods in the study area in recent years.
Calculated ACI values are presented in Figure 6 through spatial distribution. Figure 6 explains the adaptive capacity of the studied unions to floods. According to this figure, Pandul has a high ACI value range of 6.587–7.686, which means this union has a better adaptive capacity to flood than the other unions. On the other hand, the Hatia union has the lowest ACI value, ranging from 2.100 to 3.498. This denotes the vulnerability of this union to flood impacts. According to this figure, Durgapur and Dharanibari unions have medium adaptive capacity to flood. According to this figure, the ACI values are within 5.092–5.491 and 3.998–4.295.

3.4. Economic Vulnerability Index (EVI) Assessment

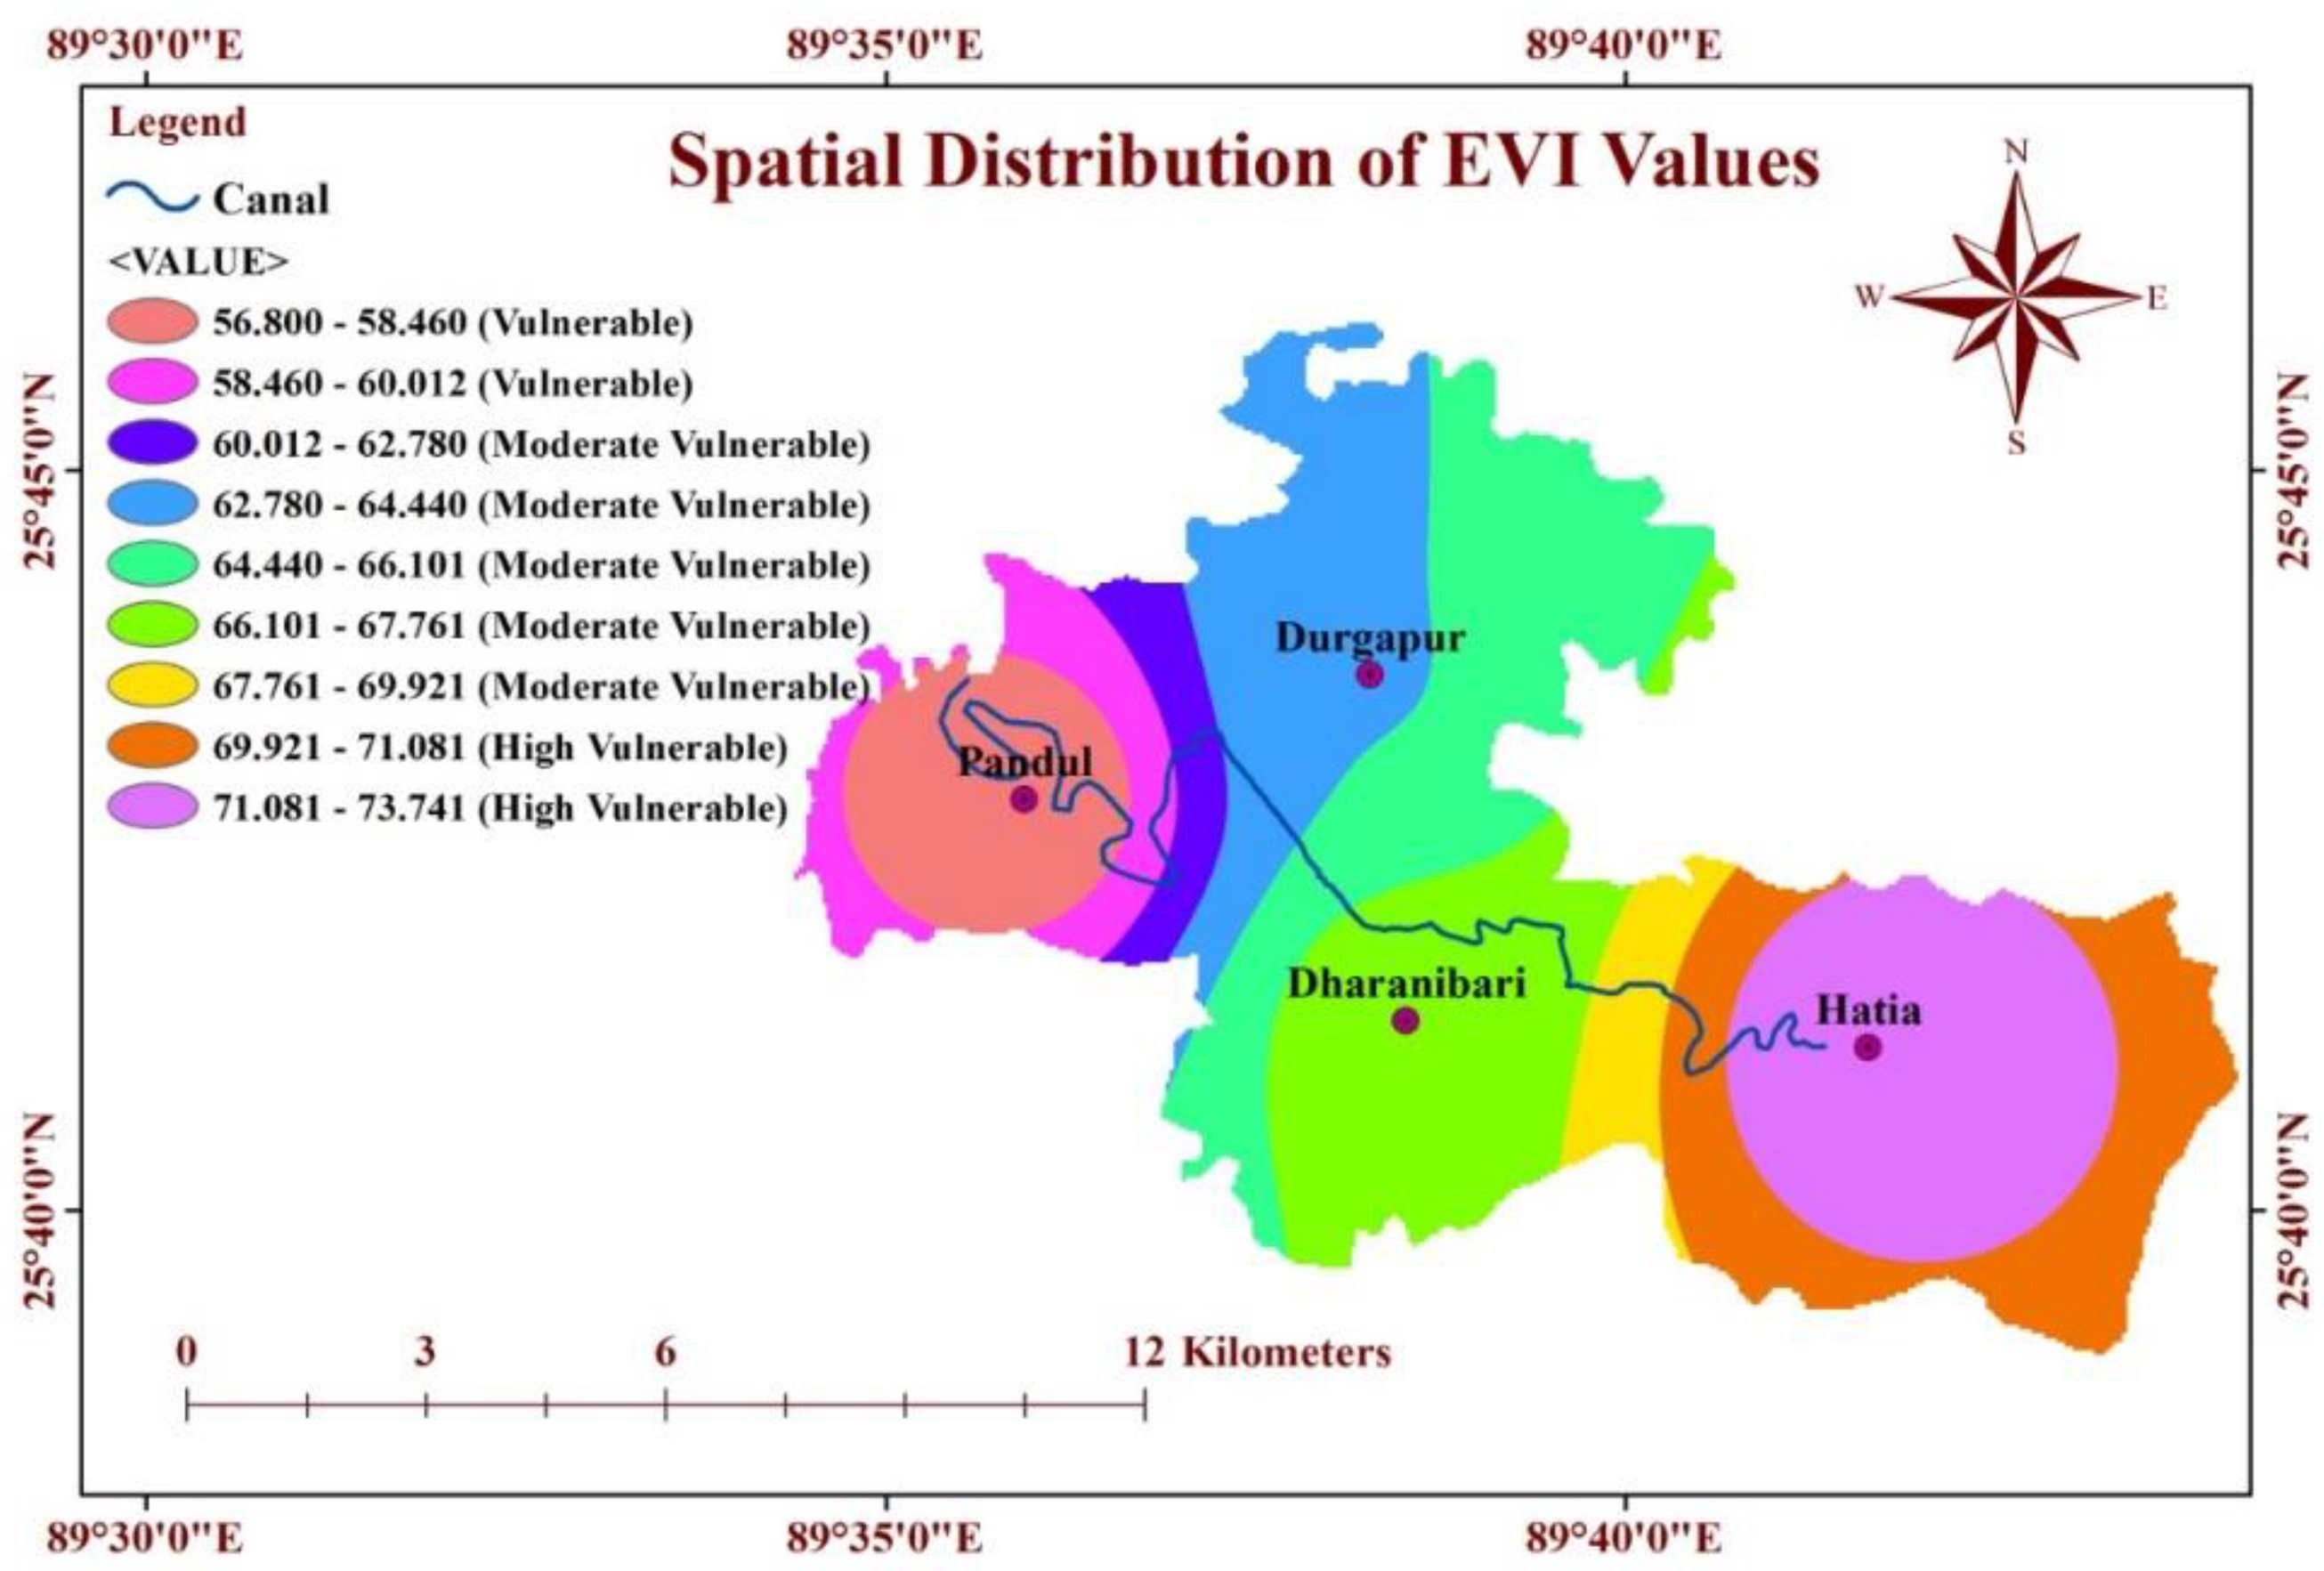
Table 6 represents the Economic Vulnerability Index (EVI) values that denote how the unions are economically vulnerable. Hatia has the highest EVI value (72.8) among the unions, indicating that this union is economically highly vulnerable to floods, according to the table. On the other hand, Pandul has the lowest EVI value (57.8) among the unions that indicate Pandul is economically vulnerable to flooding. An EVI of 50 describes a general condition where the vulnerability is neither high nor low. Dharanibari and Durgapur unions have moderate economic vulnerability as their EVI values are 67.3 and 64.4, respectively.
Economic vulnerability is directly and indirectly related to the canal encroachments. As the canal is encroached upon, flood frequency and severity also increase. Every year, floods damage crops, houses, roads, and infrastructure. Repairing these infrastructures need money, and damaged crops create a loss in production. Therefore, the farmer does not have much money to repair the flood damage. The depth of the canal decreases; consequently, its water holding capacity also decreases. In the past, this canal was a major source of fish for the local people, but now only a small number of fish can be found seasonally, mostly in the rainy season. Thus, the local people must buy fish from the market. Hence, canal encroachment increases the daily budget. In the past, the locals could get fish for free from the canal, and as there were lots of fish in the canal, the market rate of fish was also significantly lower. Most of the local people do not have much money to spend on fish at such high prices. Many people face a lack of protein in their daily diet since fish is a major source of protein in their diet. The lack of protein results in diseases, and thus people must spend more money on health care. Hence, encroachment has many direct and indirect negative consequences.
Canal encroachment is always a negative aspect, but some argue that using encroached land for agricultural purposes or for urbanization can bring economic resilience. Nonetheless, the risk associated with encroachment far outweighs the benefits. The water holding capacity of the canal has significantly decreased. This means that the farmer must spend more money on groundwater irrigation. Moreover, they may lose their crops each year due to flood events. But if the canal was not encroached, the flood water would have quickly flowed to the river, thus the crops would have survived. Therefore, there is no overall economic benefit from encroachment, but there is more economic loss. One may argue that, through encroachment, the cultivable land has increased in that area, and this will lead to more production. Even though more land is created, that does not equate to more production since every year most of the crops are lost to floods.
The EVI values of four unions are shown in Figure 7. According to this figure, Durgapur and Dharanibari unions have moderate economic vulnerability as the EVI values of these unions ranged between 62.780 and 64.440 and 66.101 and 67.761 respectively. On the other hand, Pandul has an EVI value within the 56.800–58.460 range that indicates the vulnerable economic condition of this union. Moreover, the Hatia union is in the most economically vulnerable condition among the four unions as the EVI value of Hatia is within the range of 71.081–73.741. This union is the most affected of the unions due to encroachment. Encroachment affects the economy, social status, infrastructure, as well as the environment of these unions. Figure 7 also shows the EVI values that show how economically vulnerable the unions are.
Table 7 represents the correlations among the three indexes used in this study. According to this table, ACI has a negative relationship with FVI and EVI. Studies have shown that with increasing adaptive capacity, flood vulnerability and economic vulnerability will be reduced. The results also show that the FVI was significant at the 0.05 level, while the EVI was significant at the 0.01 level (2-tailed). Our findings also show a positive relationship between FVI and EVI. If the vulnerability of any area increases, economic vulnerability will also increase. Furthermore, adaptive capacity will decrease, and ACI is significant at the 0.05 level (2-tailed).

4. Discussion

In recent years, the intensity and frequency of different types of hazardous events have increased, as have their adverse environmental, social, and economic impacts. The preventive and mitigative study of flood events supported by an investigation of the causes of flooding at microscale provides the evidence for disaster risk-based decision making [47]. The study of different types of vulnerability in any geographical location is essential to reduce economic loss, avoid the loss of wealth and, more importantly, save human lives during disasters [48]. Most of the coastal and low-lying areas of developing countries like Bangladesh are more vulnerable to flood risks [49]. This study provides insights into flood and economic vulnerability due to canal encroachment in the northern areas of Bangladesh, based on the integration of the flood vulnerability index, adaptive capacity index, and economic vulnerability index. The results have been compared with the vulnerability in different unions.
Because of the increased flood hazard, better approaches must be established to help decision-making in flood risk management. The FVI is a tool that focuses on indicators. The FVI has been thoroughly evaluated with regard to all components of a flood disaster that are most likely to be affected: social, economic, environmental, and physical. The FVI tests the vulnerability level for each factor (exposure, susceptibility, and resilience). The main reason is that a variety of factors, including social, economic, environmental, physical, and even political factors, are responsible for differences between different units related to different indicators. Since this upazila is densely populated, it is highly prone to flooding. Exposure, susceptibility, and resilience are three factors having impacts on the calculation of vulnerability [50]. They make a little difference between different units related to different indicators. Illegal construction over a canal, unauthorized land filling, and solid waste dumping are the other reasons that affect the flooding. The FVI has been evaluated holistically, taking into account all dimensions that are most likely to be impacted by a flood disaster in the study area.
The spatial analysis to evaluate the historical canal encroachment pattern is useful for sustainable spatial planning by adopting the necessary measures to restore the canal width. The satellite image analysis shows that, since 2002, the canal encroachment has steadily increased, and by 2019, the canal width in the three unions has significantly declined. During the study period, the canal width was reduced from 90 feet to 6 feet due to the encroachment of the river by constructing houses and other infrastructure. This significantly reduced natural water flows through the canals and water velocity, resulting in waterlogging problems during the monsoon season and a water crisis during the summer and winter seasons. According to Zhang et al. [51], morphological changes in the channel resulting from siltation or encroachment will result in changes in the channel’s elevation and slope. The study found that these changes in river morphology led to a degradation of river health and had substantial impacts on flood control. Prior studies have shown that the waterbodies in the urban and rural areas of Bangladesh have been going through a rapid land-use transformation in the last few decades [52,53,54]. According to Mahmood et al. [6], encroachment and landfills lead to the narrowing of rivers in Bangladesh, and in recent years, this encroachment rate has increased. This made floods more likely and made the problem of waterlogging worse (in time and speed) in both cities and rural parts of the country.
According to Chowdhury et al. [7], about 56.10% of the Buriganga River in Dhaka city has been encroached upon to build infrastructure from 2001 to 2014. Rapid population growth, agriculture, human settlement, cash cropping, shifting cultivation, and unplanned infrastructure development were identified as the primary causes of encroachment in the study, which is consistent with previous research [51,54,55,56]. As a result, when a large amount of water flows in the canals and rivers in Bangladesh during the monsoon, it causes flooding and has serious consequences for the livelihood and economy of the affected people as well as the country [28,57,58]. Moreover, researchers have identified the primary reason for waterlogging in the major cities in Bangladesh as the shrinkage of natural drains due to encroachment [59]. According to Bigi et al. [47], the reduction of river width and siltation are the major drivers of flood risks in the river basins, which is congruent with our study. Figure 3 and Figure 5 show that the FVI value was optimum (highly vulnerable) in the eastern part of the study area where canal encroachment occurred most, and the FVI value was minimum where canal encroachment occurred comparatively less.
The vulnerability of floods to any geographical area depends on the social, economic, physical, and environmental vulnerabilities of that area [58,60,61]. This study used these factors in FVI and utilized the ACI to illustrate a realistic picture of the impacts of floods in the study area. The FVI values of 0.438 in the Dharanibari union and 0.404 in the Durgapur union indicate that these two unions are moderately exposed to flooding, while the FVI value of 0.703 in the Hatia union indicates high vulnerability to floods. The FVI shows that all the studied unions exhibited a higher economic and physical vulnerability, which led to an increase in the vulnerability of the unions. Fatemi et al. [62] demonstrated that physical vulnerabilities play a significant role in flood damage in Dhaka’s peri-urban areas. Ahmadi et al. [63] also identified economic and physical vulnerability as having significant influences on flood impacts in Iran, and the result of this study is similar to our findings. Though the results of all the four vulnerabilities (social, economic, physical, and environmental) showed a spatial variation, it clearly signifies the need for consideration of all these parameters separately in flood vulnerability assessment. The outcome of the ACI shows the inverse outcome of FVI. Hatia union is highly vulnerable to floods, and according to the ACI values, Hatia had the lowest value of 3.1, which implies that the Hatia union is highly exposed to flood impacts due to canal encroachment in the northern region of Bangladesh. Areas with lower adaptation capacity are highly vulnerable to climate change. Talukdar et al. [64] reported that the northwestern districts of Bangladesh are more susceptible to flooding. The overall flood impact assessment in the study area shows that steps need to be taken to increase adaptation capacity so that flood vulnerability and exposure can be reduced.
Floods have a significant impact on local and national economic performance. Floods’ economic vulnerability assessment provides powerful data for policy planning and risk management strategies [63]. This study found an unequal pattern of flood exposure and economic vulnerability across different unions, which contributes to differences in economic vulnerability. The findings show that the canal encroachment increased the frequency and damaging capacity of flooding, which increased the damage costs and decreased crop production and fish cultivation in the study area. The direct and indirect economic impacts of canal encroachment also cause health impacts such as protein deficiency due to lack of money to purchase protein rich products. Näschen et al. [65] showed that the decrease of water bodies has severe impacts on agriculture, fish cultivation, and the local as well as national economy by reducing food production capacity. Previous research has found that the loss of wetlands and water bodies is now posing a challenge to ensuring food security [31,66,67,68]. All these findings of prior research are congruent with our findings. The EVI ranged between 56.80 and 73.74 at a 0.01 level of significance, which implies that the canal encroachment has moderate to high adverse economic impacts in the studied unions of the northern region of Bangladesh. Moreover, farmers do not get sufficient water for cultivation in summer and winter due to the insufficient flow of water from the rivers through canals. Such events influence drought events and cause economic losses by reducing crop production. Mohsenipour et al. [69] reported that recent climatic changes and man-made reasons have increased droughts in the riverine country of Bangladesh, especially in the northwestern region of the country. Islam et al. [53] found that climate change in the northern region of Bangladesh greatly affected the crop production capacity of this region, and Zinat et al. [70] reported that drought events reduced the production of Boro rice in the western region of the country. A study by Mahmood et al. [6] found that about 35.51% of the local people have suffered economic losses due to the encroachment of the Buriganga River in Bangladesh. A similar economic loss has been reported by Egwumah et al. [17] in Nigeria.
Although river and canal encroachment has some positive effects, such as infrastructural development (roads, housing, settlements) and providing opportunities for economic development, this study found serious adverse impacts of canal encroachment on flooding, as well as social, physical, environmental, and economic vulnerabilities. The overall study demonstrates the critical scenario of social, physical, environmental, and economic conditions in the studied area due to canal encroachment. So, a detailed microscale assessment of the effects of canal encroachment will help planners, researchers, and policymakers better understand and use the landscape in a way that is sustainable, taking into account what could happen in the future.

5. Conclusions

In this study, we assess the effects of canal encroachment and their impacts on the socio-economic development of the Ulipur Upazila, northern Bangladesh. Our findings revealed that the canals are in critical condition and need urgent treatment. These canals are the town’s boats, and if they are blocked, the community would suffer severe environmental and economic implications. The ACI was used to identify the adaptive capacity of the local people of three unions. Based on the FVI, we found that the Hatia union is more vulnerable to floods than the other unions. In contrast, the adaptive capacity of the Pandul union is high compared to the other two unions, according to EVI. The Hatia union is economically more vulnerable because it is more susceptible to floods. The results explained the vulnerability of these unions caused by canal encroachments. It is essential to reclaim the canals from land grabbers and dig them on a regular basis to maintain a functional drainage system and environmental sustainability. Urbanization would not be halted, but it should be based on further research and knowledge of the area’s hydrological system rather than just demand-driven, uncontrolled development. Special consideration should be paid to the development and modification of existing water bodies so that natural hydrological conditions can deal with man-made structural activity. It is past time to consider the policy consequences of canal encroachment. In the future, more research should be conducted on livelihood pattern changes, land form changes, and the severity of flooding changes due to canal encroachment. The majority of people are suffering as a result of canal encroachment. Only canal excavation can maintain the flow of flood water, thus limiting the impact of floods. Not only the government but also the local people and the private sector have to come forward to save the canal from encroachments.

Author Contributions

A.Y.M., designed, conceptualized, drafted the original manuscript; M.E.H., planned the documents; W.G., M.A.F. and H.G.A., involved in the literature review, software, mapping, statistical analysis, interpretation of the analysis and discussion; A.Y.M., contributed to instrumental setup, data analysis, validation; A.Y.M., H.G.A., H.A., A.A.A.D., M.A.-M. and M.E.H., contributed to data collection and extraction; A.R.M.T.I., M.E.H., M.A.-M., M.A.F., H.A., A.A.A.D., H.G.A. and W.G., had done the internal review and proofreading during the manuscript drafting stage. M.A.-M., H.A., A.A.A.D. and H.G.A., funding acquisition. All authors have read and agreed to the published version of the manuscript.

Funding

The article processing charge was funded by the Deanship of Scientific Research, Qassim University. This project was funded by Princess Nourah bint Abdulrahman University Research Supporting Project Number PNURSP2022R241, Princess Nourah bint Abdulrahman University, Riyadh, Saudi Arabia.

Institutional Review Board Statement

Not applicable.

Informed Consent Statement

Written informed consent has been obtained from the participants to publish this paper.

Data Availability Statement

Data are available upon reasonable request on corresponding author.

Acknowledgments

The researchers would like to thank the Deanship of Scientific Research, Qassim University, for funding the publication of this project. We are grateful to the authority and staffs of the upazila Land Office of Ulipur upazila who have provided us the land use and flood data that was an essential part of the study. Authors also acknowledge the USGS for their kind cooperation.

Conflicts of Interest

The authors declare no conflict of interest.

References

  1. Loucks, D.P.; van Beek, E. Water Resources Planning and Management: An Overview. In Water Resource Systems Planning and Management; Springer: Cham, Switzerland, 2017; pp. 1–49. [Google Scholar]
  2. Walker, R. Urban sprawl and natural areas encroachment: Linking land cover change and economic development in the Florida Everglades. Ecol. Econ. 2001, 37, 357–369. [Google Scholar] [CrossRef]
  3. Islam, A.R.M.T.; Talukdar, S.; Mahato, S.; Ziaul, S.; Eibek, K.U.; Akhter, S.; Pham, Q.B.; Mohammadi, B.; Karimi, F.; Linh, N.T.T. Correction to: Machine learning algorithm-based risk assessment of riparian wetlands in Padma River basin of Northwest Bangladesh. Environ. Sci. Pollut. Res. 2021, 28, 34472. [Google Scholar] [CrossRef] [PubMed]
  4. Ishtiyaq, M.; Kumar, S. Typology of informal settlements and distribution of slums in the NCT of Delhi. J. Contemp. India Stud. Space Soc. Hiroshima Univ. 2011, 1, 37–46. [Google Scholar]
  5. Sultana, M.S.; Islam, G.M.T.; Islam, Z. Pre and Post-urban Wetland Area in Dhaka City, Bangladesh: A Remote Sensing and GIS Analysis. J. Water Resour. Prot. 2009, 1, 414–421. [Google Scholar] [CrossRef] [Green Version]
  6. Mahmood, S.; Nourin, F.T.J.; Siddika, A.; Khan, T.F. Encroachment of the Buriganga River in Bangladesh. J. Miner. Mater. Charact. Eng. 2017, 5, 266–273. [Google Scholar] [CrossRef] [Green Version]
  7. Chowdhury, M.A.I.; Kabir, M.M.; Sayed, A.F.; Hossain, S. Assessment of river encroachment and land-use patterns in Dhaka city and its peripheral rivers using GIS techniques. J. Biodivers. Environ. Sci. (JBES) 2016, 8, 43–51. [Google Scholar]
  8. Ahmed, S.T.; Prasad, K. Assessment of River Encroachment and Changing Land Use Patterns in Rajouri Town (J&K). Int. J. Lakes Rivers 2021, 14, 71–80. [Google Scholar] [CrossRef]
  9. Iftekhar, M.S.; Hoque, A.K.F. Causes of Forest Encroachment: An Analysis of Bangladesh. GeoJournal 2005, 62, 95–106. [Google Scholar] [CrossRef]
  10. Miller, K.A.; Webb, J.A.; de Little, S.C.; Stewardson, M.J. Environmental Flows Can Reduce the Encroachment of Terrestrial Vegetation into River Channels: A Systematic Literature Review. Environ. Manag. 2013, 52, 1202–1212. [Google Scholar] [CrossRef] [Green Version]
  11. Shitima, M.E. Forest Conservation and People’s Livelihoods: Explaining Encroachment on Zambia’s Protected Forest Landscapes—The Case of Mwekera National Forest, Kitwe, Copperbelt. Master’s Thesis, Norwegian University of Science and Technology, Trondheim, Norway, 2005. [Google Scholar]
  12. Kumar, B.; Mizunoya, T. Sustainability Assessment Model of the Buriganga River Restoration Project in Bangladesh: A System Dynamics and Inclusive Wealth Study. Sustainability 2022, 14, 873. [Google Scholar] [CrossRef]
  13. Kamal, A.M.; Shamsudduha, M.; Ahmed, B.; Hassan, S.K.; Islam, S.; Kelman, I.; Fordham, M. Resilience to flash floods in wetland communities of northeastern Bangladesh. Int. J. Disaster Risk Reduct. 2018, 31, 478–488. [Google Scholar] [CrossRef] [Green Version]
  14. Mirza, M.M.Q. Three Recent Extreme Floods in Bangladesh: A Hydro-Meteorological Analysis. Nat. Hazards 2003, 28, 35–64. [Google Scholar] [CrossRef]
  15. Suman, A.; Bhattacharya, B. Flood characterisation of the Haor region of Bangladesh using flood index. Hydrol. Res. 2015, 46, 824–835. [Google Scholar] [CrossRef]
  16. Bolen, E. Human related Mortality. In The Florida Manatee; Meter, V., Ed.; Florida Power and Light: Miami, FL, USA, 2000; p. 22. [Google Scholar]
  17. Egwumah, P.; Iwar, I.; Okibe, O. The Impact of Human Encroachment and River Bank Agricultural Activities on the Habitat of the Manatee (Trichechus Senegalensis) Along the Lower Benue River, Benue State, Nigeria. J. Res. For. Wildl. Environ. 2009, 1, 84–92. [Google Scholar]
  18. Dissanayake, L. Stream corridor encroachment and its consequences: The case of Pinga Oya tributary in the upper Mahaweli River in Sri Lanka. Model. Earth Syst. Environ. 2021, 7, 1907–1916. [Google Scholar] [CrossRef]
  19. Tyagi, N.; Sahoo, S. Assessing the status of changing regimes of water bodies in Gorakhpur District, Uttar Pradesh, India. Environ. Monit. Assess. 2022, 194, 67. [Google Scholar] [CrossRef]
  20. Asif, K. Encroachment of agricultural land in urban fringe areas of Aligarh city, India–Process and parameters. Asian Geogr. 2014, 31, 129–148. [Google Scholar] [CrossRef]
  21. Hackenbroch, K.; Hossain, S. “The organised encroachment of the powerful”: Everyday practices of public space and water supply in Dhaka, Bangladesh. Plan. Theory Pract. 2012, 13, 397–420. [Google Scholar] [CrossRef]
  22. Manandhar, S.; Joshi, J.R.; Ghimire, S. State and Public Land Management: Issues of Encroachment and Protection Technique; FIG Working Week: Christchurch, New Zealand, 2016. [Google Scholar]
  23. Balica, S.F.; Douben, N.; Wright, N.G. Flood vulnerability indices at varying spatial scales. Water Sci. Technol. 2009, 60, 2571–2580. [Google Scholar] [CrossRef] [Green Version]
  24. Balica, S.F.; Wright, N.G.; Van Der Meulen, F. A flood vulnerability index for coastal cities and its use in assessing climate change impacts. Nat. Hazards 2012, 64, 73–105. [Google Scholar] [CrossRef] [Green Version]
  25. Smit, B.; Wandel, J. Adaptation, adaptive capacity and vulnerability. Glob. Environ. Chang. 2006, 16, 282–292. [Google Scholar] [CrossRef]
  26. Sposito, V.; Patricia, F.; Carys, E.H.H. Adaptation to Climate Change and Adaptive Capacity in Agriculture Systems: Literature Review; Department of Primary Industries: Melbourne, Australia, 2005.
  27. Metzger, M.J. European Vulnerability to Global Change: A Spatial Explicit and Quantitative Assessment. Ph.D. Thesis, Wageningen University, Wageningen, The Netherlands, 2005. [Google Scholar]
  28. Khairul, I.M.; Rasmy, M.; Ohara, M.; Takeuchi, K. Developing Flood Vulnerability Functions through Questionnaire Survey for Flood Risk Assessments in the Meghna Basin, Bangladesh. Water 2022, 14, 369. [Google Scholar] [CrossRef]
  29. Pathak, S.D.; Kulshrestha, M.; Kulshreshtha, M. Flood vulnerability assessment using data envelopment analysis–The case of Narmada river basin districts in central India. Water Policy 2021, 23, 1089–1106. [Google Scholar] [CrossRef]
  30. Nasiri, H.; Yusof, M.J.M.; Ali, T.A.M. An overview to flood vulnerability assessment methods. Sustain. Water Resour. Manag. 2016, 2, 331–336. [Google Scholar] [CrossRef] [Green Version]
  31. Mallick, S. Environmental Degradation: Challenge to Food Security, local context global perspective, A case study of a village in Bangladesh. Am. J. Eng. Res. 2013, 2, 42–48. [Google Scholar]
  32. Pal, S.; Islam, A.R.M.T.; Patwary, M.A.; Alam, G.M.M. Modeling Household Socio-Economic Vulnerability to Natural Disaster in Teesta Basin, Bangladesh. In Climate Vulnerability and Resilience in the Global South; Alam, G., Erdiaw-Kwasie, M., Nagy, G., Leal Filho, W., Eds.; Springer: Cham, Switzerland, 2021; pp. 103–129. [Google Scholar] [CrossRef]
  33. Islam, M.; Sado, K. Flood hazard assessment in Bangladesh using NOAA AVHRR data with geographical information system. Hydrol. Process. 2000, 14, 605–620. [Google Scholar] [CrossRef]
  34. Cochran, W.G. Sampling Technique; John Wiley and Sons: New York, NY, USA, 1977. [Google Scholar]
  35. McFeeters, S.K. The use of the Normalized Difference Water Index (NDWI) in the delineation of open water features. Int. J. Remote Sens. 1996, 17, 1425–1432. [Google Scholar] [CrossRef]
  36. Xu, H. A Study on Information Extraction of Water Body with the Modified Normalized Difference Water Index (MNDWI). J. Remote Sens. 2005, 9, 589–595. [Google Scholar]
  37. Nasiri, H.; Shahmohammadi-Kalalagh, S. Flood vulnerability index as a knowledge base for flood risk assessment in urban area. J. Nov. Applued Sci. 2013, 2, 269–272. [Google Scholar]
  38. Udnoon, S.; Pilailar, S.; Chittaladakorn, S. Evaluation of Bangkok Flood Vulnerability Index Using Fuzzy Inference System. KSCE J. Civ. Eng. 2022, 26, 987–1003. [Google Scholar] [CrossRef]
  39. Balica, S.F. Applying the Flood Vulnerability Index as a Knowledge Base for Flood Risk Assessment. Ph.D. Thesis, Delft University, Delft, The Netherlands, 2012. [Google Scholar]
  40. Awoyemi, A.E.; Olajide, O.A. Assessment of the Degree of Households’ Vulnerability to Climate Variability in Nigeria. In Handbook of Climate Change Resilience; Filho, L., Ed.; Springer: Cham, Switzerland, 2019; pp. 749–764. [Google Scholar] [CrossRef]
  41. Zakari, S.; Ibro, G.; Moussa, B.; Abdoulaye, T. Adaptation Strategies to Climate Change and Impacts on Household Income and Food Security: Evidence from Sahelian Region of Niger. Sustainability 2022, 14, 2847. [Google Scholar] [CrossRef]
  42. Narayanan, K.; Sahu, S.K. Effects of climate change on household economy and adaptive responses among agricultural households in Eastern Coast of India. Curr. Sci. 2016, 110, 1240–1250. [Google Scholar]
  43. Briguglio, L.; Cordina, G.; Farrugia, N.; Vella, S. Economic Vulnerability and Resilience: Concepts and Measurements. Oxf. Dev. Stud. 2009, 37, 229–247. [Google Scholar] [CrossRef]
  44. Cariolle, J. The Economic Vulnerability Index: 2010 Update; Fondation pour les études et recherches sur le développement International: Paris, France, 2010. [Google Scholar]
  45. Altimari, A.; Balzano, S.; Zezza, G. Measuring Economic Vulnerability: A Structural Equation Modeling Approach. In Proceedings of the Scientific Meeting of the Classification and Data Analysis Group of the Italian Statistical Society, Cassino, Italy, 11–13 September 2019; pp. 95–102. [Google Scholar] [CrossRef] [Green Version]
  46. Guillaumont, P. A Retrospective Economic Vulnerability Index, FERDI. 2009. Available online: https://ferdi.fr/en/indicators/a-retrospective-economic-vulnerability-index (accessed on 10 January 2022).
  47. Bigi, V.; Comino, E.; Fontana, M.; Pezzoli, A.; Rosso, M. Flood Vulnerability Analysis in Urban Context: A Socioeconomic Sub-Indicators Overview. Climate 2021, 9, 12. [Google Scholar] [CrossRef]
  48. Mallick, J.; Salam, R.; Amin, R.; Islam, A.R.M.T.; Islam, A.; Siddik, M.N.A.; Alam, G.M.M. Assessing factors affecting drought, earthquake, and flood risk perception: Empirical evidence from Bangladesh. Nat. Hazards 2022, 112, 1633–1656. [Google Scholar] [CrossRef]
  49. Tasnuva, A.; Hossain, R.; Salam, R.; Islam, A.R.M.T.; Patwary, M.M.; Ibrahim, S.M. Employing social vulnerability index to assess household social vulnerability of natural hazards: An evidence from southwest coastal Bangladesh. Environ. Dev. Sustain. 2021, 23, 10223–10245. [Google Scholar] [CrossRef]
  50. Ishtiaque, A.; Mahmud, M.S.; Rafi, M.H. Encroachment of Canals of Dhaka City, Bangladesh: An Investigative Approach. GeoScape 2014, 8, 48–64. [Google Scholar] [CrossRef] [Green Version]
  51. Zhang, L.; Yuan, B.; Yin, X.; Zhao, Y. The Influence of Channel Morphological Changes on Environmental Flow Requirements in Urban Rivers. Water 2019, 11, 1800. [Google Scholar] [CrossRef] [Green Version]
  52. Rahman, M.N.; Rony, M.R.H.; Jannat, F.A.; Pal, S.C.; Islam, M.S.; Alam, E.; Islam, A.R.M.T. Impact of Urbanization on Urban Heat Island Intensity in Major Districts of Bangladesh Using Remote Sensing and Geo-Spatial Tools. Climate 2022, 10, 3. [Google Scholar] [CrossRef]
  53. Islam, A.R.M.T.; Talukdar, S.; Mahato, S.; Ziaul, S.; Eibek, K.U.; Akhter, S.; Pham, Q.B.; Mohammadi, B.; Karimi, F.; Linh, N.T.T. Insight into farmers’ agricultural adaptive strategy to climate change in northern Bangladesh. Environ. Sci. Pollut. Res. 2021, 28, 34450–34471. [Google Scholar] [CrossRef]
  54. Fattah, A.; Morshed, S.R. Impacts of land use-based carbon emission pattern on surface temperature dynamics: Experience from the urban and suburban areas of Khulna, Bangladesh. Remote Sens. Appl. Soc. Environ. 2021, 22, 100508. [Google Scholar] [CrossRef]
  55. Hasnat, G.; Kabir, M.; Hossain, M. Major environmental issues and problems of South Asia, particularly Bangladesh. In Handbook of Environmental Materials Management; Hussain, C., Ed.; Springer: Cham, Switzerland, 2018; pp. 1–40. [Google Scholar]
  56. Hoque, S.; Peters, R.; Whitehead, P.; Hope, R.; Hossain, M.A. River pollution and social inequalities in Dhaka, Bangladesh. Environ. Res. Commun. 2021, 3, 095003. [Google Scholar] [CrossRef]
  57. Chang, H.H. River morphology and river channel changes. Trans. Tianjin Univ. 2008, 14, 254–262. [Google Scholar] [CrossRef]
  58. Potten, D. The impact of flood control in Bangladesh. Asian Aff. 1994, 25, 156–162. [Google Scholar] [CrossRef]
  59. Kabir, M.H.; Hossen, M.N. Impacts of flood and its possible solution in Bangladesh. Disaster Adv. 2019, 12, 48–57. [Google Scholar]
  60. Islam, M.R.; Raja, D.R. Waterlogging Risk Assessment: An Undervalued Disaster Risk in Coastal Urban Community of Chattogram, Bangladesh. Earth 2021, 2, 151–173. [Google Scholar] [CrossRef]
  61. Deepak, S.; Rajan, G.; Jairaj, P.G. Geospatial approach for assessment of vulnerability to flood in local self governments. Geoenviron. Disaster 2020, 7, 35. [Google Scholar] [CrossRef]
  62. Fatemi, N.; Okyere, S.A.; Diko, S.K.; Kita, M.; Shimoda, M.; Matsubara, S. Physical Vulnerability and Local Responses to Flood Damage in Peri-Urban Areas of Dhaka, Bangladesh. Sustainability 2020, 12, 3957. [Google Scholar] [CrossRef]
  63. Ahmadi, S.; Movahed, R.G.; Gholamrezaie, S.; Rahimian, M. Assessing the Vulnerability of Rural Households to Floods at Pol-e Dokhtar Region in Iran. Sustainability 2022, 14, 762. [Google Scholar] [CrossRef]
  64. Talukdar, S.; Ghose, B.; Shahfahad; Salam, R.; Mahato, S.; Pham, Q.B.; Linh, N.T.T.; Costache, R.; Avand, M. Flood susceptibility modeling in Teesta River basin, Bangladesh using novel ensembles of bagging algorithms. Stoch. Environ. Res. Risk Assess. 2020, 34, 2277–2300. [Google Scholar] [CrossRef]
  65. Näschen, K.; Diekkrüger, B.; Evers, M.; Höllermann, B.; Steinbach, S.; Thonfeld, F. The Impact of Land Use/Land Cover Change (LULCC) on Water Resources in a Tropical Catchment in Tanzania under Different Climate Change Scenarios. Sustainability 2019, 11, 7083. [Google Scholar] [CrossRef] [Green Version]
  66. Al-Bakri, J.T.; Salahat, M.; Suleiman, A.; Suifan, M.; Hamdan, M.R.; Khresat, S.; Kandakji, T. Impact of Climate and Land Use Changes on Water and Food Security in Jordan: Implications for Transcending “The Tragedy of the Commons”. Sustainability 2013, 5, 724–748. [Google Scholar] [CrossRef] [Green Version]
  67. Cook, S.E.; Fisher, M.J.; Andersson, M.S.; Rubiano, J.; Giordano, M. Water, food and livelihoods in river basins. Water Int. 2009, 34, 13–29. [Google Scholar] [CrossRef]
  68. Abdo, H.G. Evolving a total-evaluation map of flash flood hazard for hydro-prioritization based on geohydromorphometric parameters and GIS–RS manner in Al-Hussain river basin, Tartous, Syria. Nat. Hazards 2020, 104, 681–703. [Google Scholar] [CrossRef]
  69. Mohsenipour, M.; Shahid, S.; Chung, E.-S.; Wang, X.-J. Changing Pattern of Droughts during Cropping Seasons of Bangladesh. Water Resour. Manag. 2018, 32, 1555–1568. [Google Scholar] [CrossRef]
  70. Zinat, M.R.M.; Salam, R.; Badhan, M.A.; Islam, A.R.M.T. Appraising drought hazard during Boro rice growing period in western Bangladesh. Int. J. Biometeorol. 2020, 64, 1687–1697. [Google Scholar] [CrossRef] [PubMed]
Figure 1. Location map showing the study canal.
Sustainability 14 08341 g001
Figure 2. Study area and canal network in 1982.
Sustainability 14 08341 g002
Figure 3. MNDWI image map in different time period (1982–2019).
Sustainability 14 08341 g003
Figure 4. Present condition of the study canal in northern Bangladesh.
Sustainability 14 08341 g004
Figure 5. Spatial distribution of FVI values in the study canal area.
Sustainability 14 08341 g005
Figure 6. Spatial distribution of ACI values in the study canal.
Sustainability 14 08341 g006
Figure 7. Spatial distribution of EVI values in the northern Bangladesh.
Sustainability 14 08341 g007
Table 1. Flood vulnerability index (FVI) system components for the study.
IndicatorsAcronymFactor
Population densityPDExposure
Cultural HeritageCHExposure
Population growthPGExposure
% of disabled persons% DisabledSusceptibility
Child mortalityCMSusceptibility
Past experiencePEResilience
Awareness and preparednessA/PResilience
SheltersSResilience
Warning systemWSResilience
Evacuation on roadsERResilience
Emergency servicesESResilience
IndustriesIndExposure
Closeness to CanalCCExposure
UnemploymentUMSusceptibility
Urban growthUGSusceptibility
Human development indexHDISusceptibility
River dischargeRDSusceptibility
Flood insuranceFIResilience
Amount of investmentAmInvResilience
Dams storage capacityDScResilience
Dikes-levees or DamsDResilience
RainfallRainfallExposure
EvaporationEVExposure
Land UseLUExposure
TopographyTExposure
Storage over yearly runoffSC/V yearResilience
Table 2. Classification of flood vulnerability index (FVI) value.
FVI ValueDescription
<0.01Very small vulnerability to floods
0.01–0.25Small vulnerability to floods
0.25–0.50Vulnerable to floods
0.50–0.75High vulnerability to floods
0.75–1.00Very high vulnerability to floods
Table 3. Measurement levels of adaptive capacity index (ACI).
ACI Value LevelDescription
0–1.99Lowest (Very limited: No formalized adaptive capacity).
2–3.99Low (Basic: A low level of adaptive formal capacity).
4–5.99Medium (Appreciable: A modest level of formal adaptive capacity).
6–7.99High (Outstanding: Strong formal adaptive capacity).
8–10Highest (Optimal: Very strong formal adaptive capacity. Activity is planned, strategic, integrated and a part of everyday practice).
Table 4. Flood vulnerability index of the study canal area.
FVITotal FVIInterpretationUnion
Social0.0060.438Vulnerable to floodsDharanibari
Economic0.305
Environmental0.016
Physical0.111
Social0.0210.404Vulnerable to floodsDurgapur
Economic0.192
Environmental0.028
Physical0.163
Social0.0250.213Small vulnerability to floodsPandul
Economic0.099
Environmental0.011
Physical0.078
Social0.0190.703High vulnerability to floodsHatia
Economic0.315
Environmental0.024
Physical0.345
Table 5. Adaptive Capacity Index (ACI) of the study canal area.
Union NameACI ValueInterpretation
Dharanibari4.2Medium (Appreciable: A modest level of formal adaptive capacity)
Durgapur5.1Medium (Appreciable: A modest level of formal adaptive capacity)
Pandul6.7High (Outstanding: Strong formal adaptive capacity)
Hatia3.1Low (Basic: A low level of adaptive formal capacity)
Table 6. Economic Vulnerability Index (EVI) of the study canal area.
Union NameEVI ValueInterpretation
Dharanibari67.3Moderately vulnerable
Durgapur64.4Moderately vulnerable
Pandul57.8Vulnerable
Hatia72.8Highly vulnerable
Table 7. Relationships among ACI, FVI and EVI values in the study.
Correlations
ACIFVIEVI
ACIPearson Correlation1−0.968 *−0.998 **
Sig. (2-tailed) 0.0320.002
N444
FVIPearson Correlation−0.968 *10.983 *
Sig. (2-tailed)0.032 0.017
N444
EVIPearson Correlation−0.998 **0.983 *1
Sig. (2-tailed)0.0020.017
N444
*. Correlation is significant at the 0.05 level (2-tailed).; **. Correlation is significant at the 0.01 level (2-tailed).
Publisher’s Note: MDPI stays neutral with regard to jurisdictional claims in published maps and institutional affiliations.

