Article

Evaluating the Inequality of Medical Resource Allocation Based on Spatial and Non-Spatial Accessibility: A Case Study of Wenzhou, China

1
School of Public Health and Management, Wenzhou Medical University, Wenzhou 325035, China
2
Zhejiang Provincial Key Laboratory of Watershed Sciences and Health, Wenzhou Medical University, Wenzhou 325035, China
3
Department of Land, Air, and Water Resources, University of California, Davis, CA 95616, USA
4
Research Center for Healthy China, Wenzhou Medical University, Wenzhou 325035, China
5
School of Geography Science and Geomatics Engineering, Suzhou University of Science and Technology, Suzhou 215009, China
*
Author to whom correspondence should be addressed.
Sustainability 2022, 14(14), 8331; https://doi.org/10.3390/su14148331
Submission received: 22 May 2022 / Revised: 5 July 2022 / Accepted: 5 July 2022 / Published: 7 July 2022
(This article belongs to the Section Health, Well-Being and Sustainability)

Abstract

:
Environmental and social factors influencing resource allocation in rural, developing regions are critical social determinants of health that necessitate cross-sector collaboration to improve health opportunities. Thus, we sought to evaluate the spatial distribution and accessibility of medical resources to assess existing disparities, identify best practices for resource allocation, and inform regional health planning policies. In this study, inequality in the frequency distribution of medical resources in Wenzhou, China, was measured using the Gini coefficient and agglomeration degree. We evaluated the spatial accessibility of medical institutions throughout the city using the modified hierarchical two-step floating catchment area (H2SFCA) method. Using the Spearman correlation analysis, we investigated the factors influencing accessibility differences. The results indicate that Wenzhou’s spatial distribution of medical resources is unbalanced and unequal. According to the population and geographic distribution, the distribution of medical resources in Wenzhou is unequal. Wenzhou’s overall spatial accessibility is poor. The east region is more accessible than the west region, and the accessibility of medical institutions at different levels varies greatly. The correlation between accessibility and the number of institutions, doctors, population density, road density, and GDP is positive. There is a need for policies and initiatives to enhance the geographical distribution of resources, construct interconnected road networks, and improve residents’ access to medical resources.

1. Introduction

One of the 2030 global strategic goals of the United Nations is to ensure healthy lives and promote well-being for all individuals, including providing access to high-quality healthcare [1]. Nonetheless, the acceleration of urbanization and the increase in population density in urban regions facilitated by migration have created obstacles to the equitable and efficient allocation of medical resources. The disparate distribution of medical resources has jeopardized public health and safety and exacerbated social conflicts [2]. Furthermore, the spread of the COVID-19 pandemic has exacerbated the shortage of resources and strained the existing medical infrastructure [3]. The most significant effect is that the unprecedented medical demand far exceeds the hospital’s service capacity, resulting in a shortage of beds and other medical facilities and an enormous crisis for front-line workers, such as an increased risk of infection and decreased resistance [4]. Furthermore, with the improvement of China’s market-oriented economy because of reform and opening, the existing medical resources and services find it difficult to meet the needs of rapid economic growth and an aging population [5]. Currently, the supply of medical resources in China displays an “inverted triangle” pattern; high-quality medical resources are primarily concentrated in metropolitan areas and large hospitals, whereas grassroots medical institutions have few high-quality talents and poor service capacity. Most medical resources and patients are concentrated in tertiary hospitals, which account for 8% of all medical institutions and are primarily located in urban areas [6]. In addition, the income disparity between regions widened, resulting in the unbalanced development of regional medical and health infrastructure and the unbalanced distribution and allocation of medical resources. Although many efforts have been made to rationalize the allocation of medical resources, issues such as imbalanced distribution, regional sharing, and limited mobility of medical resources remain [7].
The allocation of medical resources mirrors that of public facilities. Teitz’s original proposal centered on allocating public facilities to maximize efficiency and equity, considering their location, accessibility, distribution pattern, impact on the city, and externalities [8]. Accessibility is crucial in determining the degree of equalization of medical services. The accessibility of medical institutions reflects the public’s access and convenience to medical services and impacts the enhancement of residents’ quality of life [9]. Accessibility is affected by both spatial and non-spatial factors. Spatial factors primarily include the distance or time cost from residential areas to hospitals; non-spatial factors include the attribute characteristics of medical institutions (such as scale, grade, and quantity), as well as the residents’ attributes (economic income, medical preference, vehicle, and population) [10]. The primary methods for measuring spatial accessibility include the ratio method [11], the nearest distance method [12], the gravity model [13], the Huff model [14], and the two-step floating catchment area (2SFCA) method [15].
The 2SFCA method is widely used in recent studies to demonstrate the accessibility of health care facilities, among the other methods mentioned [16,17,18,19,20]. It considers the effects of supply, demand, and distance and is more intuitive to interpret and calculate. However, the 2SFCA has been sharply criticized due to distance decay, entailing that the allure of medical institutions to residents has diminished with increasing distance [21]. Several researchers have attempted to enhance the 2SFCA methods to address this deficiency. The enhanced two-step floating catchment area (E2SFCA) method presented by Luo and Qi [22] assigns different weights to travel time zones. Dai [23] incorporated a Gaussian function to model the effect of distance decay. Wang et al. [24] examined the difference in medical care between minority and non-minority areas in Sichuan Province using a modified version of the 2SFCA method. In contrast, a few studies have attempted to enhance the 2SFCA method by incorporating non-spatial factors. When defining health professional shortage areas, Wang et al. [25] demonstrated the accessibility of primary care facilities by incorporating spatial and non-spatial factors. By integrating health needs and mobility into the 2SFCA algorithm, McGrail et al. [26] proposed an index of rural access to primary care. Jin et al. [27] proposed a hierarchical two-step floating catchment area (H2SFCA) method for evaluating the spatial accessibility of public medical resources, considering factors at various levels of medical resources. In order to evaluate the accessibility and equality of medical institutions at various levels, a modified H2SFCA approach incorporating both spatial and non-spatial impact factors is utilized in this study.
Wenzhou, a prosperous city on China’s eastern coast, is selected as a case study location. Wenzhou’s terrain consists primarily of mountains and islands surrounded by water. These distinctive geomorphic features result in uneven urban development and regional variations in the allocation of medical resources. Consequently, the study’s objectives are as follows: The traditional health economics method determines whether medical resources are distributed equitably across the population and regions. The accessibility analysis method is then utilized to determine whether medical institutions at all levels (mainly primary health care centers) can meet the medical needs of residents. Thus, the results and understandings of the study can be used to guide the reasonable distribution and flow of medical resources in Wenzhou, as well as to provide theoretical guidance for enhancing living conditions and promoting the equitable distribution of medical resources in that region.

2. Materials and Methods
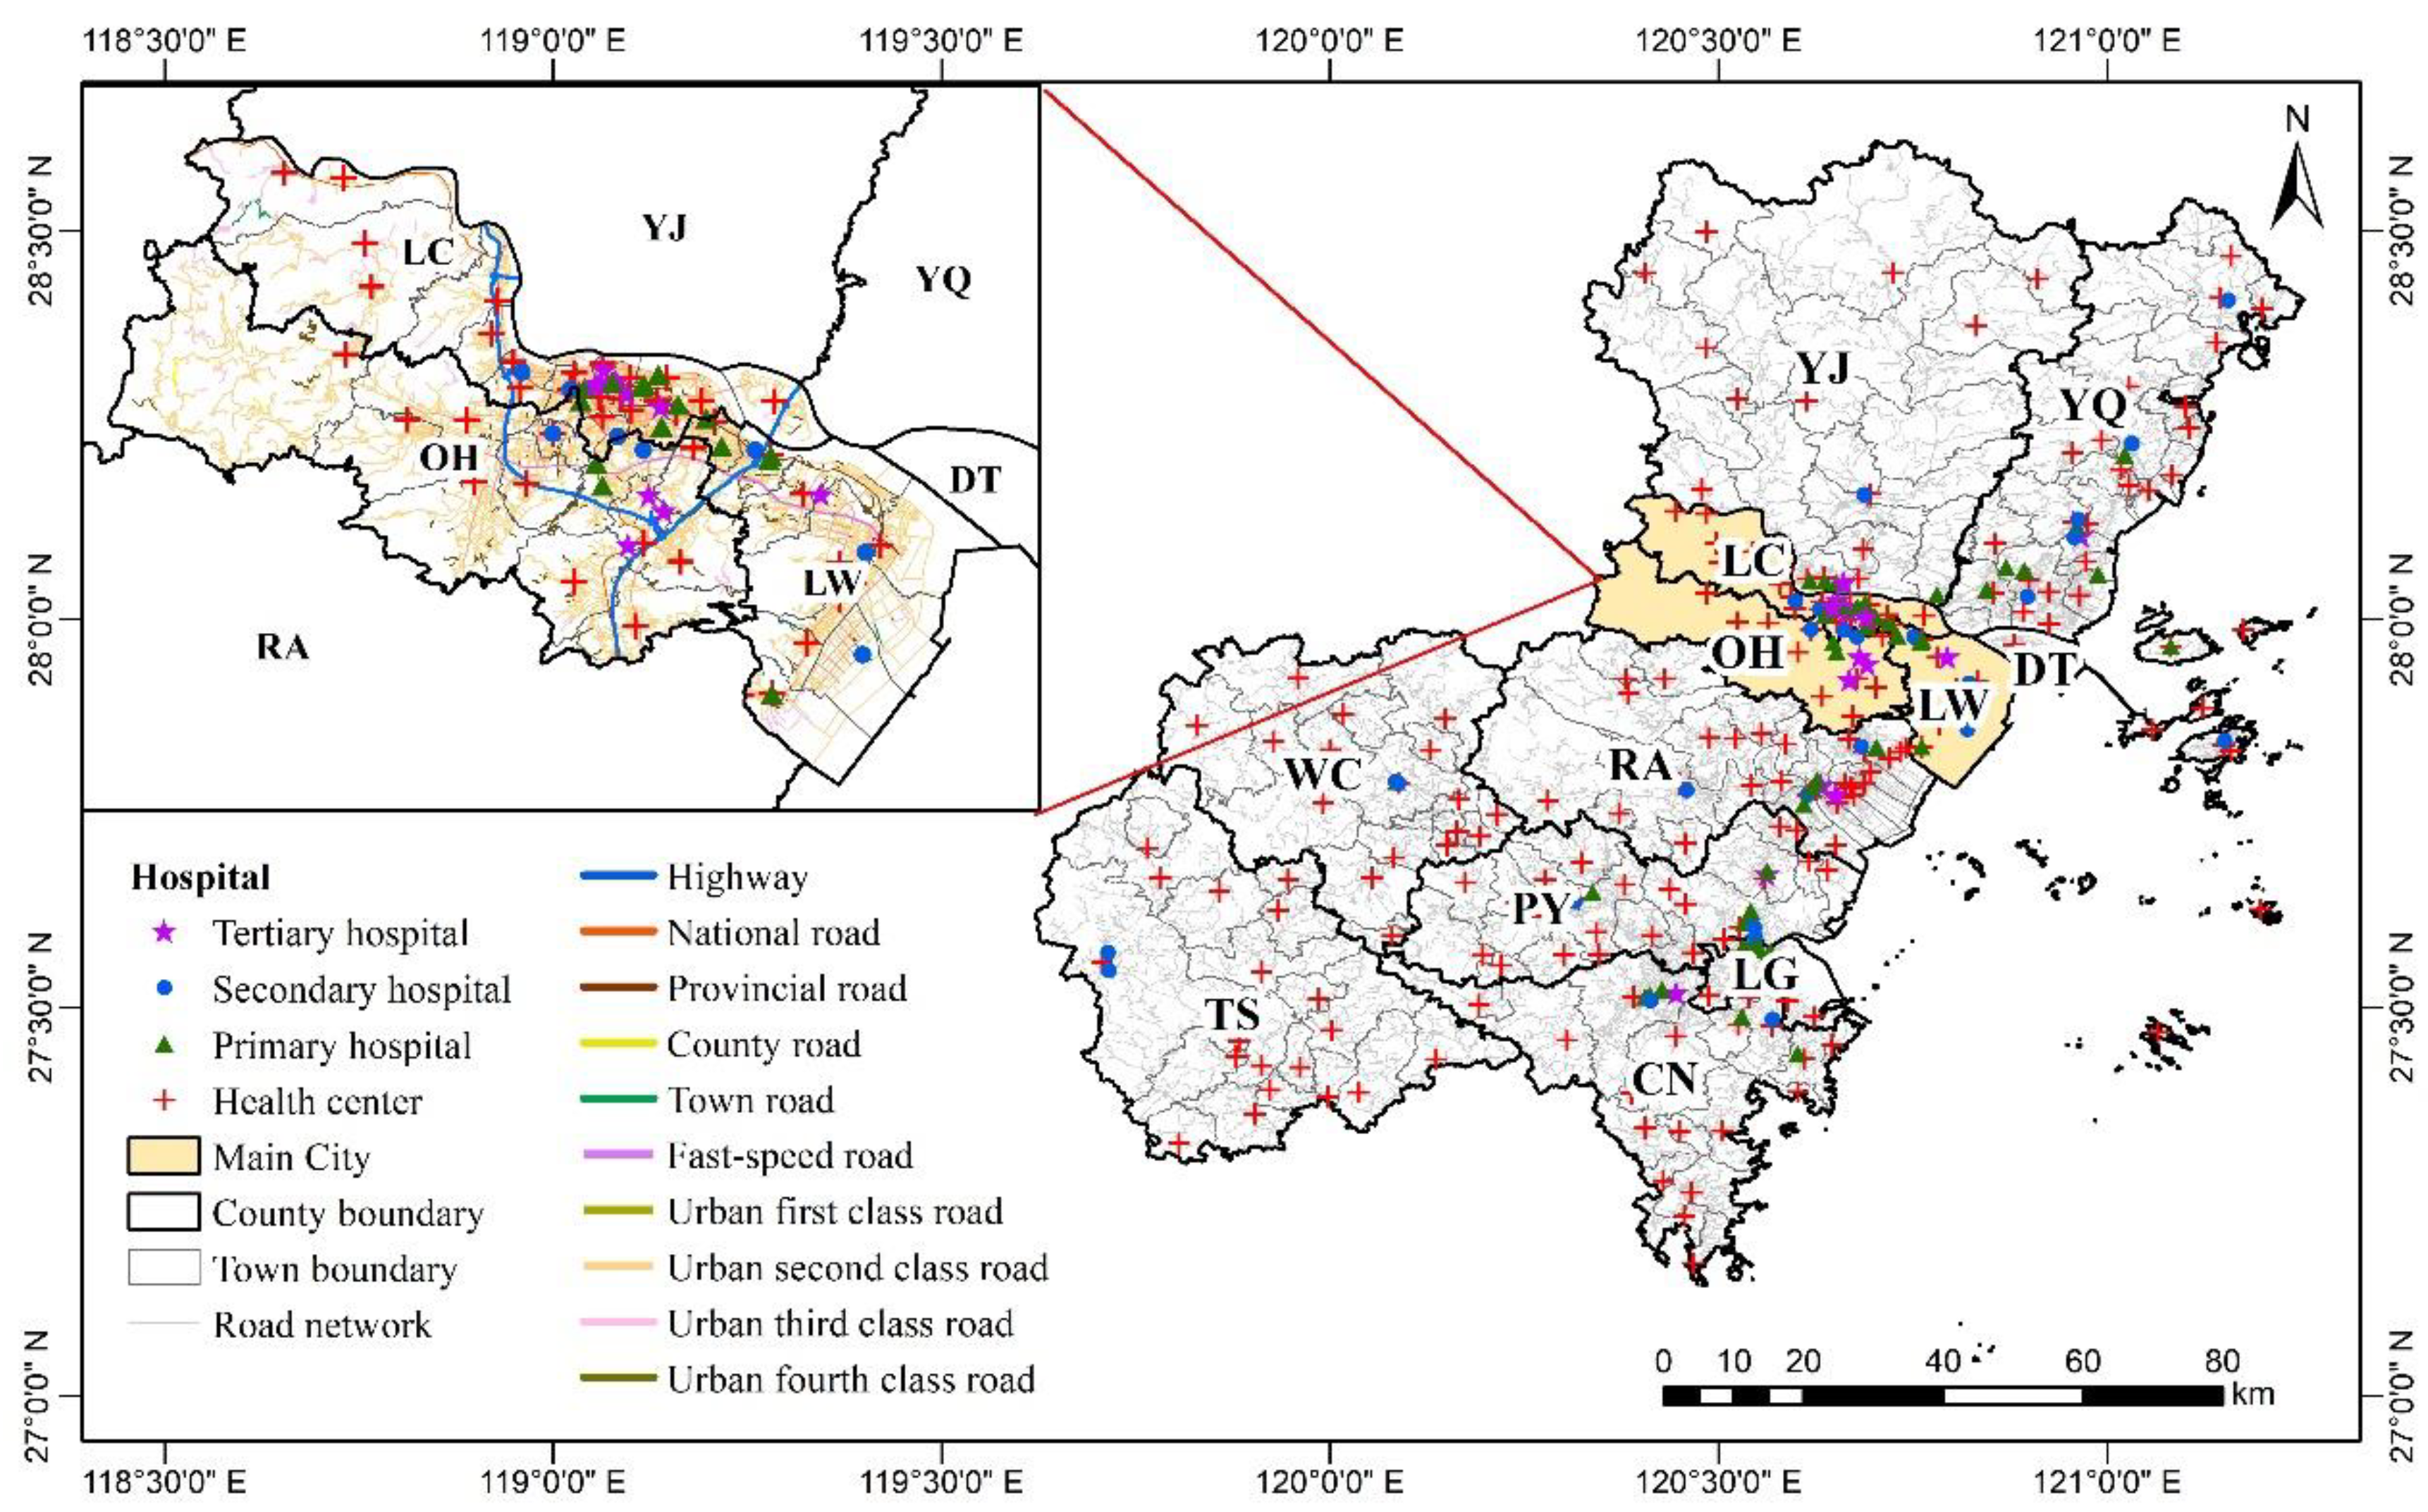
2.1. Study Area

The study area is the Wenzhou municipal region, which is in the southeast of Zhejiang Province, China, and is the economic hub of southern Zhejiang (Figure 1). The municipal region encompasses a total area of 12,109 km2. Wenzhou had a permanent population of 9.30 million, a registered population of 8.32 million, and a GDP per capita of 71,225 yuan by the end of 2019. There are four central urban districts: Lucheng District (LC), Longwan District (LW), Ouhai District (OH), and Dongtou District (DT). In addition, there are five counties: Yongjia County (YJ), Pingyang County (PY), Cangnan County (CN), Wencheng County (WC), and Taishun County (TS). Finally, there are three county-level cities: Ruian City (RA), Yueqing City (YQ), and Longgang City (LG). In addition, 185 smaller administrative districts served as the spatial units for the accessibility analysis, with 67 subdistricts in the urban area and 118 towns in the rural area.
In recent decades, Wenzhou has continuously increased the quality of its medical infrastructure and optimized the distribution of its medical resources to meet its residents’ medical and health needs. According to the Wenzhou Statistical Yearbook and the Wenzhou Local Chronicles Healthcare Development Statistical Bulletin, between 1978 and 2019, the number of medical institutions increased from 877 to 5794, the number of beds increased from 5826 to 44,038, the number of doctors increased from 4551 to 30,136, and the number of nurses increased from 1306 to 29,219.

2.2. Data Sources

2.2.1. Demographic and Economic Data

This study’s population data were obtained from the Wenzhou Statistical Yearbook 2020. As the population centroid represents the residential area’s location, the geometric center of the subdistrict/town shape was used. Therefore, the reference for the population data coordinate was CGS2000. The GDP data came from the Resources and Environment Science and Data Center and the Wenzhou Statistics Bureau (http://www.resdc.cn/data.aspx?DATAID=252) (accessed on 15 June 2021).

2.2.2. Medical Institutions’ Data

The medical institution data utilized in this study was obtained from the National Health Commission of the People’s Republic of China and the corresponding official websites, including level categories and doctor numbers. The total number of beds and health personnel in each district and county was obtained from the Wenzhou Health Commission. The locations of medical institutions were obtained through a manual search of the Wenzhou Tianditu Map (website). In Wenzhou, the medical facilities included general hospitals and community health centers. In addition, the specialized hospitals were excluded from this study because they were highly irreplaceable, and their spatial layout had little impact on residents’ medical treatment. In the end, 90 general hospitals and 200 community health centers were chosen. Medical institutions in China are divided into four levels based on their services: tertiary hospitals, secondary hospitals, primary hospitals, and community health centers. Figure 1 depicts the distribution of medical institutions.

2.2.3. Road Network

The Land and Resources Bureau provided the road network data with a WGS-1984 coordinate system reference. Based on the Technical Standard of Highway Engineering (JTG B01-2014) [28] and the actual situation in Wenzhou, the average speed of various types of roads was determined as follows: highways at 100 km/h; fast-speed roads at 80 km/h; national and provincial roads at 70 km/h; first-class urban roads at 50 km/h; county roads, town roads, second and third-class urban roads at 40 km/h; and urban fourth class roads at 30 km/h. Figure 1 depicts the distribution of road network systems.

2.3. Methods

2.3.1. Gini Coefficient

The Gini coefficient was a widely used indicator in economics that illustrated the disparity in income between residents of a country or region. In the past few decades, it has been widely utilized to measure the equality of medical resource allocation in terms of demographic and geographical factors [29]. In this study, we utilized it to examine the parity of institutions, beds, physicians, and nurses by population and geographic distribution. The Gini coefficient is calculated using the following formula:
G = i = 1 n W i Y i + 2 i = 1 n W i 1 V i 1
In Formula (1), G is the Gini coefficient;   W i is the cumulative proportion of i population or geographic area; Y i is the corresponding cumulative proportion of medical resources;   V i = Y 1 + Y 2 + Y n ; i is the fractional rank in per capita medical resources from the lowest to the highest.
The Gini coefficient ranges from 0 to 1; a value of 0 indicates an equitable distribution of resources or services [30]; a value of less than 0.2 indicates an absolutely fair distribution of resources or services; a value of 0.2–0.3 indicates a fair distribution; a value of 0.3–0.4 indicates a basic fair distribution; a value of greater than 0.4 triggers an alert of inequality; and above 0.6 reflects high inequality [31].

2.3.2. Agglomeration Degree

The Gini coefficient is only capable of measuring the equality of the overall resource distribution and is incapable of analyzing the circumstances within a region. To compensate for the deficiency of the Gini coefficient, we used agglomeration degree to measure the equality and differences in medical resource allocation in each district and county of Wenzhou [32]. The health resource agglomeration degree indicated the proportion of health resources in a particular region that occupied 1% of the country’s land area. The calculation formula is as follows:
H R A D i = ( H R i / H R n ) × 100 % ( A i / A n ) × 100 % = H R i / A i H R n / A n
In Formula (2),   H R A D i is the health resource agglomeration degree in the i region,   H R i is the number of health resources in the i region, A i is the land area in the i region,   A n is the land area of the country, and   H R n is the total number of health resources in the country.
The population agglomeration degree is defined as the proportion of a region’s population that occupies 1% of the country’s land area, and the formula for calculating it is as follows:
P A D i = ( P i / P n ) × 100 % ( A i / A n ) × 100 % = P i / A i P n / A n
In Formula (3),   P A D i is the population agglomeration degree in the i region, while   A i and A n have the same meaning as above. P i is the population in the i region, and   P n is the total population in the country.
Evaluation criteria: When the agglomeration degree of health resources is greater than 1, the geographical distribution of health resources is relatively more equitable. When the ratio of HARD to PAD is close to 1, the population’s medical needs are met by the region’s health resources, and residents have better access to health services. If the ratio is greater than 1, the region’s health resources are overcrowded; if it is less than 1, the resources are insufficient [33].

2.3.3. Network Analysis

To evaluate spatial accessibility, we utilized the origin and destination (OD) cost matrix from the network analysis toolbox of ArcGIS 9.3 (ESRI Inc., Redlands, CA, USA) to calculate the travel time costs between each residential area and all medical institutions. In addition, the network analysis module’s shortest path analysis was used to estimate the travel time costs from residential areas to the nearest community health center and general hospital.

2.3.4. Assessing Accessibility Using the Modified H2SFCA Method

Radke and Mu [15] first proposed the two-step floating catchment area (2SFCA) method, which considers both the demand and supply sides. The search is moved twice, beginning at the supply and demand points. In the first step, for each supply location j, we search all demand locations k within the search radius d0, then calculate the supply-demand ratio R j .
The formula is:
R j = S j k d k j d 0 D k
In Formula (4), S j represents the supply capacity at location j. d k j is the travel time between demand k and supply j. Finally, D k   is the population at the demand location.
In the second step, for each demand location i, we search all supply locations j within the search radius d0 and then sum up the supply-to-demand ratios R j .
The formula is:
A i F = j d i j d 0 R j = S j k d k j d 0 D k
In Formula (5),   A i F is the accessibility score of demand location i, while   d i j is the travel time between demand i and supply j.
The limitation of the conventional 2SFCA method is that it employs a dichotomous distance decay function if all individuals within a given catchment size utilize services equally. This paper adopted the modified H2SFCA method of determining catchment size according to different levels of medical institutions, comprehensively considering non-spatial factors such as hospital grade and number of doctors. The following is the model expression:
A i = l j d i j D l S j l f d i j k d k j D l P k f ( d k j )
where A i   is the accessibility at demand location i in a hierarchical system; l is the level of medical institutions in the system; S j l represents the doctors of institution j at level l; D l is the catchment size for institutions at level l; other variates have the same meaning as Formulas (4) and (5). The distance decay function f d i j takes the gravity power function form as follows:
f d i j = d i j β ,   d i j D l 0 ,   d i j > D l
where β is the distance–decay parameter, considering the urgency of health services, resulting in a more significant decay with increasing spatial distance [34]. Most β values in existing studies lie between 0.9 and 2.29 [35]. We compared the results of the travel friction coefficients of 1 and 2 and found that the value of accessibility of β = 2 has a more comprehensive fluctuation range and a more considerable dispersion degree than that of β = 1. Thus, this study set β to 2. Considering the abundant medical resources and the advanced medical technology in tertiary hospitals, the D l for tertiary hospitals was set to 190 min, the maximum distance between each tertiary hospital and the corresponding residential area. D l was set as 45 min for secondary hospitals and 15 min for primary hospitals and community health centers.
Following the distribution of accessibility scores, we categorized accessibility scores using Natural Breaks Classification, dividing them into seven distinct categories: Worst, Worse, Bad, General, Good, Better, and Best.

2.3.5. Correlation Analysis

SPSS 20.0 (IBM Corp., New York, NY, USA) was used to investigate the factors influencing the spatial accessibility of medical institutions in various subdistricts/towns by employing the Spearman correlation analysis.

3. Results

3.1. General Description of Medical Institutions

In 2019, Wenzhou had 5794 medical institutions with 4.74 beds per thousand residents, 3.24 physicians per thousand residents, and 3.14 nurses per thousand residents. The number of beds, physicians, and nurses per thousand people in LC is higher than the average level in Wenzhou. In contrast, the average level is lower in other districts and counties.
It is evident from Table 1 that the distribution of medical resources in Wenzhou is highly disparate. The largest concentration of medical institutions (mainly tertiary hospitals) is in LC, followed by RA, YQ, and PY. DT and LG have the fewest medical facilities. WC, TS, and DT have the lowest number of general hospitals, and LG, DT, and LW have the lowest number of health centers. According to the outline of China’s medical and health service system planning (http://www.gov.cn) (accessed on 24 June 2021), there will be 6 beds per thousand resident population, 2.5 physicians per thousand resident population, and 3.14 nurses per thousand resident population by the year 2020. Compared to the national standard, the number of beds per thousand people in Wenzhou is lower, the number of physicians per thousand people is higher, and the number of nurses per thousand people is close to the national standard.

3.2. Equality in Medical Resource Distribution

As shown in Table 2, the G of medical institutions is well below 0.2, indicating absolute fairness; the G of physicians is between 0.2 and 0.3, indicating fairness; the G of beds is between 0.3 and 0.4, indicating basic fairness; and the G of nurses exceeds 0.6, indicating high inequality. It shows that the distribution of medical institutions by population is superior to that of nurses by population. In addition, except for medical institutions, the Gini coefficients of beds, nurses, and physicians by geography are all greater than 0.5, exceeding the “equality alert line of 0.4”, with the G of doctors being 0.667, indicating that the distribution of these medical resources (especially doctors) by geography is unfair. By comparing the Gini coefficient by population and geography, it is possible to conclude that the distribution of beds and doctors concerning the population is relatively balanced. In contrast, it is unreasonable in terms of geographical distribution. The distribution is unreasonable if nurses are distributed based on population or geographic regions. The allocation of medical resources in Wenzhou, China, in 2019 exhibits the phenomenon of agglomeration, particularly in terms of space.
Based on the regional classification analysis (Table 3), the agglomeration degree of various medical resources in LC, LW, YQ, and LG are all greater than 1, with LC being significantly higher than the other regions, indicating that the four regions have greater geographical allocation equality. In contrast, the agglomeration degree of various medical resources in DT, YJ, WC, and TS is less than 1, indicating that these regions have less geographical distribution equality. For example, the degree of agglomeration of institutions, beds, physicians, and nurses in LC is 22 times, 90 times, 60 times, and 100 times that in TS, respectively. Based on the ratio of health resource agglomeration to population agglomeration, the ratios of various medical resources in LC are greater than 1, indicating that LC has abundant medical resources relative to its population size. In LW, OH, and RA, the ratios of institutions, physicians, and nurses are greater than or close to one. In contrast, the ratio of beds is less than one, indicating that the number of institutions and medical personnel is relatively abundant compared to the hardware facilities. In other districts and counties, the ratios of various medical resources are all less than 1, indicating that the available medical resources cannot meet the needs of the local population.

3.3. Shortest Travel Time Cost to Medical Institutions

Using the shortest path analysis, we determine the shortest travel time between residential areas and the closest health centers and general hospitals, respectively (Figure 2). The less time residents spend traveling to the nearest medical facility, the greater their accessibility. On average, it takes 6.41 min to reach the nearest health center, 166 residential areas (89.73%) have access to health centers within 15 min, and 17 residential areas (9.519%) are covered within 15–30 min. Only two residential areas, located on the eastern and western edges of YJ, require more than 30 min to reach the nearest health center. On average, more than half of residential areas (51.89%) can obtain medical services from general hospitals within 15 min, 36 residential areas (19.46%) can obtain medical services from general hospitals within 15–30 min, 28 residential areas (15.14%) are covered within 30–45 min, and 9 residential areas require more than 60 min to reach the nearest general hospital, primarily in the northwestern and northeastern regions of YJ. In addition, four residential areas on the islands of DT, RA, and PY cannot reach general hospitals within 180 min. Due primarily to the lack of medical resources and road network connections, residents cannot receive medical care within the required timeframe.

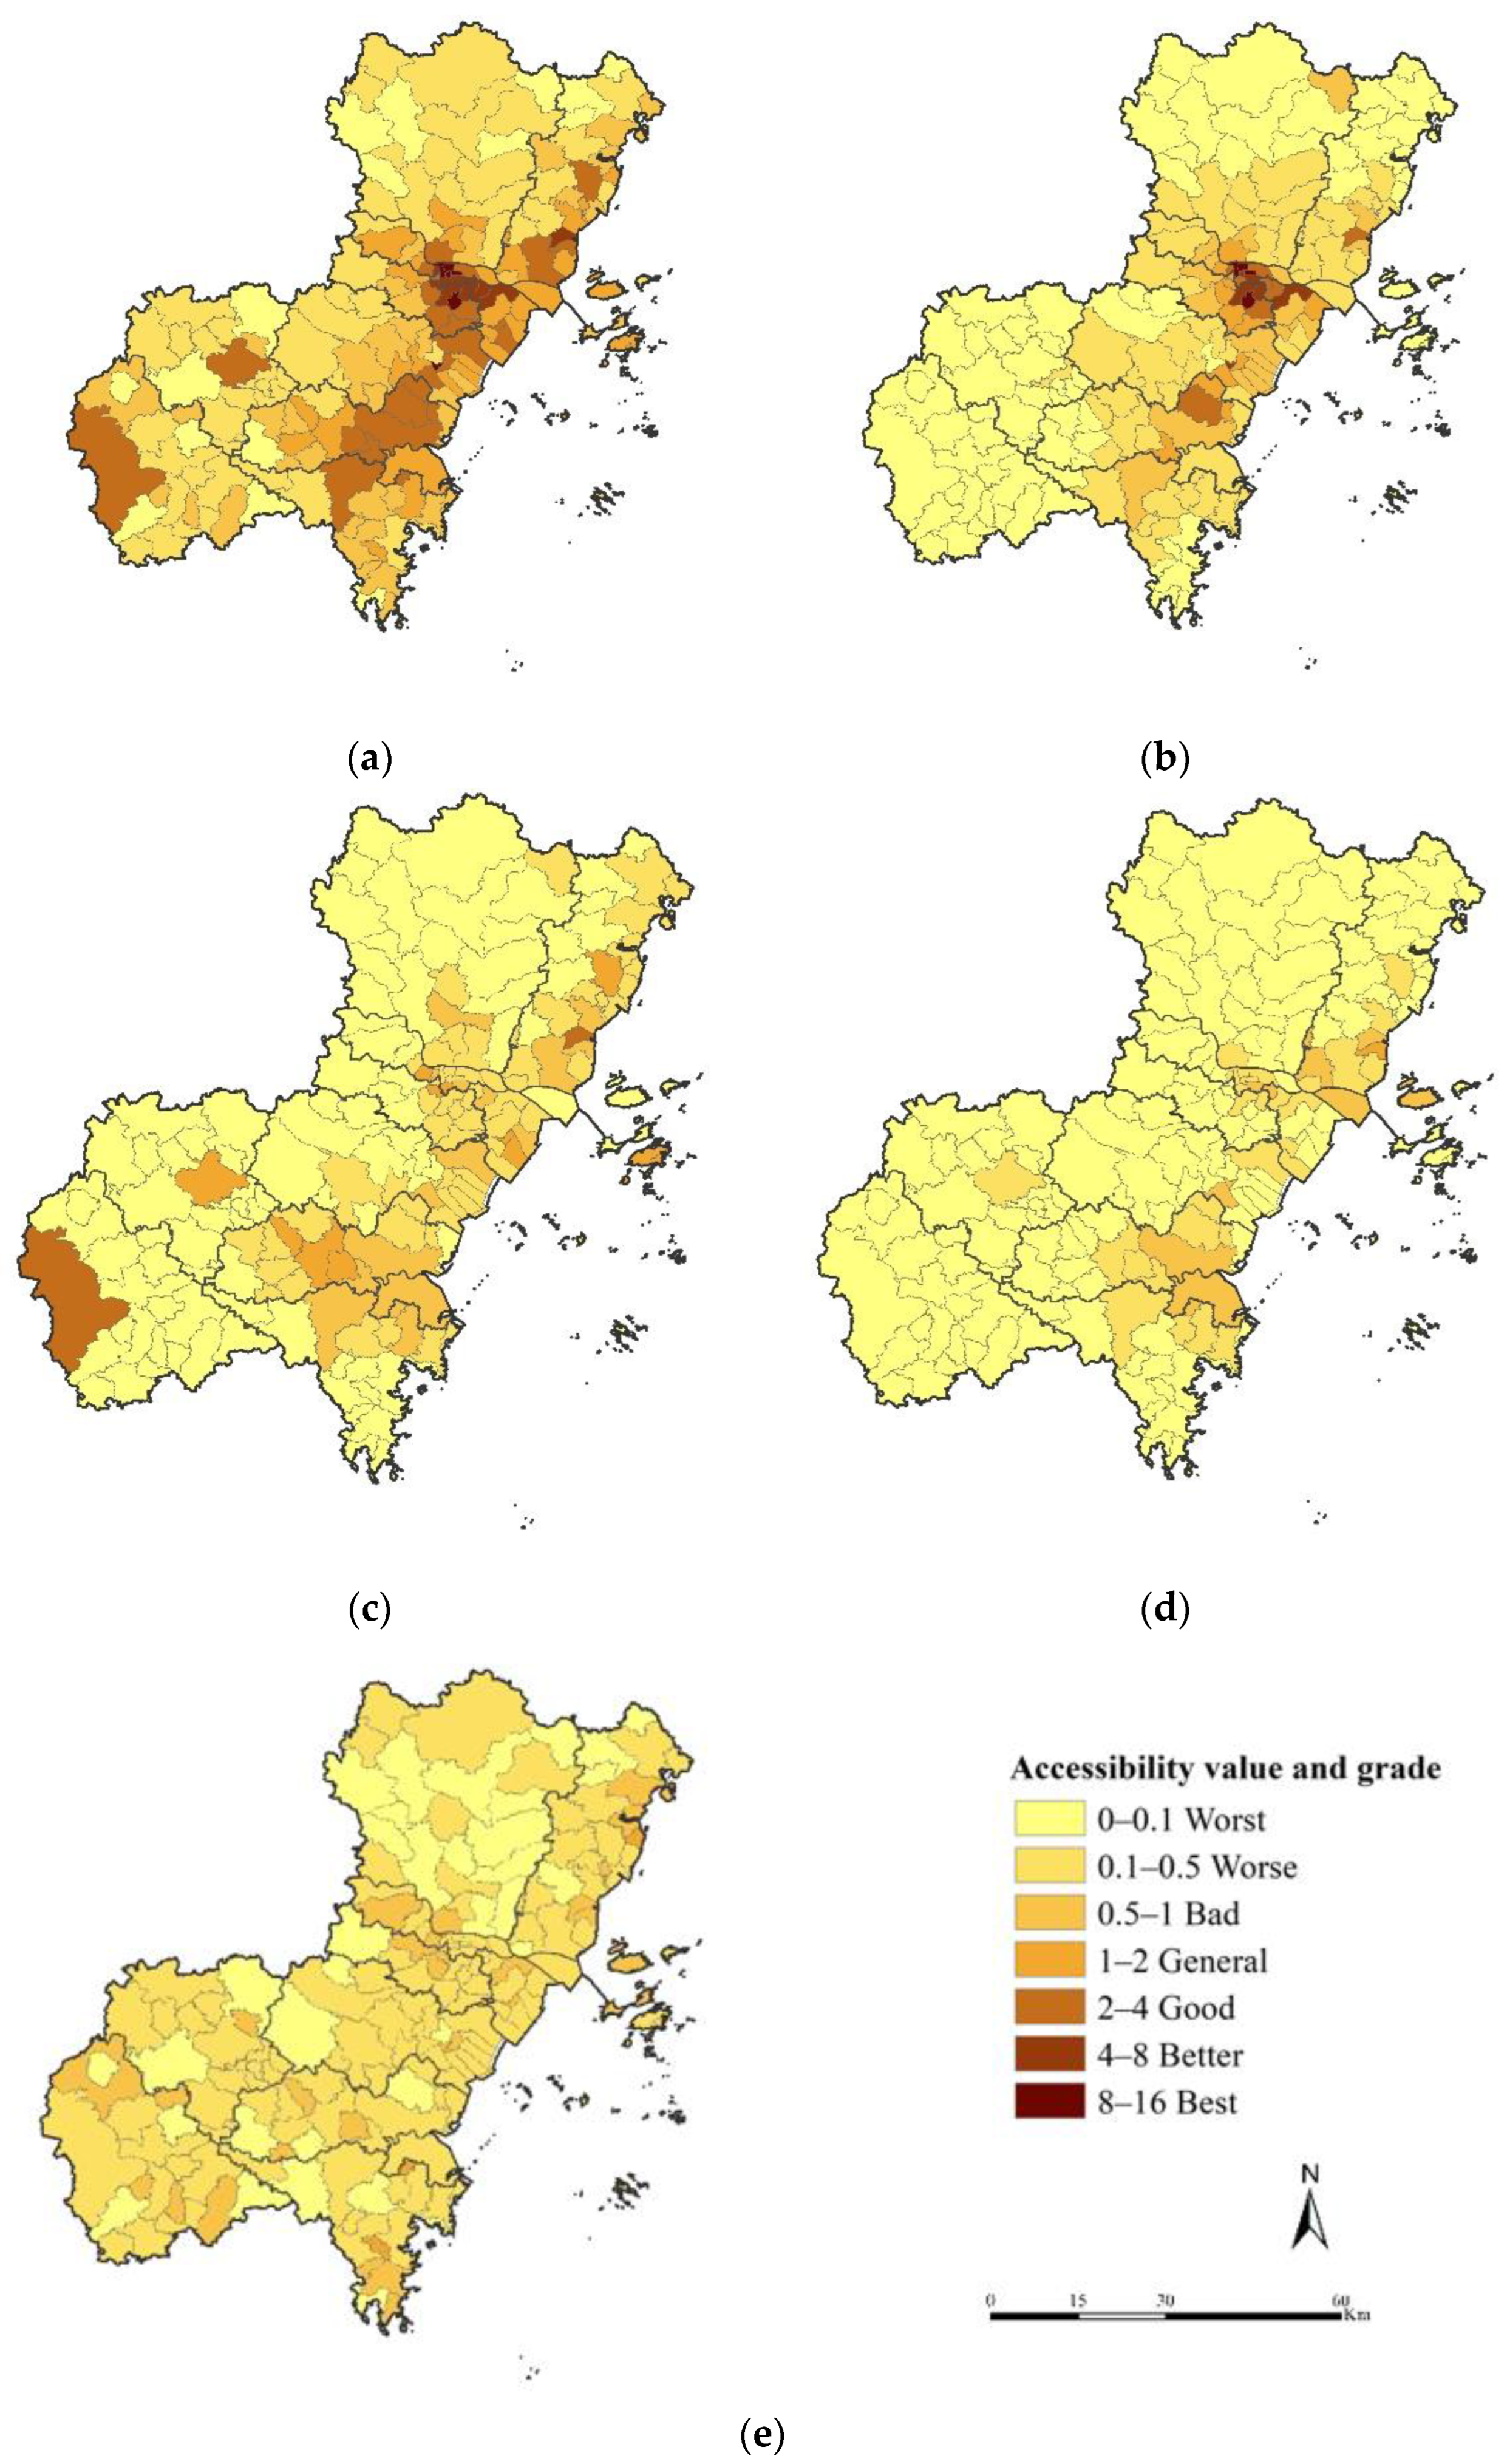
3.4. Spatial Accessibility of Medical Institutions at All Levels

Based on the modified H2SFCA, the total accessibility in Wenzhou was calculated by adding the accessibility to all levels of medical institutions. The accessibility score reflects the number of physicians per thousand people in medical institutions. The higher the accessibility score, the greater the availability of medical resources per capita in the region. As shown in Figure 3a, the spatial accessibility of medical facilities in Wenzhou varies significantly. Few residential areas have the highest accessibility, and most residential areas (n = 144) have general or below-average accessibility, resulting in poorer overall accessibility. The areas with the highest accessibility overall are concentrated in urban cores such as LC. The spatial accessibility of RA and YQ is relatively good, while that of WC and TS is comparatively poor. In general, spatial accessibility is more significant in the east than in the west.
There are substantial differences in the distribution of medical institution accessibility at all levels (Figure 3b–e). Accessibility to tertiary hospitals is unevenly distributed, with a noticeable concentration in urban areas. The accessibility of tertiary hospitals in LC is the highest, generally consistent with their distribution. Unlike tertiary hospitals with excellent central accessibility, secondary hospitals in LC no longer have the best accessibility at this level. LC has the highest population density, whereas secondary hospitals are dispersed and relatively evenly distributed in most regions. The spatial accessibility of primary hospitals is the worst among all levels of medical institutions, and TS has the lowest accessibility because it lacks a primary hospital. The distribution of health center accessibility is relatively even, but the accessibility scores of health centers in most residential areas are generally low (n = 185). The lack of physicians in health centers and the limited availability of medical resources are the primary causes.
According to Figure 4, the overall accessibility of more than three-quarters of the residential areas is General and below, including 64.5% of the population. In comparison, the overall accessibility in grades of Good and above covers only 22.2% of the residential areas but contains 35.5% of the population, indicating that the overall accessibility of Wenzhou is poor. The population is relatively concentrated in areas with better accessibility. In tertiary and secondary hospitals, the proportion of residential areas with accessibility grades of Bad and above exceeds 80%, covering more than four-fifths of the population and indicating that most residents lack access to high-quality medical care. In addition, the accessibility grades of primary hospitals and health centers are all General or lower, indicating that the service level of primary hospitals and health centers is inadequate and that the current medical service level must be enhanced.

3.5. Correlations between Spatial Accessibility and Influence Factors

Accessibility scores (Table 4) are positively correlated with the number of medical institutions, the number of physicians, population density, road density, and GDP, with road density having the strongest correlation and GDP having the weakest. The greater the number of medical institutions, the more treatment options residents have, and the higher the accessibility score. There is a strong relationship between the number of medical institutions and physicians. More medical institutions equal more physicians. As a result, most physicians will choose to practice in regions where medical resources are concentrated, resulting in a significant disparity in the accessibility score. Medical treatment is more accessible and convenient for residents as population density increases. Consequently, most medical institutions will be constructed close to the road network, and road density is one of the primary reasons for the variation in accessibility. In regions with a greater population density, accessibility is enhanced, and the number of accessible hospitals is relatively high, allowing residents to meet their medical needs. Hospital accessibility is relatively better in economically developed areas, such as LC, YQ, and RA, which are economically developed and have better hospital accessibility.

4. Discussion

4.1. Unbalance Spatial Distribution of Medical Resources and the Need to Improve Geographical Equality

The geographical distribution of all medical resources in Wenzhou is grossly unfair, and other studies have found similar results [36,37]. On the one hand, this relates to the allocation of resources in China, where the amount of health resources per thousand population is typically used as the primary indicator [38]. This method does not account for geographical factors when allocating medical resources, resulting in a concentration of medical resources in densely populated areas. On the other hand, the allocation of medical resources is positively correlated with the level of regional economic development, and well-developed regions typically have relatively higher allocation levels [39]. To improve the equity of health resource allocation, it is recommended that the government pay more attention to geographical equality when formulating regional planning, improve the mechanism of medical resource allocation, and allocate more medical resources to remote and underdeveloped areas [40]. For the problems of excessive medical resources in central urban areas such as LC and lack of medical resources in districts and counties such as TS, measures should be taken to promote the sinking of medical resources into each district and county to achieve a cross-regional flow of resources. In light of the significant disparities in resources between districts and counties in Wenzhou, the government should adopt macro-control and formulate regional health planning, considering factors such as population, geography, and economic level, to reduce disparities in the allocation of medical resources between regions.
Population and geographically speaking, the distribution of nurses is highly asymmetrical. Due to the influence of geographical location, medical staff is more likely to choose employment in central urban areas, which can easily lead to an excessive concentration of talents in the central city while the medical staff is in short supply in remote areas. Therefore, it is recommended that the government prioritize the equality of nursing resources to enhance human health. First, it is necessary to increase investments in human health resources, enhance the nursing performance system, enhance the nursing staff’s welfare, and fortify the stability of the nursing team. Second, it should issue related employment guidance policies to encourage college graduates to choose employment in remote urban areas and give them personnel preferences in terms of staffing and promotion [41]. Third, it must improve primary nurses’ theoretical and practical levels by bolstering the flow of nursing staff, implementing counterpart assistance, and expanding opportunities for further study. In the end, it will encourage the equitable distribution of nursing resources across diverse regions, populations, and medical institutions at all levels to ensure the accessibility of medical services.

4.2. Apparent Differences in Medical Resources Accessibility at All Levels and the Need to Strengthen the “Graded Diagnosis and Treatment” Policy

Comparing the travel time and cost to the nearest medical institutions with the spatial distribution of the overall accessibility score reveals that the shorter the travel time and cost from residential areas to the nearest medical institutions, the more convenient it is for residents to travel, and the greater the accessibility score in this area and the number of accessibility hospitals.
Wenzhou’s spatial accessibility is poor, and its heterogeneity is evident. LC is the most accessible, whereas WC and TS are inaccessible; such disparity is due to the unequal distribution of medical resources. LC is the central city with a dense population, a developed economy, and convenient transportation. It is supported by a medical university that collects abundant high-quality medical resources. In contrast, WC and TS are located in the southwest, where economic development is relatively lagging, and the government’s investment in medical resources is insufficient. The sparsely populated area, low road density, and long travel time for residents result in limited access to healthcare services. It is proposed that the government should actively strengthen road network construction in remote areas, particularly in WC, TS, and the northwest of YJ. In addition, areas with greater accessibility exist not only in the urban core but also in certain towns, such as the northwestern region of LW, where population density is lower, and the per capita acquisition of medical resources is relatively adequate. In general, spatial accessibility is more significant in the east than in the west. The primary causes of this spatial disparity are terrain and altitude [10]. The eastern portion is plain with low altitude and favorable medical conditions. In contrast, the western portion is a mountainous region with relatively high altitude, high travel costs, and limited accessibility.
All levels of medical institutions are now significantly more accessible. In order to improve spatial accessibility and reduce the inequality of medical services at all levels, it is necessary for medical institutions at various levels to implement corresponding measures. Building new high-quality hospitals in the periphery can improve accessibility for tertiary hospitals [9]. It is recommended that the quality of existing hospitals be enhanced for secondary hospitals. In areas with limited accessibility to TS and YJ, the government should increase financial investment and construct primary hospitals. Although the number of health centers exceeds that of general hospitals and nearly 90% of residential areas are within 15 min of the nearest health center, the accessibility scores of health centers are low, indicating that the medical services provided by health centers cannot meet the demand of residents. The government should take full advantage of the proximity of health centers by transferring high-quality medical resources from prestigious hospitals to health centers and enhancing their service capacity [42]. Moreover, as an effective complement to the public healthcare system, private hospitals have the potential to enhance the spatial accessibility of medical services significantly. The government can use tax incentives to encourage the development of private medical institutions in remote areas where medical resource allocation is relatively inadequate [43,44]. Lastly, and most importantly, the government should continue to promote the “graded diagnosis and treatment” policy and improve the medical insurance reimbursement system to resolve the problem of residents’ medical treatment fundamentally. The community should extensively publicize the functional positioning, service contents, service items, and daily hygiene knowledge in hospitals at all levels, transform residents’ notion of medical treatment, and reasonably guide them to seek treatment. The family should possess a sense of individual responsibility. Eventually, a medical pattern will emerge: “going to the health center for minor illnesses and the hospital for serious illnesses.”

4.3. Limitations

Most studies indicate that urban areas are more accessible than rural areas, and those plain areas are more accessible than mountainous areas, which may result from economic, geographical, and social development differences [34]. This study chose Wenzhou as its research location, and the outcomes reflected the characteristics above. This study’s findings help comprehend the allocation of medical resources in Wenzhou and provide a foundation for the relevant departments to develop reasonable plans and layouts. The framework and methods of this study can be applied to other areas, thereby guiding policymakers in efficiently allocating medical resources. This study has several limitations, which we hope to address in future research. First, due to data limitations, the population data is at the subdistrict/town level, and the location of residential areas is not precisely located, which affects the score’s accuracy. Second, the impact of demographic factors on accessibility is not considered. In conclusion, the service capacity of medical institutions is determined solely by the number of physicians, without regard to the subjective preferences of residents seeking medical care.
Wenzhou exemplifies the problem of supporting public service in Chinese cities due to the limited spatial distribution of medical resources in urban areas. However, the modeling can also be applied to other public services in other countries and regions, particularly regions with apparent heterogeneity in public service resources, which has significant policy-guiding implications [45]. Future research should consider more dimensions of spatial accessibility, such as population, socioeconomic, and cultural barriers, to improve the accuracy of accessibility.

5. Conclusions

In this study, health economics and the modified H2SFCA method were used to assess the distribution of medical resources and the accessibility of various levels of medical institutions, respectively. Spearman correlation analysis was used to investigate the factors influencing accessibility differences. Based on the findings, the following inferences can be made. (1) The distribution of medical resources in Wenzhou is unbalanced, with a high concentration of medical resources in LC and relatively few in WC, TS, and DT. (2) According to population and geographic distribution, the distribution of medical resources in Wenzhou is inequitable. (3) Wenzhou’s spatial accessibility is poor overall; the east regions are more accessible than the western regions, and hierarchical medical institutions are accessible differently. (4) There is a positive correlation between accessibility and the number of institutions, doctors, population density, road density, and GDP. To reduce regional disparities and increase the efficiency of medical resource allocation, the government should consider population and geographical factors when formulating health plans. In addition, the government should increase financial investment in economically depressed regions, strengthen hospital construction, and improve traffic conditions to meet the demand for medical care among residents.
The findings revealed the characteristics of spatial accessibility of hierarchical facilities and proposed policy recommendations for improving the hierarchical medical system in Wenzhou, which will hopefully increase equity in providing medical services to residents. Furthermore, our study contributes to the existing literature on measuring the accessibility of hierarchical medical facilities. The proposed recommendations can serve as a benchmark for other comparable mid-sized cities in China. Therefore, areas with fewer services will be prioritized in the future when allocating public health resources.

Author Contributions

Conceptualization, M.D. and K.M.; methodology, K.M.; software, M.D and L.F.; formal analysis, M.D.; resources, T.F. and Y.Z.; writing—original draft preparation, M.D.; writing—review and editing, M.Z. and K.M.; visualization, H.H.; funding acquisition, K.M. All authors have read and agreed to the published version of the manuscript.

Funding

This research was supported by Science and Technology Bureau of Wenzhou (S2020001).

Institutional Review Board Statement

Not applicable.

Informed Consent Statement

Not applicable.

Conflicts of Interest

The authors declare no conflict of interest.

References

  1. United Nations. Transforming Our World: The 2030 Agenda for Sustainable Development 2015. Available online: https://sdgs.un.org/2030agenda (accessed on 13 September 2021).
  2. Dong, E.; Liu, S.; Chen, M.; Wang, H.; Chen, L.-W.; Xu, T.; Wang, T.; Zhang, L. Differences in regional distribution and inequality in health-resource allocation at hospital and primary health centre levels: A longitudinal study in Shanghai, China. BMJ Open 2020, 10, e035635. [Google Scholar] [CrossRef] [PubMed]
  3. Emanuel, E.J.; Persad, G.; Upshur, R.; Thome, B.; Parker, M.; Glickman, A.; Zhang, C.; Boyle, C.; Smith, M.; Phillips, J.P. Fair allocation of scarce medical resources in the time of COVID-19. N. Eng. J. Med. 2020, 382, 2049–2055. [Google Scholar] [CrossRef] [PubMed]
  4. Malik, M.A. Fragility and challenges of health systems in pandemic: Lessons from India’s second wave of coronavirus disease 2019 (COVID-19). Glob. Health J. 2022, 6, 44–49. [Google Scholar] [CrossRef] [PubMed]
  5. Liu, W.; Xia, Y.; Hou, J. Health expenditure efficiency in rural China using the super-SBM model and the Malmquist productivity index. Int. J. Equity Health 2019, 18, 111. [Google Scholar] [CrossRef]
  6. Yang, F.; Yang, Y.; Liao, Z. Evaluation and analysis for Chinese medical alliance’s governance structure modes based on preker-harding model. Int. J. Integr. Care 2020, 20, 14. [Google Scholar] [CrossRef]
  7. Zhang, X.; Zhao, L.; Cui, Z.; Wang, Y. Study on Equity and Efficiency of Health Resources and Services Based on Key Indicators in China. PLoS ONE 2015, 10, e0144809. [Google Scholar] [CrossRef] [Green Version]
  8. Bigman, D.; ReVelle, C. The theory of welfare considerations in public facility location problems. Geogr. Anal. 1978, 10, 229–240. [Google Scholar] [CrossRef]
  9. Tao, Z.; Cheng, Y.; Zheng, Q.; Li, G. Measuring spatial accessibility to healthcare services with constraint of administrative boundary: A case study of Yanqing District, Beijing, China. Int. J. Equity Health 2018, 17, 7. [Google Scholar] [CrossRef] [Green Version]
  10. Liu, S.; Qin, Y.; Xu, Y. Inequality and influencing factors of spatial accessibility of medical facilities in rural areas of China: A case study of Henan Province. Int. J. Environ. Res. Public Health 2019, 16, 1833. [Google Scholar] [CrossRef] [Green Version]
  11. Neutens, T. Accessibility, equity and health care: Review and research directions for transport geographers. J. Transp. Geogr. 2015, 43, 14–27. [Google Scholar] [CrossRef]
  12. Rosero-Bixby, L. Spatial access to health care in Costa Rica and its equity: A GIS-based study. Soc. Sci. Med. 2004, 58, 1271–1284. [Google Scholar] [CrossRef]
  13. Joseph, A.E.; Bantock, P.R. Measuring potential physical accessibility to general practitioners in rural areas: A method and case study. Soc. Sci. Med. 1982, 16, 85–90. [Google Scholar] [CrossRef]
  14. Huber, C.; Watts, A.; Grills, A.; Yong, J.H.E.; Morrison, S.; Bowden, S.; Tuite, A.; Nelson, B.; Cetron, M.; Khan, K. Modelling airport catchment areas to anticipate the spread of infectious diseases across land and air travel. Spat. Spatio-Temporal Epidemiol. 2021, 36, 100380. [Google Scholar] [CrossRef] [PubMed]
  15. Radke, J.; Mu, L. Spatial decompositions, modeling and mapping service regions to predict access to social programs. Ann. GIS 2000, 6, 105–112. [Google Scholar] [CrossRef]
  16. Guagliardo, M.F. Spatial accessibility of primary care: Concepts, methods and challenges. Int. J. Health Geogr. 2004, 3, 3. [Google Scholar] [CrossRef] [Green Version]
  17. Langford, M.; Higgs, G. Measuring potential access to primary healthcare services: The influence of alternative spatial representations of population. Prof. Geogr. 2006, 58, 294–306. [Google Scholar] [CrossRef]
  18. Cervigni, F.; Suzuki, Y.; Ishii, T.; Hata, A. Spatial accessibility to pediatric services. J. Community Health 2008, 33, 444–448. [Google Scholar] [CrossRef]
  19. Mao, L.; Nekorchuk, D. Measuring spatial accessibility to healthcare for populations with multiple transportation modes. Health Place 2013, 24, 115–122. [Google Scholar] [CrossRef]
  20. Luo, J.; Tian, L.; Luo, L.; Yi, H.; Wang, F. Two-step optimization for spatial accessibility improvement: A case study of health care planning in rural China. BioMed Res. Int. 2017, 2017, 2094654. [Google Scholar] [CrossRef] [Green Version]
  21. Hashtarkhani, S.; Kiani, B.; Bergquist, R.; Bagheri, N.; Vafaeinejad, R.; Tara, M. An age-integrated approach to improve measurement of potential spatial accessibility to emergency medical services for urban areas. Int. J. Health Plan. Manag. 2020, 35, 788–798. [Google Scholar] [CrossRef]
  22. Luo, W.; Qi, Y. An enhanced two-step floating catchment area (E2SFCA) method for measuring spatial accessibility to primary care physicians. Health Place 2009, 15, 1100–1107. [Google Scholar] [CrossRef] [PubMed]
  23. Dai, D. Black residential segregation, disparities in spatial access to health care facilities, and late-stage breast cancer diagnosis in metropolitan Detroit. Health Place 2010, 16, 1038–1052. [Google Scholar] [CrossRef] [PubMed]
  24. Wang, X.; Pan, J. Assessing the disparity in spatial access to hospital care in ethnic minority region in Sichuan Province, China. BMC Health Serv. Res. 2016, 16, 399. [Google Scholar] [CrossRef] [PubMed] [Green Version]
  25. Wang, F.; Luo, W. Assessing spatial and nonspatial factors for healthcare access: Towards an integrated approach to defining health professional shortage areas. Health Place 2005, 11, 131–146. [Google Scholar] [CrossRef] [PubMed]
  26. McGrail, M.R.; Humphreys, J.S. Measuring spatial accessibility to primary care in rural areas: Improving the effectiveness of the two-step floating catchment area method. Appl. Geogr. 2009, 29, 533–541. [Google Scholar] [CrossRef]
  27. Jin, M.; Liu, L.; Tong, D.; Gong, Y.; Liu, Y. Evaluating the spatial accessibility and distribution balance of multi-level medical service facilities. Int. J. Environ. Res. Public Health 2019, 16, 1150. [Google Scholar] [CrossRef] [Green Version]
  28. JTGB01-2014; Highway Bureau Ministry of Transport of The People’s Republic of China. Technical Standard of Highway Engineering. People’s Communications Press: Beijing, China, 2014; p. 120.
  29. Zhang, T.; Xu, Y.; Ren, J.; Sun, L.; Liu, C. Inequality in the distribution of health resources and health services in China: Hospitals versus primary care institutions. Int. J. Equity Health 2017, 16, 42. [Google Scholar] [CrossRef] [Green Version]
  30. Theodorakis, P.N.; Mantzavinis, G.D.; Rrumbullaku, L.; Lionis, C.; Trell, E. Measuring health inequalities in Albania: A focus on the distribution of general practitioners. Hum. Resour. Health 2006, 4, 5. [Google Scholar] [CrossRef] [Green Version]
  31. Yu, Q.; Yin, W.; Huang, D.; Sun, K.; Chen, Z.; Guo, H.; Wu, D. Trend and equity of general practitioners’ allocation in China based on the data from 2012–2017. Hum. Resour. Health 2021, 19, 20. [Google Scholar] [CrossRef]
  32. Wu, X.; Hu, Y.; Li, D.; Zhu, X.; Li, J.; Qi, Z. Study on the allocation equity of medical insurance designated retail pharmacies in Shenzhen. Chin. J. Health Policy 2021, 14, 28–34. [Google Scholar]
  33. Wang, Y.; Li, Y.; Qin, S.; Kong, Y.; Yu, X.; Guo, K.; Meng, J. The disequilibrium in the distribution of the primary health workforce among eight economic regions and between rural and urban areas in China. Int. J. Equity Heal. 2020, 19, 28. [Google Scholar] [CrossRef] [PubMed] [Green Version]
  34. Zhang, J.; Han, P.; Sun, Y.; Zhao, J.; Yang, L. Assessing spatial accessibility to primary health care services in Beijing, China. Int. J. Environ. Res. Public Health 2021, 18, 13182. [Google Scholar] [CrossRef] [PubMed]
  35. Peeters, D.; Thomas, I. Distance predicting functions and applied location-allocation models. J. Geogr. Syst. 2000, 2, 167–184. [Google Scholar] [CrossRef]
  36. Jin, J.; Wang, J.; Ma, X.; Wang, Y.; Li, R. Equality of medical health resource allocation in China based on the gini coefficient method. Iran. J. Public Health 2015, 44, 445–457. [Google Scholar]
  37. Li, Q.; Wei, J.; Jiang, F.; Zhou, G.; Jiang, R.; Chen, M.; Zhang, X.; Hu, W. Equity and efficiency of health care resource allocation in Jiangsu Province, China. Int. J. Equity Health 2020, 19, 211. [Google Scholar] [CrossRef]
  38. The State Council of China. The National Planning for Medical and Health Service System from 2015 to 2020, Government Document 2015. Available online: http://www.gov.cn/zhengce/content/2015-03/30/content_9560.htm (accessed on 13 September 2021).
  39. Huo, J. An Analysis of China Health Resource Allocation on the View of Economics; Ningbo University: Ningbo, China, 2011. [Google Scholar]
  40. Sun, J.; Luo, H. Evaluation on equality and efficiency of health resources allocation and health services utilization in China. Int. J. Equity Health 2017, 16, 127. [Google Scholar] [CrossRef] [Green Version]
  41. Yang, Z.; Li, N.X. Research on the equity of the nursing human resource allocation in China, 2013–2017. Mod. Prev. Med. 2021, 48, 858–861. [Google Scholar]
  42. Yue, J.; Fu, Q.; Zhou, Y.; Zhang, Y.; Ning, J.; Yin, G.; Tao, H. Evaluating the accessibility to healthcare facilities under the Chinese hierarchical diagnosis and treatment system. Geospat. Health 2021, 16, 995. [Google Scholar] [CrossRef]
  43. Pan, J.; Zhao, H.; Wang, X.; Shi, X. Assessing spatial access to public and private hospitals in Sichuan, China: The influence of the private sector on the healthcare geography in China. Soc. Sci. Med. 2016, 170, 35–45. [Google Scholar] [CrossRef]
  44. Gu, X.; Zhang, L.; Tao, S.; Xie, B. Spatial accessibility to healthcare services in metropolitan suburbs: The case of Qingpu, Shanghai. Int. J. Environ. Res. Public Health 2019, 16, 225. [Google Scholar] [CrossRef] [Green Version]
  45. Zhang, S.; Song, X.; Zhou, J. An equity and efficiency integrated grid-to-level 2SFCA approach: Spatial accessibility of multilevel healthcare. Int. J. Equity Health 2021, 20, 229. [Google Scholar] [CrossRef] [PubMed]
Figure 1. The distribution of medical institutions in the study area.
Sustainability 14 08331 g001
Figure 2. The travel time cost to nearest medical institutions: (a) general hospitals, (b) health centers.
Sustainability 14 08331 g002
Figure 3. The spatial accessibility of (a) all medical institutions, (b) tertiary hospitals, (c) secondary hospitals, (d) primary hospitals, and (e) health centers.
Sustainability 14 08331 g003
Figure 4. Proportions of residential area and population under different grades of hospital accessibility.
Sustainability 14 08331 g004
Table 1. Summary of administrative districts, areas, population, transportations, GDP, and medical resources in Wenzhou, 2019.
TownNumber of CountiesArea
(km2)
Registered Population (In Thousands)Road Length
(104 km)
GDP
(Billion Yuan)
Number of Medical InstitutionsNumber of Beds Per ThousandNumber of Doctors Per ThousandNumber of Nurses Per Thousand
Tertiary HospitalsSecondary HospitalsPrimary HospitalsHealth Centers
LC1429378613611376392313.446.898.73
LW1031934010570513491.422.061.65
OH13466463167661322111.591.71.42
DT72541553910801273.492.992.25
YJ222677988315445114143.783.012.34
PY161042884227510124254.783.122.63
CN181069970243352125186.813.383.49
WC171296411189105021173.623.362.8
TS191768373240111020194.473.42.61
RA23135012582991004234293.312.952.53
YQ25139113153031210156243.532.912.35
LG11843815030102542.452.262.07
Table 2. Gini coefficients for medical resources in Wenzhou, 2019.
Medical ResourcesPopulationGeography
Number of medical institutions0.0570.232
Number of beds0.3320.514
Number of doctors0.2320.667
Number of nurses0.6050.505
Table 3. Agglomeration degrees of population and medical resources in Wenzhou, 2019.
TownPopulationInstitutionsBedsDoctorsNurses
ValueRatioValueRatioValueRatioValueRatio
LC3.754.111.1015.34.0811.53.0615.004.00
LW1.893.011.591.080.572.301.211.901.01
OH1.391.921.380.860.621.340.971.160.83
DT1.180.890.750.540.460.680.580.530.45
YJ0.520.430.830.310.600.360.700.290.56
PY1.281.311.021.050.821.010.780.870.68
CN1.311.010.771.110.850.750.570.830.64
WC0.440.220.500.180.410.250.560.210.48
TS0.300.180.610.170.580.190.640.150.51
RA1.391.601.510.990.711.290.931.140.82
YQ1.431.551.091.030.721.240.871.040.73
LG3.573.500.981.690.472.280.642.150.60
Table 4. Correlations between spatial accessibility and influence factors.
Analysis IndexAccessibility ScoreNumber of Medical InstitutionsNumber of DoctorsPopulation DensityRoad Density
Number of medical institutions0.585 **
Number of doctors0.670 **0.799 **
Population density
(person/km2)
0.769 **0.493 **0.590 **
Road density
(km/km2)
0.792 **0.512 **0.592 **0.826 **
GDP (ten thousand)0.310 **0.374 **0.536 **0.326 **0.266 **
Note: ** Significant at 0.01 level (two-tailed).
Publisher’s Note: MDPI stays neutral with regard to jurisdictional claims in published maps and institutional affiliations.

