Article

Impact of Digital Finance on Regional Carbon Emissions: An Empirical Study of Sustainable Development in China

1
School of Business, Nanjing Normal University, Nanjing 210023, China
2
Ginlin College, Nanjing Normal University, Nanjing 210023, China
3
School of Business and Management, Queen Mary University of London, London E1 4NS, UK
4
School of Finance and Economics, Jimei University, Xiamen 361021, China
*
Author to whom correspondence should be addressed.
Sustainability 2022, 14(14), 8340; https://doi.org/10.3390/su14148340
Submission received: 12 June 2022 / Revised: 3 July 2022 / Accepted: 5 July 2022 / Published: 7 July 2022
(This article belongs to the Section Economic and Business Aspects of Sustainability)

Abstract

:
China is currently in the process of industrialization, and the excessive consumption of fossil energy results in a significant increase in carbon emissions. With the significant development of information technology and the digital economy, digital finance has gradually become a new model that affects human activities, motivating us to explore the relationship between digital finance and carbon emissions. Based on panel data from 278 cities from 2011 to 2019, this study empirically analyzes the relationship between digital finance and carbon emissions and discusses it in terms of the nonlinearity, regional heterogeneity, and spatial spillover effects. We find empirical evidence indicating that digital finance can mitigate regional carbon emissions. Finally, we propose some relevant suggestions for promoting sustainable and healthy development of digital finance, and achieving carbon emissions reduction.

1. Introduction

Since the industrial revolution, production and business activities worldwide have increased air pollutant emissions, primarily of carbon dioxide, which can significantly negatively impact on human production and life. An increase in carbon emissions can lead to climate warming and environmental pollution. To reduce the impact of carbon emissions on the environment and climate, in September 2020, China proposed in the United Nations General Assembly to make carbon dioxide emissions peak by 2030 and strive to achieve the two stages of carbon emission reduction goals of carbon neutrality by 2060. As a major carbon-emitting and energy-consuming country, achieving carbon peaking and carbon neutrality goals is a way to ensure energy security and promote sustainable energy development and is the main driving force for high-quality economic development and ecological civilization construction.
Existing studies generally agree that developing a low-carbon economy in China is based on transformation-driven approach among industries [1], particularly through the financial transformation pathway [2]. In recent years, the continuous progress of the Internet and digital technology based on big data, block chain, and artificial intelligence has been continuously applied to the financial industry. This brings new momentum to China’s monetary development in terms of information networks, intelligent algorithms, and data resources [3]. Digital finance, as a modern financial industry, is widely used in developing various industries because of its low cost, convenience, and other advantages that can break through traditional spatiotemporal financial restrictions [4]. This promotes the financial structural change and efficiency [5] to meet the development needs of a low-carbon economy to the greatest extent, to promote China’s sustainable development [6].
Concerning financial development and carbon emissions, some researchers argue that the development of finance helps reduce transaction costs and promote investment and financing, thereby improving the ecological environment [7]. At the same time, some studies indicate financial development and carbon emissions are correlated in more complicated patterns, such as an inverted U-shape between financial development and environment pollution [8]. Recently, in order to explore how financial development affects the environment, a growing number of papers have incorporated financial development into the analysis of the relationship between finance and the environment. Bai et al. study the mechanism by which financial development affects environmental change [9]. Some studies empirically show that the development of inclusive finance reduces carbon emissions, where its thresholds vary with the level of financial development [10]. The relationship between digital finance and regional carbon emissions is discussed above. Because some scholars have different opinions on the relationship between financial development and carbon emissions, this paper again examines the relationship between digital finance and regional carbon emissions using the two-way fixed effects, instrumental variables (IV) approach, spatial spillover effects, and the difference-in-difference (DID) model. The main research questions in this paper are the following: (1) What kind of impact does digital finance have on regional carbon emissions? (2) What are the relationships between the coverage breadth, usage depth, and digitization level of digital finance and regional carbon emissions, respectively? (3) When conducting heterogeneity analysis, how do different degrees of marketization, levels of financial development, and digitalization affect the results? We will explain these questions in the empirical analysis.
The low-carbon economic effect of financial development has become the focus of academia. Some studies have found that digital finance has become the cornerstone for developing the global digital economy and that digital platforms can guide the green transformation of various industries through information dissemination, thus promoting carbon peaking and carbon neutrality goals. There is a dual mechanism (indirect mechanism and direct mechanism) for the impact of digital finance on regional carbon emissions as an important supporting force for the implementation of green and sustainable development. In the indirect mechanism, digital finance can give full play to the connotation that technology is the means and finance is the essence; promote technological innovation and industrial upgrading; reasonably solve the problems of corporate financing dilemmas and industrial lag; and enrich the green financial services content while giving full play to the advantages of digital technology [11]. In the direct mechanism, digital finance uses mobile payment and Internet credit functions to build carbon trading channels on various mobile platforms, thereby reducing energy consumption and regional carbon emission intensity. Furthermore, a study argues that digital finance combines traditional finance with modern information science and technology, achieving online, paperless, and intelligent financial services. Digital finance reduces travel and paper usage, and promotes the development of green financial services such as green credit, green securities, and green investment, and it also guides people to pay attention to environmental protection in their lifestyle, thereby reducing carbon emissions [12]. The research mentioned above has solved the problems of the lack of innovation ability and service level in the financial field and promoted the process of green technology innovation and carbon reduction.
Based on the above analysis, this study constructs an analytical framework from the perspective of digital finance characteristics to explore the digital finance impact on regional carbon emissions and deeply explore the mechanism of its effect. Compared with the extensive research of traditional financial development on carbon emissions, there is rarely work on the impact of digital finance on carbon emissions, particularly from the view of the low-carbon economy. Zhou et al. empirically find that achieving carbon reduction requires policy, technical, and financial support [13]. In addition, reducing regional carbon emissions, especially the tertiary industry carbon emissions, will enable digital finance to improve total factor productivity [14]. Some researchers introduce digitization into the Solow growth model as technical progress and find an inverted U-shaped relationship between regional carbon emissions and digitization, consistent with the EKC hypothesis [15]. The above research either conducts simple empirical tests based on a small amount of data or consists of theoretical research without empirical evidence. Therefore, based on the existing literature, this paper constructs the scientific problem of low-carbon economic development from the perspective of digital technology and financial development, and attempts to explore the relationship between digital finance and regional carbon emissions in order to obtain more reliable conclusions.
Exploring the threshold characteristics, mechanisms, and heterogeneity effects between digital finance development and regional carbon emissions has theoretical significance and practical value for improving China’s digital finance development. Further analysis reveals that, because of the cross-regional spread of digital finance and the fluidity of air pollution, this study speculates that there will also be some spatial spillover effects between digital finance and carbon emissions.
The theoretical contributions of this paper are as follows: Firstly, low-carbon economy, environmental economy, and ecosystem are discussed theoretically, which enriches the research on digital finance and carbon emissions. Second, from the perspective of China’s “double carbon” target and financial development theory, it provides a new theoretical framework for the green effect of digital finance. The empirical contributions of this paper are as follows: First, the intrinsic link between digital finance and carbon emissions was tested and passed the robustness test. Second, the nonlinear relationship, regional heterogeneity, and spatial spillover effects between digital finance and carbon emissions are discussed. Third, to robustly assess the impact of digital finance on carbon emissions, we continue to use the smart city pilot as an exogenous policy shock and assess it using the DID model.
The remainder of this paper is organized as follows: Section 2 briefly reviews the relevant literature. Section 3 proposes the research hypothesis. Section 4 includes the data and methods. Section 5 presents the empirical results, which are the benchmark regression, robustness test, threshold estimation, heterogeneity analysis, and spatial spillover effect. Section 6 reports the results of the DID design, with parallel trend test, PSM-DID, placebo test, and others. Section 7 summarizes the main conclusions and proposes policy implications.

2. Literature Review

2.1. Environment and Low-Carbon Economic Development

Existing studies have shown that, in recent years, economic development and eco-environmental systems in China have been in the development trend of mutual coordination, the system coupling degree is generally at a high level, and the system coordination degree is also on the rise, but the overall coordination level of the system is low, and the development of each region varies significantly [16]. A good ecological environment can reduce damage to the environment, effectively reduce energy consumption [17], and unify economic development and environmental development, which can further promote technological innovation and achieve good economic returns.
In recent years, China has raised the level of awareness, depth of practice, and promotion of eco-economy construction to an unprecedented level, and eco-economy construction has been placed in a more important strategic position. China has continuously raised its financial support for ecological environmental protection and environmental pollution control, and investment in environmental protection has continued to grow. At the same time, China has been focusing on strengthening ecological and environmental information construction, has vigorously been promoting the construction of environmental big data projects, and has made significant progress in the integration and application of data resources. China has been implementing regional ecological economy development strategies, focusing on comparative advantages, and promoting the construction of ecological economy on a larger scale to achieve effective results [18].
Sustainable development of a low-carbon economy is the main model of current ecological economic development. Low-carbon economy is an economic model based on low energy consumption, low pollution, and low emissions, and is an inevitable choice to achieve a win–win situation for economic development and resource and environmental protection [19]. Under the dual pressure of China’s international commitment to greenhouse gas emission reduction obligations and the reduction of resource and energy consumption led by heavy chemical industries, China must adjust its industrial structure, change its economic growth mode, implement policies related to energy conservation and emission reduction, and must seek a balance between low-carbon emissions and economic development. The development of a low-carbon economy is a long-term goal for China’s economic development.
In early studies, the representative study on economic development and carbon emissions is the environmental Kuznets curve (EKC), which suggests that there is an inverted U-shaped relationship between economic development level and pollutant emissions, that is, the environmental pollution problem will become severe at the beginning of economic development. However, after crossing the inflection point, economic development will improve people’s incomes and living standards, which will also alleviate carbon emissions and environmental pollution. Since the introduction of the EKC hypothesis, there has been a partially supportive attitude toward the conclusions of the literature. Selden and Song found an inverted U-shaped relationship between per capita air pollutant emissions and per capita GDP using cross-country data for various air pollutants [20]. Hu and Wang investigated the existence of the EKC for carbon emissions using provincial panel data in China. They found that the EKC for carbon emissions per capita existed in the national sample in the eastern and central regions [21]. However, some studies have questioned the EKC hypothesis. Regarding its establishment conditions, Harbaugh concluded that the EKC hypothesis is not robust, and its establishment conditions are affected by the type of pollutant [22], location choice, and measurement method. Regarding its shape, some studies conclude that the relationship between economic growth and carbon emissions is not an inverted U-shaped, and some studies conclude that the EKC curve does not exist [23].
In recent years, owing to the rapid rise of the global low-carbon economy and China’s carbon peaking and carbon neutrality goals, many studies have begun to focus on developing a low-carbon economic transition. Frankel summarized the core meaning of a low-carbon economy as broad and narrow, and argued that from a narrow perspective, more emphasis is placed on the stage and coordination characteristics of the low-carbon economy. This sustainable development model considers economic development and environmental carrying capacity [24] and pays more attention to coordinating an energy–environment–economy (3E) system. Related studies have also conducted a comprehensive evaluation of regional low-carbon economy indicators. He and Zhang constructed a low-carbon economy indicator system based on the natural, industrial, and human ecosystems. They found that the region’s comprehensive situation of low-carbon economy development level remained good with overall planning [25]. In low-carbon economic development, the contradiction between the sharp increase in energy demand and decrease in carbon emissions is an important factor affecting China’s realization of carbon peaking and carbon neutrality goals. To achieve the goal as soon as possible, China needs to optimize the energy structure, improve emission reduction efficiency, and reduce production consumption of energy. Additionally, there is a need for local financial, monetary support, and industrial policy guidance to achieve the resource allocation green effect. In particular, regarding financial development, Shahbaz tested the conclusion that financial development in Malaysia reduces regional carbon emissions and leads to environmentally sustainable development [26]. Meanwhile, some studies have concluded that the higher the carbon price, the more significant the carbon reduction effect at the macro level. Comparing carbon tax and carbon trading policies shows that a reasonable carbon trading mechanism can mitigate the impact of the indirect carbon tax on China’s energy sector and macro economy to a certain extent.

2.2. The Green Effect of Financial Digitization

Finance is a key factor in the effective operation of a modern economy and is important for achieving rapid economic development [27]. Some studies have found that traditional finance is conducive to alleviating the financing constraints of some enterprises and improves resource allocation efficiency, which is an important way to achieve inclusive financial development. However, in the case of information asymmetry, traditional finance usually suffers from a high financing threshold and high offline network services cost. Some studies have begun to focus on the impact of digital technology on the quality and effectiveness of financial services to address this financial exclusion. With the rise of block chain technology, artificial intelligence, and big data technology, digital technology is being widely used in various fields, and digital finance is being developed. In the G20 High-Level Principles for Digital Financial Inclusion, digital finance broadly refers to all actions that promote financial inclusion through digital financial services [28]. Thus, digital finance provides efficient financial services, while the use of Internet technology is another means to meet society’s needs and achieve sustainable economic development [29]. Many studies verify this, and the results all show that digital finance can expand the financial scale and optimize the financial structure by improving inclusiveness characteristics and information transparency, thus promoting high-quality economic development [30].
In China’s carbon peaking and neutrality goals, many studies have begun to examine digital finance as an influencing factor for energy consumption, green total factor productivity, climate change, green environmental development, and green finance. A study found that digital finance can effectively reduce energy consumption per unit of GDP in the real economy by promoting the development of technology-intensive manufacturing and other paths, and is a new engine for green development in China. Puschmann measured green total factor productivity (GTFP) using an SBM model that includes non-desired output and explored the relationship between digital finance and GTFP and the underlying mechanism [31]. Puschmann concluded that digital finance could improve GTFP through indirect mechanisms such as technological innovation and regional entrepreneurship. A study on developing digital finance in Switzerland concluded that the region’s financial services industry is undergoing a major transformation. Supporting digital transformation and environmental sustainability is an important factor in improving the quality and effectiveness of green digital financial services and an effective means of mitigating local climate change. Some studies have also studied the green transformation of the industry using digital finance as a new financial development model in China and found that digital finance can significantly reduce the emissions of pollutants such as sulfur dioxide, industrial wastewater, and dust. However, its spatial heterogeneity is more obvious, showing the characteristics of ‘high in the east and low in the west’. Dong and Cai discussed the impact of financial digitization on the development of green finance using data from Chinese industrial listed enterprises [32]. They found that financial digitization has a facilitating effect on green finance in general. The test results were consistent with breadth, depth, and degree of digitization as sub-dimensions. All the above studies show that digital finance can promote the construction of a green-friendly ecosystem and thus achieve sustainable development in China.

2.3. Financial Development and Regional Carbon Emissions

The relationship between financial development and carbon emissions is discussed in the literature. Conversely, it has been argued that financial development can effectively curb carbon emissions and produce green effects. Tamazian and Rao analyzed capital markets and financial openness data in BRICS countries. They found that economic and financial development are determinants of environmental quality in BRICS countries and that higher financial openness and liberalization are associated with lower carbon emissions [33]. Subsequent studies have also confirmed the reliability of the conclusion that financial development does not come at the expense of the environment but rather curbs regional carbon emissions and energy consumption. For the government, financial development can provide more environmentally friendly construction projects for market operations, reduce financial pressure and burden [34], and achieve low-cost operations while reducing CO2 emissions. Regarding impact mechanisms, financial development can mitigate carbon emissions by easing corporate financing constraints [35], diversifying risks, promoting FDI flows, enhancing corporate social responsibility [36], and promoting industrial upgrading. Additionally, some studies have found that to focus on climate change, pollution control, and development in energy conservation and emission reduction, China supports and promotes construction of a green financial system to achieve differentiated financial policies [37]. China also mobilizes capital gathering and forms green investments. This will also provide capital elements for green production.
In contrast, some studies believe that financial development reduces carbon emissions and induces other environmental problems. At the level of economic development, enterprises can expand their financing through financial channels [38]. However, they will gradually neglect environmental governance issues under mass production pressure, which will lead to more serious energy consumption and increased pollution. He found that China’s natural resource-intensive industries have greater development advantages and profit margins [39] and have easy access to many financial resources. However, the natural resource-intensive industries generate greater pollution in their extraction and production, which is also detrimental to future green finance and sustainable development goals. Some studies have found that certain financial services for middle-class consumers expand domestic consumer demand. Among them, Sadorsky believes that financial development allows consumers to easily obtain loans to purchase large household appliances, which improves the consumption quality of the population but also increases the CO2 emissions of their lives [40].

3. Research Hypothesis

3.1. The Relationship between Digital Finance and Regional Carbon Emissions

Compared with the impact of traditional finance on carbon emissions, the literature on the impact of digital finance on carbon emissions is scarce, especially the lack of arguments from the low-carbon economic development perspective [41], and few studies have examined the impact of digital finance only in the context of the digital economy [42]. Zhou argues that policy, technology, and financial capital support are needed to achieve carbon emission reductions and examines this with panel data from China [43]. It is also found that the improvement of total factor productivity by digital finance can be achieved by reducing carbon emissions, especially in the tertiary sector. This again proves that digital finance has become an important tool for reducing carbon emissions in contemporary economic development. As a new economic model, some studies introduced digitization as a technological advancement into the Solow growth model while looking at the impact of import and export data on carbon emissions from digital delivery services provided by the United Nations Conference on Trade. It is found that there is an inverted U-shaped relationship between carbon emissions and digitization, which is consistent with the EKC hypothesis [44]. Some of the above studies only argue from a theoretical perspective and lack empirical evidence. Some studies have conducted empirical tests, but they also lack an exploration of China’s financial digital development. This study explores the relationship between digital finance and regional carbon emissions to obtain more reliable conclusions. Therefore, we propose Hypothesis 1 as follows:
Hypothesis 1 (H1).
Digital finance can mitigate carbon emissions.

3.2. Non-Linear Effects of Digital Finance on Regional Carbon Emissions

In the era of the Internet economy, digital finance development is supported by digital technologies such as big data, information networks, and intelligent algorithms [45], and carbon emissions reduction is one of the important goals of sustainable development. Therefore, this study also conducted a non-linear effect test using digital and green thresholds. Regarding the digital threshold, relevant studies have defined the difference in Internet information as a digital divide [46]. Expanding the digital divide will make the information gap form a polarization trend and be detrimental to the development of various industries in China [47]. Since the digital threshold indirectly reflects the willingness of residents to use the Internet [48], this paper proposes the digital threshold effect constituted by the digital divide. Regarding the green threshold, studies have found that digital finance can promote green innovation and green industrial development, and digital technology has its environment-friendly characteristics, causing less impact on environmental pollution. Therefore, digital finance can use digital technology to transform traditional industries and achieve intelligent industrial development to reduce energy consumption and carbon emissions. Additionally, some studies have found that the digital economy can reduce carbon emission intensity through green technological advances in carbon trading policies [49] to encourage companies to take the initiative to save energy and reduce emissions. Summarily, this study conjectures that the relationship between digital finance and carbon emissions may vary under different digital and green thresholds. Based on the above analysis, we propose Hypothesis 2 as follows:
Hypothesis 2 (H2).
The impact of digital finance on carbon emissions has a threshold effect under different levels of Internet development and green innovation.

3.3. Spatial Spillover Effects of Digital Finance and Carbon Emissions

With the rapid development of network technology, digital finance, with its digital and financial attributes, offers more possibilities for achieving carbon peaking and carbon neutrality goals and will have stronger penetration at the spatial level of green development [50]. In terms of digital attributes, most studies have concluded that today’s ICT has gradually covered all aspects of our life and production and has become a driving force for sustainable development in our country. Some studies have found that the spontaneous environmental regulation effect generated by Internet public opinion and keyword searches on Internet platforms also has an effect on emission reduction. Additionally, using Internet platforms as communication channels can better strengthen public awareness of energy saving in life and low-carbon production in enterprises, which can promote the development of a local low-carbon economy and generate spillover effects in neighboring areas. Some studies have tested the spillover effect of financial development on regional economic growth at the financial attribute level. Yan and An took the financial system function as a starting point to explore the financial development impact on green sustainable development and tested it through GIS tools and the spatial Durbin model. It was found that financial development can promote regional green development through capital support, resource allocation, enterprise supervision, and green finance and that there is a spatial spillover effect [51]. The above summary shows that digital technology and financial development can bring about certain green effects, and both should also have spatial spillover effects. Accordingly, we propose Hypothesis 3 as follows:
Hypothesis 3 (H3) .
 Spatial spillover effects exist between digital finance and carbon emissions in neighboring regions.

4. Methodology and Data

4.1. Baseline Regression Model

This study used panel data from 2011 to 2019 of 278 cities in China for the empirical analysis and constructed a benchmark model through time and region, as follows:
Y i t = α 0 + α 1 d f i t + α 2 X i t + μ i + τ t + ε i t
In Model (1), Y i t denotes regional carbon emissions, i and t   denote regions and years, α 1 denotes digital finance coefficient, d f i t is the digital finance development, X i t denotes each control variable, μ i denotes the fixed effect at the regional level, τ t denotes the year-fixed effect, ε i t is the random disturbance term.

4.2. Panel Threshold Model

To further explore the impact of digital finance on carbon emissions under different threshold effects, this study, based on the panel threshold model proposed by Hansen [52], measures the digital threshold by the ratio of the number of broadband access users to the total population. The study then analyzes the results of digital finance and carbon emissions in different digital threshold intervals through threshold regression. Additionally, this study uses the logarithm of the number of green utility model inventions in the current year to measure the green threshold and further explores the impact of digital finance on carbon emissions under the green threshold effect. Based on this, this study constructs a threshold regression model with digital and green thresholds as threshold variables as follows:
Y i t = φ 0 + φ 1 d f i t I T h r e s h t 1 + φ 2 d f i t I t 1 < T h r e s h t 2 + + φ 3 d f i t I t k < T h r e s h + φ 4 X i t + μ i + τ t + ε i t  
where T h r e s h is the digital threshold and green threshold and t 1 , t 2 , and t k are the threshold values of the threshold variables. φ 1 indicates the digital financial development effect on carbon emissions, without crossing the first threshold. φ 2 denotes the digital financial development effect on carbon emissions between the first and second thresholds. φ 3 indicates the digital finance effect on carbon emissions when the second threshold is exceeded. The meanings of the remaining variables were consistent with those of the baseline regression.

4.3. Spatial Model

4.3.1. Moran’s I

Before a spatial measurement can be performed, it must pass a spatial correlation test. There are two methods to test spatial correlation: First, global spatial correlation, which is usually tested using Moran’s I index. Second, the local spatial correlation is usually tested using a Moran scatter plot. The global spatial correlation was tested using Moran’s I index to examine the correlation between neighboring areas in the whole spatial region, to explore whether there is a spatial agglomeration effect, with the following formula:
M o r a n I = n i = 1 n j = 1 n W i j i = 1 n j = 1 n W i j X i X ¯ X j X ¯ i = 1 n X i X ¯
where X i is the sample observation of city i , n is the sample number of cities. W i j is the spatial weight matrix. The geographic distance matrix and economic distance matrix are chosen in this study to respond to the degree of association between individuals in terms of geographic space and economic behavior patterns, respectively. Moran’s I index ranges from −1 to 1. When Moran’s I index is positive, it indicates a positive spatial correlation. This means that if a region is better developed, its neighboring regions are also better developed and will show the regional agglomeration phenomenon with the same level of development. When the Moran index is negative, it indicates a negative spatial correlation. This means a region is better developed, but its neighboring cities are worse developed, showing the regional agglomeration phenomenon with different levels of development. If the Moran index is 0, there is no spatial correlation, and the development of such areas shows a random distribution.

4.3.2. Spatial Weights

In this study, we use the geographic distance weight matrix for analysis. As the spatial weight matrix is exogenous, the economic distance weight matrix is also used for robustness testing. Drawing on the study by Lin and Long [53], a geographic distance matrix was constructed with W i j d denoting the geographic distance weight and d denoting the inverse of the nearest road mile between regions as follows:
W i j d = 1 d i j , i j ; W i j d = 0 , i = j
Coordinated regional economic development also generates spillover effects, drawing on the study of Gottmann to construct an economic distance matrix with W i j e denoting the economic distance weights. The weights are set using the inverse of the difference in economic development levels between regions [54]. G D P i   and G D P j denote the mean regional GDP after deflating from 2011 to 2019.
W i j e = 1 G D P i G D P j , i j ; W i j e = 0 , i = j
The matrix was normalized in this study to avoid analysis errors. The sum of each row of the weight matrix was set to 1. The normalization is as follows:
W i j = W i j / j W i j

4.3.3. Spatial Model

To further discuss the spatial spillover effects of digital finance on carbon emissions, the baseline regression was extended to a spatial econometric model.
Y i t = α 0 + ρ j = 1 n W i j Y i t + δ 1 j = 1 n W i j d f i t + α 1 d f i t + α c X i t + ε i t
ε i t = λ j = 1 n W i j ε i t + μ i 0 , σ 2 I n
where ρ is the spatial autoregressive coefficient, λ is the spatial autocorrelation coefficient, W i j is the spatial weight matrix, δ 1 is the spatial spillover effect coefficient, ε i t is the residual, and σ is the variance in μ .

4.4. Description of the Data

4.4.1. The Dependent Variable

Regional carbon emissions were the dependent variables. Drawing on the research methodology of Han and Xie [55], there are three types of energy consumption, namely natural gas, liquefied petroleum gas, and electricity, which were measured as follows:
C O 2 = C 1 + C 2 + C 3 = ϑ 1 E 1 + ϑ 2 E 2 + ϑ 2 η E 3
C1, C2, and C3 are carbon emissions from natural gas, liquefied petroleum gas, and urban industrial electricity. E1 and E2 are the consumption of natural gas and liquefied petroleum gas, respectively; ϑ 1   and ϑ 2 are the carbon emission coefficients of natural gas and liquefied petroleum gas, respectively. According to China Contract Energy Management Network, natural gas’s carbon emission coefficient is 2.1622 kg/m3; the carbon emission coefficient of liquefied petroleum gas is 3.1013 kg/kg. E3 is the urban industrial electricity consumption, ϑ 3 is the coefficient of greenhouse gas emissions from the fuel chain of coal power, which translates into an equivalent CO2 of 1.3023 kg/(kW·h), η is the ratio of coal-fired power generation to total power generation. According to the China Electric Power Yearbook, the average proportion of coal power generation in the total power generation from 2011–2019 was 82.5%, 78.6%, 79.2%, 80.3%, 73.7%, 71.8%, 67.0%, 71.2%, and 72.3%, respectively.

4.4.2. Independent Variable

Digital finance is the independent variable. We use China’s Digital Financial Inclusion Index (DFII) to reflect digital finance development. This index was compiled by a joint research group composed of the Institute of Digital Finance of Peking University, Shanghai Finance Institute, and Ant Financial Services Group based on big data from Ant Financial Services. Guo [56] provides more details regarding this index.

4.4.3. Control Variables

Based on the current situation of China’s development, GDP per capita, employment rate, urbanization level, human capital, and government intervention were selected as control variables. The specific contents are as follows.
(1)
Regional per capita GDP is a dynamic indicator reflecting the degree of change in the level of economic development in a certain period and a basic indicator reflecting whether the regional economy has internal dynamics. This paper uses the real GDP per capita of the region to measure it.
(2)
Employment rate is linked to the productive activities of a region, which brings about population clustering over a certain period, thus affecting economic development. Therefore, this study uses the proportion of urban unit employment to the total population of the region.
(3)
The level of urbanization is a common indicator used to evaluate the development of a country or region and is an important measure of urban development. In this study, the measurement of urbanization level is the ratio of population to the area, which is then processed by taking the logarithm.
(4)
Human capital is an important factor that affects the development of various industries; therefore, this study uses the level of education as a measure of human capital in existing studies.
(5)
Government intervention. Fiscal policy is one of the two major instruments of macroeconomic regulation by the government, and fiscal expenditure and taxation policies can regulate aggregate market demand, thus influencing the region’s economic development. This study measures government intervention based on the proportion of fiscal expenditure to GDP. The specific indicators are listed in Table 1.

4.5. Data Source and Processing

This study focuses on digital finance’s impact on regional carbon emissions and constructs panel data for 278 cities above the prefecture-level in China from 2011 to 2019. The study uses data from the China City Statistical Yearbook, the China Financial Statistical Yearbook, the Compilation of Statistics for the Six Decades of New China, each region’s annual government work reports, and the National Bureau of Statistics website. All non-comparable and non-standardized variables were treated logarithmically in this study to reduce the effect of heteroskedasticity. The descriptive statistical analysis of the main variables is shown in Table 2.

5. Empirical Results and Analysis

5.1. Baseline Regression and Sub-Dimensional Tests

Table 3 reports the results of the estimation of Equation (1). Columns (1) and (2) are the panel fixed effects model Fe and OLS estimation results, respectively. The baseline regression results show that the estimated digital finance and carbon emissions coefficient are significantly negative at the 1% confidence level. This indicates that digital finance development can effectively mitigate regional carbon emissions and thus achieve the green effect of energy saving and emission reduction. The results of the control variables in Column (1) show that GDP per capita is significantly and positively correlated with carbon emissions. This indicates that developing the regional economy cannot completely suppress carbon emissions, which shows that China needs to achieve an integrated and coordinated development with environmental sustainability while grasping high-quality economic development. Human capital is positively but not significantly related to carbon emissions. This is probably because human capital input promotes enterprise output, which will inevitably cause energy consumption while increasing enterprise output. Therefore, it is necessary to increase enterprise productivity while expanding human capital and strengthening human skills development to lay a good foundation for realizing the emission reduction effect. Employment rate, urbanization level, and carbon emissions are negatively correlated, indicating that employment rate and urbanization level can suppress carbon emissions to a certain extent. However, increasing social employment rate and urbanization is inherently a complex process, which is one of the main reasons why the baseline regression results are not significant. Government intervention is significantly and negatively associated with carbon emissions. This indicates that the government plays a role in regulating environmental governance and green emission reduction, conducive to reducing carbon emissions.
Columns (3)–(5) show the results of the sub-dimensional test of digital finance. The explained variables are still regional carbon emissions, and the explanatory variables correspond to the breadth, depth, and digitization of digital finance. The results show that the coefficients of all three models are negative and pass the 1% significance test. This indicates that digital finance can effectively mitigate carbon emissions in terms of coverage, depth of use, and digitization and can effectively promote China’s carbon peaking and carbon neutrality goals. It is worth noting that the squared terms of the explanatory variables are included in the baseline regression and the sub-dimensional test with significant effects. This indicates that digital finance and its sub-dimensional variables have a U-shaped relationship with carbon emissions. That is, the effect of each explanatory variable on carbon emissions decreases and then increases. The reason for the first decline may agree with the findings of Tamazian [33], who concluded that, under a rational system, financial development can reduce CO2 emissions and that sectors such as capital markets have a greater dampening effect on carbon emissions. The reason for the latter rise may agree with the conclusions of Frankel et al. Frankel argued that financial development drives international trade expansion, foreign investment, and other behaviors, thus accelerating economic growth and carbon emissions [57]. It has also been found that financial intermediation leads to consumption escalation, which increases consumers’ carbon emissions [58]. Although China was already supporting green finance development and low-carbon markets, there are still some unstable factors in digital finance and Internet technology at this stage. First, digital finance development has not fully kept pace with China’s economic transformation. Second, digital finance in less economically developed areas and the infrastructure of the place lacks matching and other problems; third, there may be many problems at the level of financial regulation and implementation. From a long-term development perspective, the impact of China’s digital financial development on carbon emissions has not reached the inflection point. To avoid the rebound of carbon emissions, we should develop digital and low-carbon industries to reduce industrial energy consumption and regional carbon emissions.

5.2. Robustness Test

5.2.1. Robustness Results

This study uses several methods to test the robustness of the model: First, by replacing the variables; second, by replacing the sample period; and third, by removing the influencing factors from the sample. Regarding replacement variables: Conversely, since PM2.5 is a major pollutant in the atmosphere with carbon emissions, this study regresses with PM2.5 as the dependent variable. In contrast, industrial waste emission can further reflect the energy consumption and pollutant emission in the production process of industrial enterprises, so this study also uses industrial waste (wastewater, SO2, solid waste) as the explained variable for regression. In terms of replacing the sample period, since the industry generally believes that China’s digital finance officially entered the first year of development from 2013, the measurement period was changed to 2013–2019 for estimation, drawing on Jiang [59]. In removing some influences, the municipality in the sample was removed to reduce regression bias, drawing on Sutherland [60]. The robustness test results in Table 4 show that the coefficient of the impact of digital finance on regional carbon emissions is significantly negative at the 1% confidence level, regardless of the method used. This indicates that digital finance can effectively mitigate carbon emissions. Thus, Hypothesis 1 is verified again.

5.2.2. Endogenous Treatment

Various methods were used for endogeneity treatment: two-way causality, omitted variables, controlling for traditional finance, and regression model turnover.
This study treats the explanatory variables and all control variables separately with a one-period lag to eliminate endogeneity problems due to reverse causality as much as possible. However, the model also omitted variables, leading to a correlation between the nuisance terms. Based on this, this study draws on Claessens [61] and uses a one-period lag of digital finance as an instrumental variable for a two-stage least squares regression (IV). The results show that digital finance’s impact on carbon emissions remained consistent with the baseline regression results after considering the potential two-way causality and omitted variable issues. This also reaffirms that digital finance can effectively curb carbon emissions, that is, Hypothesis 1 holds.
Yan found that traditional financing can also impact carbon emissions [62]. Therefore, we control for traditional financial development, measure it by the value-added of the financial industry as a share of GDP, and test it in the benchmark model. The addition of macro variables further controls for the provincial fixed effect. To replace the regression model approach, SYS-GMM was used for testing [63]. Table 5 presents the regression results. After endogeneity treatment, digital finance still mitigates carbon emissions, and the baseline regression results are still reliable.

5.3. Threshold Estimation

This section describes the nonlinear effects of digital finance on mitigating carbon emissions. Table 6 shows a panel threshold existence test with 300 iterations of sampling by bootstrap. The results show that the digital and green thresholds pass the significance test for the single and double threshold estimates. In contrast, the triple threshold estimates do not pass the significance test. The digital threshold values were 4.277 and 4.585, and those of the green threshold were 3.218 and 4.382, respectively.
Table 7 reports digital finance regression results and carbon emissions under single and double thresholds, which also have different effects on carbon emissions when the digital thresholds and green thresholds are in different intervals. In the digital threshold model, the single-threshold results show that when the digital threshold is less than 4.277, the regression coefficient of digital finance on carbon emissions is −4.532 and significant at the 1% confidence level. When the numerical threshold is greater than 4.277, the regression coefficient of digital finance on carbon emissions drops to −4.487, also significant at the 1% confidence level. The double-threshold reflects the regression results more clearly. When the digital threshold is less than 4.277, the regression coefficient of digital finance and carbon emissions is −4.466 and significant. When the digital threshold is between 4.277 and 4.585, the regression coefficient of digital finance and carbon emissions is −4.413 and significant. When the digital threshold is greater than 4.585, the regression coefficient of digital finance and carbon emissions decreases to −4.359 and is significant at a 1% confidence level. The results of single-threshold and double-threshold regressions show that the inhibitory effect of digital finance development on carbon emissions will show different results with the change of digital threshold, with a marginal decreasing effect. This means that the mitigation effect of digital finance on carbon emissions will decrease. In the green threshold model, the regression results of the single threshold and double threshold also show that the effect of digital finance to alleviate carbon emissions continues to decrease and shows a non-linear characteristic of diminishing margins.
This study concludes that the major carbon emitters’ industrial enterprises and many industrial enterprises that meet the digital finance policy will enjoy the dividends brought by the current digital financial services. Simultaneously, they will have an obvious suppressive effect on carbon emissions. However, for other industrial enterprises that do not receive dividends, the effect of digital finance on their carbon emissions is smaller, although the overall performance is significant regarding emissions reduction. In the late stage of digital finance development, the number of industrial enterprises receiving dividends remains stable under the same policy. In contrast, the number of industrial enterprises not receiving dividends remains the same, showing the marginal decreasing effect of digital finance and carbon emissions. This also means that, while digital finance can inhibit carbon emissions in certain periods as a catalyst, it needs to be adjusted in time to avoid carbon emission rebound.

5.4. Heterogeneity Results

The above test examines the inhibitory effect of digital finance on carbon emissions, and this section explores the heterogeneity of digital finance in mitigating carbon emissions. Digital finance is inclusive and technological and is currently a driving force for China to achieve its carbon peaking and carbon neutrality goals. Therefore, is the impact of digital finance on carbon emissions related to the region’s development? What is the performance in different regions? This section explores these questions further.

5.4.1. Heterogeneity Analysis Based on Degree of Marketization

A higher degree of local marketization can maintain supply and demand balance, reduce information asymmetry, improve the efficiency of market resource allocation, and improve the total factor productivity. The degree of local marketization is measured using the ratio of the annual sales value of private industrial enterprises to that of the entire industrial enterprises, where the higher ratio indicates higher private economic activity and degree of marketization. Table 8 treats our marketization degree in groups to show the variability of different marketization degrees (bounded by 50% average). Compared to the regions with a lower degree of marketization, the inhibitory effect of digital finance on carbon emissions is more significant in the regions with a higher degree of marketization. It is possible that regions with a higher degree of marketization have better economic development and meet the conditions for developing green finance and green travel for residents, thereby reducing the regional carbon emissions.

5.4.2. Heterogeneity Analysis Based on the Characteristics of Digital Finance

As a product of financial development and technological innovation, digital finance offers financial service efficiency and Internet technical support. Therefore, this study draws on the research of Jiang et al. to explore the heterogeneity of digital finance on carbon emissions using the level of traditional financial development and the degree of digitization. The samples were divided into financially developed and underdeveloped regions and high and low digitization regions according to the mean value of each region (bounded by 50% average). The results are shown in Table 9, where digital finance mitigates carbon emissions in financially developed and less developed regions and passes the 1% significance test. However, the impact is greater in financially developed regions. The results for the Internet subgroup show that digital finance is effective in curbing carbon emissions in regions with higher Internet penetration. Thus, against the background of different financial development and Internet development, digital finance has a Matthew effect in alleviating carbon emissions. Therefore, strengthening China’s digital investment and financial construction is key to broadening its digital financial development and reducing the digital divide.

5.4.3. Heterogeneity Analysis Based on Different Regions

Table 10 shows digital finance impact on carbon emissions in the different regions. Columns 1–3 are based on the classification of central, eastern, and western regions in China, columns 4–5 are based on the classification of central and non-central cities in China. The regression results show that the coefficient of digital finance impact on carbon emissions remains consistently and significantly around −5, indicating that the inhibitory effect of digital finance on carbon emissions maintains a stable trend in different regions of China.

5.5. Spatial Analysis

5.5.1. Spatial Autocorrelation Analysis

Based on the heterogeneity analysis of different regions in China, it is found that the inhibitory effect of digital finance development on carbon emissions in China tends to be stable. Since air pollution is liquid, to further explore the impact of digital finance on carbon emissions, this section will continue the analysis from the perspective of spatial effects. Before conducting the spatial regression analysis, this study examined the spatial correlation between digital finance and carbon emissions using the economic distance matrix, and the results are shown in Table 11. Moran’s I indices of digital finance and carbon emissions are all significant. The corresponding Z-values for all years are also greater than 1.96. This indicates that all cities’ digital finance and carbon emissions have significant spatial autocorrelation from 2011 to 2019. There is a spatial agglomeration phenomenon and a positive spatial correlation between digital finance and carbon emissions.

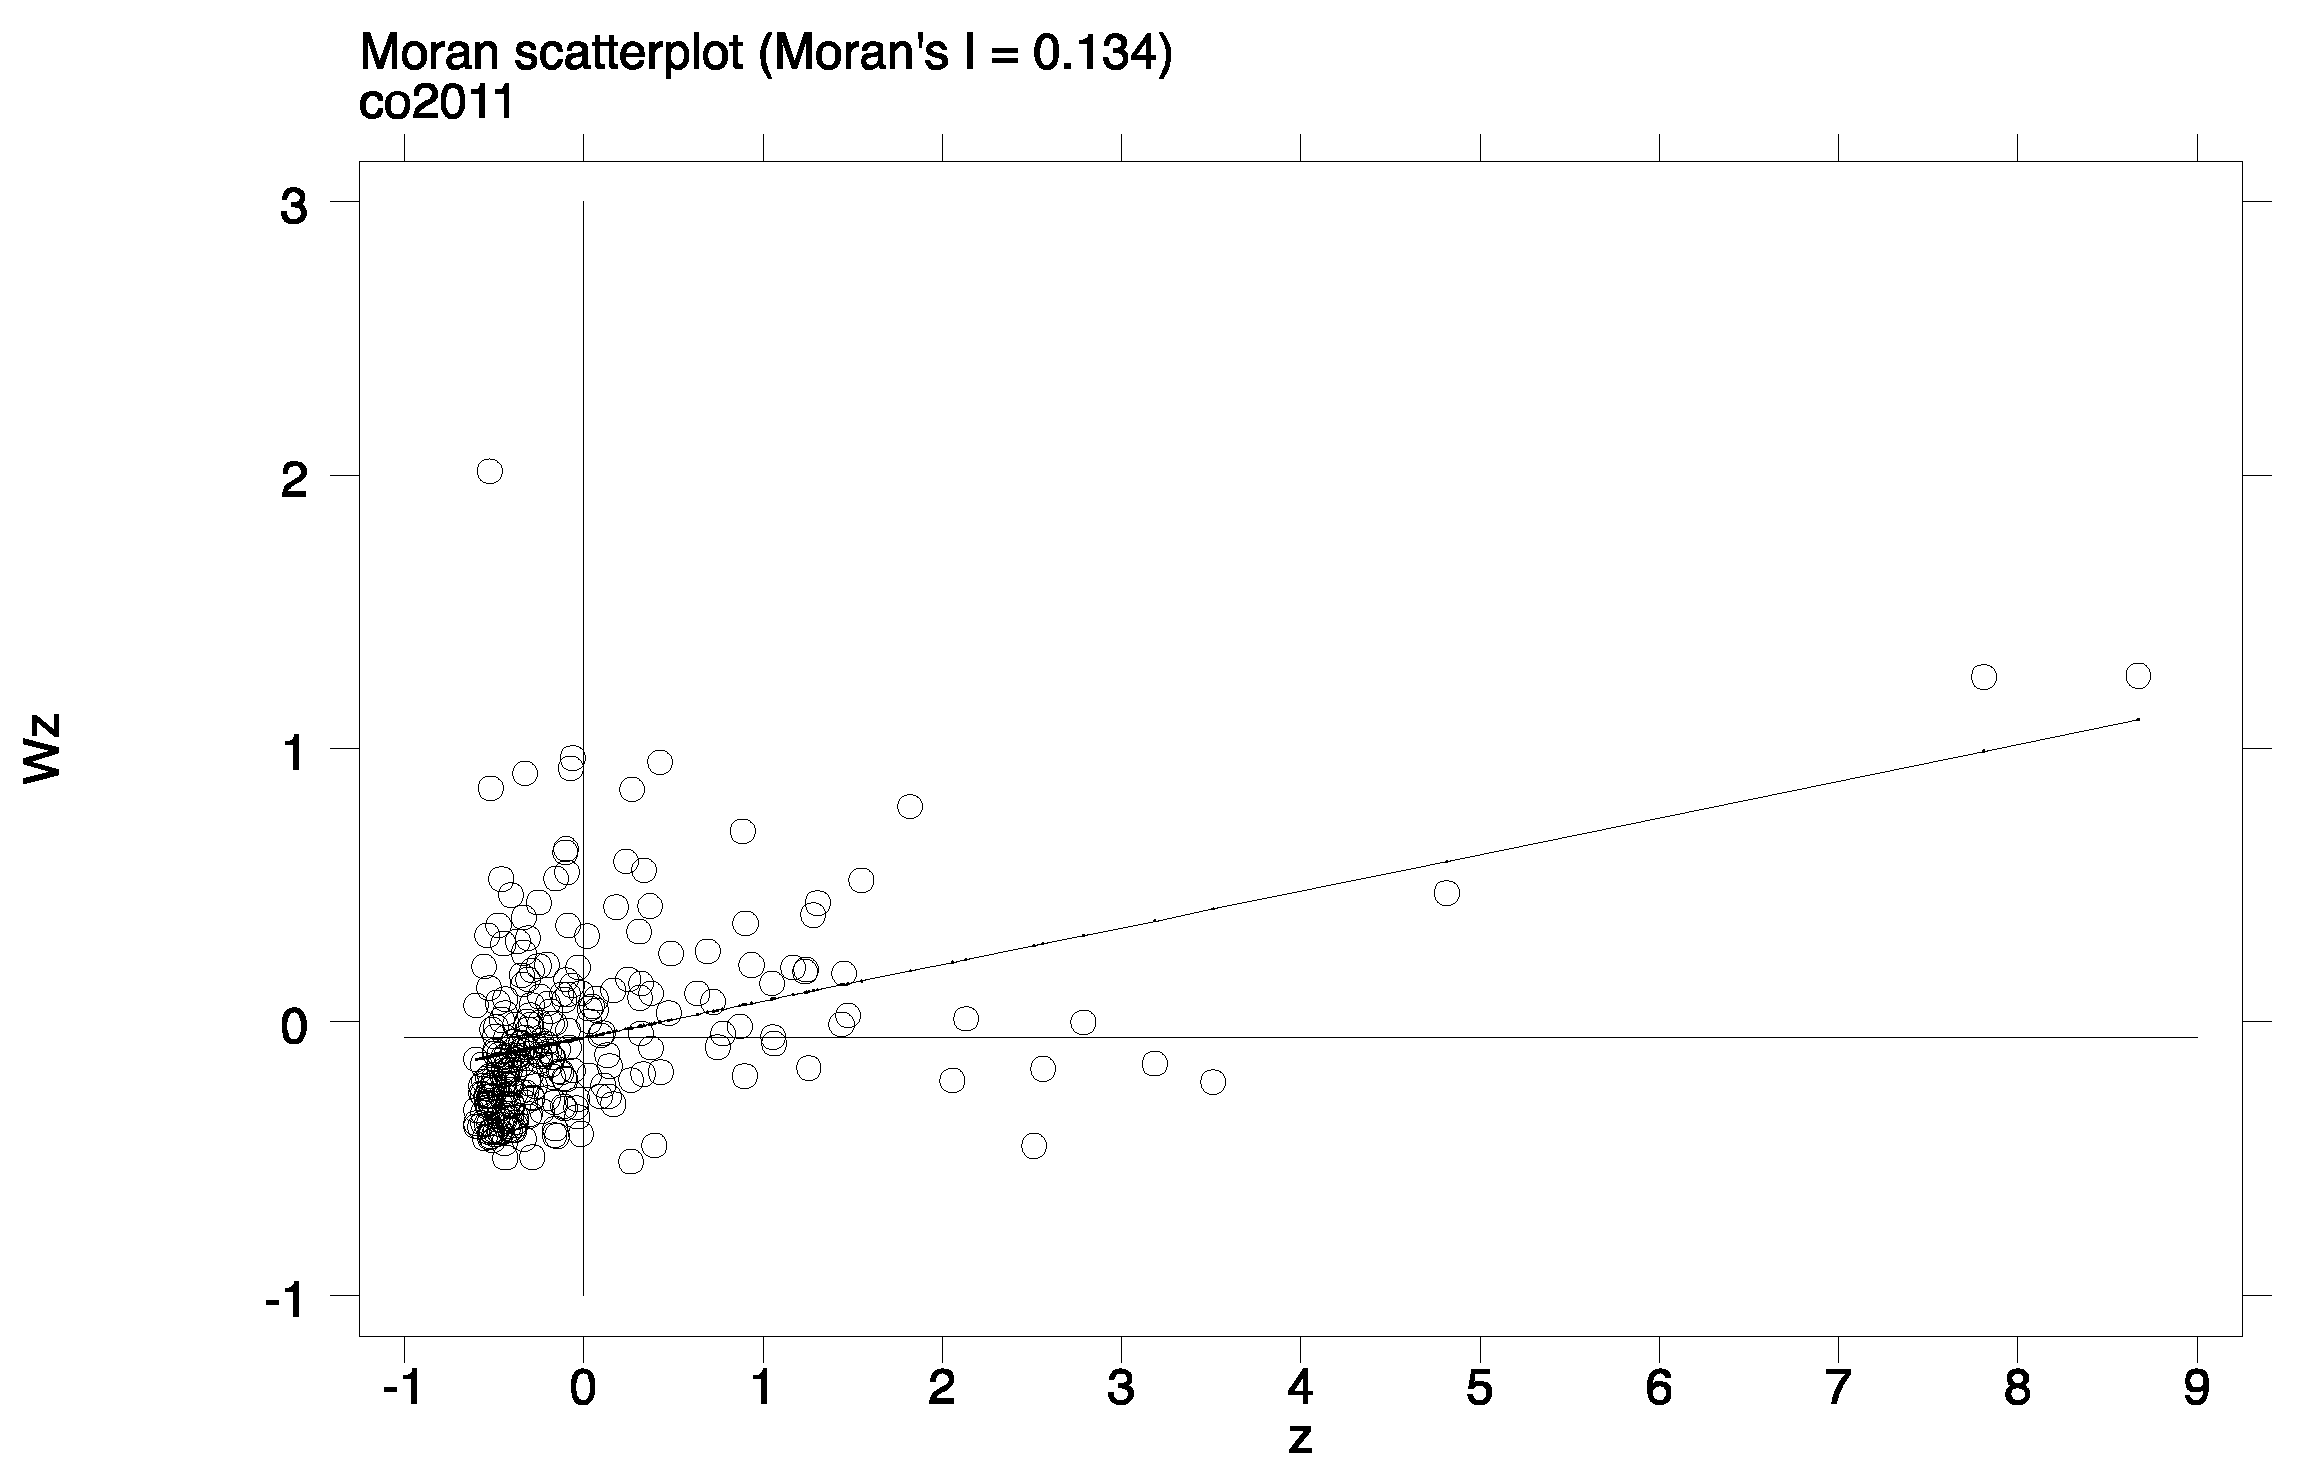
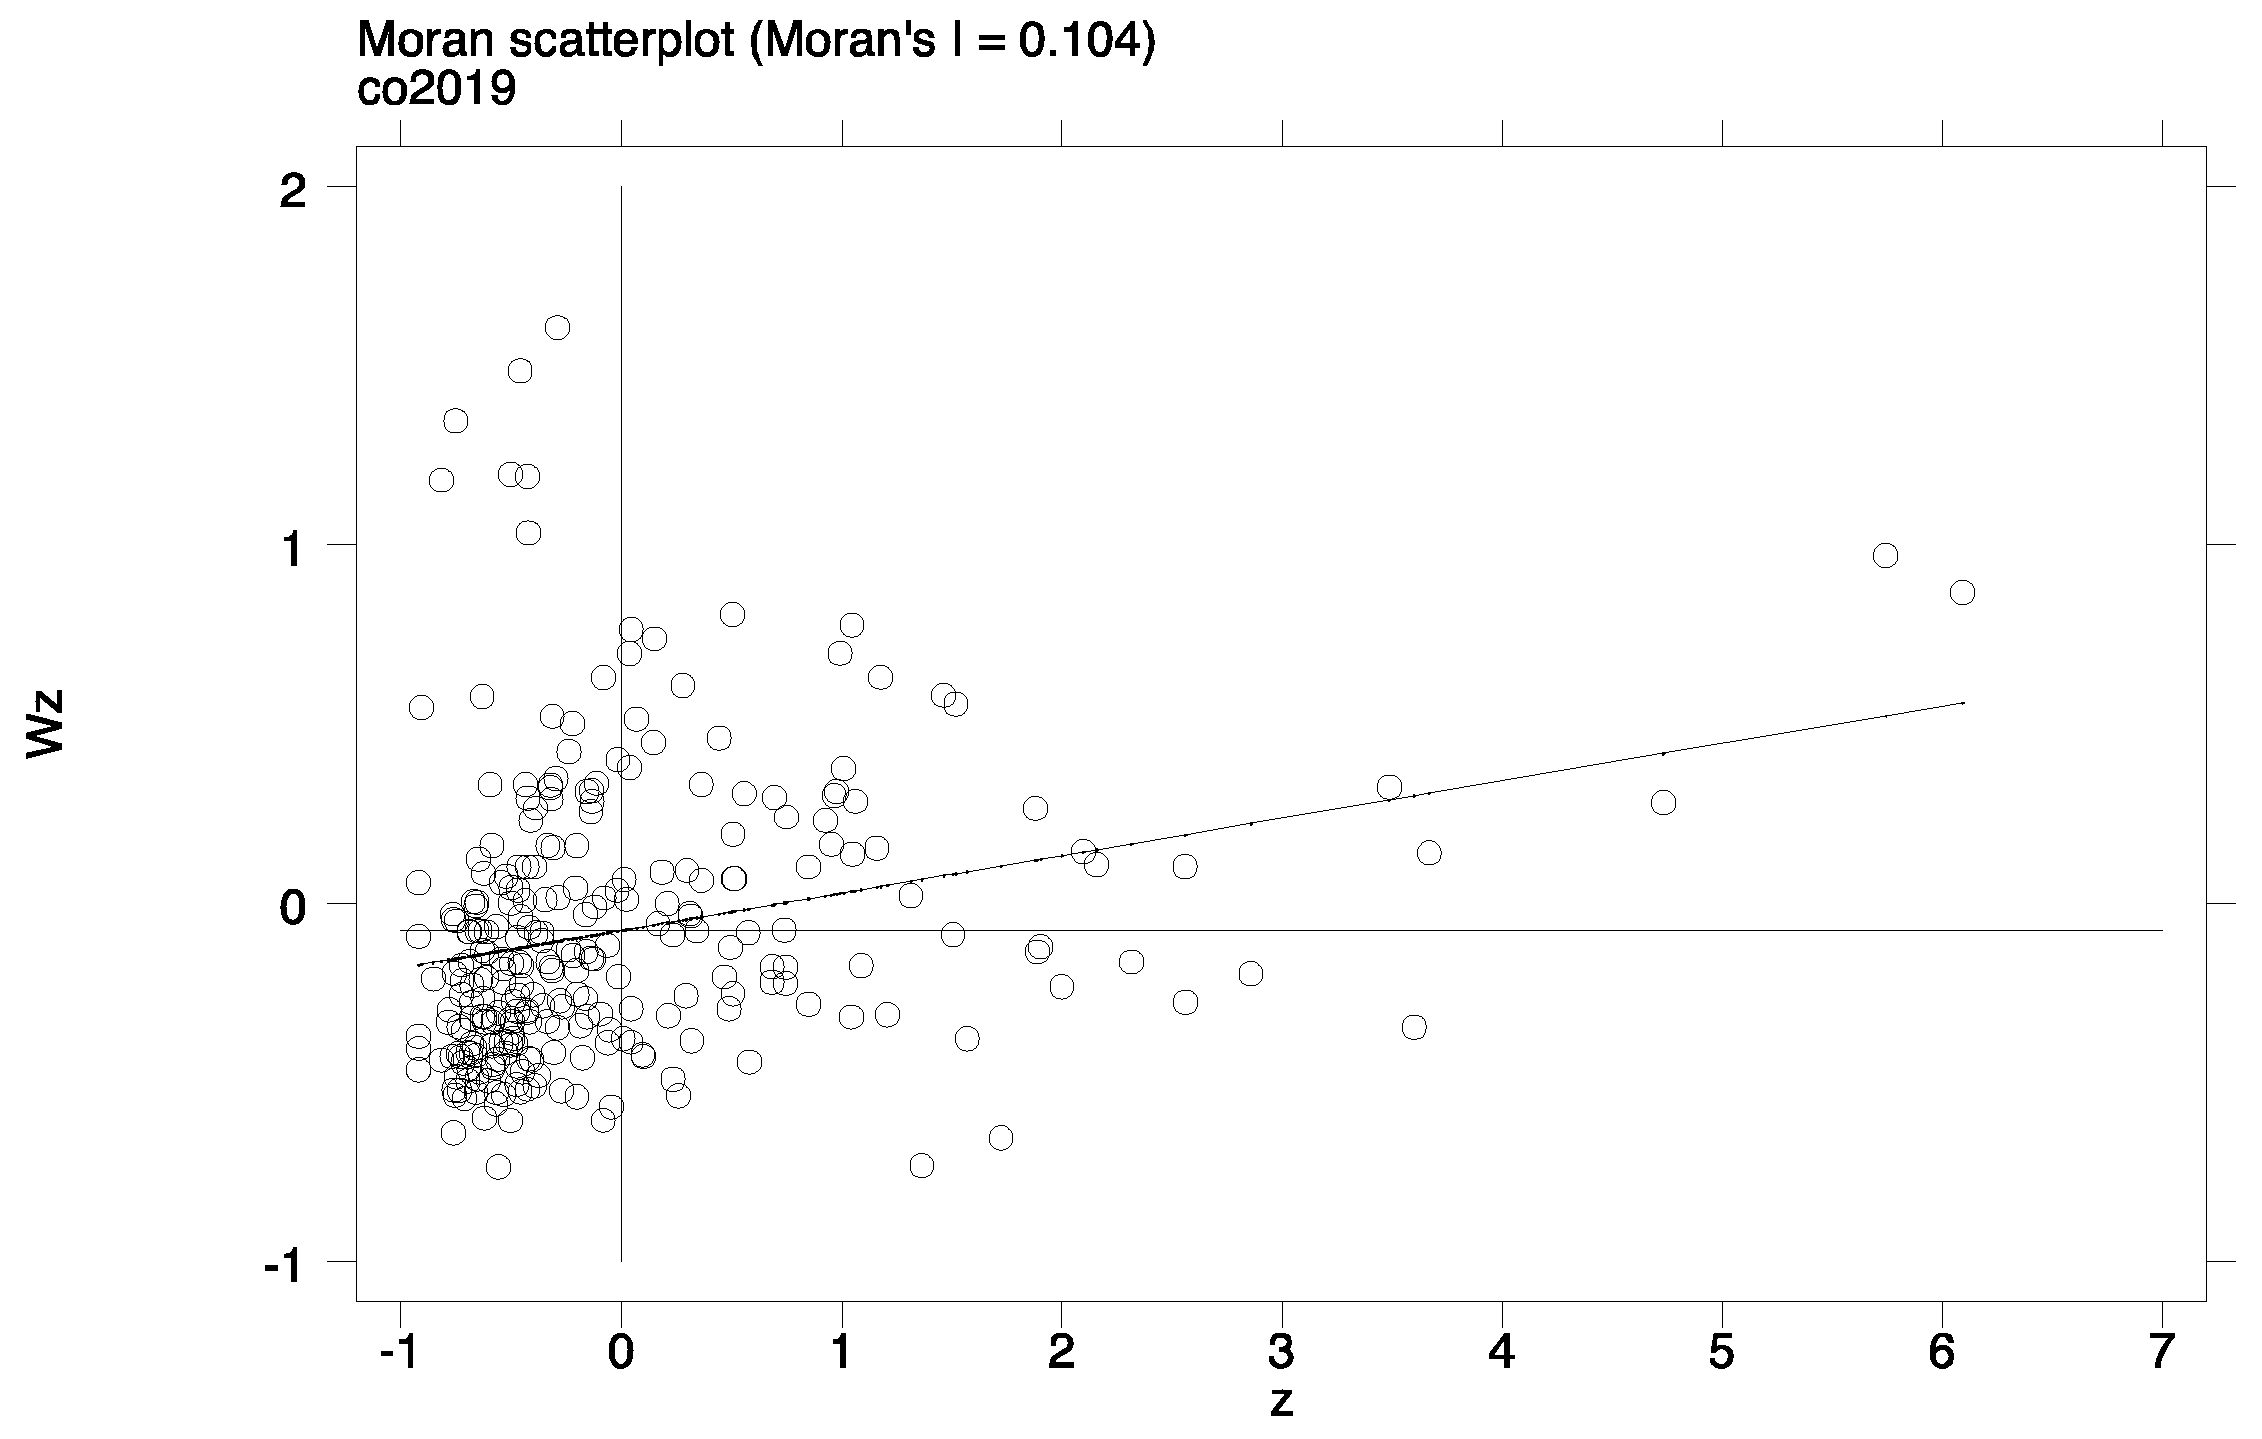
5.5.2. Moran Scatter Diagram

We further examine the spatial linkage of local regions by Moran’s I scatterplot and use the economic distance matrix to draw the Moran’s I scatterplot of carbon emissions of each region in 2011 and 2019, as shown in Figure 1.
The results show that carbon emissions in most regions of China are located in the first and third quadrants, with obvious H-H and L-L agglomeration states. There is a strong correlation between high value and high value of carbon emissions and between low and low values. Therefore, it is necessary to continue using a spatial econometric model for the estimation.

5.5.3. Spatial Spillover Effect

To select the best model, the LM test, Hausman test, Wald test (to select time fixed effects, individual fixed effects, and two-way fixed effects), and LR test (to see whether SDM would degenerate into SEM and SAR) were carried out. Finally, the SDM with the time-fixed effect was determined as the best choice. The regression results are presented in Table 12, and the estimation results of the SAR and SEM models are compared. The results of the geographic distance matrix show that the spatial autoregressive coefficient ( ρ ) and spatial autocorrelation coefficient ( λ ) in the three models are significantly negative, indicating that the spatial spillover effect of regional carbon emissions in China is significant. Moreover, the spatial effect coefficient of digital finance and carbon emissions is −77.18, which indicates that digital finance development has a significant endogenous negative spatial spillover effect. This means that the development of local digital finance will increase the inhibitory effect on carbon emissions in neighboring regions. A possible reason is that digital finance has accelerated enterprise technology innovation and total factor productivity to curb energy consumption and carbon emissions. In contrast, China’s economy and transportation development have accelerated inter-regional cooperation and communication, with fast information transmission characteristics. This also facilitates the dissemination of emission reduction technology among different places, thus helping to develop China’s carbon peaking and carbon neutrality goals. To verify the robustness of the estimation results, we re-estimated the study using the economic distance matrix, whose spatial effect coefficient was −7.434, and passed the 5% significance test. This means that there was also a significant negative spatial spillover effect in the economic distance matrix, which proved the reliability of the conclusions of this study.
The above spatial regression tests the impact of local digital finance on carbon emissions in neighboring areas. However, since the SDM model contains global effects, the regression coefficients of its spatial interaction terms cannot be used to reflect digital finance’s marginal impact on carbon emissions. To explore the effects of the explanatory variables in a region on the explained variable in the region and other regions, we adopted a spatial regression partial differencing method to decompose the spatial spillover effects of digital finance’s impact on carbon emissions. The results are shown in Table 12 for the direct, indirect, and total effects. It can be seen that digital finance has a negative indirect effect on carbon emissions in the geographical distance matrix and the economic distance matrix. Both are significant at the 5% confidence level, indicating that the development of digital finance in neighboring cities also has a suppressive effect on carbon emissions in the region, which is consistent with the above conclusions. In the direct effect, the digital finance effect on carbon emissions is negative. It passes the 1% significance test in the geographical distance matrix, indicating that the development of digital finance in the region can also mitigate local carbon emissions. The insignificance in the economic distance matrix may be that the regional economy is in transition. However, the financial system has not been fully transformed, thus weakening the inhibitory effect of digital finance on carbon emissions. However, the results of the total effect of the different matrices show that the digital finance effect on carbon emissions is significantly negative, which means that digital finance in adjacent areas has a suppressive effect on carbon emissions in general.

6. Further Analysis

6.1. Digital Finance and Carbon Emissions: A DID Design

The development of smart cities is based on big data, cloud computing, and the Internet of things. It is a new generation of urban forms under information technology development and knowledge society, which can promote collaborative innovation of enterprises and guarantee the healthy and harmonious development of cities. Digital finance is inseparable from regional economic, industrial, technological, and urbanization development factors. The quality of its financial services and digital development depends on urban infrastructure development. Therefore, to assess the digital finance impact on carbon emissions more robustly, this study uses a smart city pilot as an exogenous policy shock with a DID model. The smart city policy was proposed in 2013. Since it is only being implemented in pilot cities, the carbon intensity of cities implementing the policy will be affected to some extent. However, cities not implementing the policy will be less or not affected, providing a suitable quasi-natural experiment. Therefore, a sample of cities implementing the smart city pilot was used as the treatment group. A sample of cities not implementing the smart city pilot was used as the control group. In the context of the rapid development of digital finance in China, smart cities have reduced energy consumption and pollutant output of enterprises and increased residents’ level of green consumption, thus affecting regional carbon emissions. Accordingly, this study draws on most ideas about the difference-in-differences model (DID) and establishes the following model:
Y i t = γ 0 + γ 1 t r e a t i × p o s t t + γ 2 X i t + μ i + τ t + ε i t
where Y i t represents the carbon emissions of city i in period t , and t r e a t i = 1 represents the cities that implemented the smart city pilot, which is the treatment group. t r e a t i = 0 represents the city that does not implement the pilot of a smart city, which is the control group. p o s t t denotes the time dummy variable, which is 1 if the smart city pilot policy of implementation year and after; otherwise, it is 0, and the rest of the variables have the same meaning.

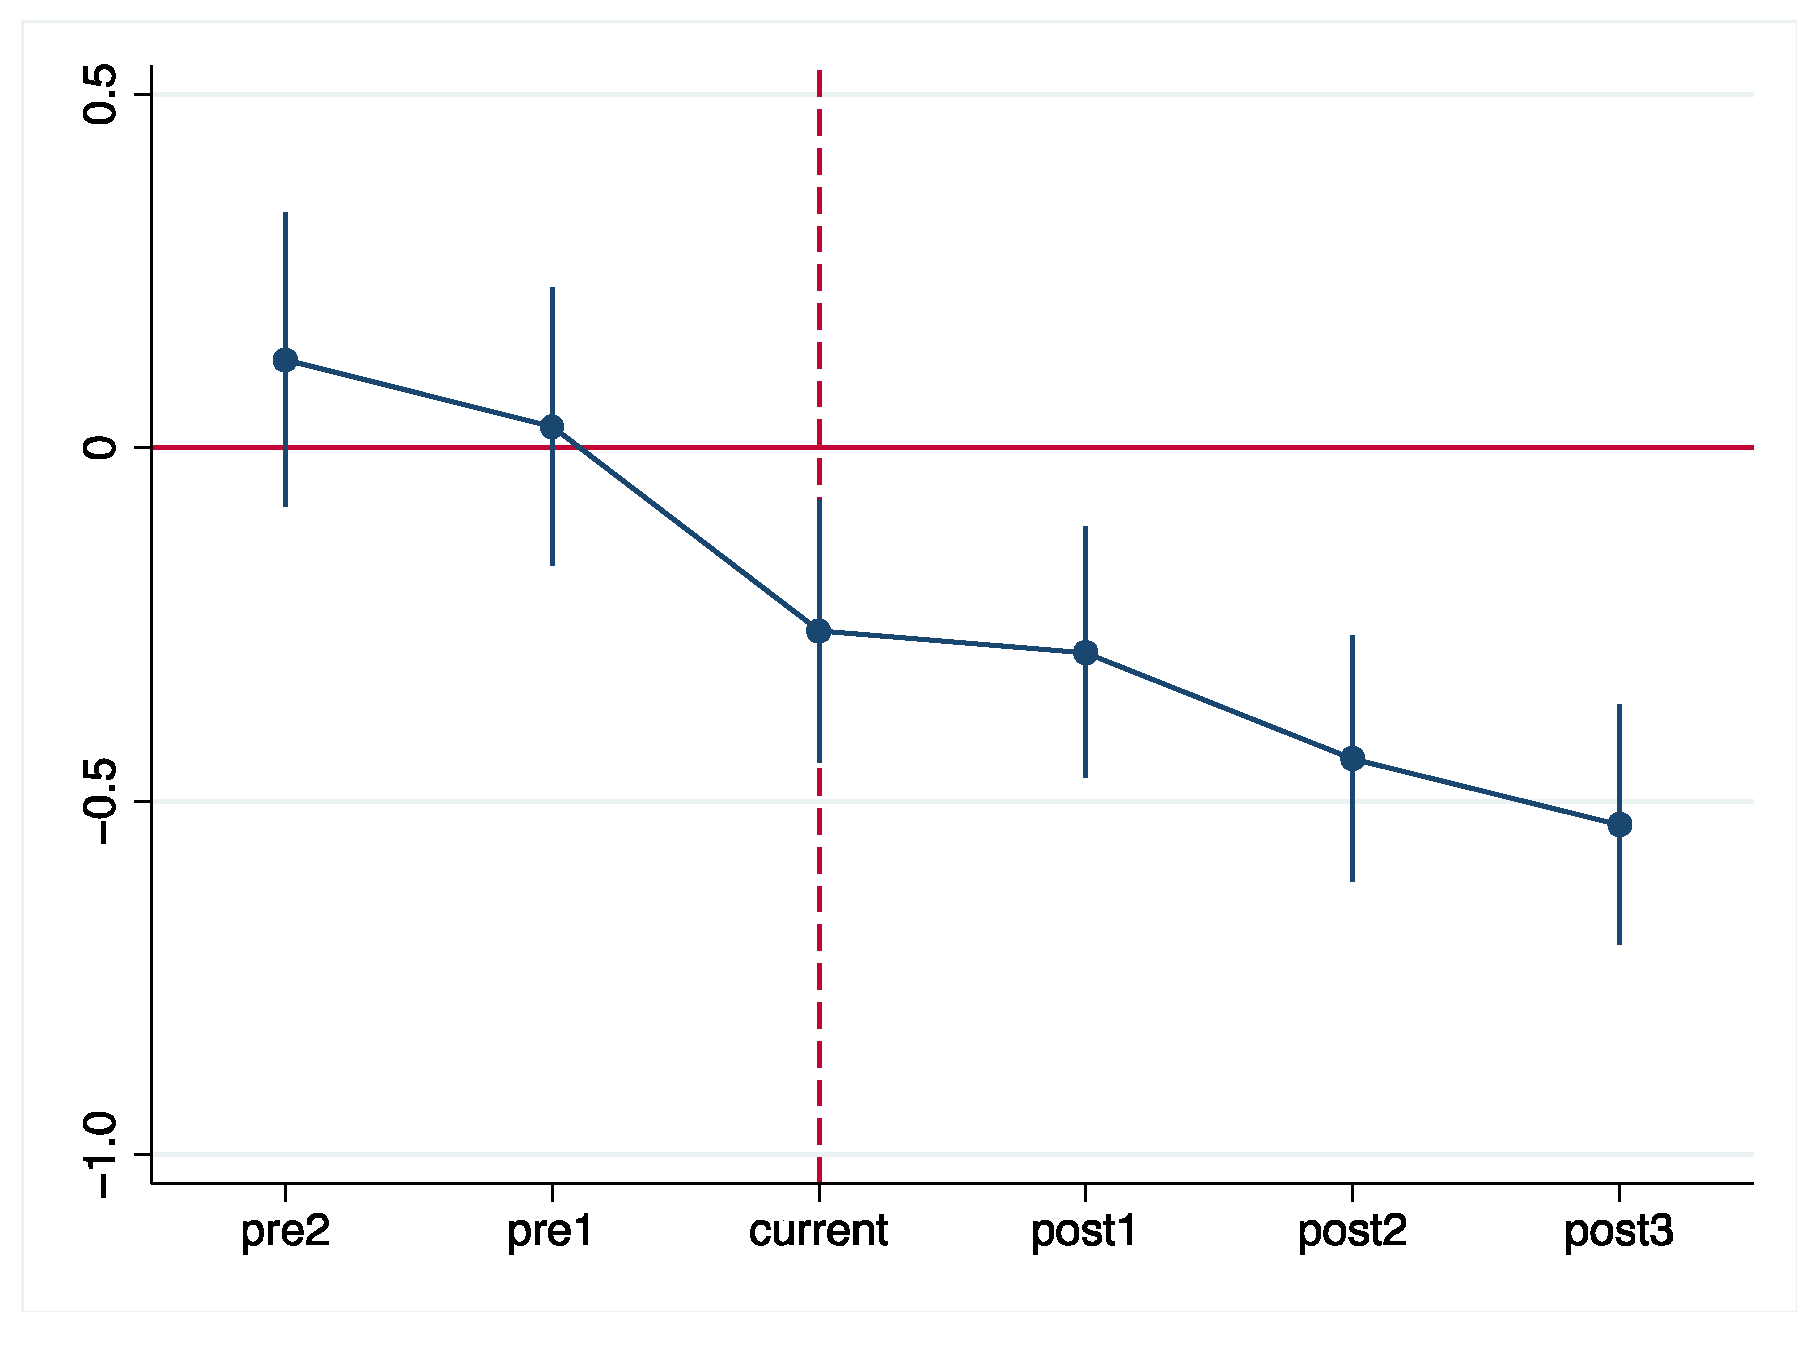
6.2. Parallel Trend Test

An important prerequisite for conducting a smart city pilot policy for effect assessment is satisfying parallel trends. Drawing on Howell’s study, this study sets multiple time dummy variables before and after the policy pilot implementation and includes them as independent variables in the regression model. Suppose the confidence interval of the time dummy variable before the policy implementation contains 0. In that case, it indicates no systematic difference between pilot cities and non-pilot cities and satisfies the parallel trend result. Specifically, using the policy implementation year as the base period (2013), the time dummy variables for the first two and last three years of pilot policy implementation are set. Their regression coefficients and 95% confidence intervals are represented by plots, as shown in Figure 2. The results show that the regression coefficients are approximately zero and insignificant before implementing the policy. The regression coefficients are significantly negative in the policy implementation year and after, indicating that the carbon emissions of the treatment and control groups satisfied the parallel trend before the implementation of the smart city pilot policy.

6.3. DID and Robustness Results

Columns 1 and 2 of Table 13 are fixed effect analysis and ordinary panel analysis, respectively, and both results show that smart city pilot implementation can reduce carbon emission intensity. Because of the different levels of economic development and environmental governance in each city in China, some cities will have priority development, and there will be a regression bias if extreme values are included in the sample; therefore, to exclude the influence of extreme values on the regression results, we winsorized CO2 emissions at 1%, as shown in Column 3 of Table 13, which shows that the estimated coefficient of the smart city pilot policy is still significantly negative.
The study continues with another series of robustness tests: the counterfactual method, propensity score matching, and placebo test. The details are as follows:
(1)
Using the counterfactual method: This study advances the policy time of 2012 for a counterfactual test to obtain the net policy effect. It was found that when the pilot policy was advanced to 2012, the regression coefficient of this policy was still negative but no longer significant. This verifies that the inhibitory effect of the original pilot policy on carbon emissions is influenced by non-pilot policy factors, eliminates the interference of non-pilot factors in the regression results, and again verifies the conclusion that the smart city pilot can reduce regional carbon emissions.
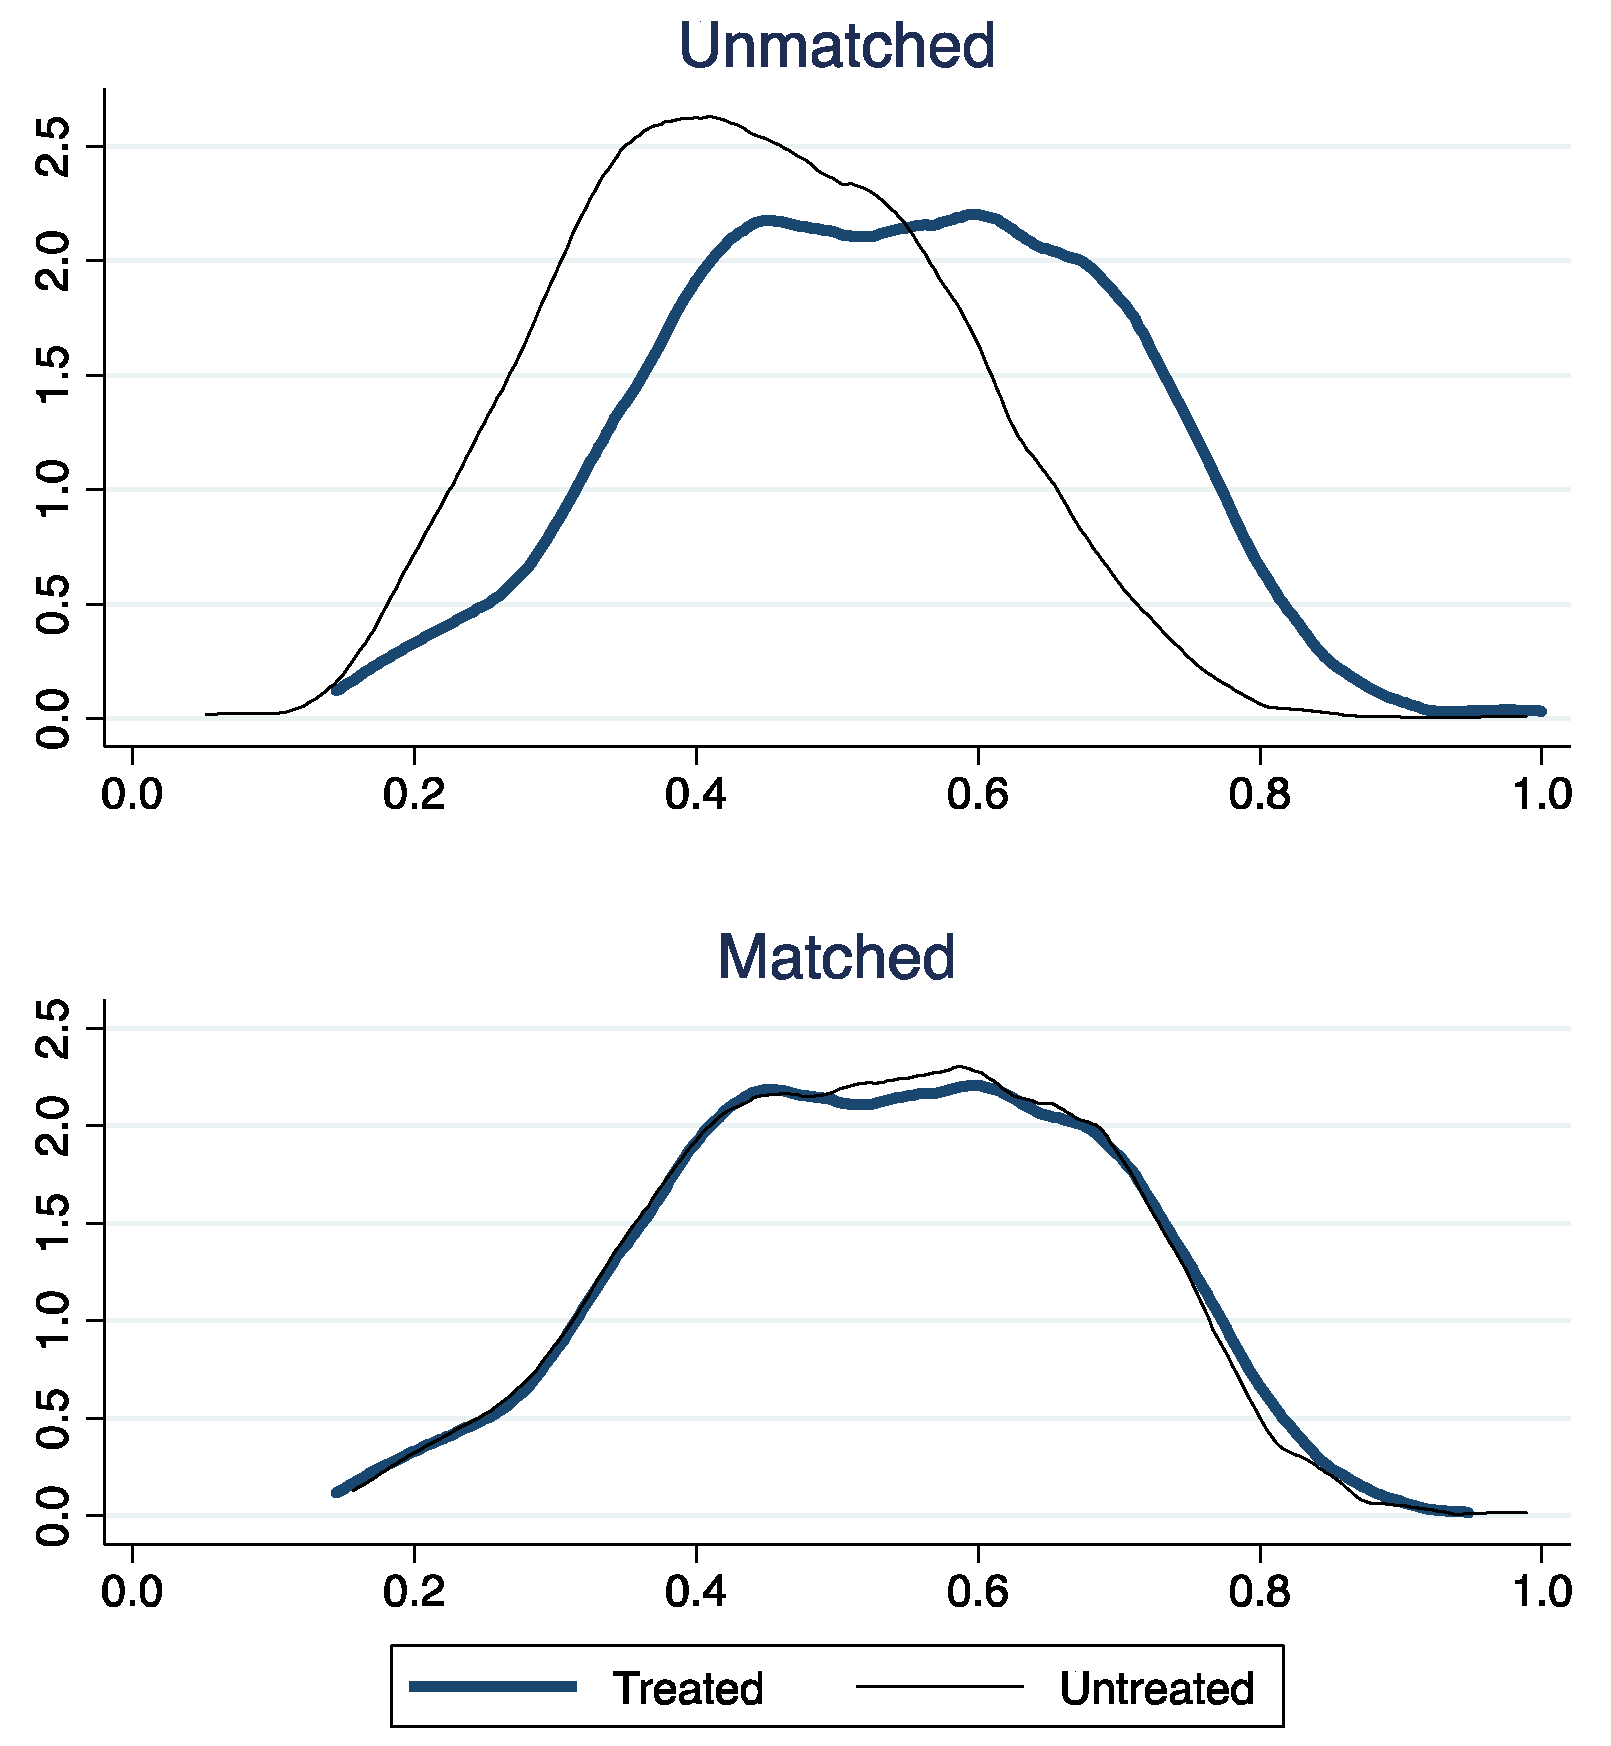
(2)
Propensity score matching method (PSM-DID): To satisfy the randomization of quasi-natural experiments and avoid selection bias in the estimation results, we use propensity score matching to solve this problem by first conducting a logic regression on the policy experiment group. We then use kernel matching to find the city with the closest situation to the treatment group as the matching city for the pilot city. Before that, the common trend assumption has to be satisfied; therefore, the study uses kernel density plots to test the matching effect. Figure 3 shows the results of kernel matching, and the results showed a significant difference between the scores of the treatment and control groups when they were not matched. After matching, the probability density function values of the two sets of samples became extremely close, indicating that the sample selectivity bias problem was eliminated. Column 7 shows the results obtained using the kernel matching method. The results show that the coefficient between smart cities and carbon emissions is −0.145 and is significant at the 1% confidence level. These results again demonstrate the reliability of the study’s findings.
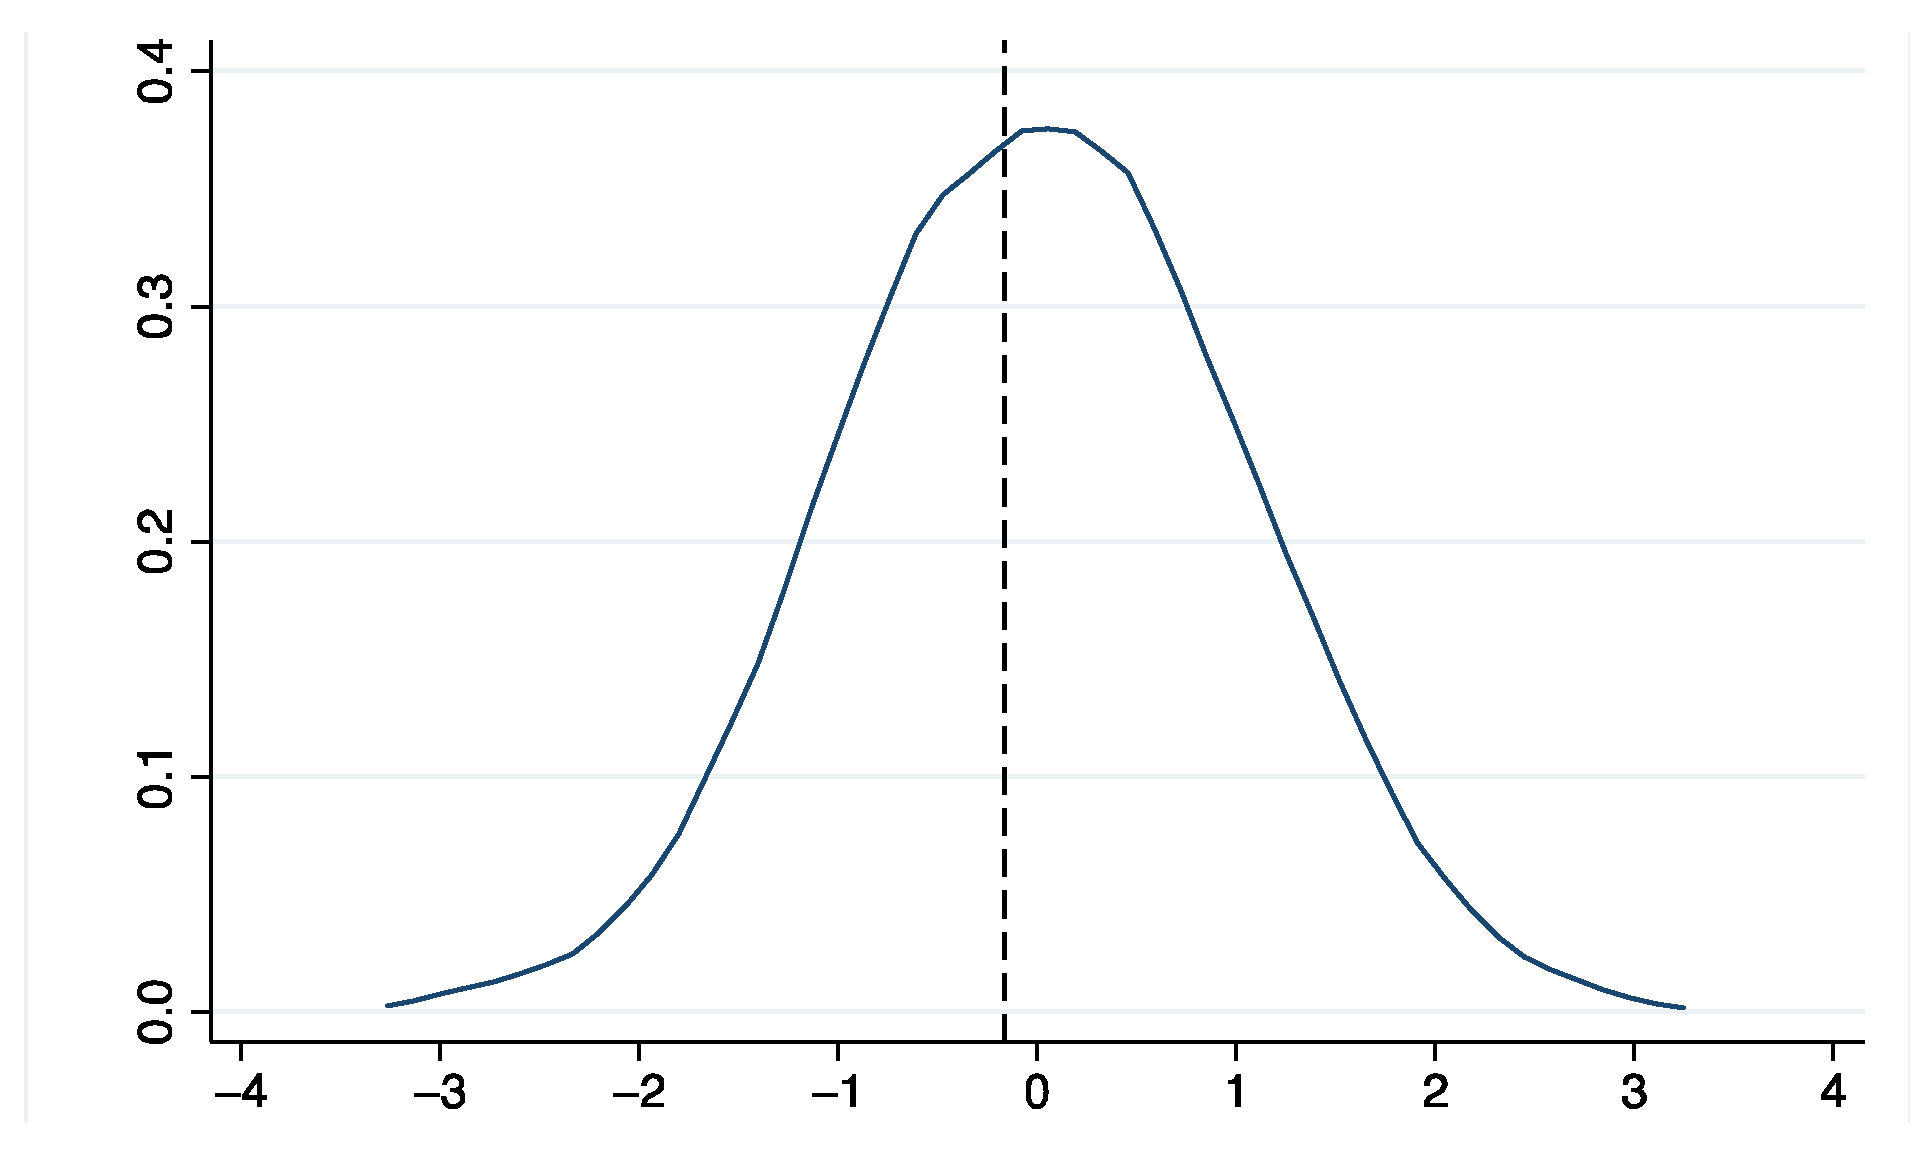
(3)
Placebo test: In this study, the smart city pilot randomly generated part of the treatment group list, with the rest of the sample set as a control group. The extracted data were regressed 1000 times, and the regression coefficients were counted 1000 times. Suppose the coefficients are distributed around zero and not significant; the effect of unobservable factors on the results can be excluded. Figure 4 shows the kernel density plot of the placebo test; its estimated coefficient follows a normal distribution with a mean approximation of 0. The results in column 6 of Table 13 also show that their estimated coefficients are significantly different from those of the true treatment and control groups; that is, the unobserved factors did not affect the estimated results in this study, which further verifies the robustness of the results.

7. Conclusions

7.1. Conclusions

One of the driving forces of China’s economic development is the goal to achieve a green and low-carbon economy. With the rapid development of Internet information technology, digital technology will comprehensively improve the quality and efficiency of financial services, and whether digital finance can promote the development of the low-carbon economy has gradually become the focus of attention. This paper empirically analyzes the relationship between digital finance and carbon emissions on the basis of panel data of 278 cities in China from 2011 to 2019. The conclusions are as follows: (1) Digital finance can mitigate regional carbon emissions, and their relationship has different effects under different mechanisms. (2) Given the digital and green thresholds, the inhibiting effect of digital finance on carbon emissions gradually decreases and shows a non-linear characteristic of diminishing margins. (3) The inhibitory effect of digital finance on carbon emissions in different regions is explored through heterogeneity analysis. (4) From the perspective of the spatial spillover effect, the effects of digital finance on carbon emissions are all significantly negative, that is, the development of digital finance in neighboring regions has a suppressive effect on carbon emissions. (5) This paper tests the inhibitory effect of digital finance on carbon emissions by introducing the exogenous shock of “smart city,” a policy supporting the development of digital finance.

7.2. Discussion of Results

The integration of information science and technology with finance has attracted extensive attention from many researchers around the world, and they have theoretically analyzed the fundamentals of Internet technology, studied its operation mechanism and transaction mechanism in the financial area, examined the current green and low-carbon development objectives, and concluded different research findings [64].
Some researchers agree that in Canada, Denmark, Hong Kong, Japan, New Zealand, Norway, Sweden, Switzerland, the UK, and the USA, financial development can help the reduction of carbon emissions [65]. The impact of carbon emissions on the cost of debt financing in Europe is studied and it is found that carbon emission reductions contribute to lower debt financing costs [66]. Further, there is a study that examined the impact of climate finance on pollutant emissions (CO2, CH4, and N2O) in 19 sub-Saharan African (SSA) countries between 2006 and 2017, and it confirms an inverted U-shaped relationship between climate finance and pollutant emissions [67]. The above research indicates that the world has entered the era of digital economy and the development of digital finance has been a major trend [68]. Therefore, it is necessary to accelerate the construction of a global digital economy system, promote the effective development of digital finance globally, and exert the promotion effect of digital finance on regional carbon emission reduction capacity.

7.3. Research Limitations and Future Perspectives

The shortcomings of this paper are the small sample size of the data and the use of mainstream methods for data processing. Although this paper has used city-level panel data for analysis, which has increased the sample size compared with provincial-level panel data, it can still continue to dig deeper into county-level data and use richer data samples for reliability certification, but deeper data are not available for now, so more in-depth research has not been done. While processing the data, based on the mainstream empirical methods of existing research, we can further combine machine learning and graph networks methods to further explore the non-linear relationships between data and the association between multiple variables, and obtain more accurate conclusions by advanced scientific methods, which can be improved in the follow-up of this paper.
In the future, the scope of application of digital finance can be gradually expanded, and its advantages can be continuously developed into more green development fields such as energy, consumption, and agriculture, forming many digital scenarios to improve the low-carbon effect of digital finance in social economic development as follows:
Firstly, in the area of energy, we will deeply integrate technologies such as big data, blockchain, and artificial intelligence with digital finance and carry out comprehensive applications to realize the integration of the two elements of “energy” and “finance”, and apply them to new energy trading, power trading, commercial insurance, and other fields to promote market-oriented energy transactions. For energy insurance business, online network contracts can be signed to speed up contract processing speed and efficiency. In addition, we need to accelerate the digitization of energy, improve the quality of digital financial services, encourage financial incentives for technological innovation, and guide the development of energy in the direction of energy conservation and environmental protection.
Secondly, in the area of consumption, digital finance promoting green consumption can be carried out in the following two aspects: on the one hand, digital finance can expand the supply of green financial products, provide targeted green financial services for consumers, reduce transaction costs, improve the efficiency of green resource allocation, and promote the development of China’s green consumption steadily. On the other hand, digital finance can reduce the financial industry’s own energy consumption through digital technology, help financial institutions to effectively track green financing projects and clarify the effect of energy saving and emissions reduction, which can make the industry chain greener and also realize the development of green consumption.
Thirdly, in the area of agriculture, the scale effect of digital platforms should be gradually expanded and the development of digital finance in agriculture should be steadily promoted. Oriented by market demand, policy guidance should be strengthened, and the organic integration of digital finance and agricultural green development should be promoted. The practical model of integrating digital finance and agricultural economy can not only promote green and low-carbon cooperation among various regions and reduce the risks faced by agricultural development, but also enrich and improve the new agricultural economic service system, allowing each region to develop its comparative advantages through resource integration and promote the development of agricultural modernization.

7.4. Policy Recommendations

In addition to expanding the theoretical and empirical basis for digital finance and carbon emissions, the conclusions of this study have the following policy implications. First, the digital transformation of production processes in various industries must be accelerated, and the huge potential of digital technology should be explored further to enable carbon emission reduction. The development of digital technology in China has played an important role in promoting economic transformation and low-carbon development. On the one hand, digital finance can deeply integrate with key carbon emission areas, such as electricity, industry, construction, and transportation, reduce energy and resource consumption, promote energy optimization in traditional industries, and achieve energy saving and cost reduction as well as quality and efficiency improvement. On the other hand, with the opportunity that the new technological revolution provides, digital finance can also accelerate the deep integration with the new generation of information technology, which can not only strengthen energy technology and modern information but also enable the exploration of energy production and new consumption patterns, promoting the enhancement of low-carbon technology and green industrial development. Meanwhile, a diversified digital platform system should be sounded to rapidly expand the potential of a low-carbon economy and further promote the green effect of digital technology.
Second, financial support for construction of the national carbon market must be strengthened to guide development of China’s economic and social green transformation. To give full play to the role of financial services in the construction of the carbon market, the underlying logic of carbon trading is the transfer of emission rights, which includes the allocation of quotas and registration transactions and other links. The prerequisite of efficient market operation is appropriate cost price. Therefore, more financial institutions and financial products, including carbon derivatives, should be introduced to help reduce transaction costs. Then, the total amount of carbon emissions in the development process of each industry should be set as early as possible. Under the total amount constraint, the market supply and demand will determine the quota trading, build a standardized carbon emission accounting system, and form a clear price signal, thus promoting low-carbon investment. Finally, we should improve the law and the policies to give full play to the role of the market mechanism, improve the carbon pricing mechanism, and strengthen the coordination of carbon emissions trading and electricity trading. The green and low-carbon development of the energy industry and the commercial sustainability of green finance must also be promoted to guarantee the promotion of the green development of China.
Finally, the green effect brought by digital finance must be expanded, and a green and low-carbon industrial structure should be formed. In the past, the development mode of high pollution, high energy consumption, low productivity, and low efficiency has seriously affected the ecological environment and is not conducive to China’s economic development. To prompt the government to increase support for green low-carbon industries and technology research and development, the development of areas, such as clean energy, energy conservation, and environmental protection, can be supported by establishing attractive monetary policy instruments for carbon emissions reduction. Meanwhile, green bond issuance must be supported, high technology must be adopted to promote the level of traditional industries, the production of green and low-carbon products should be increased, and support must be given for China to successfully achieve the carbon peaking and neutrality goals.

Author Contributions

Data curation, Q.X., S.F., M.L. and K.C.; methodology, Q.X. and S.F.; project administration, M.L.; software, Q.X.; supervision, S.F. and K.C.; writing—original draft, Q.X., S.F. and M.L.; writing—review and editing, Q.X., S.F. and K.C. All authors have read and agreed to the published version of the manuscript.

Funding

This research received no external funding.

Institutional Review Board Statement

Not applicable.

Informed Consent Statement

Not applicable.

Data Availability Statement

All data can be obtained by email from the corresponding author.

Conflicts of Interest

The authors declare no conflict of interest.

References

  1. Li, X.; Cui, S.; Lai, X. Can Digital Finance Increase the Value of Listed Companies?—Theoretical Mechanism Analysis and Empirical Test. Mod. Financ. Econ.-J. Tianjin Univ. Financ. Econ. 2020, 40, 83–95. [Google Scholar] [CrossRef]
  2. Bollaert, H.; Silanes, F.; Schwienbacher, A. Fintech and access to finance. J. Corp. Financ. 2021, 68, 101941. [Google Scholar] [CrossRef]
  3. Guo, P.; Jia, X. The structure and reform of rural finance in China. China Agric. Econ. Rev. 2009, 1, 212–226. [Google Scholar] [CrossRef]
  4. He, Z.; Song, X. How Dose Digital Finance Promote Household Consumption. Financ. Trade Econ. 2020, 41, 65–79. [Google Scholar] [CrossRef]
  5. Lee, W.C.; Cheong, T.S.; Wu, Y.; Wu, J. The Impacts of Financial Development, Urbanization, and Globalization on Income Inequality: A Regression-based Decomposition Approach. Asian Econ. Pap. 2019, 18, 126–141. [Google Scholar] [CrossRef] [Green Version]
  6. Jiang, X.; Wang, X.; Ren, J. The Nexus between Digital Finance and Economic Development: Evidence from China. Sustainability 2021, 13, 7289. [Google Scholar] [CrossRef]
  7. Li, C.; Gan, Y. The spatial spillover effects of green finance on ecological environment—Empirical research based on spatial econometric model. Environ. Sci. Pollut. Res. 2021, 28, 5651–5665. [Google Scholar] [CrossRef]
  8. Wu, Y.; Luo, C.; Luo, L. The impact of the development of the digital economy on Sulfur Dioxide emissions: Empirical evidence based on provincial panel data. J. Wuhan Polytech. 2021, 20, 82–88. [Google Scholar]
  9. Bai, L.; Chen, X. Research on the synergy of green economy and digital economy in stimulus policies. J. Dongbei Univ. Financ. Econ. 2020, 131, 73–81. [Google Scholar]
  10. Beck, T.; Levine, R.; Loayza, N. Finance and the sources of growth. J. Financ. Econ. 2000, 58, 261–300. [Google Scholar] [CrossRef] [Green Version]
  11. Lu, G.; Wang, Z.; Zang, C. Research on the Performance of Subsidizing Innovation for Chinese Strategic Emerging Industry. Econ. Res. J. 2014, 49, 44–55. [Google Scholar]
  12. He, J.Q.; Liu, R.X. Research on the Model of China’s Banking Industry Participating in Carbon Finance. East China Econ. Manag. 2012, 7, 75–79. [Google Scholar]
  13. Asongu, S.; Boateng, A. Introduction to Special Issue: Mobile Technologies and Inclusive Development in Africa. J. Afr. Bus. 2018, 19, 297–301. [Google Scholar] [CrossRef]
  14. Ding, X.; Zhou, J.G.; Qiao, J. Innovation of Policy Mechanism for Low Carbon Economy Development under the Target of Energy Saving and Emission Reduction. Sci. Technol. Manag. Res. 2014, 21, 243–250. [Google Scholar]
  15. Yang, Q. Analysis on the Mechanism of Energy Saving and Emission Reduction of China’s Green Credit Policy. Acad. Forum 2011, 34, 126–130. [Google Scholar]
  16. Chousa, J.; Tamazian, A.; Vadlamannati, K. Does higher economic and financial development lead to environmental degradation: Evidence from BRIC countries. Energy Policy 2009, 37, 246–253. [Google Scholar]
  17. Halimanjaya, A. Climate mitigation fifinance across developing countries: What are the major determinants? Clim. Policy 2015, 15, 223–252. [Google Scholar] [CrossRef]
  18. Fisher-Vanden, K.; Jefffferson, G.H.; Liu, H. What is driving China’s decline in energy intensity? Resour. Energy Econ. 2004, 26, 77–97. [Google Scholar] [CrossRef]
  19. Gujba, H.; Thorne, S.; Mulugetta, Y. Financing low carbon energy access in Africa. Energy Policy 2012, 47, 71–78. [Google Scholar] [CrossRef]
  20. Selden, T.; Song, D. Environmental Quality and Development: Is There a Kuznets Curve for Air Pollution Emissions? J. Environ. Econ. Manag. 1994, 27, 147–162. [Google Scholar] [CrossRef]
  21. Hu, J.; Wang, M. Development of China’s Finance and Carbon Dioxide Emission: A Study Based on the Panel Data at Province Level from 1998 to 2015. Shandong Soc. Sci. 2018, 272, 118–124. [Google Scholar]
  22. Harbaugh, W.; Levinson, A.; Wilson, D. Reexamining the Empirical Evidence for an Environmental Kuznets Curve. Rev. Econ. Stat. 2002, 84, 54–551. [Google Scholar] [CrossRef]
  23. Agras, J.; Chapman, D. A Dynamic Approach to the Environmental Kuznets Curve Hypothesis. Ecol. Econ. 1999, 28, 267–277. [Google Scholar] [CrossRef]
  24. Frankel, A.; Romer, D. Dose trade Cause Growth? Am. Econ. Rev. 1999, 89, 379–399. [Google Scholar] [CrossRef] [Green Version]
  25. He, G.; Zhang, Y. Influence Factors and Environmental Kuznets Curve Relink Effect of Chinese Industry’s Carbon Dioxide Emission. China Ind. Econ. 2012, 286, 26–35. [Google Scholar]
  26. Shahbaz, M.; Solarin, S.; Mahmood, H. Does Financial Development Reduce CO2 Emissions in Malaysian Economy? A Time Series Analysis. Econ. Model. 2013, 35, 145–152. [Google Scholar] [CrossRef] [Green Version]
  27. Li, Z.; Takeuchi, H. Informal Lenders and Rural Finance in China: A Report from the Field. Mod. China 2010, 36, 302–328. [Google Scholar] [CrossRef]
  28. Dollar, D.; Kraay, A. Growth is Good for the Poor. J. Econ. Growth 2002, 7, 195–225. [Google Scholar] [CrossRef]
  29. Liang, S.L.; Liu, P.P. Digital Inclusive Finance and the Income Gap Between Urban and Rural Areas. J. Cap. Univ. Econ. Bus. 2019, 21, 33–41. [Google Scholar] [CrossRef]
  30. Li, M.; Feng, S.; Xie, X. Heterogeneity Effects of Digital Inclusive Finance on Urban-Rural Income Gap. J. Nanjing Agric. Univ. Soc. Sci. Ed. 2020, 20, 132–145. [Google Scholar] [CrossRef]
  31. Puschmann, T.; Hoffmann, C.; Khmarskyi, V. How Green FinTech Can Alleviate the Impact of Climate Change—The Case of Switzerland. Sustainability 2020, 12, 691. [Google Scholar] [CrossRef]
  32. Dong, Z.; Cai, X.; Wang, L. The Direction of Technical Change, Urban Land Size and Environment Quality. Econ. Res. J. 2014, 10, 111–124. [Google Scholar]
  33. Tamazian, A.; Rao, B.B. Do Economic, Financial and Institutional Developments Matter for Environmental Degradation? Evidence from Transitional Economies. Energy Econ. 2010, 32, 137–145. [Google Scholar] [CrossRef] [Green Version]
  34. Mookerjee, R.; Kalipioni, P. Availability of financial services and income inequality: The evidence from many countries. Emerg. Mark. Rev. 2010, 11, 404–408. [Google Scholar] [CrossRef]
  35. Fowowe, B.; Folarin, E.O. The effects of fragility and financial inequalities on inclusive growth in African countries. Rev. Dev. Econ. 2019, 23, 1141–1176. [Google Scholar] [CrossRef]
  36. Greenwood, J.; Jovanovic, B. Financial Development, Growth, and the Distribution of Income. J. Polit. Econ. 1990, 98, 1076–1107. [Google Scholar] [CrossRef] [Green Version]
  37. Burgess, R.; Pande, R. Do Rural Banks Matter? Evidence from the Indian Social Banking Experiment. Am. Econ. Rev. 2005, 95, 780–795. [Google Scholar] [CrossRef] [Green Version]
  38. Townsend, R.M.; Ueda, K. Financial Deepening, Inequality, and Growth: A Model-Based Quantitative Evaluation1. Rev. Econ. Stud. 2006, 73, 251–293. [Google Scholar] [CrossRef]
  39. He, Y.; Sheng, P.; Vochozka, M. Pollution caused by finance and the relative policy analysis in China. Energy Environ. 2017, 28, 808–823. [Google Scholar] [CrossRef]
  40. Sadorsky, P. The Impact of Financial Development on Energy Consumption in Emerging Economies. Energy Policy 2010, 38, 2528–2535. [Google Scholar] [CrossRef]
  41. Kotarski, K. Financial deepening and income inequality: Is there any financial Kuznets curve in China? The political economy analysis. China Econ. J. 2015, 8, 18–39. [Google Scholar] [CrossRef]
  42. Sicular, T.; Yue, X.; Gustafsson, B.; Li, S. The urban–rural income gap and inequality in China. Rev. Income Wealth 2010, 53, 93–126. [Google Scholar] [CrossRef] [Green Version]
  43. Zhou, Y.; Fang, Z.; Li, N. How Does Financial Development Affect Reductions in Carbon Emissions in High-Energy Industries?—A Perspective on Technological Progress. Int. J. Environ. Res. Public Health 2019, 16, 3018. [Google Scholar] [CrossRef] [PubMed] [Green Version]
  44. Li, X.; Liu, J.; Ni, P. The Impact of the Digital Economy on CO2 Emissions: A Theoretical and Empirical Analysis. Sustainability 2021, 13, 7267. [Google Scholar] [CrossRef]
  45. Ozili, P.K. Impact of digital finance on financial inclusion and stability. Borsa Istanb. Rev. 2018, 18, 329–340. [Google Scholar] [CrossRef]
  46. Tong, H.; Lim, K.S. Threshold autoregression, limit cycles and cyclical data with discussion. J. R. Stat. Soc. 1980, 42, 245–292. [Google Scholar]
  47. Arif, M.; Lu, Y.; Mahmud, A. Regional Development of China’s Inclusive Finance Through Financial Technology. SAGE Open 2020, 10, 1–16. [Google Scholar] [CrossRef]
  48. Yin, Z.; Yang, Y.; Zhang, H. Financial Inclusion and Households’ Income Inequality in Beijing-Tianjin-Hebei Region: Evidence from CHFS Data. J. Beijing Technol. Bus. Univ. Soc. Sci. 2017, 32, 13–21. [Google Scholar] [CrossRef]
  49. Feng, D.; Dai, Y.; Zhang, S. Can a carbon emission trading scheme generate the Porter effect? Evidence from pilot areas in China. Sci. Total Environ. 2019, 653, 565–577. [Google Scholar]
  50. Arestis, P.; Caner, A. Financial liberalization and the geography of poverty. Camb. J. Reg. Econ. Soc. 2009, 2, 229–244. [Google Scholar] [CrossRef]
  51. Yan, Y.; An, H. Segmental Economic Space in China: Empirical Research Based on Economic Growth Spillover among Regions. Mod. Econ. Sci. 2014, 36, 47–57. [Google Scholar]
  52. Hansen, B.E. Threshold effects in non-dynamic panels: Estimation, testing, and inference. J. Econom. 1999, 93, 345–368. [Google Scholar] [CrossRef] [Green Version]
  53. Lin, G.; Long, Z.; Wu, M. A Spatial Analysis of Regional Economic Convergence in China: 1978–2002. China Econ. Q. 2005, 4, 349–356. [Google Scholar] [CrossRef]
  54. Gottmann, J.; O’Brien, R. Global Financial Integration: The End of Geography. Geogr. J. 1993, 159, 101. [Google Scholar] [CrossRef]
  55. Han, F.; Xie, R. Does the Agglomeration of Producer Services Reduce Carbon Emissions? J. Quant. Tech. Econ. 2017, 34, 40–58. [Google Scholar] [CrossRef]
  56. Guo, F.; Wang, J.; Wang, F.; Kong, T.; Zhang, X.; Cheng, Z. Measuring the Development of Digital Inclusive Finance in China: Index Compilation and Spatial Characteristics. China Econ. Q. 2020, 19, 1401–1418. [Google Scholar] [CrossRef]
  57. Zhang, Y.J. The impact of financial development on carbon emissions: An empirical analysis in China. Energy Policy 2011, 34, 2197–2203. [Google Scholar] [CrossRef]
  58. Jiang, H.; Jiang, P. Research on the Effect of Digital Inclusive Finance on the Improvement of Consumption Level and Structure Optimization. Mod. Financ. Econ. 2020, 40, 18–32. [Google Scholar] [CrossRef]
  59. Sutherland, W.; Jarrahi, M.H. The sharing economy and digital platforms: A review and research agenda. Int. J. Inform. Manag. 2018, 43, 328–341. [Google Scholar] [CrossRef]
  60. Claessens, S.; Perotti, E. Finance and inequality: Channels and evidence. J. Comp. Econ. 2007, 35, 748–773. [Google Scholar] [CrossRef]
  61. Yan, C.; Li, T.; Lan, W. Financial Development, Innovation and Carbon Emission. J. Financ. Res. 2016, 1, 14–30. [Google Scholar]
  62. Zhao, H.; Yang, Y.; Li, N.; Liu, D.; Li, H. How Does Digital Finance Affect Carbon Emissions? Evidence from an Emerging Market. Sustainability 2021, 13, 12303. [Google Scholar] [CrossRef]
  63. Yermack, D. Corporate Governance and Blockchains. Rev. Financ. 2017, 1, 7–31. [Google Scholar] [CrossRef] [Green Version]
  64. Meo, M.; Karim, M. The role of green finance in reducing CO2 emissions: An empirical analysis. Borsa Istanb. Rev. 2021. [Google Scholar] [CrossRef]
  65. Caragnano, A.; Mariani, M.; Pizzutilo, F.; Zito, M. Is it worth reducing GHG emissions? Exploring the effect on the cost of debt financing. J. Environ. Manag. 2020, 270, 110860. [Google Scholar] [CrossRef] [PubMed]
  66. Doku, I.; Ncwadi, R.; Phiri, A. Examining the role of climate finance in the Environmental Kuznets Curve for Sub-Sahara African countries. Cogent Econ. Financ. 2021, 9, 1965357. [Google Scholar] [CrossRef]
  67. Ciocoiu, C.N. Integrating digital economy and green economy: Opportunities for sustainable development. Theor. Empir. 2011, 6, 33–43. [Google Scholar]
  68. Peng, H.; Tan, X.; Li, Y.; Hu, L. Economic Growth, Foreign Direct Investment and CO2 Emissions in China: A Panel Granger Causality Analysis. Sustainability 2016, 8, 233. [Google Scholar] [CrossRef] [Green Version]
Figure 1. A partial Moran scatter diagram of carbon emissions (2011 and 2019).
Sustainability 14 08340 g001aSustainability 14 08340 g001b
Figure 2. Parallel trend test.
Sustainability 14 08340 g002
Figure 3. Propensity score matching (kernel matching).
Sustainability 14 08340 g003
Figure 4. Placebo test.
Sustainability 14 08340 g004
Table 1. Variables and data sources.
Variable TypesVariablesAbbreviationData Calculation
Dependent variableCarbon emissionsCO2CO2 = C1 + C2 + C3
Independent variableDigital financeDFPeking University Digital Financial Inclusion Index
Threshold variablesDigital thresholdDGTNumber of network access users/total population
Green thresholdGRTLogarithm of green utility model inventions in the year
Control variablesper capita GDPGDPRegional real GDP per capita
Employment rateEMPProportion of urban unit employment to total population
UrbanizationURBShare of population and area by province
Human capitalHUMNumber of students in higher education/total population
Government interventionGOVFiscal spending/GDP
Table 2. Summary statistics of main variables.
VariablesNMeanStd.Dev.MinMax
CO225025.00550.51013.05695.7735
DF25026.41321.12682.74629.6032
DGT25024.17530.91531.44837.3364
GRT25024.36531.60950.00009.1350
GDP250210.9570.56568.327015.675
EMP25020.21140.18410.00514.3462
URB25020.09440.14490.00125.1754
HUM25025.82020.98010.513710.174
GOV25020.15422.9983−2.977310.980
Table 3. Regression results.
VariablesBaseline RegressionSub-Dimensional Test
(1) FE(2) OLS(3) CO2(4) CO2(5) CO2
DF−6.286 ***−9.967 ***
(0.305)(2.780)
Coverage breadth −3.159 ***
(0.198)
Usage depth −4.589 ***
(0.245)
Digitization level −1.661 ***
(0.150)
Square items0.737 ***1.118 ***0.415 ***0.559 ***0.217 ***
(0.0328)(0.269)(0.0223)(0.0263)(0.0167)
Per capita GDP0.251 ***0.557 ***0.282 ***0.220 ***0.452 ***
(0.0431)(0.0402)(0.0445)(0.0423)(0.0481)
Employment rate−0.05780.563 ***−0.08770.0573−0.0939
(0.139)(0.162)(0.144)(0.137)(0.157)
Urbanization−0.1011.819 ***−0.0435−0.0282−0.0750
(0.0770)(0.242)(0.0798)(0.0756)(0.0868)
Human capital2.78 × 10−50.0001 **2.80 × 10−55.30 × 10−61.45 × 10⁻⁵
(2.75 × 10⁻⁵)(4.18 × 10⁻⁵)(2.85 × 10⁻⁵)(2.71 × 10⁻⁵)(3.12 × 10⁻⁵)
Government intervention−2.50 × 10⁻⁷ ***5.03 × 10⁻⁷ ***−7.95×10⁻⁸−1.93×10⁻⁷ ***1.85 × 10⁻⁷ ***
(6.50 × 10⁻⁸)(3.42 × 10⁻⁸)(6.59 × 10⁻⁸)(6.31 × 10⁻⁸)(7.18 × 10⁻⁸)
Time fixed effectyesyesyesyesyes
Urban fixed effectyesyesyesyesyes
Constant21.31 ***8.709 ***12.87 ***4.094 ***21.31 ***
(7.210)(0.665)(0.757)(0.642)(7.210)
R-squared0.4850.5710.4470.4970.339
Note: **, and *** indicate statistical significance at the 5%, and 1% levels, respectively. The values in parentheses are the clustering robust standard errors of the estimated coefficients of each variable, the same as below: The squared terms in the table represent the squared terms of digital finance, breadth, depth, and digitization, in that order.
Table 4. Robustness checks.
Variables(1)
FE
(2)
OLS
(3)
Wastewater
(4)
SO2
(5)
Solid waste
(6)
2013–2019
(7)
CO2
DF−0.234 ***−0.213 ***−0.453 ***−0.783 ***−0.460 ***−18.55 ***−6.123 ***
(0.0074)(0.0196)(0.0220)(0.0337)(0.0350)(1.842)(0.315)
Control variablesyesyesyesyesyesyesyes
Time fixed effectyesyesyesyesyesyesyes
Urban fixed effectyesyesyesyesyesyesyes
Constant5.884 ***4.055 ***11.04 ***17.02 ***15.32 ***47.28 ***9.723 ***
(0.141)(0.186)(0.448)(0.686)(0.711)(4.820)(1.286)
R-squared0.4550.1290.2980.4690.2100.5360.911
Note: *** indicate statistical significance at the 1% levels. In this study, the three industrial wastes primarily refer to industrial wastewater, SO2 emissions, and solid wastes.
Table 5. Endogenous treatment results.
Variables(1) CO2 Lagged One Period(2) Control Variables Lagged by One Period(3) IV1(4) IV2(5) Control of Traditional Finance(6) SYS-GMM
DF−7.301 ***−14.31 *** −17.649 ***−1.430 **−12.131 ***
(0.708)(0.806) (2.113)(0.638)(0.668)
L. CO2/
Instrumental variables
0.600 *** −0.080 *** 0.576 ***
(0.0191) (0.003) (0.018)
Traditional finance −5.845 ***
(1.157)
Control variablesyesyesyesyesyesyes
Time fixed effectyesyesyesyesyesyes
Urban fixed effectyesyesyesyesyesyes
Provincial fixed effectsnonononoYesno
Constant18.09 ***37.03 ***2.413 ***39.9459.723 ***27.637 ***
(1.849)(2.072)(0.007)(5.440)(1.286)(1.715)
R-squared/Sargan0.6890.5170.9990.5060.9110.998
Note: ** and *** indicate statistical significance at the 5% and 1% levels. The instrumental variables in Columns 3–4 are digital finance lagged by one period. The results of the SYS-GMM regression using digital finance lagged by one period as an instrumental variable show that AR (1) = 0.001 and AR (2) = 0.322.
Table 6. Threshold effect test results of loan size and carbon emissions.
Threshold VariableModelF-Valuep-ValueCritical Value (1%)Critical Value (5%)Critical Value (10%)
Digital thresholdSingle-threshold44.320.000036.863324.143319.5367
Double-threshold34.440.003327.697018.761416.1396
Three-threshold13.970.596748.534329.147429.1474
Green thresholdSingle-threshold49.240.003341.475736.919031.7317
Double-threshold25.940.070039.516128.809323.6279
Three-threshold15.530.773354.658845.376039.2516
Table 7. Threshold estimation results.
Threshold
Variable
ModelThreshold IntervalRegression CoefficientsThreshold VariableModelThreshold IntervalRegression Coefficients
Digital threshold
(digi)
Single- thresholddigi ≤ 4.277−4.532 ***Green threshold
(gre)
Single- thresholdgre ≤ 3.218−4.820 ***
(0.3542) (0.3369)
digi > 4.277−4.487 ***gre > 3.218−4.778 ***
(0.3561) (0.3386)
Double- thresholddigi ≤ 4.277−4.466 ***Double- thresholdgre ≤ 3.218−4.776 ***
(0.3507) (0.3349)
4.277 < digi ≤ 4.585−4.413 ***3.218 < gre ≤ 4.382−4.729 ***
(0.3511) (0.3353)
digi > 4.585−4.359 ***gre > 4.382−4.681 ***
(0.3530) (0.3371)
Note: *** indicate statistical significance at the 1% levels.
Table 8. Heterogeneity analysis based on degree of marketization.
VariablesDegree of Marketization
HighLow
DF−12.34 ***−3.784 ***
(0.725)(0.456)
Control variablesyesyes
Time fixed effectyesyes
Urban fixed effectyesyes
Constant22.26 ***7.218 ***
(3.891)(0.921)
R-squared0.4110.402
Note: *** indicate statistical significance at the 1% levels.
Table 9. Heterogeneity analysis based on digital finance characteristics.
VariablesFinancial Development LevelDigitization Level
DevelopmentUnder-DevelopmentHighLow
DF−13.67 ***−3.640 ***−11.48 ***−2.724 ***
(1.208)(0.343)(0.770)(0.302)
Control variablesyesyesyesyes
Time fixed effectyesyesyesyes
Urban fixed effectyesyesyesyes
Constant33.25 ***9.573 ***27.39 ***8.248 ***
(3.181)(0.964)(2.116)(0.808)
R-squared0.5060.3370.4520.376
Note: *** indicate statistical significance at the 1% levels. Financial development level is the ratio of financial industry employees to the regional population, and Internet penetration rate is the ratio of the number of Internet users to the regional population.
Table 10. Heterogeneity analysis based on different regions.
Variables(1)
Central
(2)
Eastern
(3)
Western
(4)
Central Cities
(5)
Non-Central Cities
DF−5.371 ***−5.188 ***−5.491 ***−5.058 ***−5.840 ***
(0.440)(0.518)(0.601)(0.482)(0.346)
Control variableyesyesyesyesyes
Time fixed effectyesyesyesyesyes
Urban fixed effectyesyesyesyesyes
Constant13.50 ***14.48 ***16.48 ***17.24 ***15.33 ***
(1.288)(1.543)(1.630)(1.468)(0.978)
R-squared0.5420.5460.5300.5600.540
Note: *** indicate statistical significance at the 1% levels. The central cities in this study are classified according to the National Urban System Plan prepared by the state, and the rest are non-central cities.
Table 11. Spatial correlation test.
YearDigital FinanceCO2 Emissions
Moran’s IZ-ValueMoran’s IZ-Value
20110.274 ***9.0770.134 ***4.814
20120.253 ***8.3800.138 ***4.916
20130.282 ***9.3360.142 ***5.040
20140.288 ***9.5350.137 ***4.841
20150.288 ***9.5320.130 ***4.621
20160.266 ***8.7950.138 ***4.920
20170.255 ***8.4540.115 ***3.977
20180.213 ***7.0670.112 ***3.871
20190.199 ***6.6220.104 ***3.600
Note: *** indicate statistical significance at the 1% levels.
Table 12. Empirical results of the spatial spillover test.
VariablesGeographical Distance MatrixEconomic Distance Matrix
SARSEMSDMSARSEMSDM
DF−3.048 **−4.437 ***−5.038 ***−3.212 **−3.545 ***−1.881
(1.331)(1.427)(1.489)(1.391)(1.363)(1.562)
ρ/λ −2.053 ***−2.429 ***−1.199 ***0.0233−0.0866 **−0.0794 **
(0.176)(0.161)(0.334)(0.0310)(0.0348)(0.0351)
W × DF −77.18 *** −7.434 **
(26.45) (3.026)
Control variableyesyesyesyesyesyes
Sigma1.477 ***1.482 ***1.454 ***1.611 ***1.605 ***1.580 ***
(0.0407)(0.0420)(0.0408)(0.0455)(0.0454)(0.0447)
Log-likelihood−4088.548−4061.345−4037.565−4146.475−4143.665−4122.614
Spatial effect decompositionDirect effectIndirect effectTotal
effect
Direct
effect
Indirect effectTotal
effect
DF−4.781 ***−34.57 **−39.35 **−1.745−6.904 **−8.649 ***
(1.512)(15.99)(16.43)(1.620)(2.841)(2.490)
R-squared0.3210.1740.0800.1860.1870.158
Note: ** and *** indicate statistical significance at the 5% and 1% levels.
Table 13. DID and robustness results.
Variables(1) CO2(2) CO2(3) Winsorized(4) Counterfactual Method(5) PSM-DID(6) Placebo
treati×postt−0.167 ***−0.101 **−0.138 ***−0.079−0.145 ***−0.018
(0.0559)(0.0503)(0.0498)(0.0510)(0.0532)(0.0229)
Constant0.0115−5.972 ***−1.298 ***0.126−1.626 ***−2.831 ***
(0.630)(0.568)(0.494)(0.502)(0.528)(0.516)
Control variableyesyesyesyesyesyes
Time fixed effectyesnoyesyesyesyes
Urban fixed effectyesnoyesyesyesyes
R-squared0.3970.3490.2510.4100.2520.464
Note: ** and *** indicate statistical significance at the 5% and 1% levels.
Publisher’s Note: MDPI stays neutral with regard to jurisdictional claims in published maps and institutional affiliations.

