Article

Causes and Evolution Characteristics of Green Innovation Efficiency Loss: The Perspective of Factor Mismatch under Local Government Competition

1
School of Philosophy, Northwest University, Xi’an 710127, China
2
School of Public Administration, Northwest University, Xi’an 710127, China
*
Author to whom correspondence should be addressed.
Sustainability 2022, 14(14), 8338; https://doi.org/10.3390/su14148338
Submission received: 20 May 2022 / Revised: 18 June 2022 / Accepted: 23 June 2022 / Published: 7 July 2022

Abstract

:
The objective of this paper is to measure the efficiency loss of green innovation caused by local government competition and explore its causes and evolution characteristics. Based on the equimarginal principles such as the deviation of the allocation of green innovation output factors, this paper uses the panel data of China’s provinces (excluding Tibet, Hong Kong, Macao and Taiwan) from 2000 to 2020 and employs the spatial panel measurement model and the Kernel density estimation. The study finds that first, local government competition causes the mismatch of local innovation factors not only locally but also in neighboring regions. Second, the mismatch of innovative talents and capital caused by local government competition lowers the green innovation efficiency. Third, the shortage of innovative talents caused by local government competition is the main reason for the loss of green innovation efficiency in Beijing, Tianjin, and Shanghai. Fourth, the degree of efficiency loss of green innovation at the provincial level in China is heterogeneous in government competition strategies, and the loss due to tax competition is the most significant. Fifth, although the loss of green innovation efficiency generally decreases yearly, in the future, the institutional competition will still hinder the improvement of green innovation efficiency in the eastern, central and western regions of China. Our policy suggestions include promoting regional cooperation and cultivating innovative talents to further improve the efficiency of green innovation.

1. Introduction

With the world’s attention to sustainable development, the resource-driven development model in the past has been challenged. Innovation, especially green innovation, is a “core engine” of sustainable development. In order to promote technological progress and sustainable development, the input intensity of innovative elements in various parts of China has exploded. From 2000 to 2020, the average annual growth rate of innovation capital investment was 198%, and the full-time equivalent annual growth rate of innovation personnel was 23%. However, the annual growth rate of green innovation efficiency was only 6% compared with that of inefficiency in 2002 (Figure 1). In other words, the input of innovative elements couldn’t be effectively transformed into innovative green output [1], and the driving force for sustainable development is limited [2]. Hence, at this stage, a question of theoretical and practical significance is: why can’t the input of innovative elements effectively facilitate green technological progress and sustainable development?
A fact related to the increased investment in regional innovation factors but low innovation efficiency is a pronounced regional bias and spatial distortion in allocating the innovation factors [3]. The literature shows that the spatial mismatch of innovation elements will significantly inhibit the growth of innovation efficiency, resulting in regional differences in innovation and ecological development efficiency [4,5]. Hence, at this stage, how should we optimize the spatial allocation of innovation elements, improve regional innovation efficiency, especially green innovation output, and then promote sustainable development? From the perspective of local government competition, analyzing the root of spatial mismatch of innovation elements is helpful in explaining the causes and mechanism of regional green innovation efficiency loss.
For a country like China, fiscal decentralization makes local governments compete horizontally for limited resources. However, it is a kind of “soft-constrained competition” [6,7]. In the competition process, it is not affected by market factors such as price, cost, and interest rate. However, in order to be competitive, it is necessary to adjust public expenditure, taxation, and policy, interfere with the allocation of these factors, and facilitate economic growth. While local government competition helps stimulate innovation and economic growth [8], it also hurts factor allocation. Under the political governance structure of “economic decentralization”, local government has greater freedom to maximize its fiscal revenue or self-interest through government interventions [9]. This leads to the dilemma of “competition for growth or future”, resulting in investment bias, overcapacity, performance projects [10], market segmentation [11], and rent-seeking behavior [12]. This further distorts the allocation of innovation elements.
This paper makes several major contributions. First, it is the first to study the spatial mismatch of innovation elements caused by local government competition. Second, it analyzes the causes of innovation efficiency loss. Third, it estimates the degree of regional innovation efficiency loss and thus opens the “black box” of green innovation efficiency loss caused by local government competition. Fourth, our research results provide policy insights for improving regional green innovation efficiency and achieving sustainable development.
The main contributions of this paper are achieved by constructing a general equilibrium model of multi-sector competition. Starting from the internal mechanism of factor allocation, the paper evaluates the efficiency loss of green innovation caused by local government competition in different provinces in China. The above research process is of certain significance to scientifically examine local relations, stimulate factor vitality, optimize the allocation of innovative factors, and promote green and sustainable development.
The rest of the paper is organized as follows. First, the general equilibrium model is constructed to deduce the theoretical framework of the influence of local government competition on the spatial mismatch of innovation elements and the loss of green innovation efficiency caused by the mismatch of innovation elements; Second, the spatial panel model and multi-sector general equilibrium model are constructed to estimate the loss of green innovation efficiency caused by the misallocation of innovation elements caused by local government competition. Third, the loss of green innovation efficiency of each province in China is described and analyzed, and the loss source is decomposed. Fourth, the Kernel density estimation method is used to describe the loss value and evolution characteristics of green innovation efficiency in China’s four sectors. And the loss sources are analyzed from the perspective of local government competition.

2. Literature Review

Scholars have measured the efficiency of provincial green innovation in China. Some literature have also studied the efficiency of green innovation from the perspective of innovation factor allocation [13]. Most papers argue that optimizing the allocation of innovation factors can improve green technology innovation efficiency. For example, Yang et al. [14] believed that industrial agglomeration can improve the allocation of innovation factors and promote sustainable development. Zhou et al. [15] proposed that accelerating the flow of innovation factors and optimizing the allocation of innovation factors can improve the efficiency of the green economy. And many scholars also analyzed the impact of innovation factors such as capital or talent on green innovation efficiency [16,17,18]. Focusing on capital input, some scholars show that the increase of capital input can effectively improve the input level of enterprises in environmental governance, thus promoting environmental product innovation and improving green innovation efficiency [16,17]. Some scholars believe that capital input can be transformed into R&D capital, education capital and other forms to promote human capital accumulation and effectively improve green innovation [17]. Although optimizing the allocation of innovation factors or increasing their input levels will help green innovation, the consequent mismatch of innovation factors may also lower green innovation efficiency. Yang et al. [19] proved that capital mismatch might be a critical factor inhibiting the improvement of green innovation performance because of impeding technological innovation. In addition, the agglomeration or transfer of human capital in a region will also affect the innovation factor allocation in the neighborhood regions [20].
A key point of local government competition is reflected in the allocation of production factors. There may be a multi-objective principal-agent relationship between the central government and local government. If the central government’s incentive target focuses on economic indicators, local governments may not only allocate resources to industries conducive to short-term GDP growth but also engage in “factor competition” among themselves [21,22]. This is done through various means such as fiscal expenditure competition, tax competition, and institutional competition, distorting the allocation of innovation factors and hurting the green innovation efficiency. Previous studies also examined the relationship between local government competition and green innovation efficiency. They conducted in-depth analysis from multiple perspectives, such as the government’s environmental decentralization structure and resource allocation strategy [23,24]. Among them, Nie et al. [25] used the data of prefecture-level cities and found that local government competition can help green innovation through the establishment of development districts. However, Deng et al. [26] argued for an inverted U-shaped relationship between government competition and green technology innovation efficiency. In the context of a “political tournament”, local governments may adjust the investment ratio between environmental governance and investment expenditure, pursue short-term growth, and thus hinder green technology innovation. Zhang et al. [27] divided local government competition into three dimensions: growth competition, fiscal competition, and investment competition. Zhang et al. [27] constructed an empirical model and find that the three competition types all significantly inhibit green innovation efficiency through the intermediary variable of environmental regulation.
In conclusion, previous studies show that innovation factor mismatch will lower green innovation efficiency. However, their conclusions on the impact of local government competition on green innovation efficiency are inconsistent. The reason is that the mechanism of local government competition leading to green innovation efficiency has not been clarified. Furthermore, the factors for the loss of green innovation efficiency are attributed to environmental governance expenditure, while the internal mechanism of local government intervention in the allocation of innovation factors is not discussed. In fact, local governments may have a strong incentive to intervene in the allocation of innovation factors as they seek to win the competition under the “promotion tournament”. This behavior leads to market segmentation, factor flow constraints, factor allocation distortion, and innovation efficiency loss [28,29]. However, few studies have investigated the loss of green innovation efficiency from the perspective of distorted allocation of factors under government competition. As a result, there are still “black boxes” on how local government competition affects green innovation efficiency. In addition, studies are done often without objectively measuring the degree of efficiency loss in green innovation caused by mismatching of various innovation factors in various provinces.

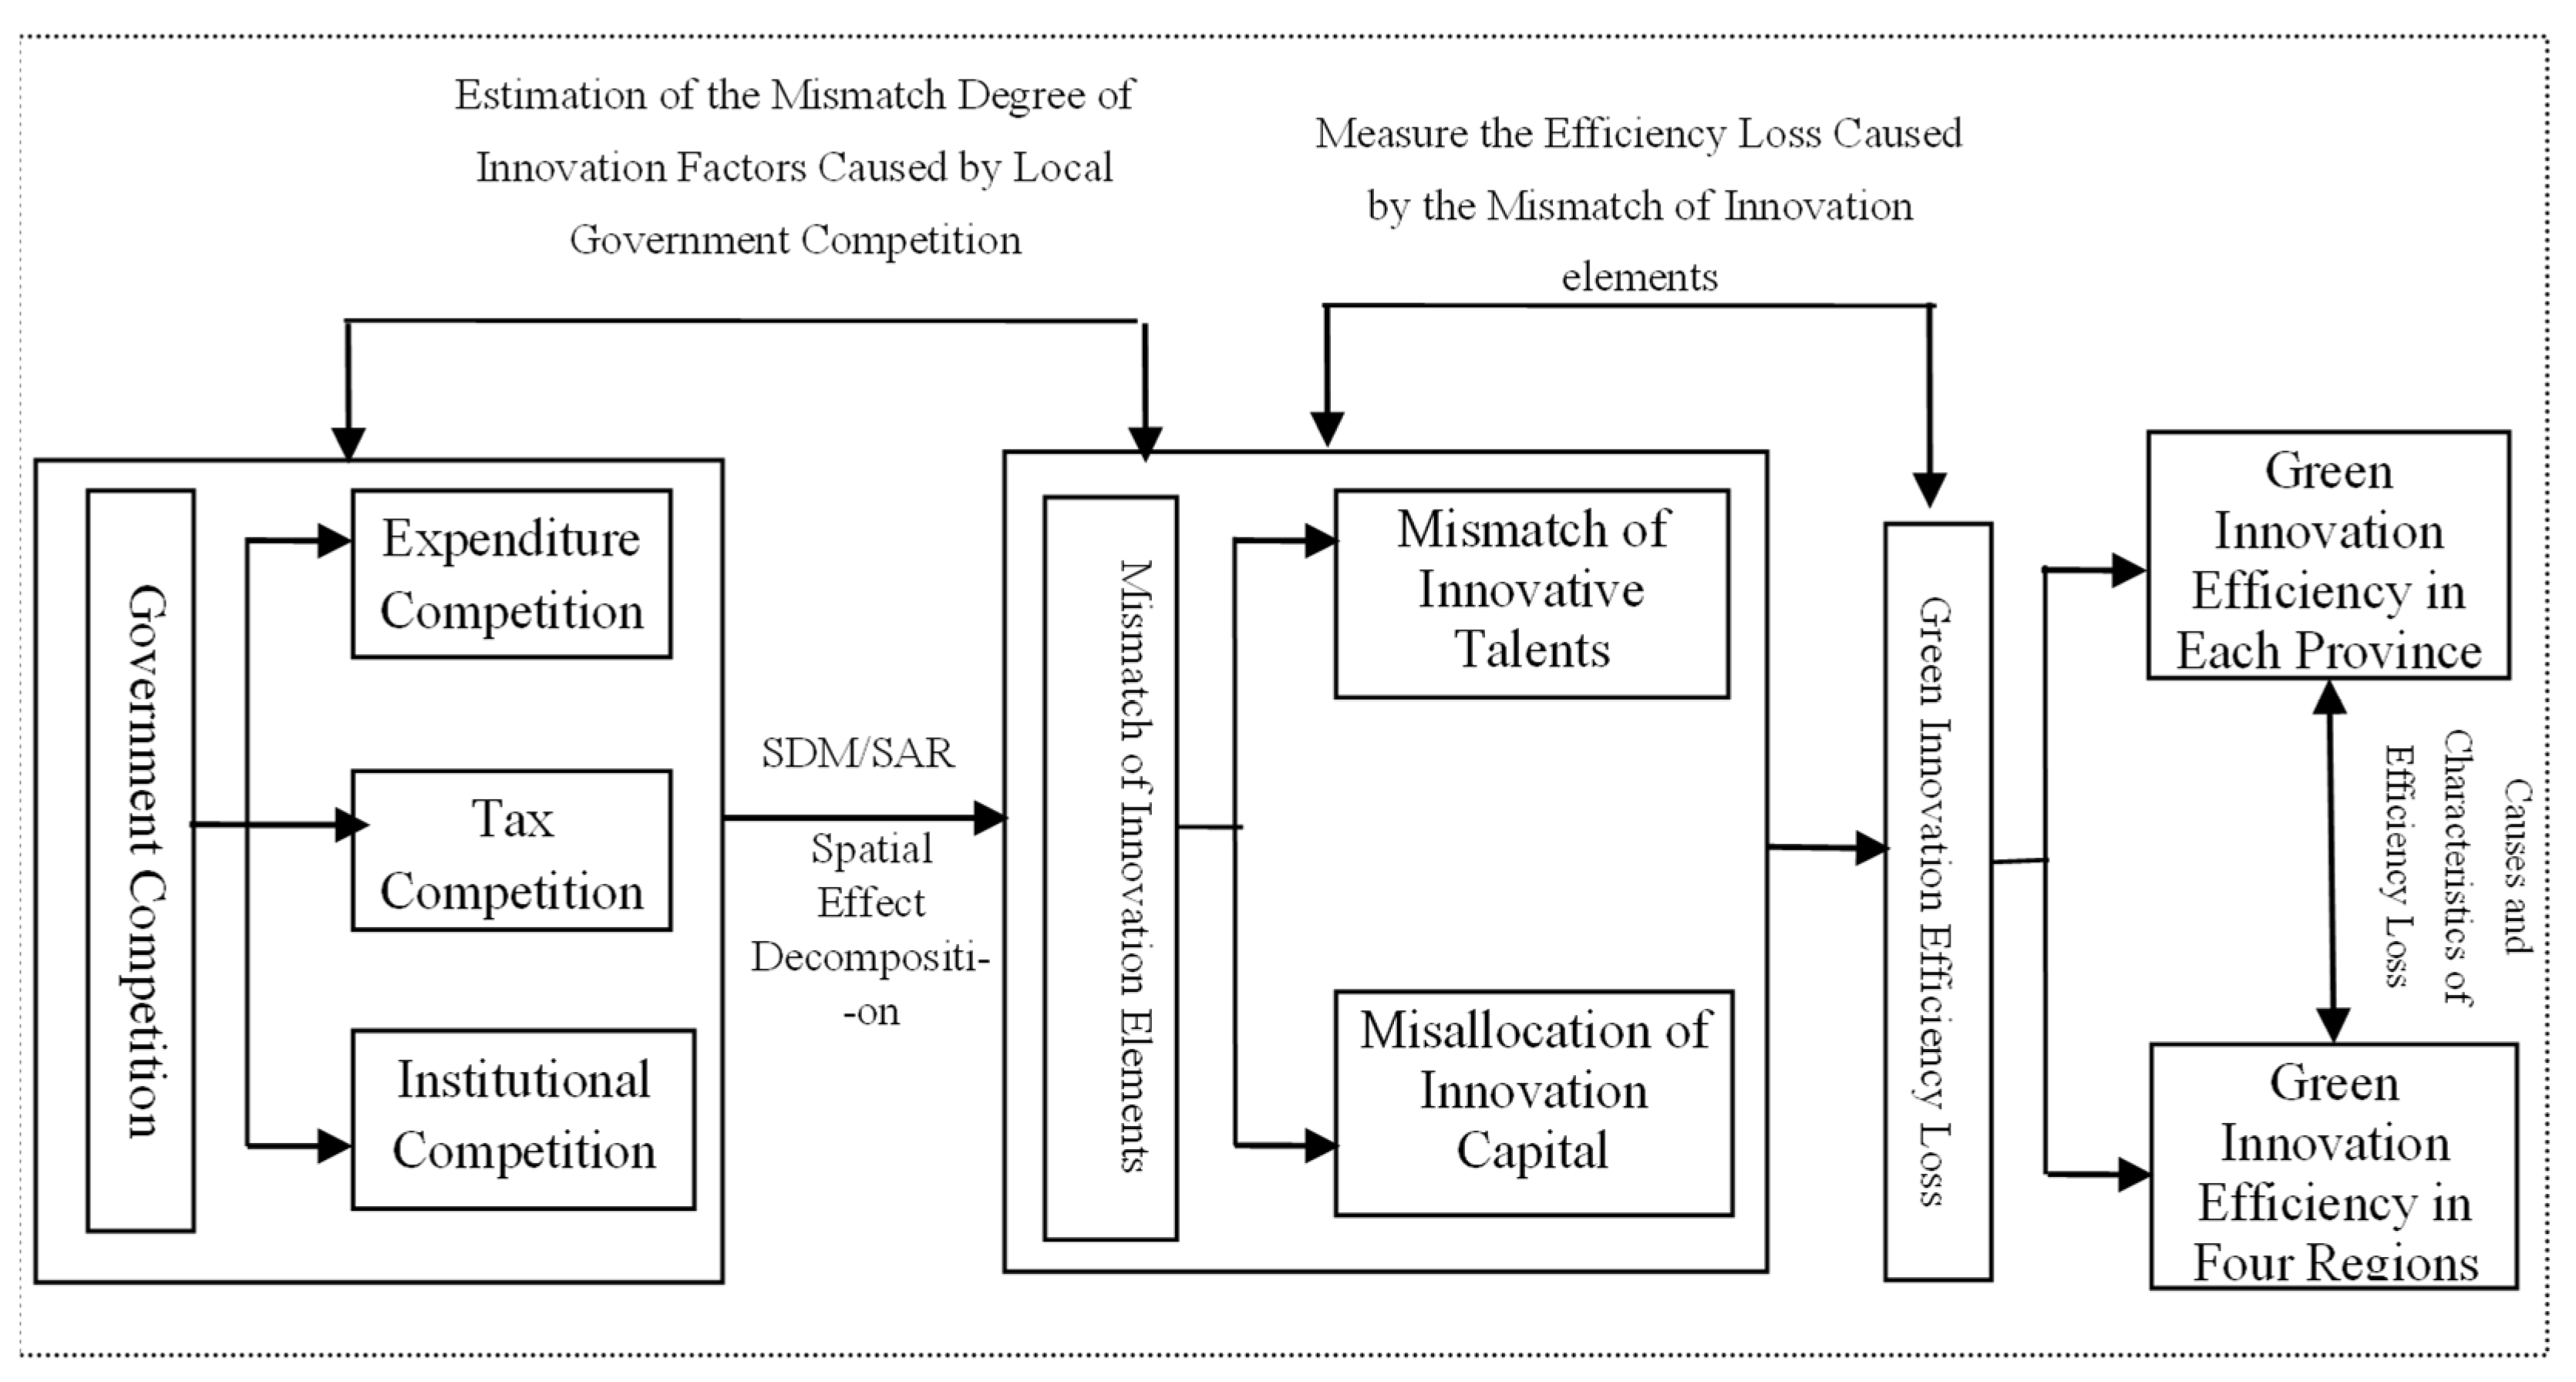
3. Theoretical Framework

3.1. Local Government Competition and Innovation Elements Mismatch

The spatial economic models represented by the core-edge model include the cost of factor flow and spatial agglomeration effect in the analysis category, which accords with the characteristics of innovation factor flow [30]. Hence, it is adopted in this research to analyze the spatial mismatch of innovation factors.
It is assumed that the entire region is composed of two heterogeneous regions A and B. And two production factors H and L are used for production, where H represents innovation factors, such as intellectuals. L is for traditional factors of production, such as industrial workers. Region A is relatively more developed with more innovation elements and higher output level and factor cost (in reality, the average wage level in developed regions is high), while Region B is less developed with less poor innovation elements and lower output level and factor cost. The total amount of innovation factors is constant in the two regions. These factors can flow between the regions but with a certain flow cost. The higher the flow cost, the greater the difference in the price of innovation factors in the two regions. The production industries in each region can be divided into innovative industry X with an agglomeration effect and traditional industry Y without an agglomeration effect. Assuming that consumers in different regions have the same consumption utility function, the consumption of innovative industries and traditional industries are F 1 and F 2 , and the price of the innovation factor is expressed as P i .
Consumer behavior analysis: In all regions, consumers make consumption decisions to maximize personal utility under budget constraints, as shown below:
m a x U = m a x F 1 θ F 2 θ 1 ;   s . t   P 1 F 1 + P 2 F 2 = C  
where U represents consumer utility and θ represents consumption elasticity. The optimal solution of (1) can be obtained:
F 1 = θ C P 1 ; F 1 = 1 θ C P 2 ;
Assuming that there is a substitution relationship between consumers’ consumption of the products of the two industries , the consumption objective function of regional consumers can be expressed as below:
m a x U A = ( F A 1 1 + F A 1 1 ) 1 ;   s . t     P A 1 F A 1 + P A 2 F A 2 = θ C
Analysis of producer behavior: The cost of producers is divided into the use cost of innovative elements C H and the use cost of traditional elements C L . It is assumed that the use cost of traditional elements is similar between regions and the relationship between the use cost of innovation elements in developed regions ( C H A ) and less developed regions ( C H B ) is mainly compared. In order to maximize the revenue of local governments, local governments have positive incentives to carry out inter-governmental competition. Through fiscal and tax competition, institutional competition and other means, local governments can attract the inflow or hinder the outflow of innovative factors to improve regional development level and government performance. The institutional bias generated by inter-regional local government competition is represented by G i , and the total amount of factor use is represented by d i , which can further express the producers’ objective function profit maximization as below:
m a x π i = P i d i G i C L + C H d i   s . t .       d i = θ P i θ
To construct the Lagrange function, the optimal solution to (4) can be obtained as follows:
P i = 1 G i C L + C H i  
Equation (5) shows that the innovation factor price P i is affected by institutional bias G i caused by government competition, and the larger the institutional bias G i caused by local government competition is, the higher the innovation factor price is, the greater the resistance of innovation factor flow is, and the innovation factor mismatch is more likely to occur.

3.2. Mismatching of Innovation Elements and Loss of Green Innovation Efficiency

Based on the analysis framework of innovation factor mismatch caused by local government competition, the regional green output efficiency is analyzed. The regional selection of producers determines the spatial allocation of innovation factors and the green output efficiency of the region. However, in the process of production location transfer, producers are faced with the transfer cost of elements or products, which includes both the transportation cost of elements or products and other transaction costs caused by institutional friction. It is called iceberg cost and set as τ . If manufacturer M in region A wants to sell 1 unit of product in region B, it must ship products to τ units in region B τ 1 . τ-1 units of product will be “melted” during transportation. It is further assumed that the market volumes of regions A and B are χ A and χ B respectively, and χ A + χ A = 1 . Therefore, under the action of institutional bias G i caused by iceberg cost and local government competition, the optimal returns of producers in regions A and B can be expressed as below:
π A = χ A P A D A + χ A P A D A   1 + τ G A C L + C H A d A  
π B = χ B P B D B + χ B P B D B 1 + τ G B C L + C H B d B  
To achieve producer and consumer equilibrium, the followings can be obtained:
π A = χ A β 1 G A C H A 1 + 1 1 + τ χ B β 1 G A C H A 1 G A C H A β 1 G A C H A   = ( χ A + χ B 1 + τ ) β 1 G A C H A 1 1 β 1 G A C H A 1  
π B = χ B β 1 G B C H B 1 + 1 1 + τ χ B β 1 G B C H B 1 G B C H B β 1 G B C H B   = ( χ B + χ A 1 + τ ) β 1 G B C H B 1 1 β 1 G B C H B 1
The output of regional spatial allocation of the two innovation factors is compared, and the output of producers is also compared with δ A / B . We can have:
δ A / B = ( χ A + χ B 1 + τ ) β 1 G A C H A 1 ( χ B + χ A 1 + τ ) β 1 G B C H B 1 = χ A + χ B + τ χ A χ B + χ B + τ χ B G A C H A G B C H B 1  
It can be seen from (10) that regional green output efficiency is determined by local government system preference G A G B , innovation factor cost difference C H A C H B , and spatial migration cost (1 + τ). It can be deduced from the above model that local government competition will lead to a spatial mismatch of innovation elements and then efficiency loss of green innovation. Among them, iceberg cost τ also reflects the segmentation of regions A and B. The more serious the segmentation, the higher the iceberg cost, the more difficult the flow of innovation elements, innovation elements are more prone to spatial mismatch.
It can be deduced from the above model that local government competition will lead to the spatial mismatch of innovation elements, thus leading to the loss of innovation efficiency. Green innovation is one of the components of innovative products, which further proves that local government competition will lead to the spatial mismatch of innovation elements, leading to the loss of green innovation efficiency.

4. Research Design

4.1. Local Government Competition and Innovation Factor Mismatch

4.1.1. Model Construction of Local Government Competition

(1)
Benchmark model
Starting with the allocation of innovative elements, the “black box” of the mechanism of regional green innovation efficiency loss caused by local government competition can be opened. Here, we follow the general nested space model (GNSM) established by Elhorst [31,32], which is a general form of the spatial panel model. In the specific estimation, one of three forms, namely, spatial error model (SEM), spatial autoregressive model (SAR), and spatial Durbin model (SDM), is further optimized.
Following Elhorst [31], the effect value of local government competition on the spatial allocation of innovative elements can be estimated below:
μ = ψ 0 + ρ T W × μ + X ψ 1 + T W × X θ 0 + ψ 2 X c o n t r o l + T W × X c o n t r o l θ 1 + ϕ i + ϕ t + ξ ; ξ = λ 0 T W × ξ + ε
In (11), ψ 0 is a constant term, ψ 1 . ψ 2 is K × 1 dimensional explanatory variable coefficient. K   is the number of explanatory variables. ρ is the spatial lag term coefficient of dependent variables. θ 0   and   θ 1 are the spatial interaction term coefficients of K × 1   dimensional explanatory variables. ϕ i   and   ϕ t are the individual effect and the period effect, respectively. ξ   and   ε are the random disturbance terms that satisfy the independent and identically distributed condition.
T W is an exogenous spatio-temporal weight matrix, which reflects the relationship between the investigated objects from the perspective of space. It is easier to compare because of the adjacent areas [33]. Therefore, this paper constructs a spatial geographic distance weight matrix where w i j is calculated by:
w i j = 1 d i j , i j 0 , i = j
In (12), d i j is the geographical distance between the provincial capitals of i province and j province. Specifically, it is the spherical distance between provincial capitals measured by the Harversine formula shown below:
Harversine = d R = harversine θ 1 θ 2 + cos θ 1 cos θ 2 Haevesine φ 1 φ 2  
In (13), is the spherical distance between two provincial capitals, R is the radius of the earth, θ 1 , φ 1   is the latitude and longitude of the provincial capital of region i , and θ 2 ,   φ 2   is the latitude and longitude of the provincial capital of region j .
(2)
Spatial effect decomposition model
Because the spatial econometric model contains the spatial lag term of variables, the regression coefficient directly estimated by the model cannot effectively describe the relationship between variables. According to Lesage et al. [34], explanatory variables not only directly affect the explained variables but also affect the explained variables in the adjacent areas. By partial differentiation of the regression equation of the spatial econometric model, the direct and indirect effects among variables can be decomposed. Here, due to space limitation, only the decomposition process of SDM is reported [35].
According to the regression equation of the SDM model, its general expression can be converted below:
I N ρ W μ = ξ N ψ 0 + ψ X + θ W X + ε
Ordering T W = ( I N ρ W ) 1   and C M W = T W I N ψ M + θ M W , (13) can be simplified to the following by multiplying both sides by T W :
μ = M = 1 K C M W X M + T W ξ N ψ 0 + T W ε  
Expressed by a matrix, (14) can be transformed into:
μ 1 μ 2 μ N 1 μ N = M = 1 K C M ( W ) 11 C M ( W ) 12 C M ( W ) 12 C M ( W ) 21 C M ( W ) 12 C M ( W ) 12 C M ( W ) N 1 1 C M ( W ) N 1 2 C M ( W ) N 1 N C M ( W ) N 1 C M ( W ) N N C M ( W ) N N x 1 M x 2 M x N 1 M x N M + T W ξ N ψ 0 ' + ε
In (16), X M represents the M explanatory variable. Matrix C M W is a partial differential matrix proposed by LeSage et al. [34], which is suitable for the measurement of spatial econometric models. Among them, the direct effect can be expressed as d i r e c t = μ i / X i M = C M ( W ) i i , which measures the average influence of independent variable X i M on internal variables in this unit. The spatial influence can be expressed as i n d i r e c t = μ i / X j M = C M ( W ) i j , which measures the average influence of the explanatory variable X i M on the explained variables of other spatial units, while the total effect caused by the change of explanatory variable X i M is t o l t a l = C M ( W ) i i + C M ( W ) i j .

4.1.2. Variable Measurement and Data Description

(1)
Mismatch coefficient of innovation elements
The mismatch between innovation elements and its resulted green innovation efficiency loss is the focus of this paper. Following the established general equilibrium model of multi-sector competition [36], the innovation production function containing innovation elements is constructed, and the efficiency loss caused by mismatch is further measured by constructing the mismatch coefficient.
Consider an economy with N regions, and the mismatch of elements among regions is our key concern. Therefore, we can think that the innovative production function of the same region is the same. That is to say, each region is considered to be engaged in innovative production activities by an innovative representative enterprise. And all innovative enterprises use two innovative elements, namely D H (innovative talents) and D R (innovative capital). Similar to Hsien et al. [4] hypothesized, the distortion of innovative elements faced by innovative enterprises is reflected in their costs in the form of ad valorem tax [37]. Therefore, the cost of innovative capital faced by innovative enterprises in region i is 1 + τ R i t r t , and the cost of innovative talents is 1 + τ H i t w t , of which r t and w t respectively represent the price level of innovative capital and talents when there is no factor price distortion in the competitive market. τ R i t and τ H i t represent the distortion tax of two innovative elements in region i , respectively. Thus, the innovative production function of region i is obtained as below:
D Y i t = T E E i t ( D H ) i t α i ( D R ) i t β i
In (17), D Y i t is the green innovation output of region i in t period. T E E i t is the green innovation efficiency of region i   in t period. D H i t and D R i t are the innovation talents and capital input of region i in t period. α i and β i are the output elasticity of innovation talents and capital, respectively. According to Jin et al. [38], the input-output elasticity of innovation capital and talents in China’s innovation production function, α i , is 1/3. Furthermore, existing research confirms that the innovation production function roughly conforms to the assumption of constant returns to scale. Hence, this paper also uses α i = 1/3   and   β i = 1/2. In addition, following existing studies such as Wang et al. [39], it is further assumed that the final green innovation output of the whole economy is the Cobb-Douglas production function of green innovation output of each region with a constant scale of return:
D Y t = F D Y i t D Y N t = i = 1 N D Y i t φ i t
In (18), D Y i t represents the total innovation output of the whole economy in t period. Here, this paper assigns the green invention patent to finally measure the green innovation output of each region.
We standardize the final innovative product price. That is, P t = 1 . And the price of intermediate product i is P it . φ i t   represents the output elasticity of region i in t period, and we have i = 1 N φ i t = 1 . Then, when the final green innovation output is maximized, the following can be obtained:
D Y t D Y i t = P i t  
Because the return on the scale of the final green innovation output function is constant, the following can be solved by the Euler theorem:
D Y t = i = 1 N P i t D Y i t
Further, we have:
D Y t D Y i t = φ i t D Y t D Y i t  
Combining (19) with (21), we have φ i t = P i t D Y i t D Y t , which is the share i of regional green innovation output. Furthermore, because there is a significant positive correlation between R&D personnel and innovation [40], this paper follows Bai et al. [41] and measures the investment of innovative talents with the full-time equivalent of R&D personnel. Further, it adopts the perpetual inventory method to measure the investment of innovative capital:
D R i t = 1 η D R i t 1 + D K i t  
In (22), η is the depreciation rate of innovative capital, which is set at 15% [42]. D K i t is the internal expenditure of R&D funds in each period. The stock of innovation capital in the base period is D R i b = D K i b / g i + η . g i , which indicates the average growth rate of internal expenditure of R&D funds in region i in the sample period. If D H i t and D R i t are exogenous, we have the following constraint:
i = 1 N D H i t = D H t , i = 1 N D R i t = D R t
Based on the assumptions above, the profit maximization of the innovative green production in region i can be expressed as:
max D H i t , D R i t π i t = P i t D Y i t 1 + τ H i t w t D K i t 1 + τ R i t r t ( D K ) i t  
Then, the following can be obtained based on the first-order condition of profit maximization:
α i P i t Y i t D H i t = 1 + τ H i t w t , β i P i t Y i t D K i t = 1 + τ R i t r t ,  
According to (25) and (23), the actual investment amount of innovative talents in region i can be calculated:
D H i t = D H i t i = 1 N D H i t D H t = α i P i t Y i t 1 + τ H i t w t i = 1 N α i P i t Y i t 1 + τ H i t w t D H t = α i P i t Y i t 1 + τ H i t w t Y i t i = 1 N α i P i t Y i t 1 + τ H i t w t Y i t D H t = α i φ i t 1 + τ H i t i = 1 N α i φ i t 1 + τ H i t D H t
When there is no mismatch of innovative talents in region i , τ H i t = 0 . The number of innovative talents invested in region i under barrier-free conditions is shown below:
D H i t * = α i φ i t i = 1 N α i φ i t D H t  
Further, the mismatch degree of innovative talents in region i is measured by using the proportion of innovative talents actually distributed in region i and the proportion of innovative talents under barrier-free conditions. That is, the spatial mismatch coefficient of innovative talents is:
μ H i t = D H i t / D H t D H i t * / D H t = D H i t / D H t α i t φ i t i = 1 N α i φ i t  
If μ H i t > 1 , it means that the actual investment of innovative talents is greater than that of the barrier-free investment, and the innovative talents market is positively distorted. If μ H i t < 1 , it means that the actual investment of innovative talents is less than the barrier-free investment, and there is a negative distortion in the innovative talent market. Similarly, the mismatch coefficient of innovation capital space μ R i t can be obtained below:
μ R i t = D R i t / D R t D R i t * / D R t = D R i t / D R t β i φ i t i = 1 N β i φ i t  
Since the total return to scale remains unchanged, the sum of the output share of a factor in each region and the elasticity of that factor in that region is equal to the overall output elasticity of that factor. So there is α t = i = 1 N α i t φ i t , β t = i = 1 N β i t φ i t , μ R i t and μ H i t can be respectively expressed as:
μ H i t = D H i t / D H t α i t φ i t α t , μ R i t = D R i t / D R t β i t φ i t β t  
(2)
Local government competition
According to the primary means of local government intervention when allocating innovation factors, this paper divides local government competition into three dimensions: expenditure competition, tax competition, and institutional competition. The specific measurement methods are as follows:
Expenditure Competition (excom): Based on Zhong et al. [43], the total expenditure of local public finance is measured as the proportion of GDP, and the measurement results reflect the influence of regional public service supply level caused by expenditure competition on the spatial allocation of innovation elements.
Tax Competition (taxcom): Based on Xiao et al. [44], t a x c o m i t = t a x t / G D P t / t a x i t / G D P i t is used to measure tax competition, in which t a x t and t a x i t represent the total tax revenue of China in year t and the total tax revenue of region i in year t , respectively. G D P t and G D P i t represent the gross domestic product of China in year t and the gross domestic product of region i in year t , respectively.
Institutional Competition (inscom): Based on Zhang et al. [45], the ratio of registered population to permanent population is used to measure the level of household registration system competition.
(3)
Other variables
In this paper, industrial structure (Ind), degree of openness to the outside world (Open), degree of regional industry-university-research cooperation (Unrden), and level of regional economic development (Eco) were used as control variables that affected the allocation efficiency of innovation factors. Among them, the industrial structure is measured by the proportion of the gross output value of the secondary and tertiary industries to the regional gross output value. The degree of opening to the outside world is measured by the proportion of export volume to GDP. The reason for choosing this variable is that FDI is an important channel for cross-border technology transfer, which has a significant impact on regional innovation and development [46]. The cooperation degree of regional Industry-University-Research is measured by the proportion of enterprises’ investment in scientific research institutions and efficient funds. Finally, the regional economic development level is measured by the regional per capita GDP.
In this paper, the data of 30 provinces and regions in China (excluding Tibet, Hong Kong, Macao, and Taiwan) from 2000 to 2020 are taken as the research samples. The original data related to local government competition and innovation factors come from the CSMAR database, CNRDS database, China Statistical Yearbook of Science and Technology, and China Statistical Yearbook. Data related to other variables come from the China Population and Employment Statistical Yearbook, China Science and Technology Statistical Yearbook, China Statistical Yearbook, the official website of the National Bureau of Statistics, and provincial statistical bulletins.

4.2. Calculation of Loss of Green Innovation Efficiency Caused by Mismatching of Innovation Elements

It is necessary to further measure how much green innovation efficiency loss will be caused by the spatial mismatch of innovation elements caused by local government competition. Here, the counterfactual test idea is adopted to calculate the degree of efficiency loss of green innovation caused by the mismatch of innovation elements due to local government competition. The specific steps are as follows.
First, calculate the efficiency loss of each province in the sample period. First, substituting (29) into (17), the actual green innovation output can be obtained as below:
D Y i t = T E E i t φ i t α i α t μ H i t ( D H ) t α i φ i t β i β t μ R i t ( D R ) t β i  
The output without resource allocation distortion can be expressed as:
D Y i t * = T E E i t φ i t α i α t ( D H ) t α i φ i t β i β t ( D R ) t β i  
Taking logarithms on both sides of (31) and (32), we have the followings:
ln D Y i t = ln T E E i t + ln φ i t α i α t α i β i β t β i + α i ln ( D H ) t + β i ln ( D R ) t + α i ln μ H i t + β i ln μ R i t
ln D Y i t * = ln T E E i t + ln φ i t α i α t α i β i β t β i + α i ln ( D H ) t + β i ln ( D R ) t
Since Δ ln D Y i t = ln D Y i t D Y i t 1 = ln D Y i t ln D Y i t 1 , where Δ ln D Y i t represents the green innovation output growth rate of region i with innovation resource mismatch in period t , Δ ln D Y i t   can be decomposed into the following according to (33):
Δ ln D Y i t = Δ ln T E E i t + ln φ i t α t 1 α i β t 1 β i φ i t 1 α t α i β t β i + α i Δ ln ( D H ) t + β i Δ ln ( D R ) t + α t Δ ln μ H i t + β t Δ ln μ R i t
Similarly, when there is no mismatch of innovation elements in t period, the growth rate of green innovation output can be expressed as:
Δ ln D Y i t * = ln D Y i t * D Y i t 1 = ln D Y i t * ln D Y i t 1 = Δ ln T E E i t + Δ ln φ i t α t 1 α i β t 1 β i φ i t 1 α t α i β t β i + α t Δ ln ( D H ) t + β t Δ ln ( D R ) t
Further, we can build the following model measuring the loss of green innovation output growth rate of region i in t period:
Δ ln D Y i t Δ ln D Y i t = α t Δ ln μ H i t β t Δ ln μ R i t
In (37), α t Δ ln μ H i t is the loss of innovation growth rate caused by green innovation talent mismatch. β t Δ ln μ R i t is the loss of green innovation growth rate caused by innovation capital mismatch.
Assuming that the whole economy will reach a competitive equilibrium in every period, we can obtain the following:
ln D Y t = i = 1 N φ i t ln D Y i t
Then, the growth rate of green innovation output of the whole economy is derived as:
Δ ln D Y t = i = 1 N φ i t ln D Y i t = i = 1 N φ i t Δ ln T E E i t + i = 1 N φ i t Δ ln φ i t α t 1 α i β t 1 β i φ i t 1 α t α i β t β i + i = 1 N φ i t α i Δ ln ( D H ) t + i = 1 N φ i t β t Δ ln ( D R ) t + i = 1 N φ i t α t Δ ln μ H i t t + i = 1 N φ i t β t Δ ln μ R i t
Similarly, when there is no element mismatch, the growth rate of green innovation output is:
Δ l n D Y t * = i = 1 N φ i t l n D Y i t = i = 1 N φ i t Δ l n T E E i t + i = 1 N φ i t Δ l n φ i t α t 1 α i β t 1 β i φ i t 1 α t α i β t β i + i = 1 N φ i t α t Δ ln ( D H ) t + i = 1 N φ i t β t Δ ln ( D R ) t
Then, the growth rate loss of the whole economy in t period is:
Y e = Δ ln D Y t * Δ ln D Y t = i = 1 N φ i t α t Δ ln μ H i t i = 1 N φ i t β t Δ ln μ R i t
In (41), Y ( μ H i t ) e = i = 1 N φ i t α t Δ ln μ H i t is the total green innovation output growth rate loss due to the innovation talent mismatch. Y ( μ R i t ) e = i = 1 N φ i t β t Δ ln μ R i t is the total green innovation output growth rate loss due to innovation capital mismatch. Further, the following relationships hold:
μ ψ i X i = Y ( μ ) e Y ( ψ i X i ) e
Y ( ψ i X i ) e = ψ i X i μ Y ( μ ) e
That is, the loss of the national average annual growth rate of green innovation output due to the local government competitive factor X i and the loss of the annual growth rate of green innovation output in each province during the inspection period can be calculated based on (43).
In the following empirical analysis, the flow chart of specific measurements is shown in Figure 2:

5. Analysis of the Mismatch of Innovation Factors Due to Local Government Competition

Before estimating the effect of local government competition on the mismatch of innovation elements, we test the spatial correlation between innovation talents and capital mismatch. The results are shown in Table 1. Table 1 shows a significant spatial correlation between the allocation of innovative elements in most years. Therefore, it is more robust to employ the spatial panel model for analysis.
In the process of estimating the spatial mismatch of innovative elements affected by local government competition, LM, Wald, and LR tests were conducted on the sample data of each model to select the most robust one [47]. We find that the SAR model with the time fixed effect is more appropriate for estimating the joint effect of local government competition on innovative talents and capital mismatch. The estimated results are shown in Table 2.
The results in Table 2 show that the local government’s expenditure, tax, and institutional competition will lead to the mismatch between innovative talents and capital. Furthermore, the mismatch between innovative talents and capital due to expenditure and institutional competition is greater than tax competition. Moreover, the local government’s means of tax competition, which aims to compete for elements, plays a less significant role in competing for innovative elements than expenditure and system competition. In order to make the estimation results more accurate and objective, the above estimation results are decomposed again. The decomposition results of the three competitive behaviors are shown in Table 3.
From Table 3, we can see that the direct, indirect, and total effects of marginal effects of the three competitive means on the allocation of innovative talents are ranked as expenditure competition effect > institutional competition effect > tax competition effect. The direct, indirect, and total effects of marginal effects on the allocation of innovative capital are ranked as: institutional competition effect > expenditure competition effect > tax competition effect.
Therefore, tax competition contributes the least to the mismatch of innovation elements, while the change of innovation capital allocation is more sensitive to institutional competition, and the change of innovation talent allocation is more susceptible to expenditure competition. When the intensity of institutional competition increases by one standard deviation, the total mismatch of innovation capital will increase by 1.464 standard deviations. This results in 65.44% of innovation capital in the local area and 34.56% of innovation capital in neighboring regions. When the intensity of expenditure competition is increased by one standard deviation, the overall mismatch degree of innovative talents will be increased by 2.421 units, and the mismatch contribution of innovative talents in local regions is greater than that of neighboring regions, which are 63.98% and 36.02%, respectively. Hence, the means of expenditure competition will not only cause the mismatch of innovative talents in the local region but also distort the allocation of innovative talents in neighboring regions. Tang et al. [12] also proved that local government competition causes factor market distortion. However, their market distortion focuses on overall factors but not innovation factors. In contrast, this paper focuses on the analysis of the interregional allocation of innovation factors, and the analysis results can better explain how to stimulate the vitality of innovation factors and promote sustainable development.

6. Analysis of the Measurement Results of Green Innovation Efficiency Loss Due to Local Government Competition

6.1. Measurement Results and Difference Analysis of Provincial Green Innovation Efficiency Loss

6.1.1. Calculation Result of Regional Green Innovation Efficiency Loss Caused

The green innovation efficiency loss caused by the mismatch of innovative talents and capital caused by local government competition is measured separately. The average results of each province in the sample period are shown in Table 4.
Table 4 shows that the efficiency loss of green innovation caused by innovation factor mismatch due to tax competition is greater than that due to institutional and expenditure competition. That is, tax competition has the strongest impact on green innovation efficiency. Deng et al. [48] also proved that tax competition has a significant effect on the efficiency of green technology innovation. However, because they estimated the effect of tax competition on green technology innovation efficiency using a “black box”, the mismatch due to tax competition cannot be identified [49]. Compared with previous studies, this paper reveals the “black box” that tax competition reduces green innovation efficiency and better explains why different kinds of tax reduction will produce differentiated effects on technological change. In addition, local government competition not only caused the loss of green innovation efficiency in Beijing, Tianjin, Hebei, Hebei, Shanxi, Inner Mongolia, Liaoning, Heilongjiang, Shanghai, Jiangsu, Zhejiang, Anhui, Fujian, Shandong, Henan, Hunan, Guangdong, Guangxi, Hainan, Chongqing, Guizhou, Yunnan, Ningxia, and Xinjiang but also helped enhance regional green innovation efficiency in Jilin, Jiangxi, Hubei, Sichuan, Shaanxi, Gansu, and Qinghai. However, there are differences in the loss of innovation efficiency due to the mismatch between innovative talents and capital. The competition among local governments in Hebei, Shanxi, Inner Mongolia, Jilin, Anhui, Fujian, Jiangxi, Henan, Qinghai, and Ningxia resulted in the over-allocation of innovative talents. Furthermore, the regional innovation efficiency has improved due to the agglomeration of innovative talents. However, the over-allocation of innovative capital causes the loss of innovation efficiency, which may be due to the knowledge and technology spillover effect of over-agglomeration of innovative talents. However, over-agglomeration of capital will produce a space crowding-out effect, resulting in the loss of overall green innovation efficiency. Different from the provinces and regions, the competition among local governments leads to a shortage of innovative talents in Beijing, Tianjin, and Shanghai, which leads to an efficiency loss. However, the over-allocation of innovative capital improves the green innovation efficiency, which may be due to the fact that these three regions hold priority for development, and the scale effect of green innovation brought by capital agglomeration is stronger.

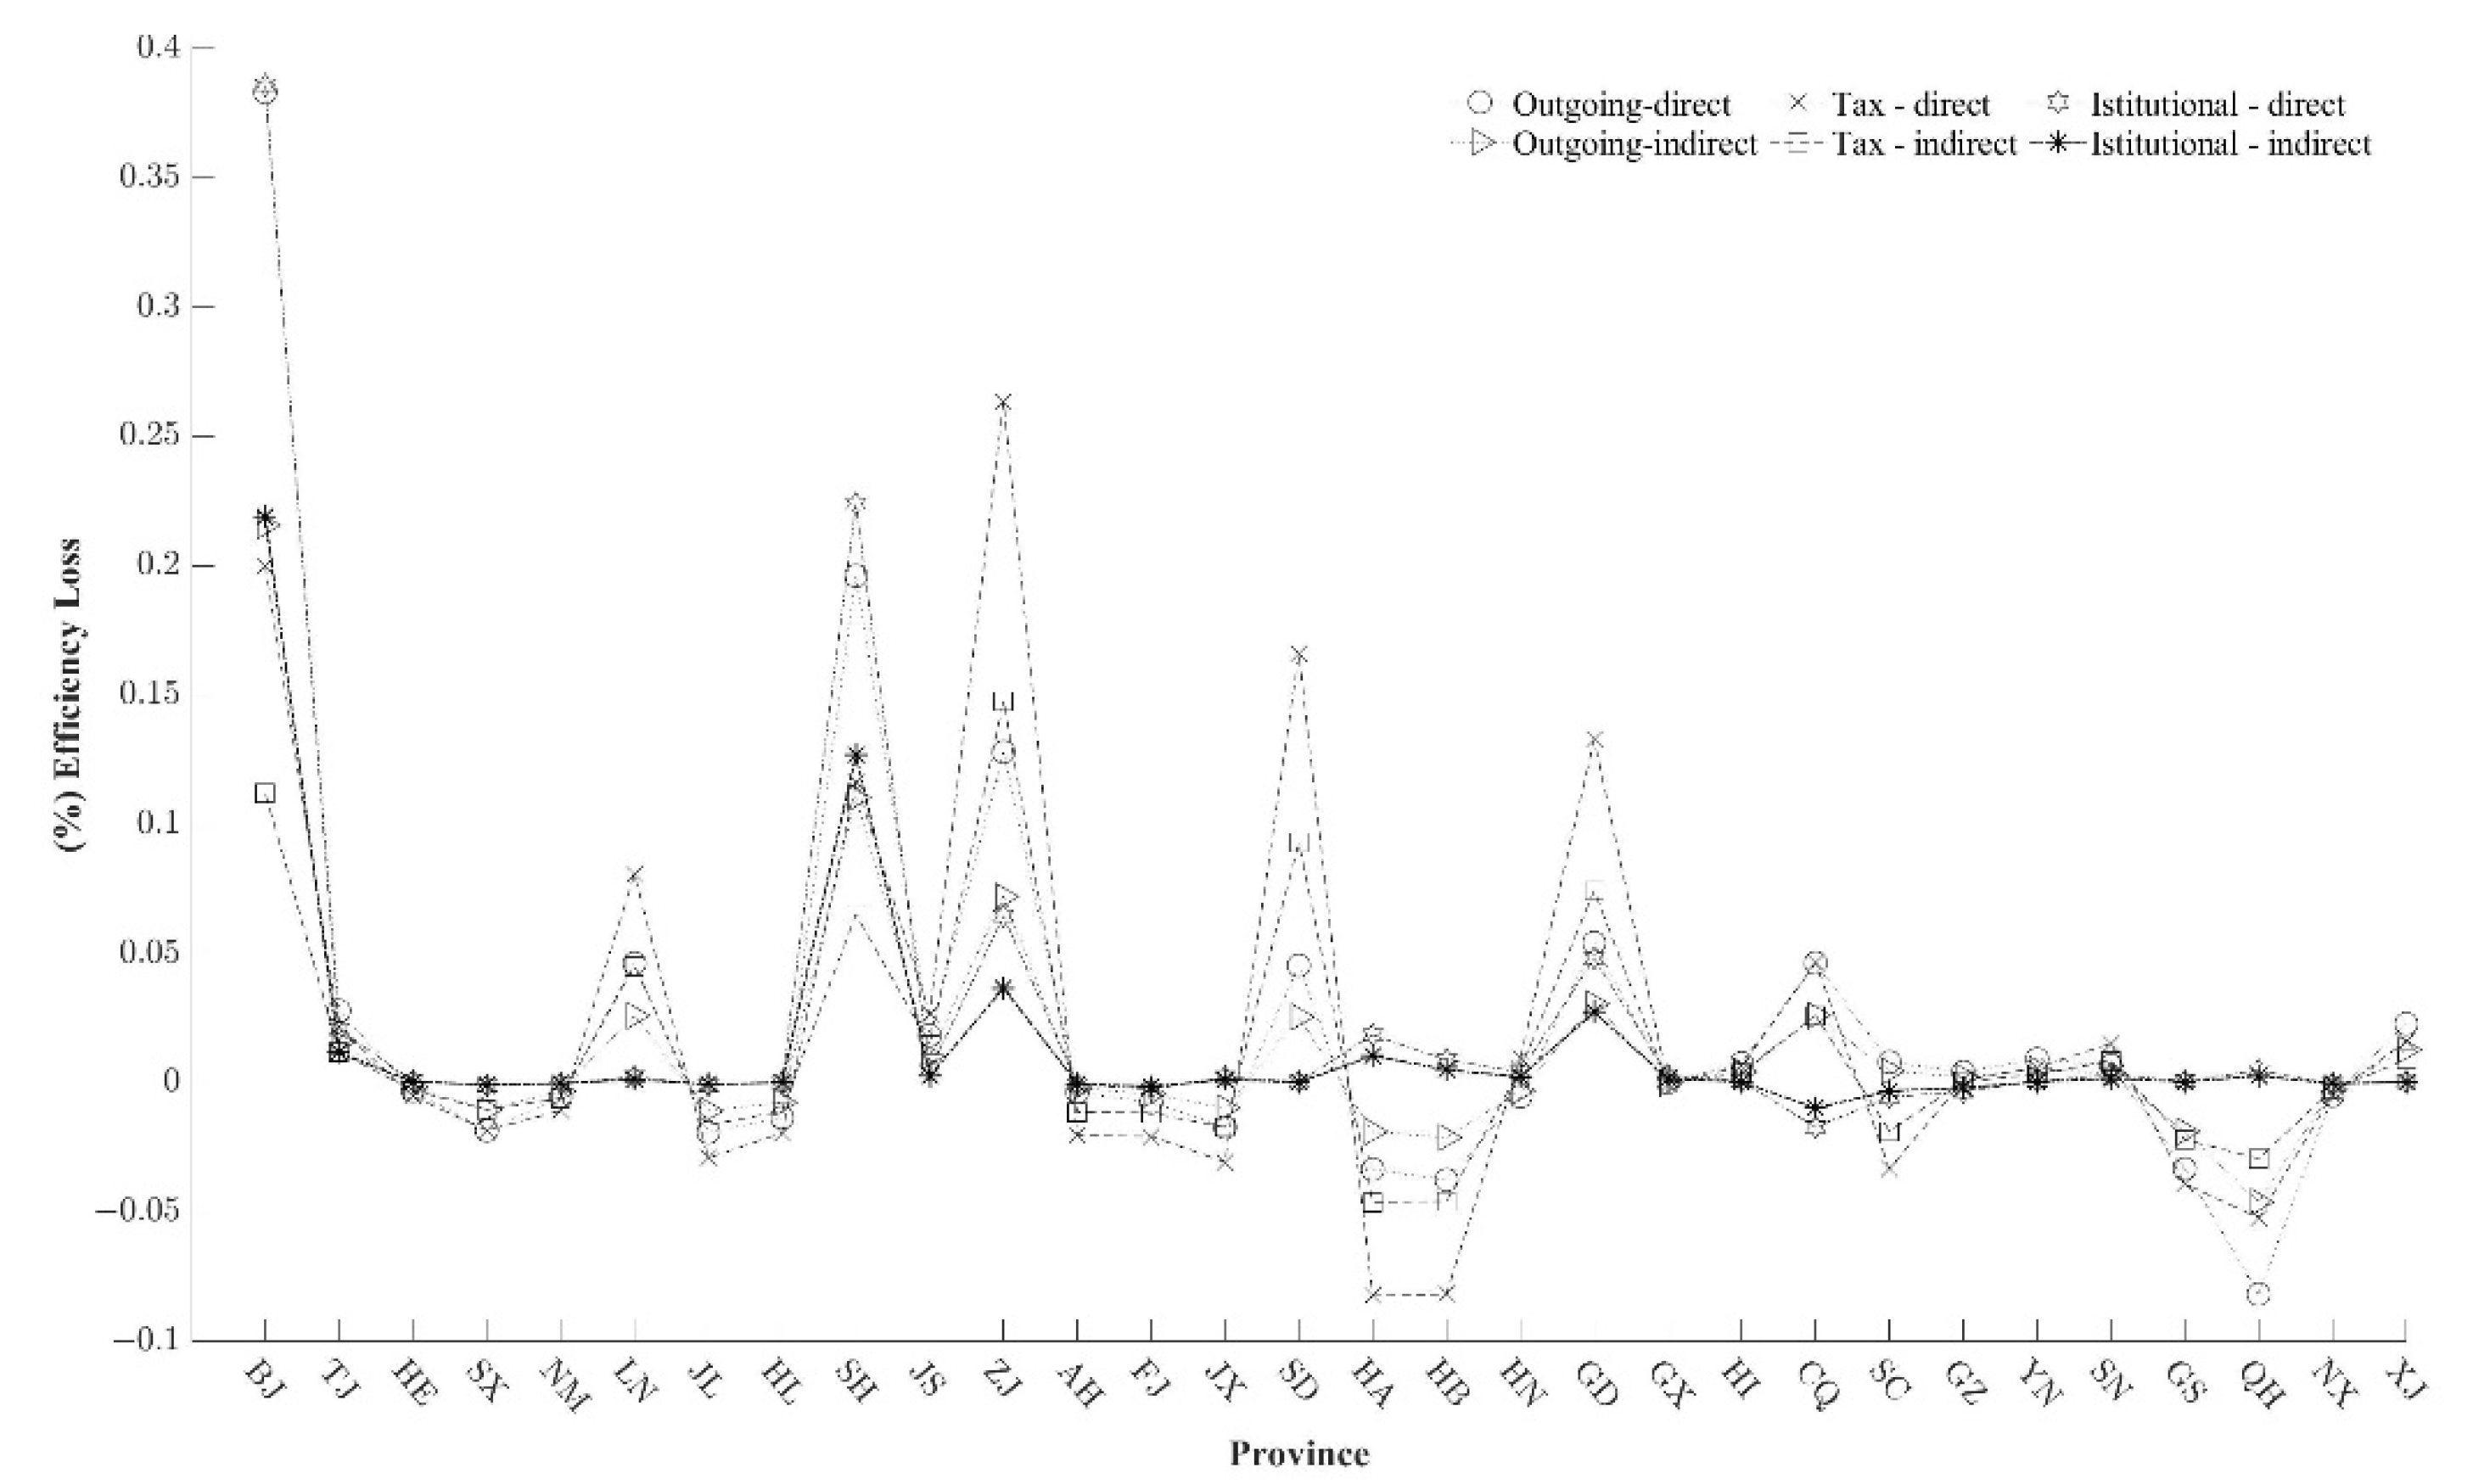
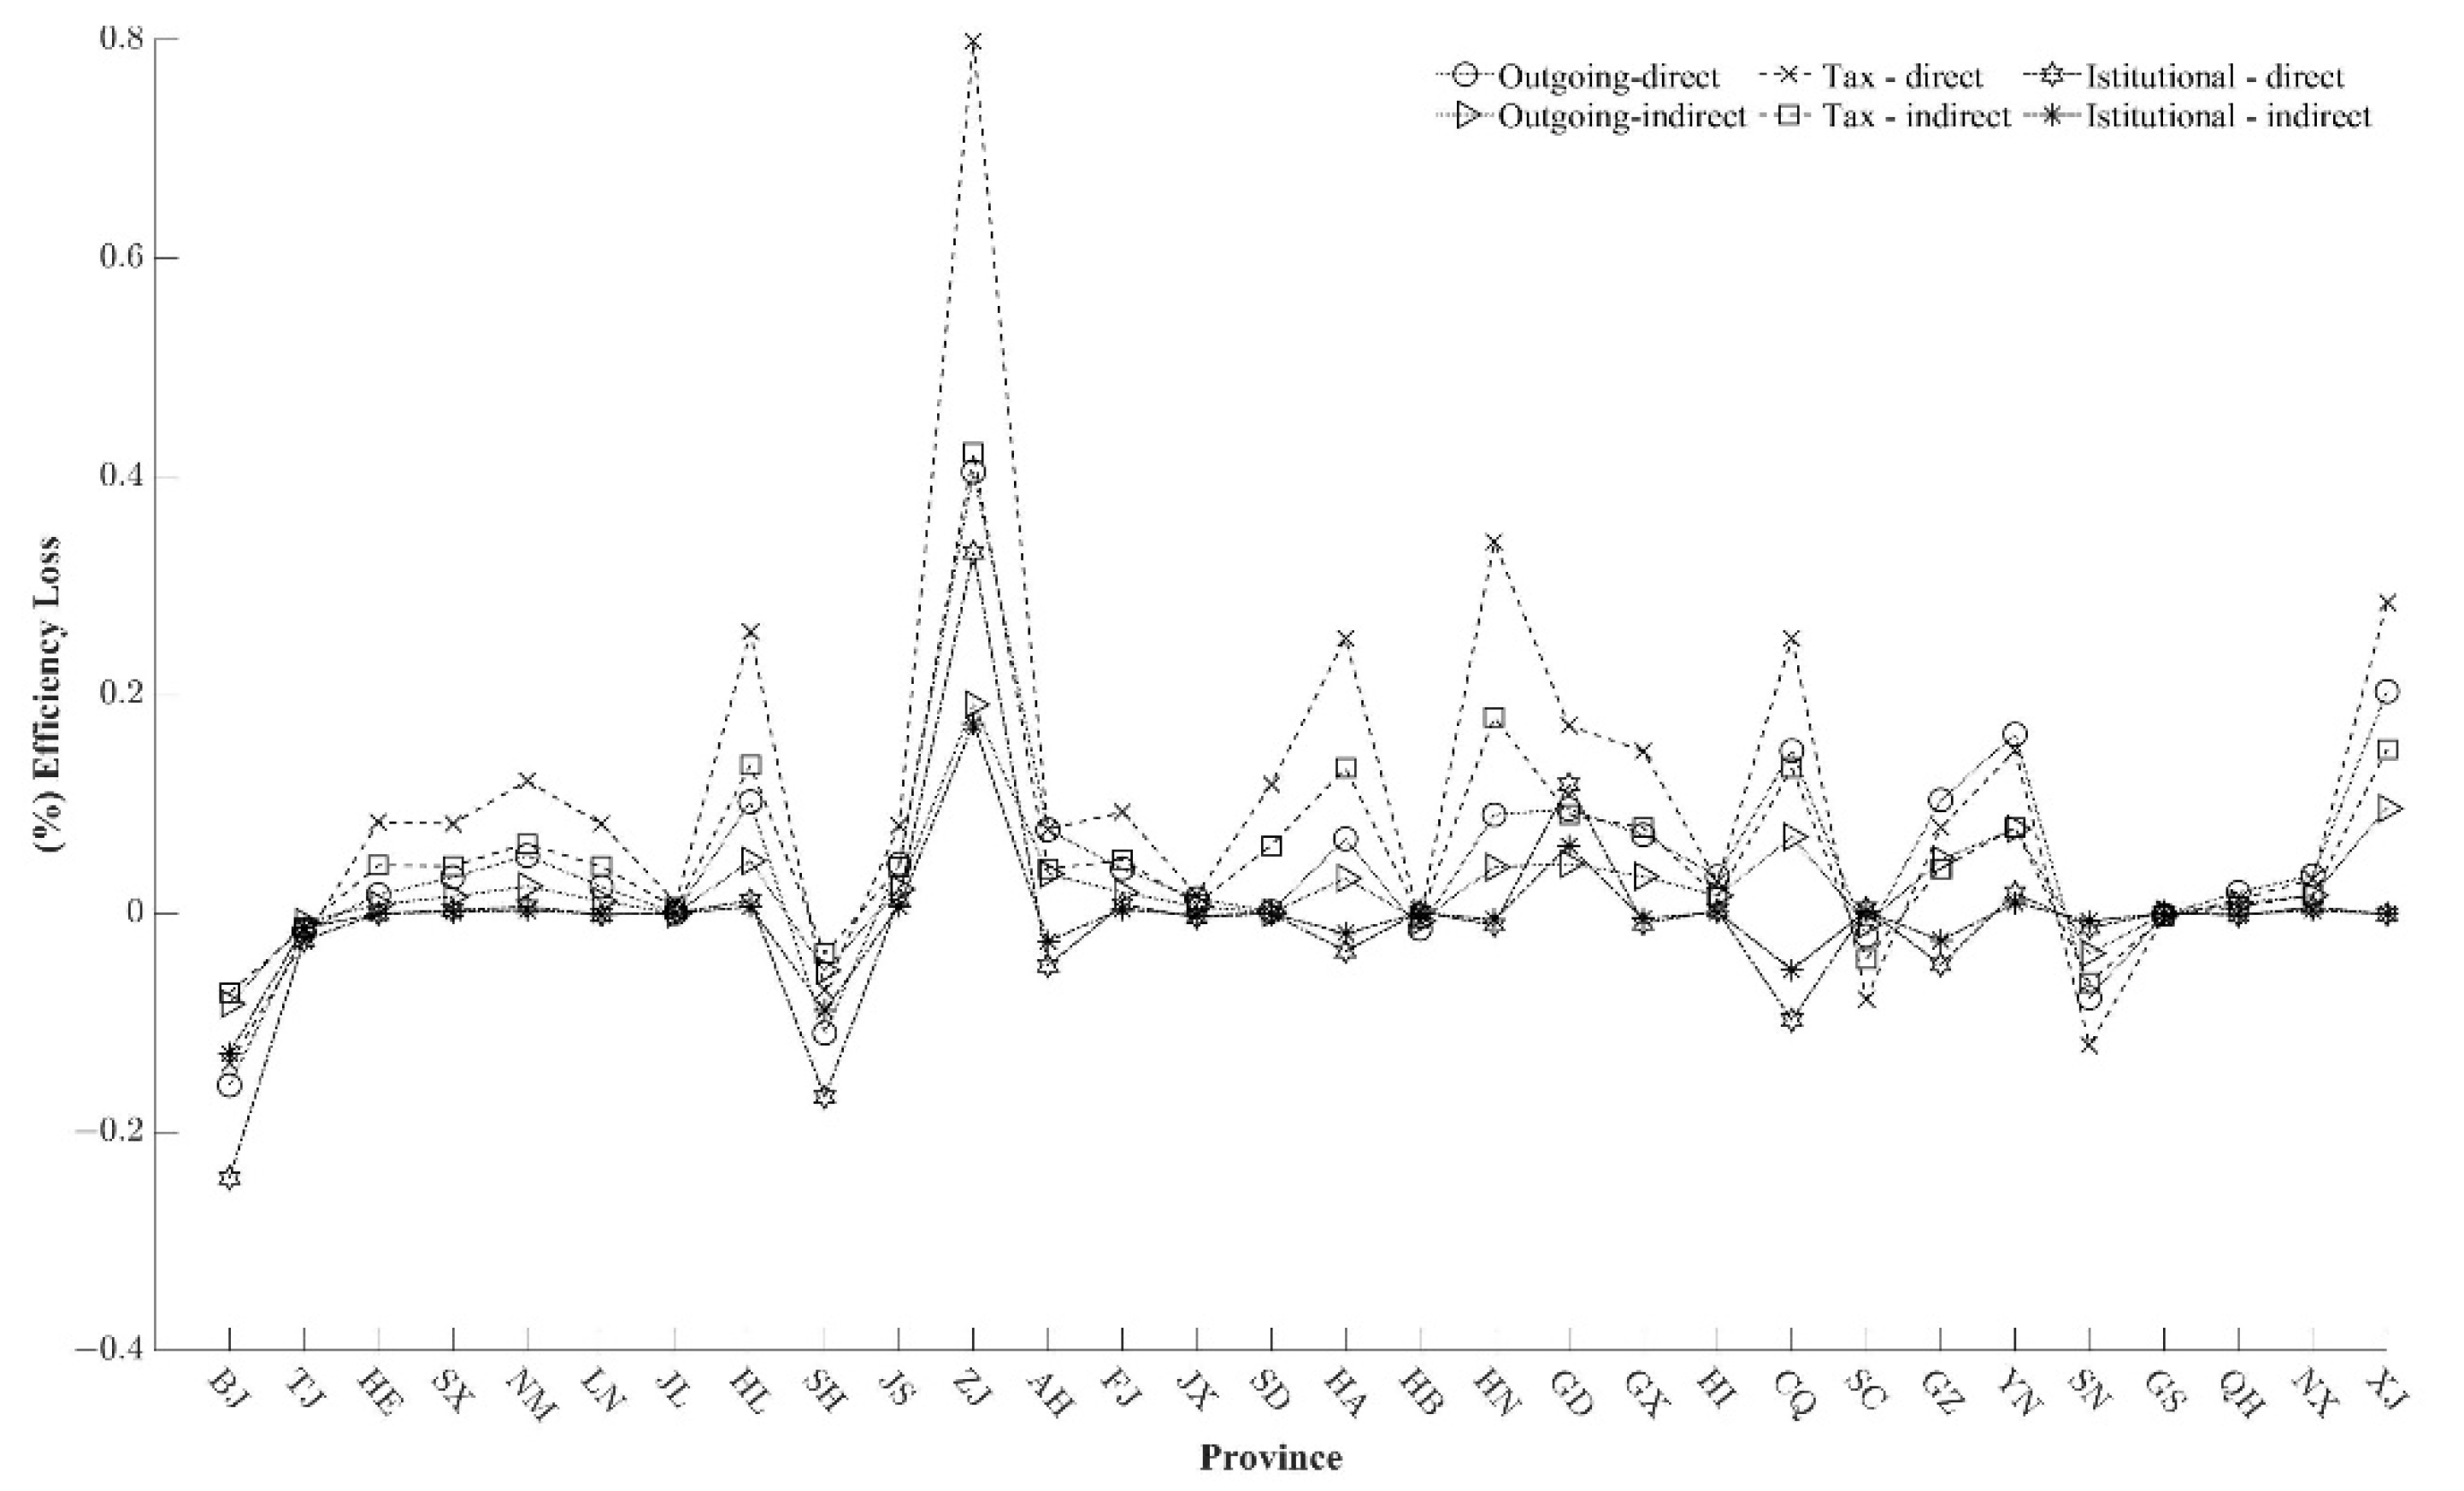
6.1.2. Analysis of Loss Difference Caused by Three Means of Competition among Provinces

In order to analyze the difference in green innovation efficiency loss caused by innovation element mismatch caused by local government competition, the scatter plot of the innovation element mismatch and efficiency loss is displayed. The vertical solid line in Figure 3 and Figure 4 indicates that the average degree of innovation element mismatch caused by local government competition is 1. The left side of the vertical line is the region where the innovation element is under-allocated. The right side is the region where the innovation element is over-allocated. The baseline is the zero-value line of green innovation efficiency loss. The upper part indicates green innovation efficiency decrease, and the lower part indicates the opposite. Among them, Figure 3 shows the difference in green innovation efficiency loss caused by the mismatch of innovative talents due to local government competition. Figure 4 shows the difference in green innovation efficiency loss caused by innovation capital mismatch caused by local government competition.
Figure 3 shows that due to local government competition, Beijing, Zhejiang, Guangdong, Jiangsu, Shanghai, Chongqing, Liaoning, Shandong, and Tianjin have an insufficient allocation of innovative talents, hurting innovation and green efficiency. Beijing, Zhejiang, and Shanghai have the most severe loss, followed by Shandong. The reason may be that Beijing, Zhejiang, and Shanghai have a higher degree of openness, a stronger external competition, and a stronger willingness to innovate. As a result, their long-term and rapid development have enabled them to establish an environment for innovation and development. And the demand for innovative talents is greater. Qinghai, Shaanxi, Gansu, Hebei, Henan, Inner Mongolia, Jiangxi, Shanxi, Jilin, Anhui, Ningxia, Sichuan, Heilongjiang, Guangxi, Hunan, and Hubei and other provinces (regions) have over-allocated innovative talents. Under the combined effect of knowledge and technology spillovers from talent aggregating, innovation efficiency has improved. Competition among local governments in Guangxi and Hainan has led to a high degree of mismatch of innovative talents. However, its small share of green innovation output has less impact on the overall efficiency.
Figure 4 shows that due to local government competition, innovation capital shortage has occurred in Zhejiang, Guangdong, Heilongjiang Chongqing, Fujian, Xinjiang, Guangxi, Hunan, Henan, Yunnan, and other regions, hurting green innovation efficiency. Among them, the efficiency loss caused by the lack of innovation capital in Guangdong is the largest, followed by Guangdong, Chongqing, and Heilongjiang. Thus, although Zhejiang is more developed economically and has accumulated a large amount of innovation capital, local government competition resulted in a loss of innovation capital. Consequently, innovation capital is insufficient to support Zhejiang’s future development of green innovation. On the contrary, under the competition of local governments, over-allocation of innovation capital has occurred in Beijing, Shanghai, Sichuan, Shaanxi, Hubei, Tianjin, and other regions. However, under the scale effect of capital agglomeration, green innovation efficiency has been improved. In addition, the intergovernmental competition between Liaoning and Anhui also leads to the over-allocation of innovation capital. However, the over-allocation does not show the scale effect, only the crowding-out effect, hurting the overall green innovation efficiency. In Qinghai, Inner Mongolia, Jiangxi, Shanxi, and other regions, local government competition has caused the over-allocation of innovative capital, but the green innovation efficiency loss is slight.
Figure 5 and Figure 6 show that the loss of green innovation efficiency caused by different competitive strategies is different. In the green innovation efficiency loss caused by the mismatch of innovative talents, tax competition has the most significant impact. This causes severe efficiency losses in Beijing, Shanghai, Zhejiang, Shandong, and Guangdong, and small losses in Henan, Chongqing and other places, while improving the innovation efficiency in Beijing, Hubei, Sichuan, Gansu, and Qinghai. Institutional competition has the same effect as expenditure competition, but it also causes the loss of innovation efficiency in Beijing, Shanghai, Zhejiang and Guangdong. In the process of innovation capital mismatch, tax competition still has the strongest impact, resulting in severe innovation capital shortage and green innovation efficiency loss in Heilongjiang, Zhejiang, Guangdong, Yunnan, and Chongqing. At the same time, however, tax competition also makes the innovation capital in Beijing, Tianjin, Shanghai, Shaanxi and other provinces aggregate, or even over-allocate. This enhances the overall green innovation efficiency because of the agglomeration effect. Institutional competition and expenditure competition still play the same role, which further aggravates the shortage of innovation capital in Zhejiang, Guangdong and other provinces, reducing green innovation efficiency. Therefore, the Eastern coastal provinces should form a “strong alliance”, reduce the competition among them, overcome the shortage of innovation elements, and improve green innovation efficiency.

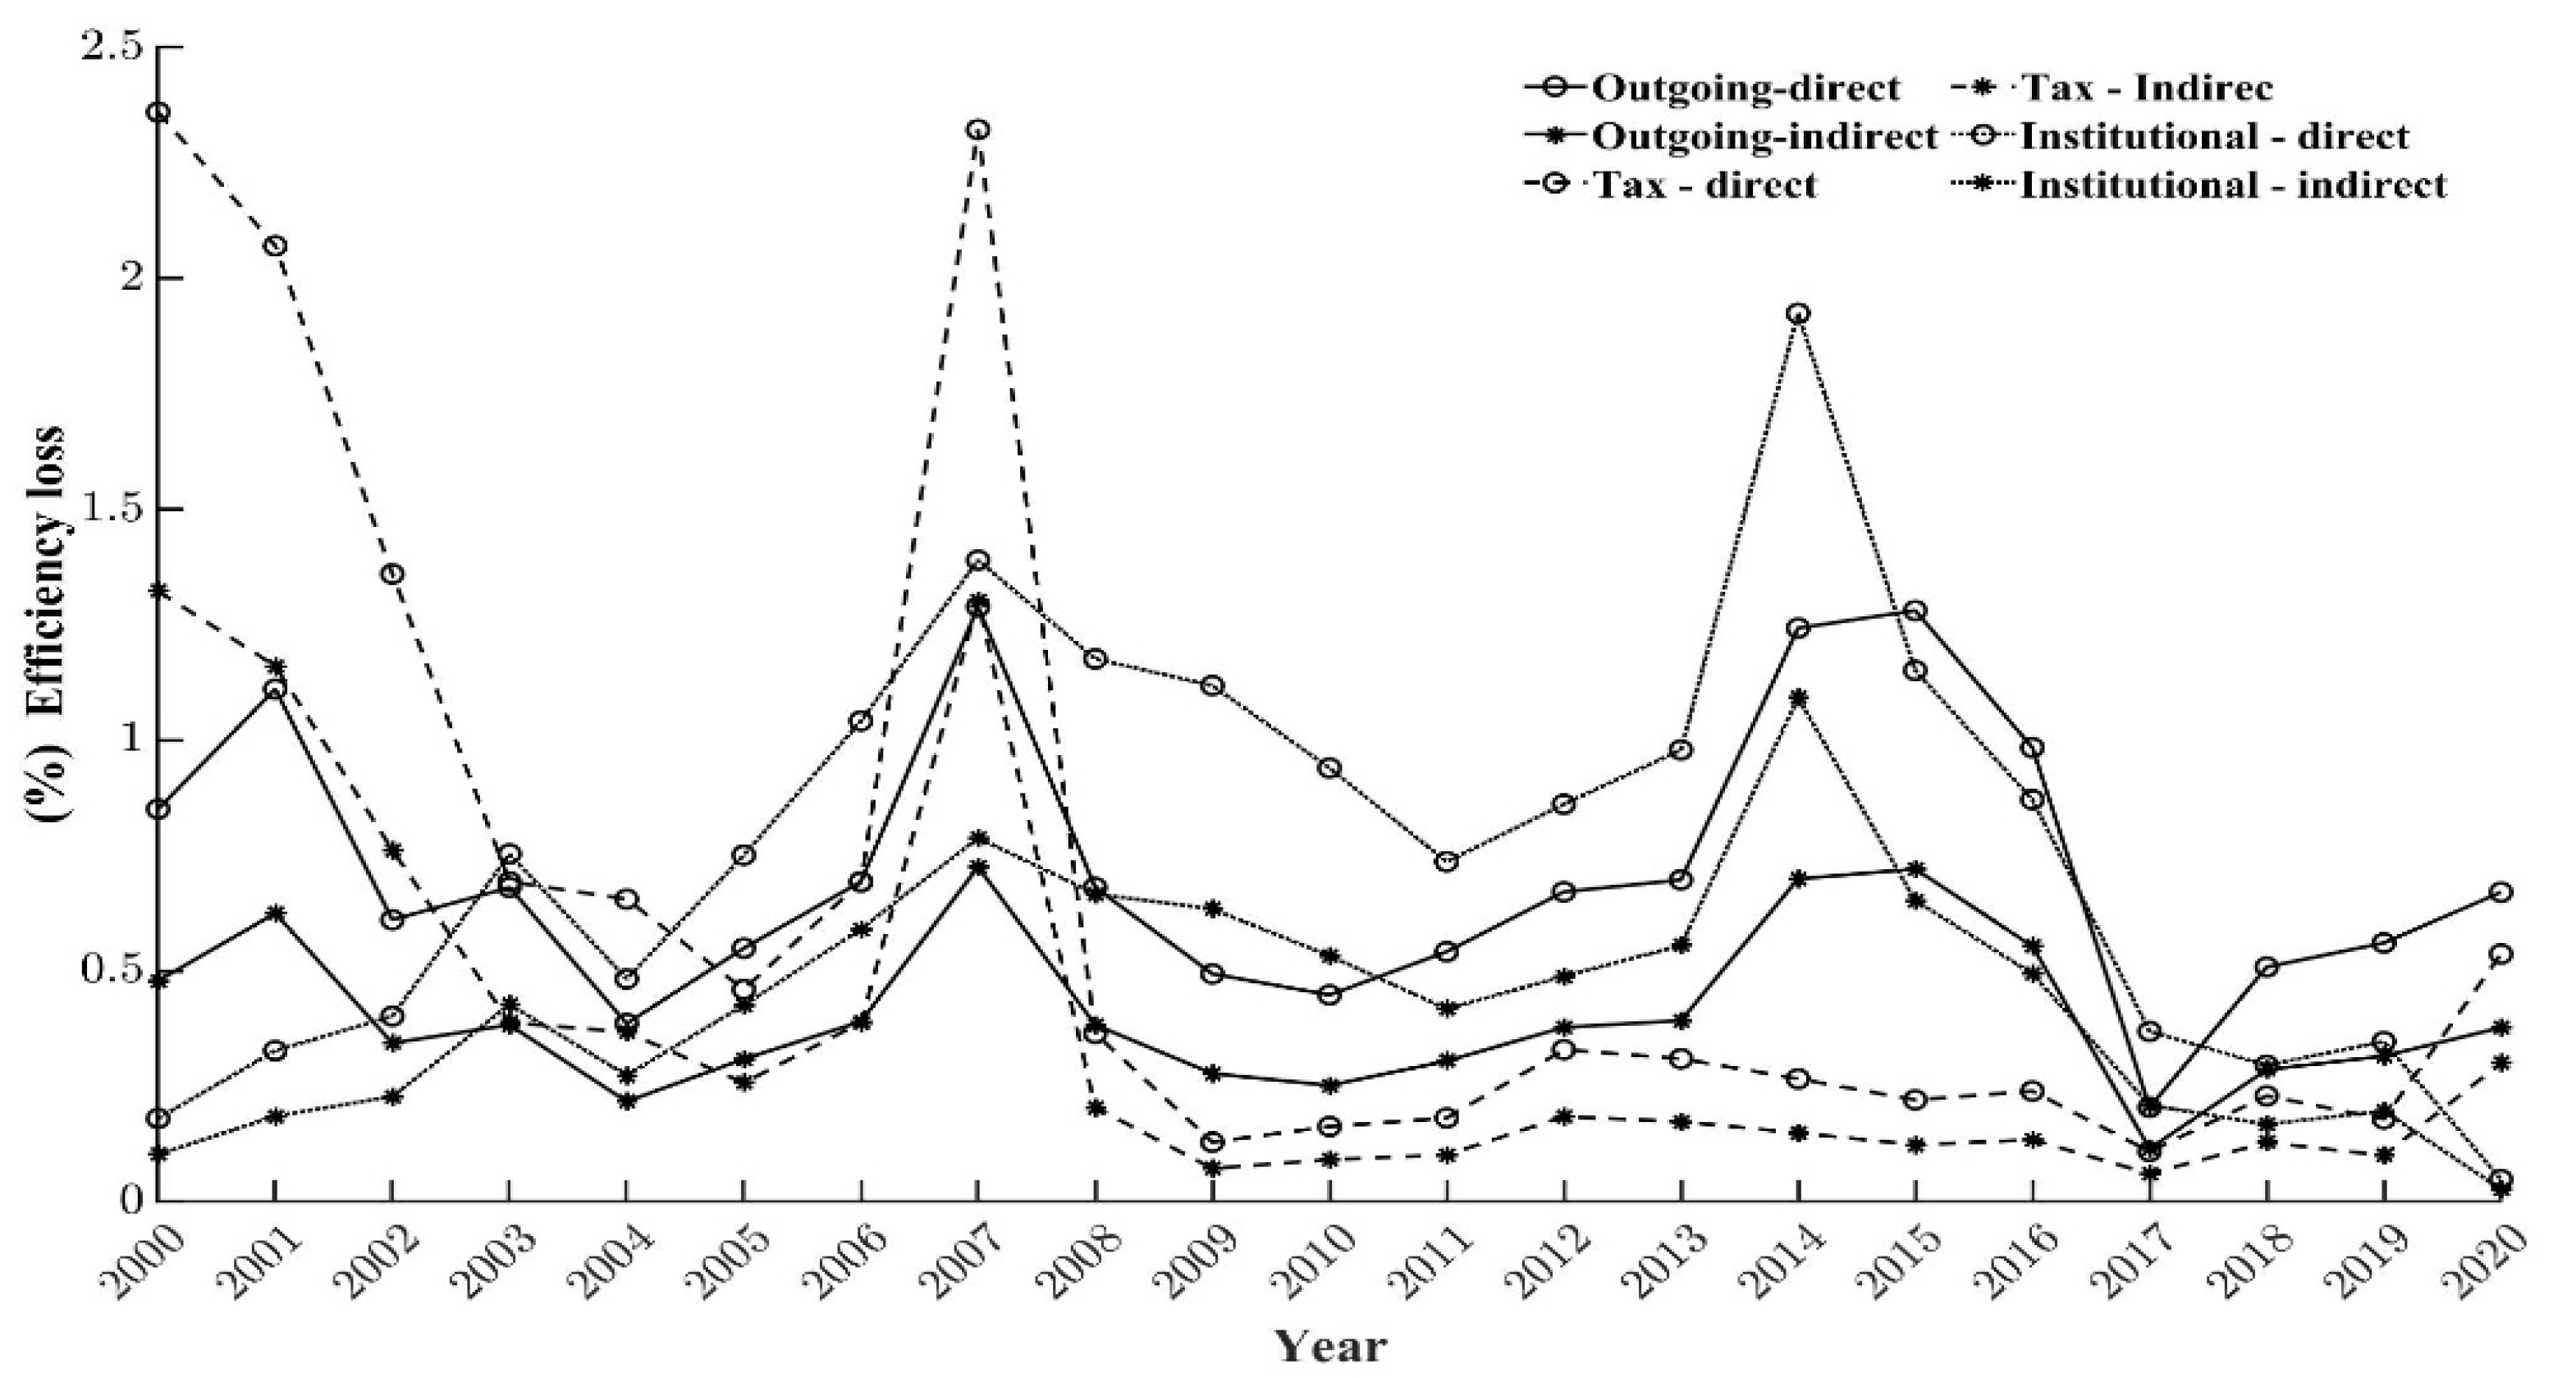
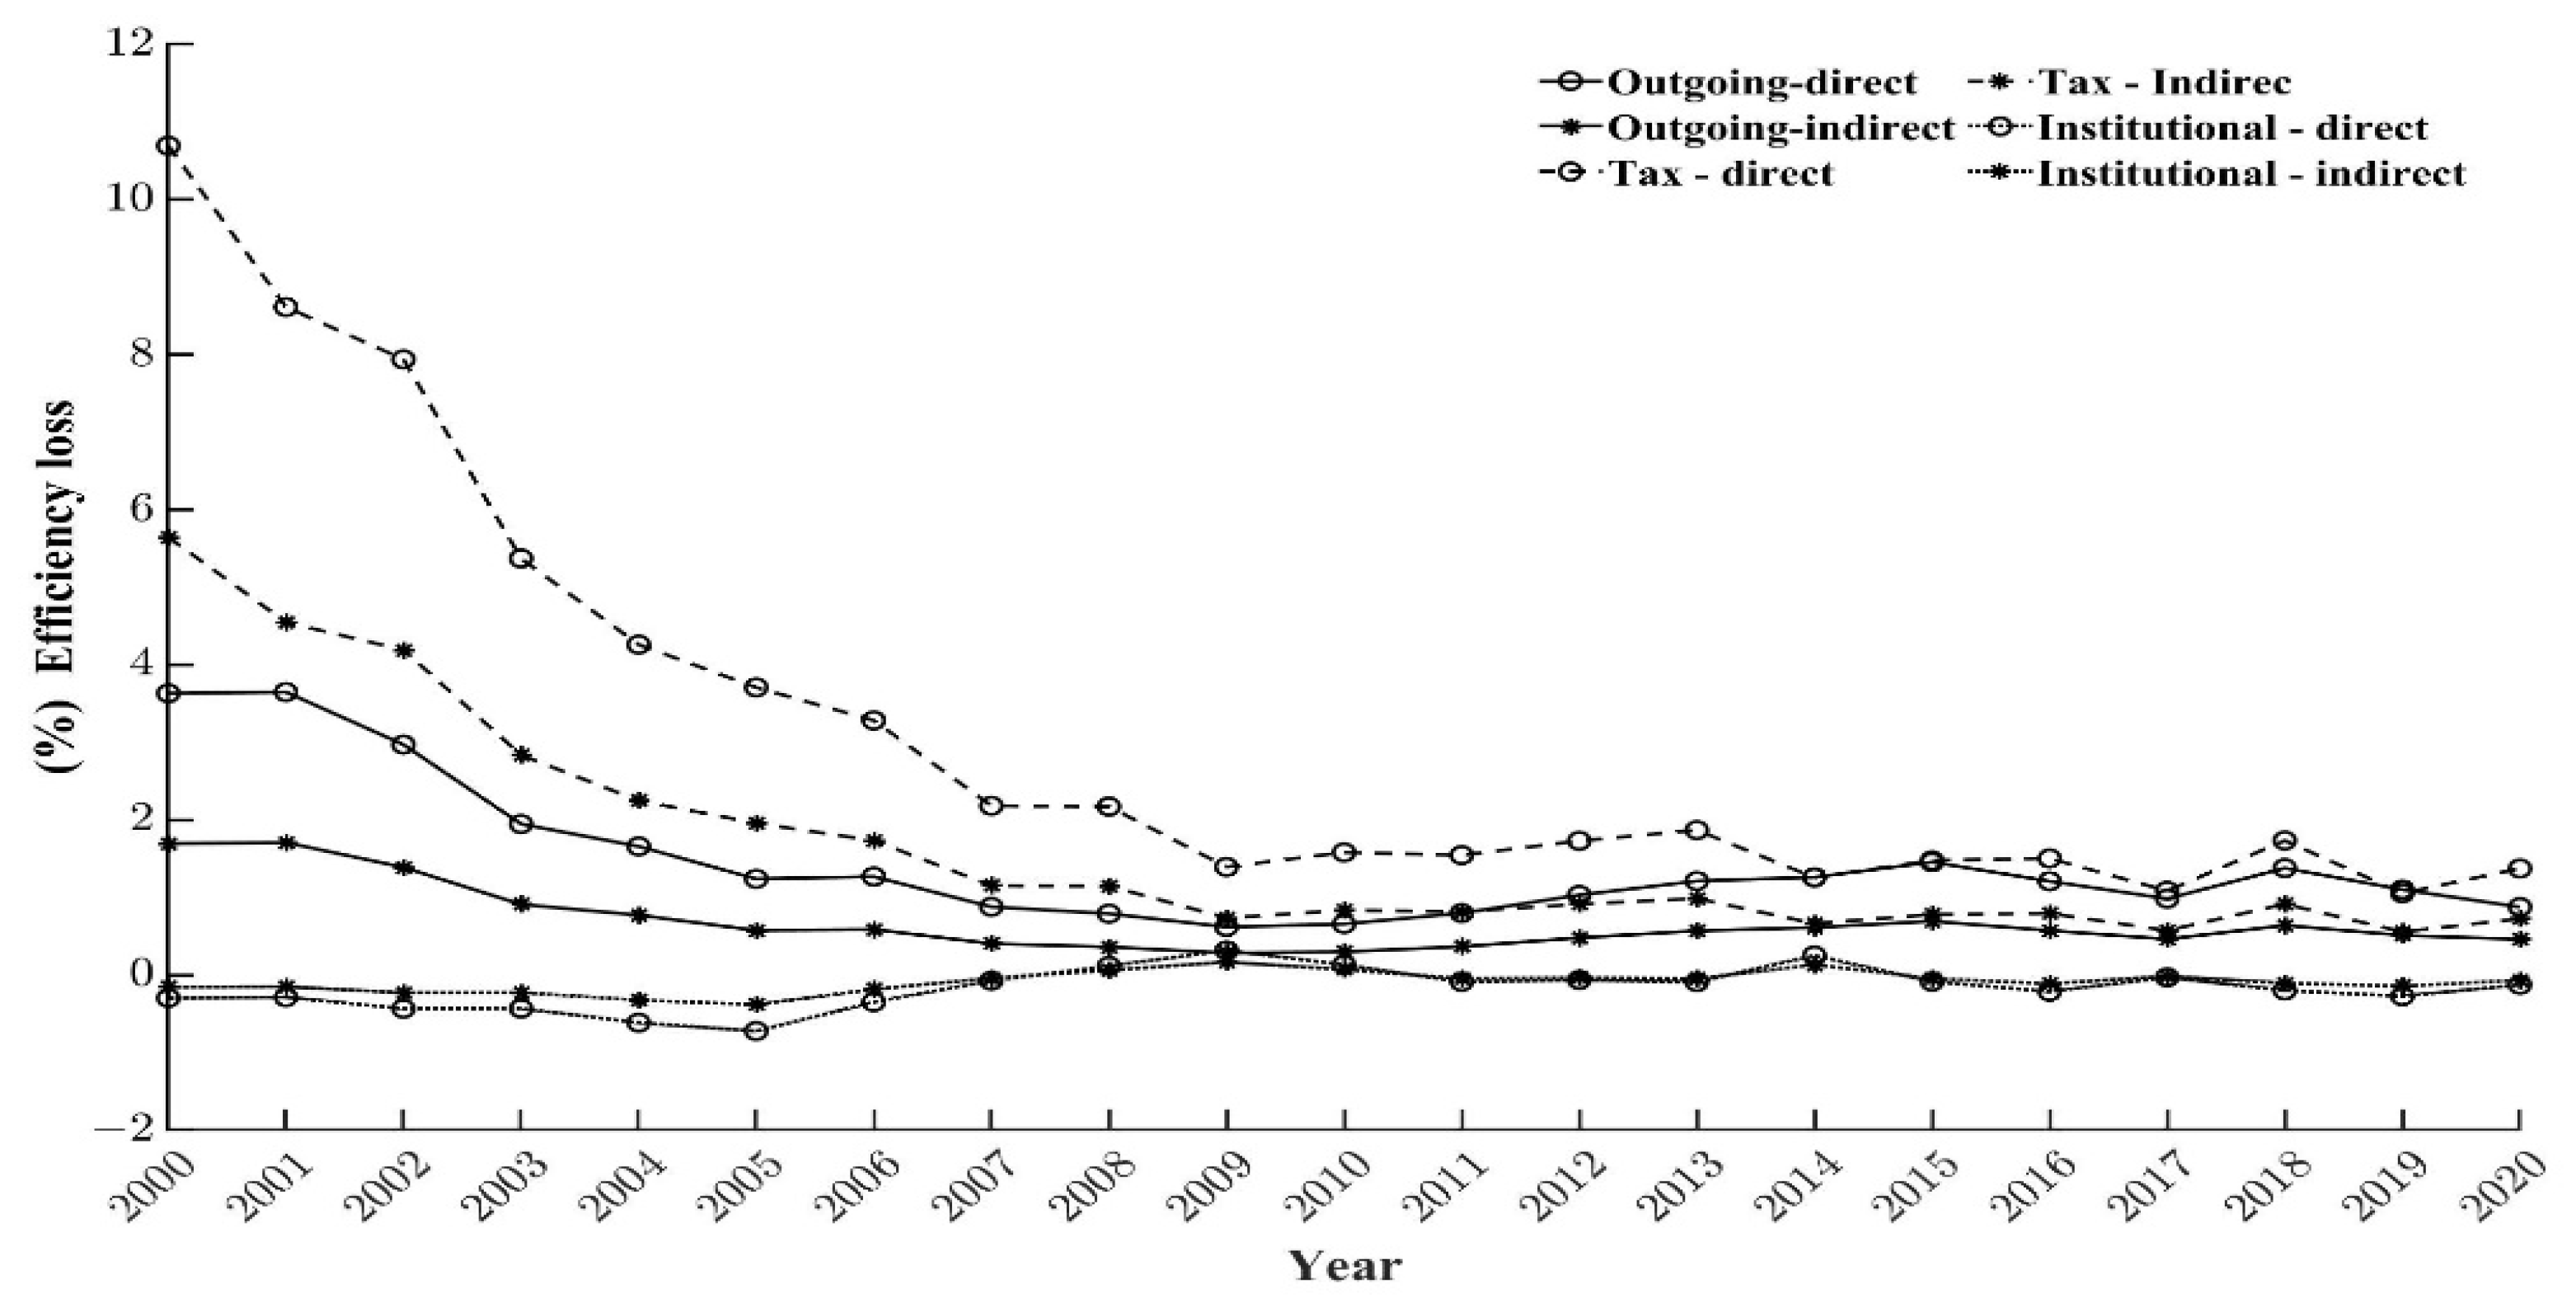
6.1.3. Analysis of the Difference in Losses Caused by the Three Competitive Means over Time

Figure 7 shows the following three points. First, from the overall trend analysis, the local government competition leads to the mismatch of innovative talents, and the loss of regional green innovation efficiency decreases yearly. In 2000, the total efficiency loss caused by the three competitive strategies was 5.30%, dropping to 1.96% in 2020. The reason for the decrease in efficiency loss may be that policies such as college enrollment expansion accelerated the accumulation of innovative talents and partially alleviated the shortage of innovative talents. Second, through the analysis of competitive means, the degree of green innovation efficiency loss caused by tax competition changes significantly with time, with the direct efficiency loss decreasing from 2.36% in 2000 to 0.53% in 2020. And the indirect efficiency loss decreased from 1.32% in 2000 to 0.30% in 2020. The trend of green innovation efficiency loss caused by institutional is more stable than that caused by tax competition, but the overall trend is still declining with time. The efficiency loss caused, directly and indirectly, decreased from 0.18% and 0.10% in 2000 to 0.05% and 0.03% in 2020, respectively. The loss of green innovation efficiency caused by competition has a smaller variation, but the overall trend is still a fluctuation-type decline. Thirdly, it is analyzed by time periods. The changing trend of green innovation efficiency loss caused by tax competition and expenditure competition is basically the same, showing an approximate “W” shape. The loss of green innovation efficiency decreased from 2000 to 2004 and increased from 2004 to 2007. However, it showed a downward trend from 2007 to 2009 and a slow upward trend from 2009 to 2015. After 2015, the overall trend is downward. Among them, the reduction ratio of green innovation efficiency caused by expenditure competition is 0.07 annually, and the value of green innovation efficiency loss caused by tax competition decreased by 0.2 in 2017 compared with 2015. The loss of green innovation efficiency caused by institution competition changes steadily with time, showing a slight downward trend overall, with an average annual reduction rate of 3.66%.
Figure 8 shows that, overall, the local government competition leads to the mismatch of innovation capital, and then the efficiency loss decreases year by year. This indicates that the green innovation efficiency loss caused by tax competition reduced from 16.34% in 2000 to 2.10% in 2020, with an average annual reduction rate of 4.36%. The loss of green innovation efficiency caused by expenditure decreased from 5.33% in 2000 to 1.36% in 2020, with an average annual reduction rate of 3.75%. However, the green innovation efficiency moved upward from −0.45% in 2000 to −0.19% in 2020. Moreover, expenditure competition is unstable, showing an approximate “W”-shape over time. Although the overall trend is downward, there is a slight upward trend in 2006, 2015, and 2018 compared with the previous year. Although the tax competition is relatively stable, its direct efficiency loss also increased significantly in 2013 and 2018. The trend of green innovation efficiency loss caused by institutional competition is similar to that of expenditure competition, and it also improved insignificantly between 2013 and 2018. This may be related to the overall overheating of the real estate market after 2013.

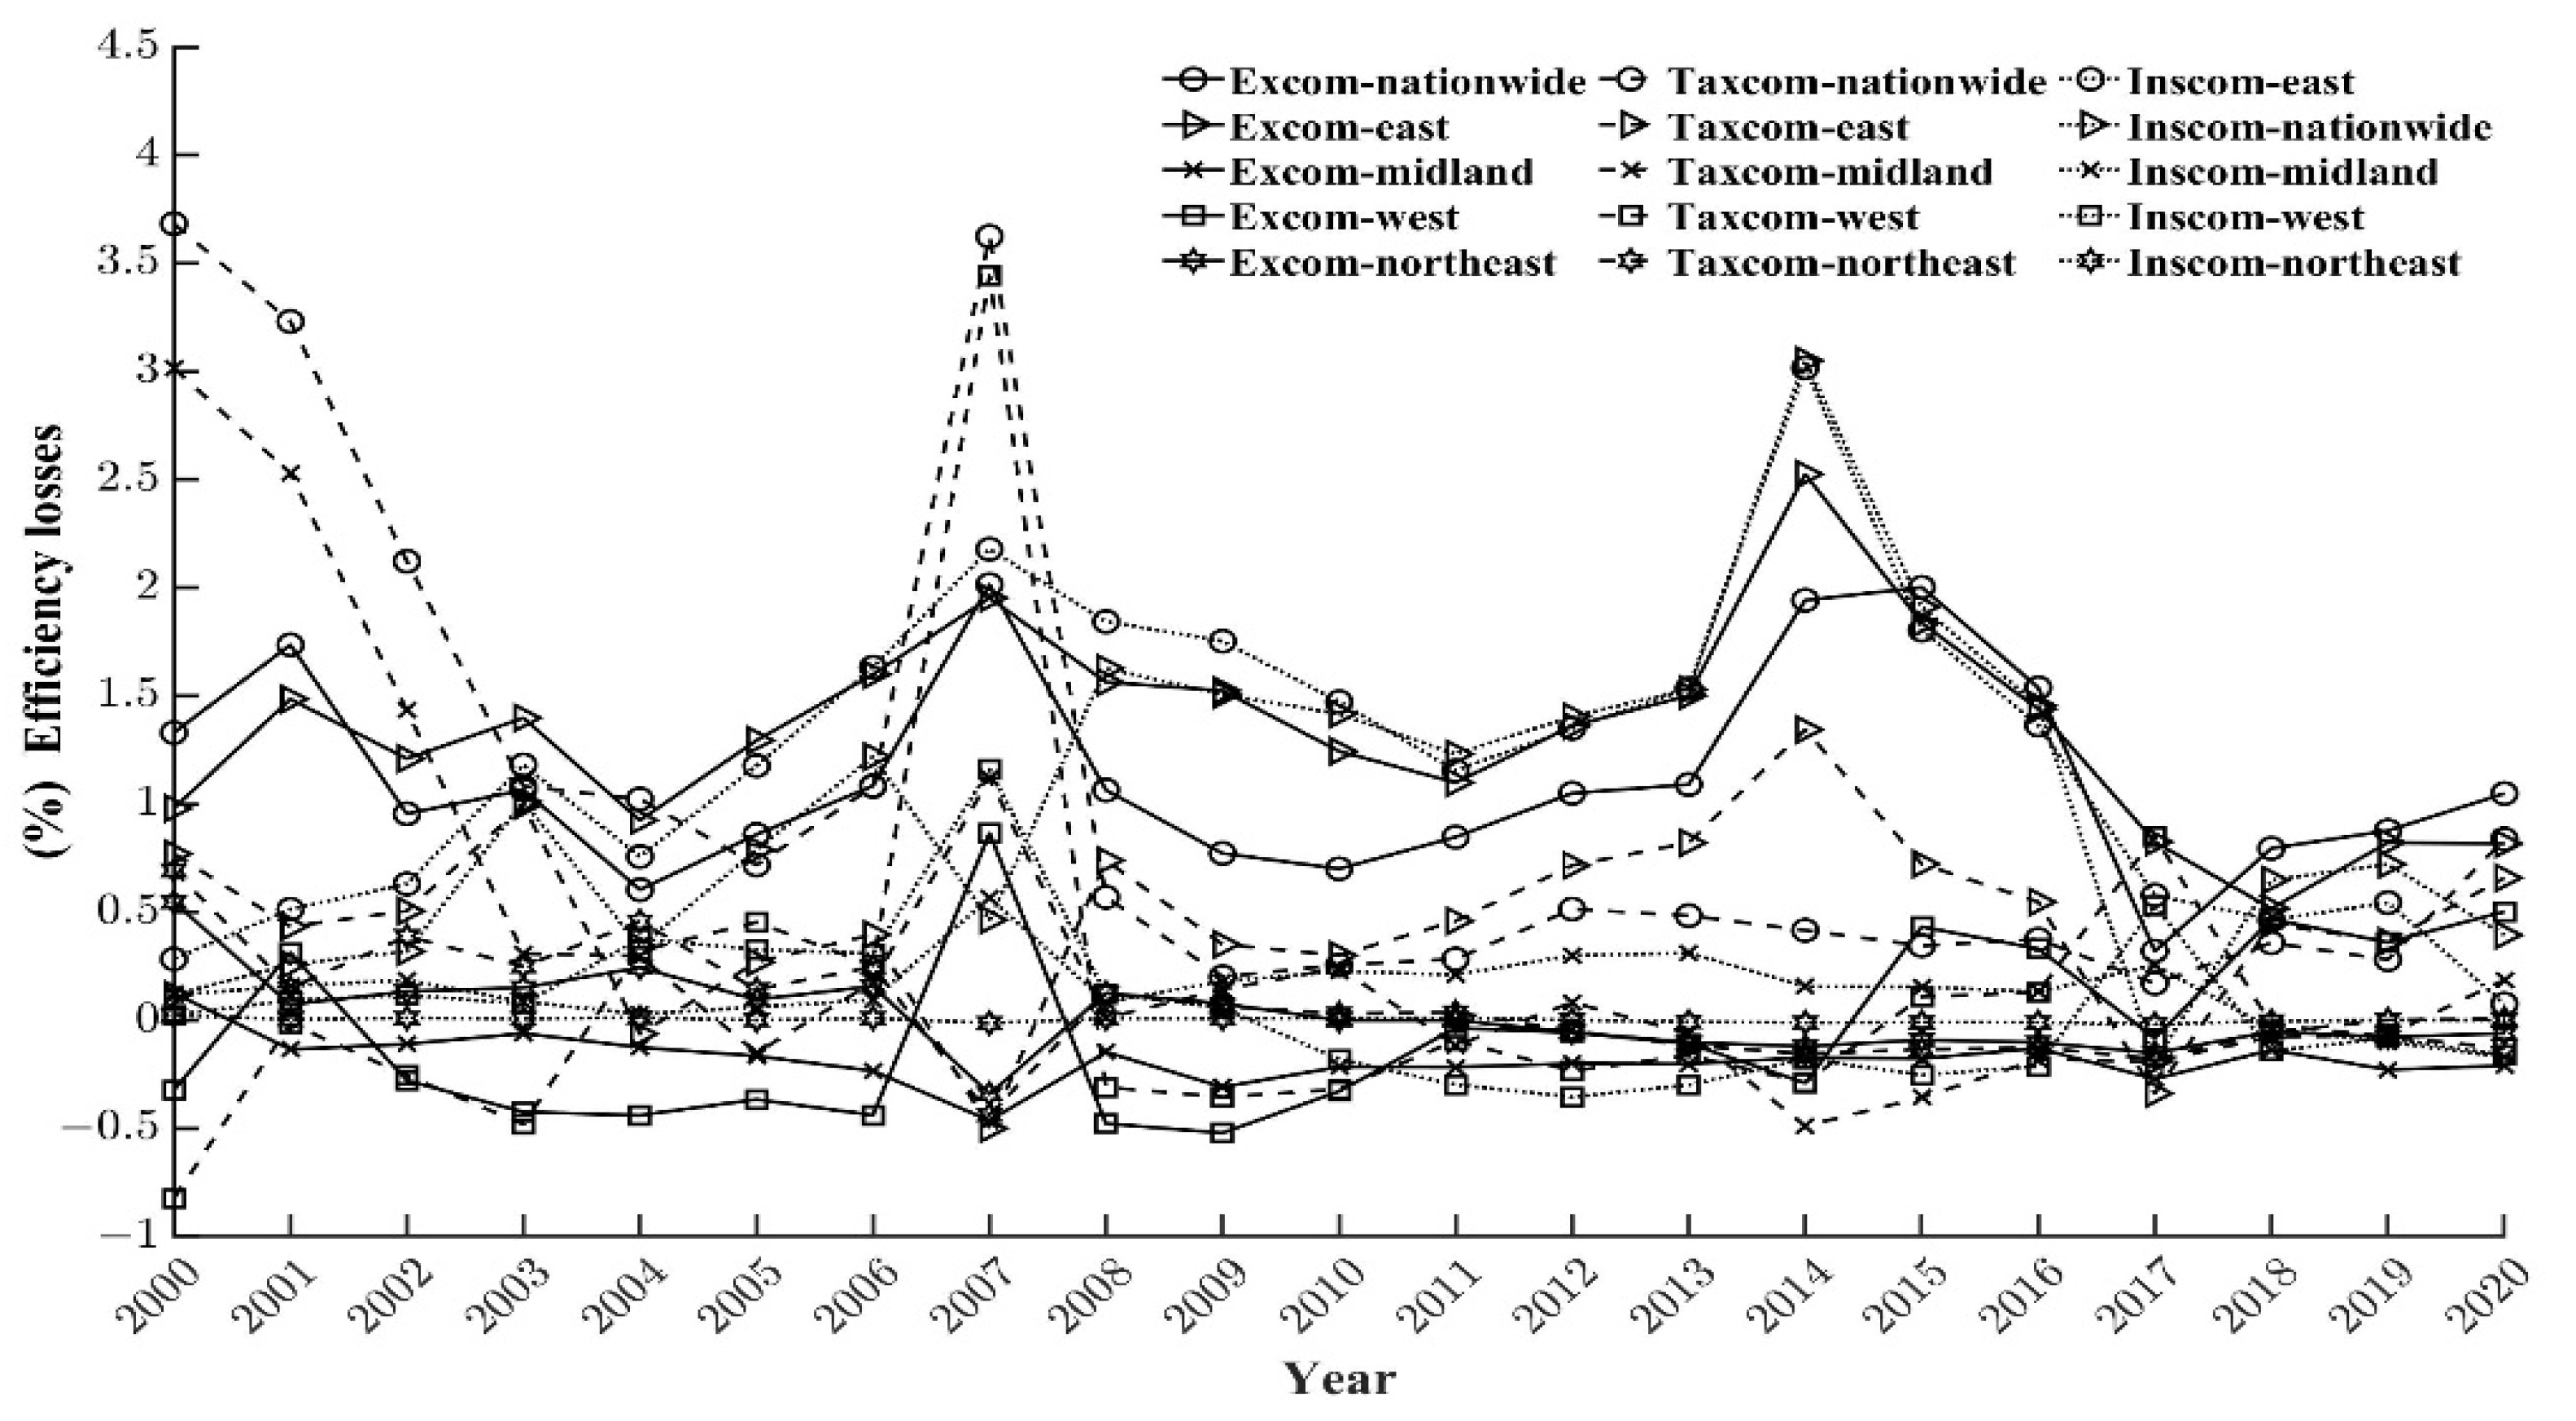
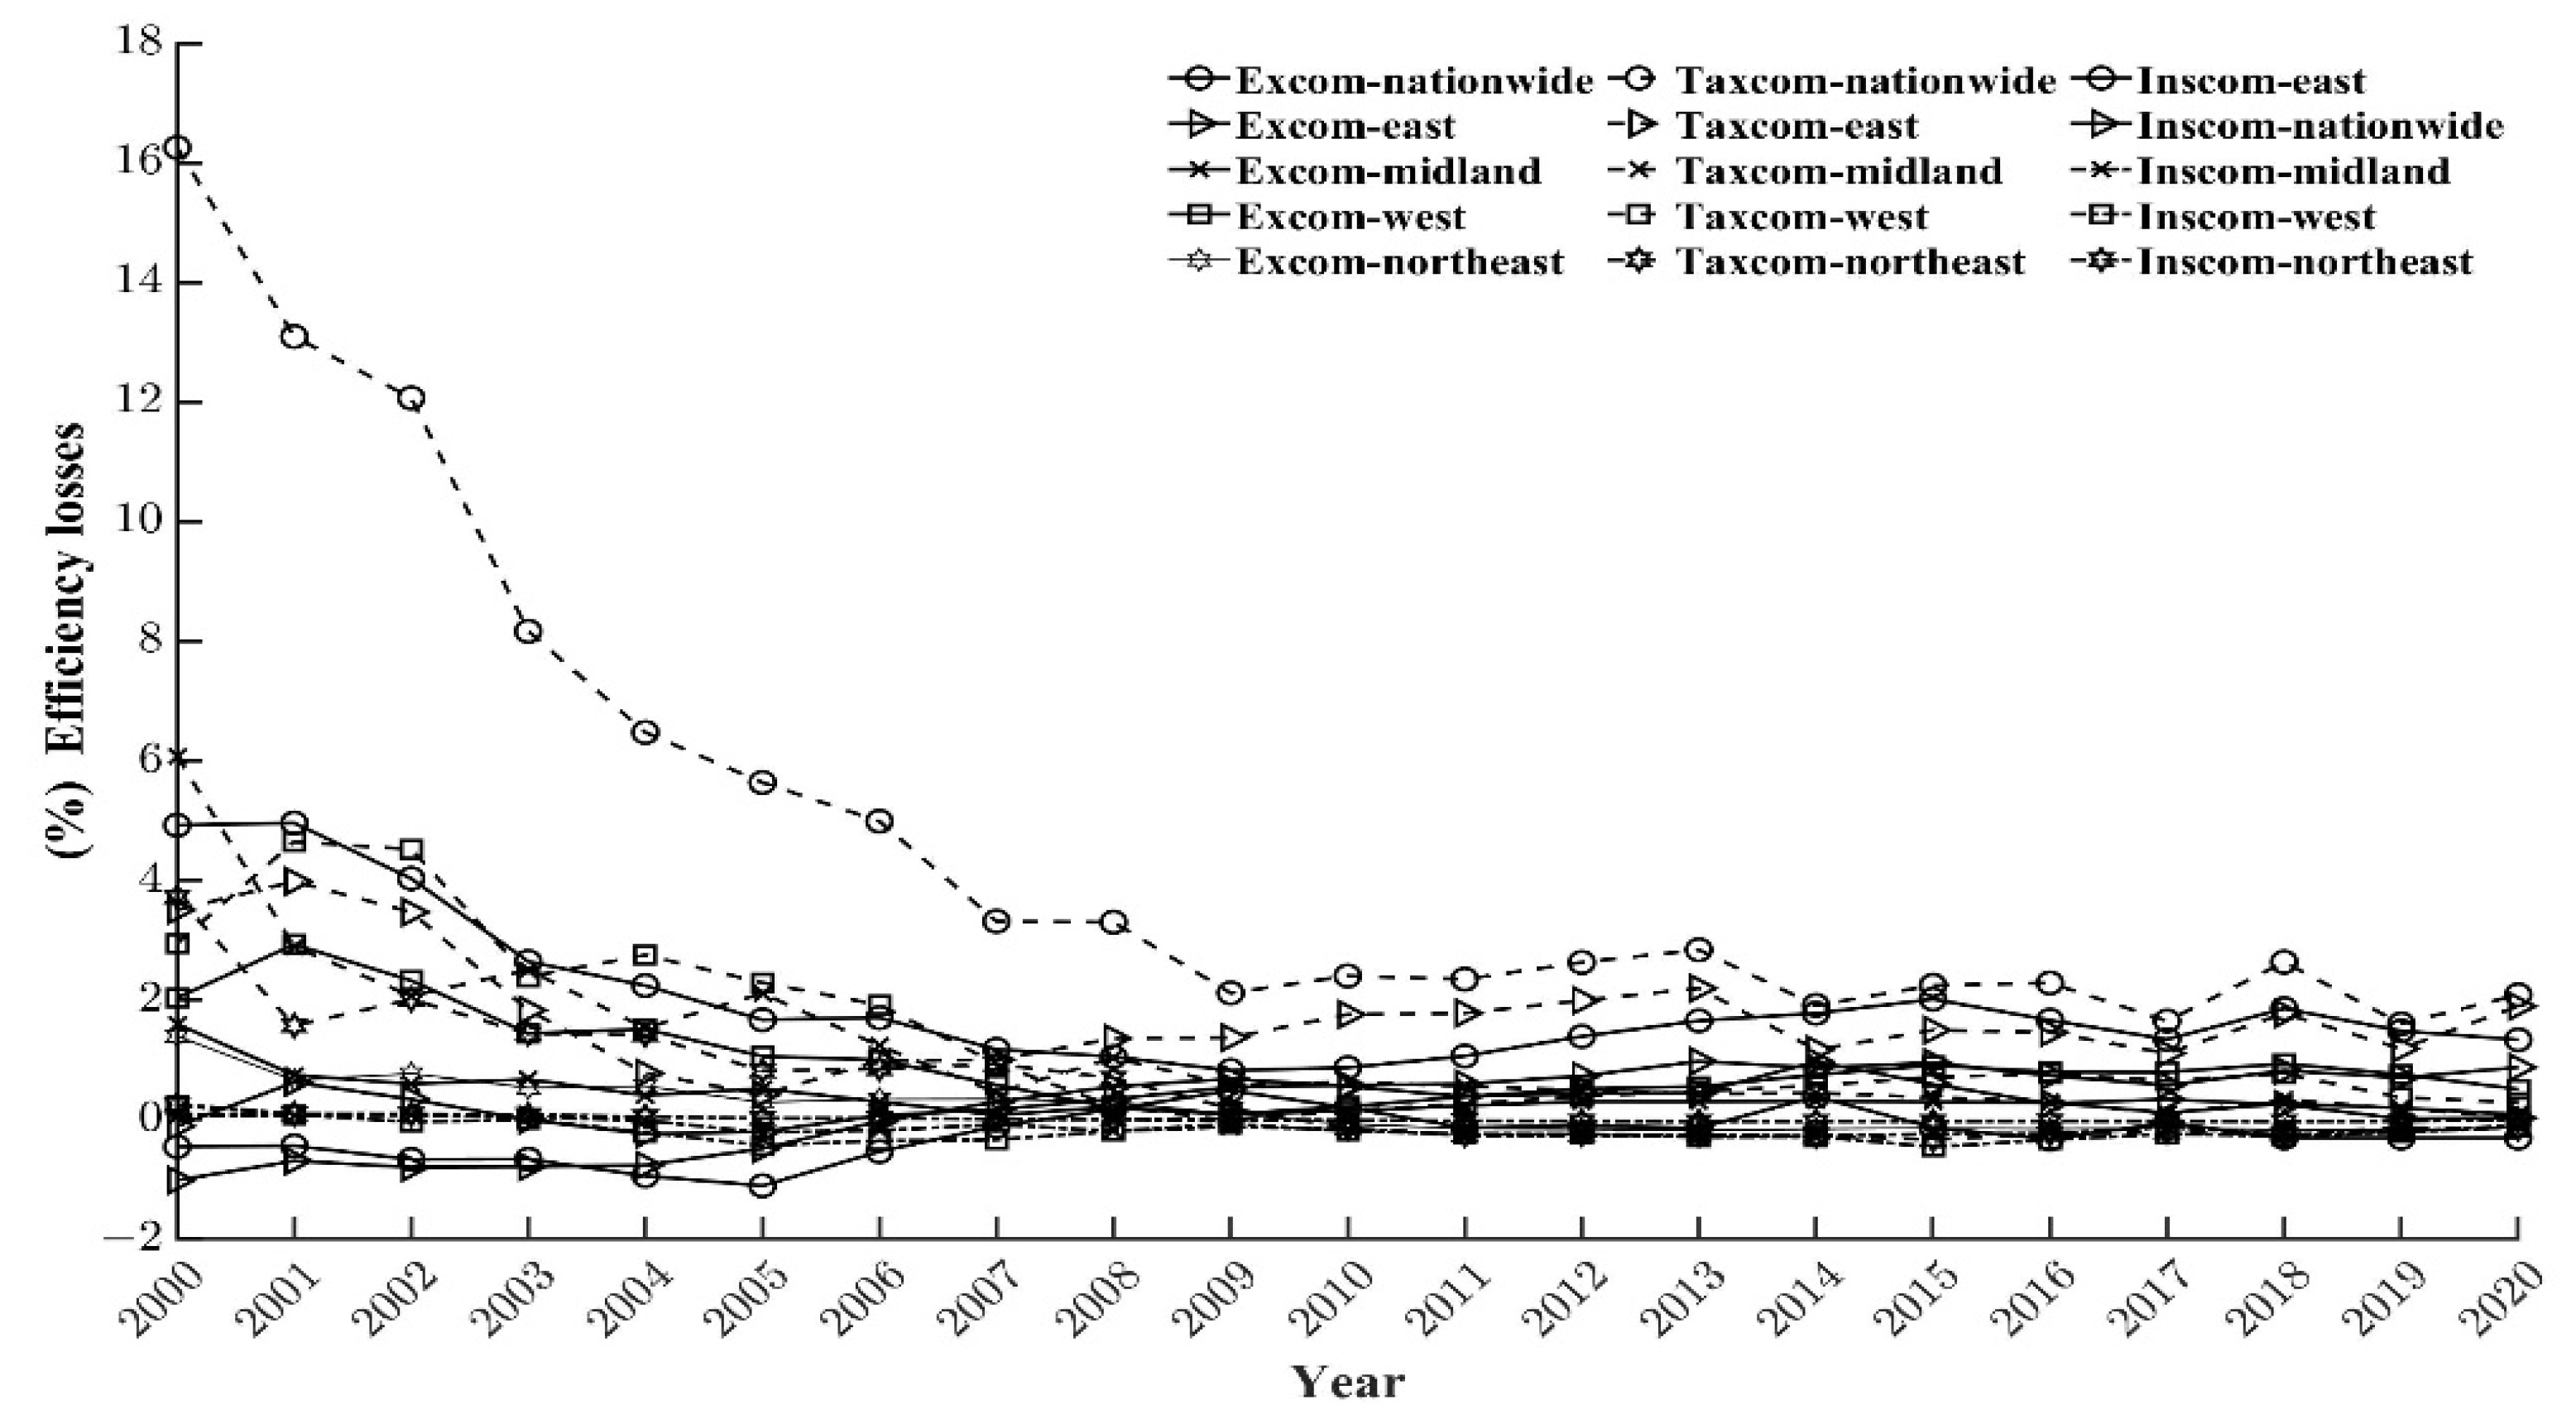
6.2. Dynamic Difference Analysis of Green Innovation Efficiency Loss Caused by Local Government Competition in Four Sectors

In order to further analyze the characteristics of green innovation efficiency loss caused by local government competition in East, Central, West, and Northeast China, this paper analyzes the trend and dynamic distribution characteristics of green innovation efficiency loss caused by local government competition in four major sectors.

6.2.1. Trend Difference Analysis

Trend analysis is shown in Figure 9 and Figure 10. Among them, Figure 9 shows that the green innovation efficiency loss caused by local government competition in the western region is the smallest, and even the competition between tax and system leads to the over-allocation of innovative talents, which also slightly improves the green innovation efficiency. Institutional competition in Northeast China has also promoted the over-allocation of innovative talents and improved green innovation efficiency. However, the mismatch of innovative talents caused by the competition between expenditure and tax revenue causes less loss of green innovation efficiency. The average loss of green innovation efficiency caused by the mismatch of innovative talents caused by institutional competition in the central region is smaller than in the Eastern region. Deng et al. [50] showed that the impact of local government competition on green innovation performance has regional heterogeneity due to different resource endowments among provinces in China, which indirectly confirms the reliability of our research conclusion. However, different from Deng et al. [50], this paper starts with the change of innovation factor allocation and further analyzes the root cause of regional heterogeneity of the loss of green innovation efficiency caused by local government competition. Our research results can provide a basis for each region to formulate its policies to improve green innovation efficiency.
The efficiency loss caused by the mismatch of innovative talents caused by local government competition in eastern China generally shows a downward trend. Among them, the efficiency loss caused by institutional competition decreased from 0.18% in 2000 to 0.01% in 2020, and the efficiency loss caused by tax competition decreased from 3.05% in 2000 to 0.98% in 2020. The yearly average reduction rate was 3.39%, and the efficiency loss caused by expenditure competition decreased from 0.98% in 2000 to 0.82% in 2020. However, over time, the efficiency loss caused by local government competition in the eastern region increased in 2007, 2014, and 2018 compared with the previous year, showing a fluctuating downward trend year by year. The efficiency loss caused by institutional competition fluctuated most violently. The efficiency loss caused by the competition between tax revenue and expenditure in the Western region changed steadily with time, only increasing in 2007 and 2015 and then continued to change steadily. However, the efficiency loss caused by institutional competition fluctuated steadily over time and showed a declining trend overall, with an annual decline rate of 7.59%. The change of green innovation efficiency loss in Central and Northeast China is relatively stable. Still, the efficiency loss caused by the mismatch of innovative talents caused by institutional competition increases yearly. It can be seen that the loss of innovation efficiency caused by institutional competition has converged in the Eastern region. However, it is still diverging in the Central and Northeast regions.
Figure 10 shows that from the degree of green innovation efficiency loss caused by various sectors, the efficiency loss caused by innovation capital mismatch in the eastern region is still more significant than that caused by institutional competition in other regions. From 2000 to 2020, the average efficiency loss caused by innovation capital mismatch caused by local government competition in the eastern region was 0.06%. In the Central, Western, and Northeast regions was 0.14%, 0.20%, and 0.02%, respectively. From the trend analysis, the efficiency loss caused by the mismatch of innovative capital due to competition among various sectors is greater than the mismatch of innovative talents, and the overall decrease from 2000 to 2020 is smaller.
Among them, the efficiency loss of the mismatched part caused by tax competition in the eastern region showed an “M” shape, which increased significantly in 2008 and 2018, respectively. The efficiency loss caused by institutional competition has the smallest fluctuation range, rising and falling from time to time in 2000 to 2012. Some changes caused by competition are relatively stable, but in 2020, it decreased compared with 2000, and the loss of green innovation efficiency changed from 0.11% to 0.87%. The institutional competition in the central region fluctuates lesser, showing a “V” shape. Before 2009, it showed a downward trend yearly. However, after 2009, it showed an upward trend year by year, resulting in a smaller reduction in efficiency loss in 2020 than in 2000. The loss of green innovation efficiency caused by competition with tax expenditure is more significant, and the change is relatively unstable. The efficiency loss caused by the mismatch of innovation capital caused by institutional competition in the western region is still quite significant, with an approximate “N” shape over time. It showed a downward trend year by year from 2000 to 2009, but it showed an upward trend from 2009 to 2015 and a downward trend from 2015 to 2020. The loss of green innovation efficiency caused by expenditure and tax competition has not changed much over time. It showed a slow downward trend from 2000 to 2009 but gradually increased since 2000. Comparing the loss of innovation efficiency caused by expenditure and tax competition in 2020, the loss of green innovation efficiency caused by expenditure and tax competition has decreased in recent years.
Compared with other regions, the efficiency loss caused by the mismatch of innovation capital caused by local government competition in Northeast China is small, with slight fluctuation over time. The most significant loss of green innovation efficiency is caused by tax competition, but the change is relatively stable. Institutional competition is conducive to the excessive accumulation of innovation capital, which leads to the scale effect and improves green innovation efficiency. At the same time, under the action of institutional competition, the green innovation efficiency loss in Northeast China turns from positive to negative.

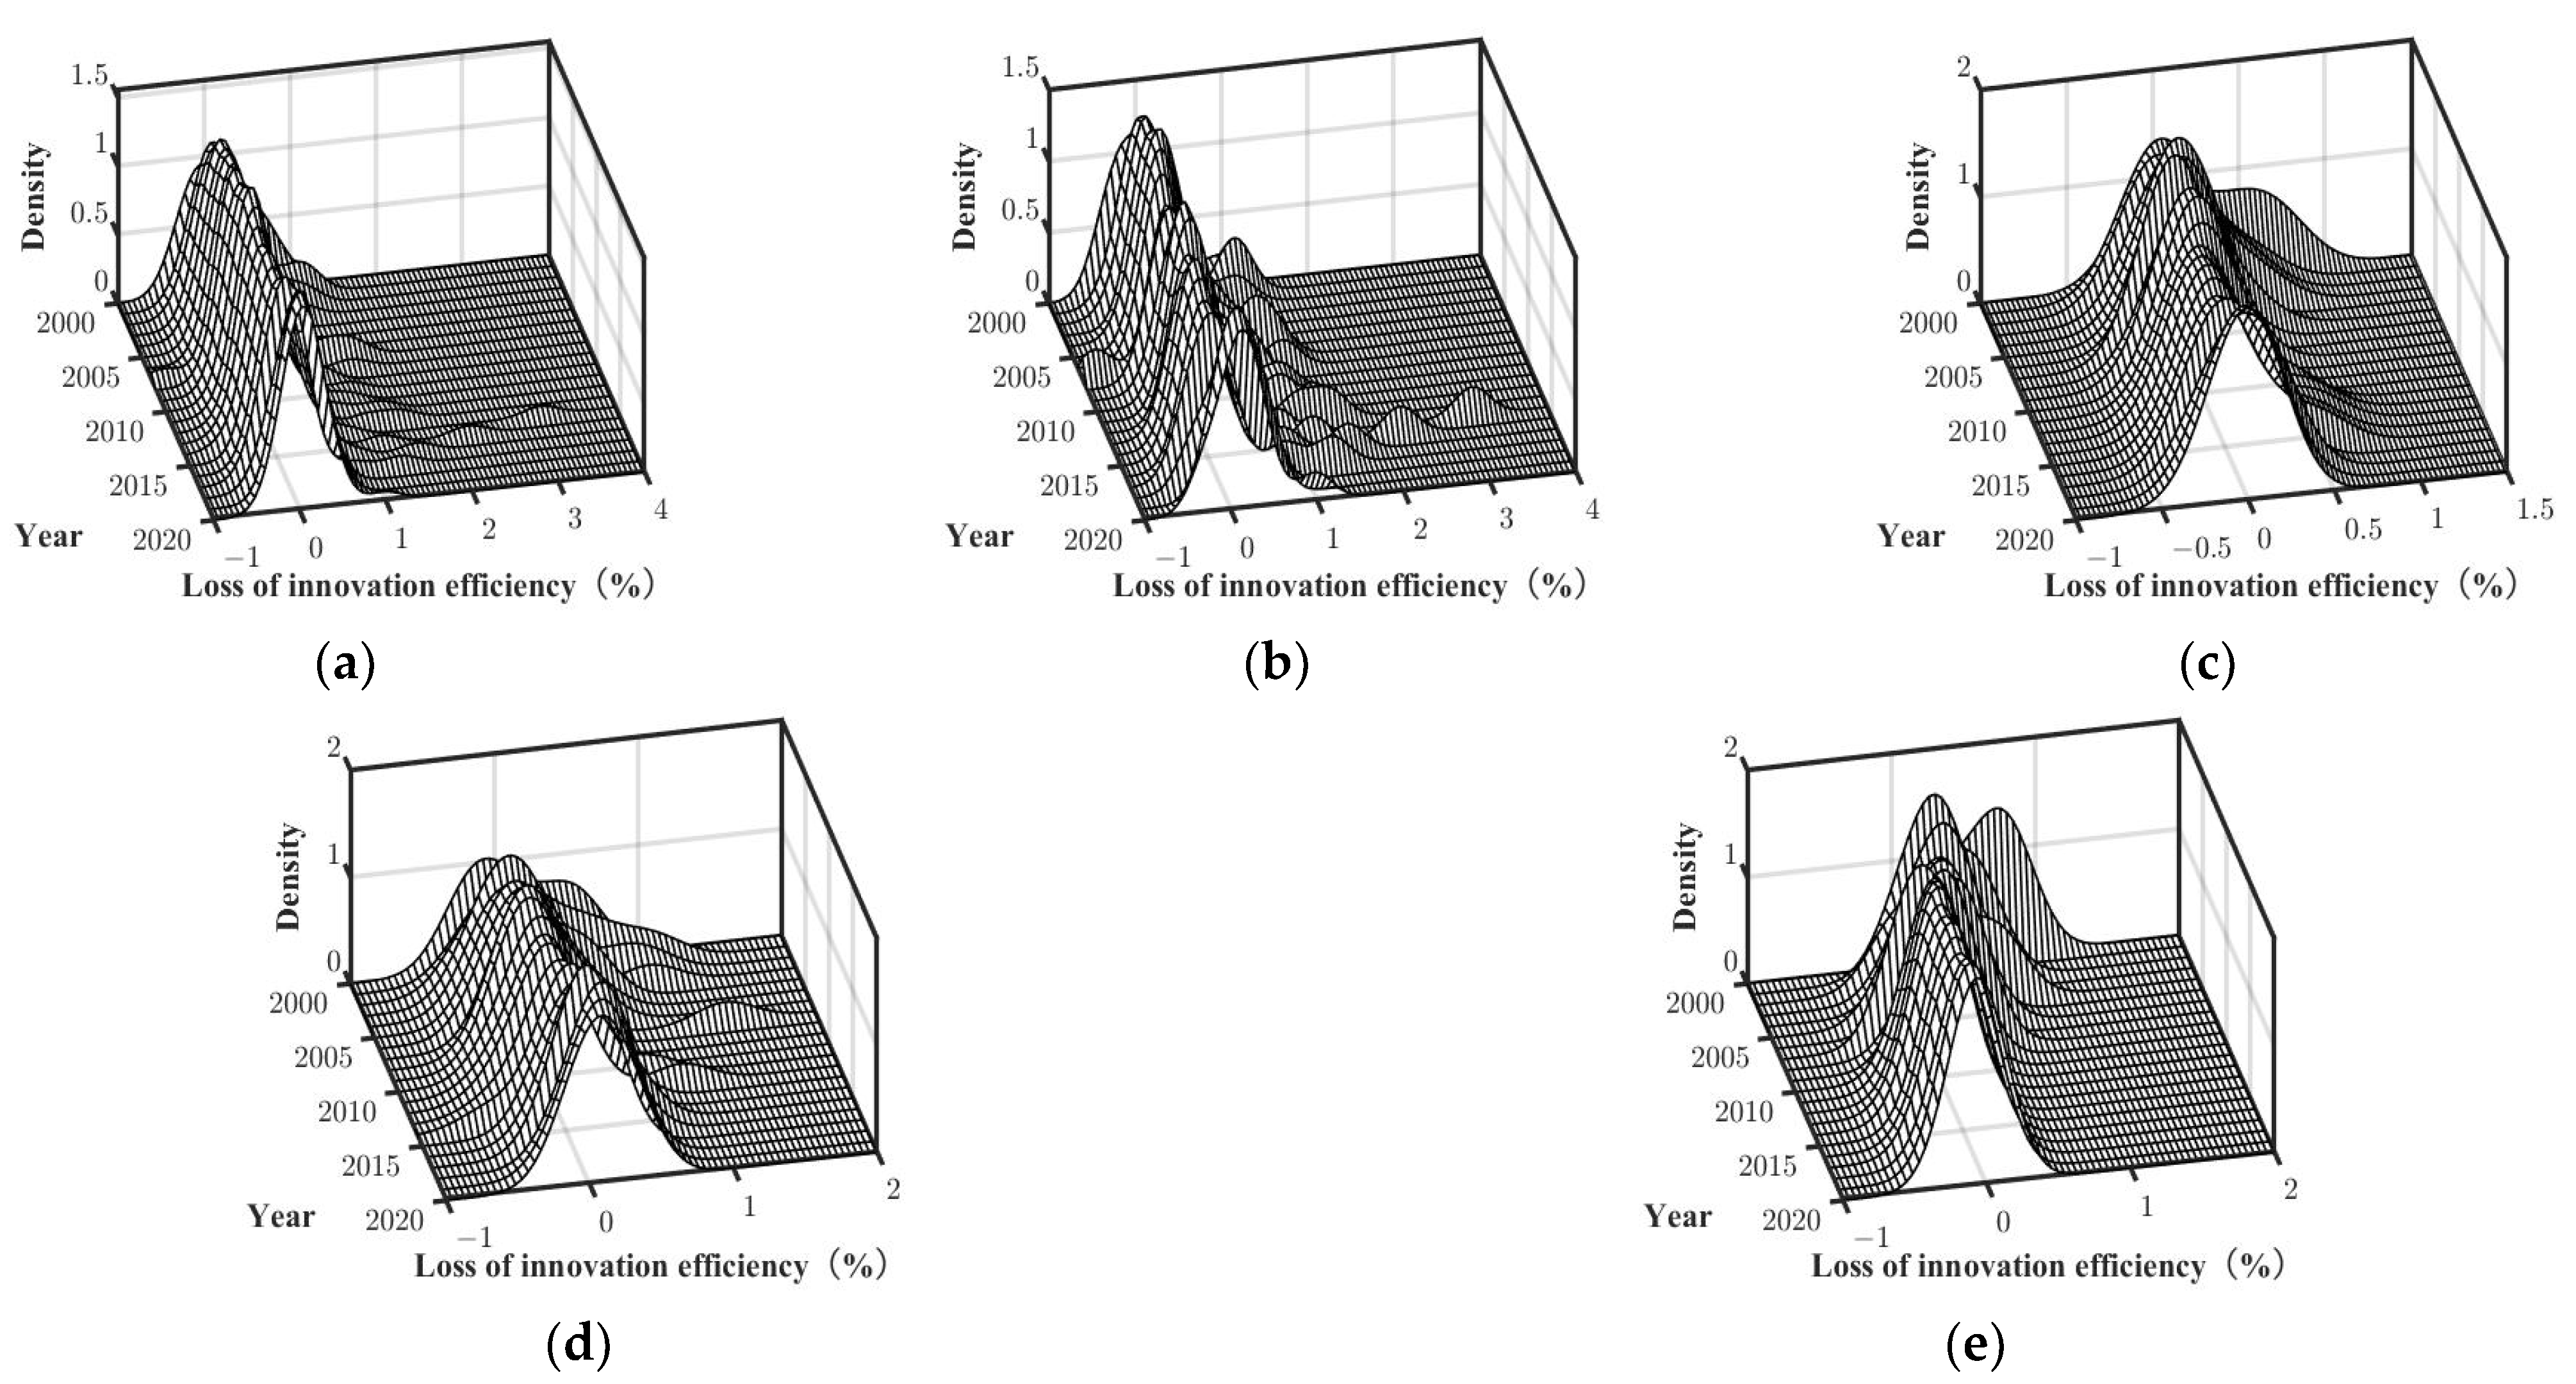
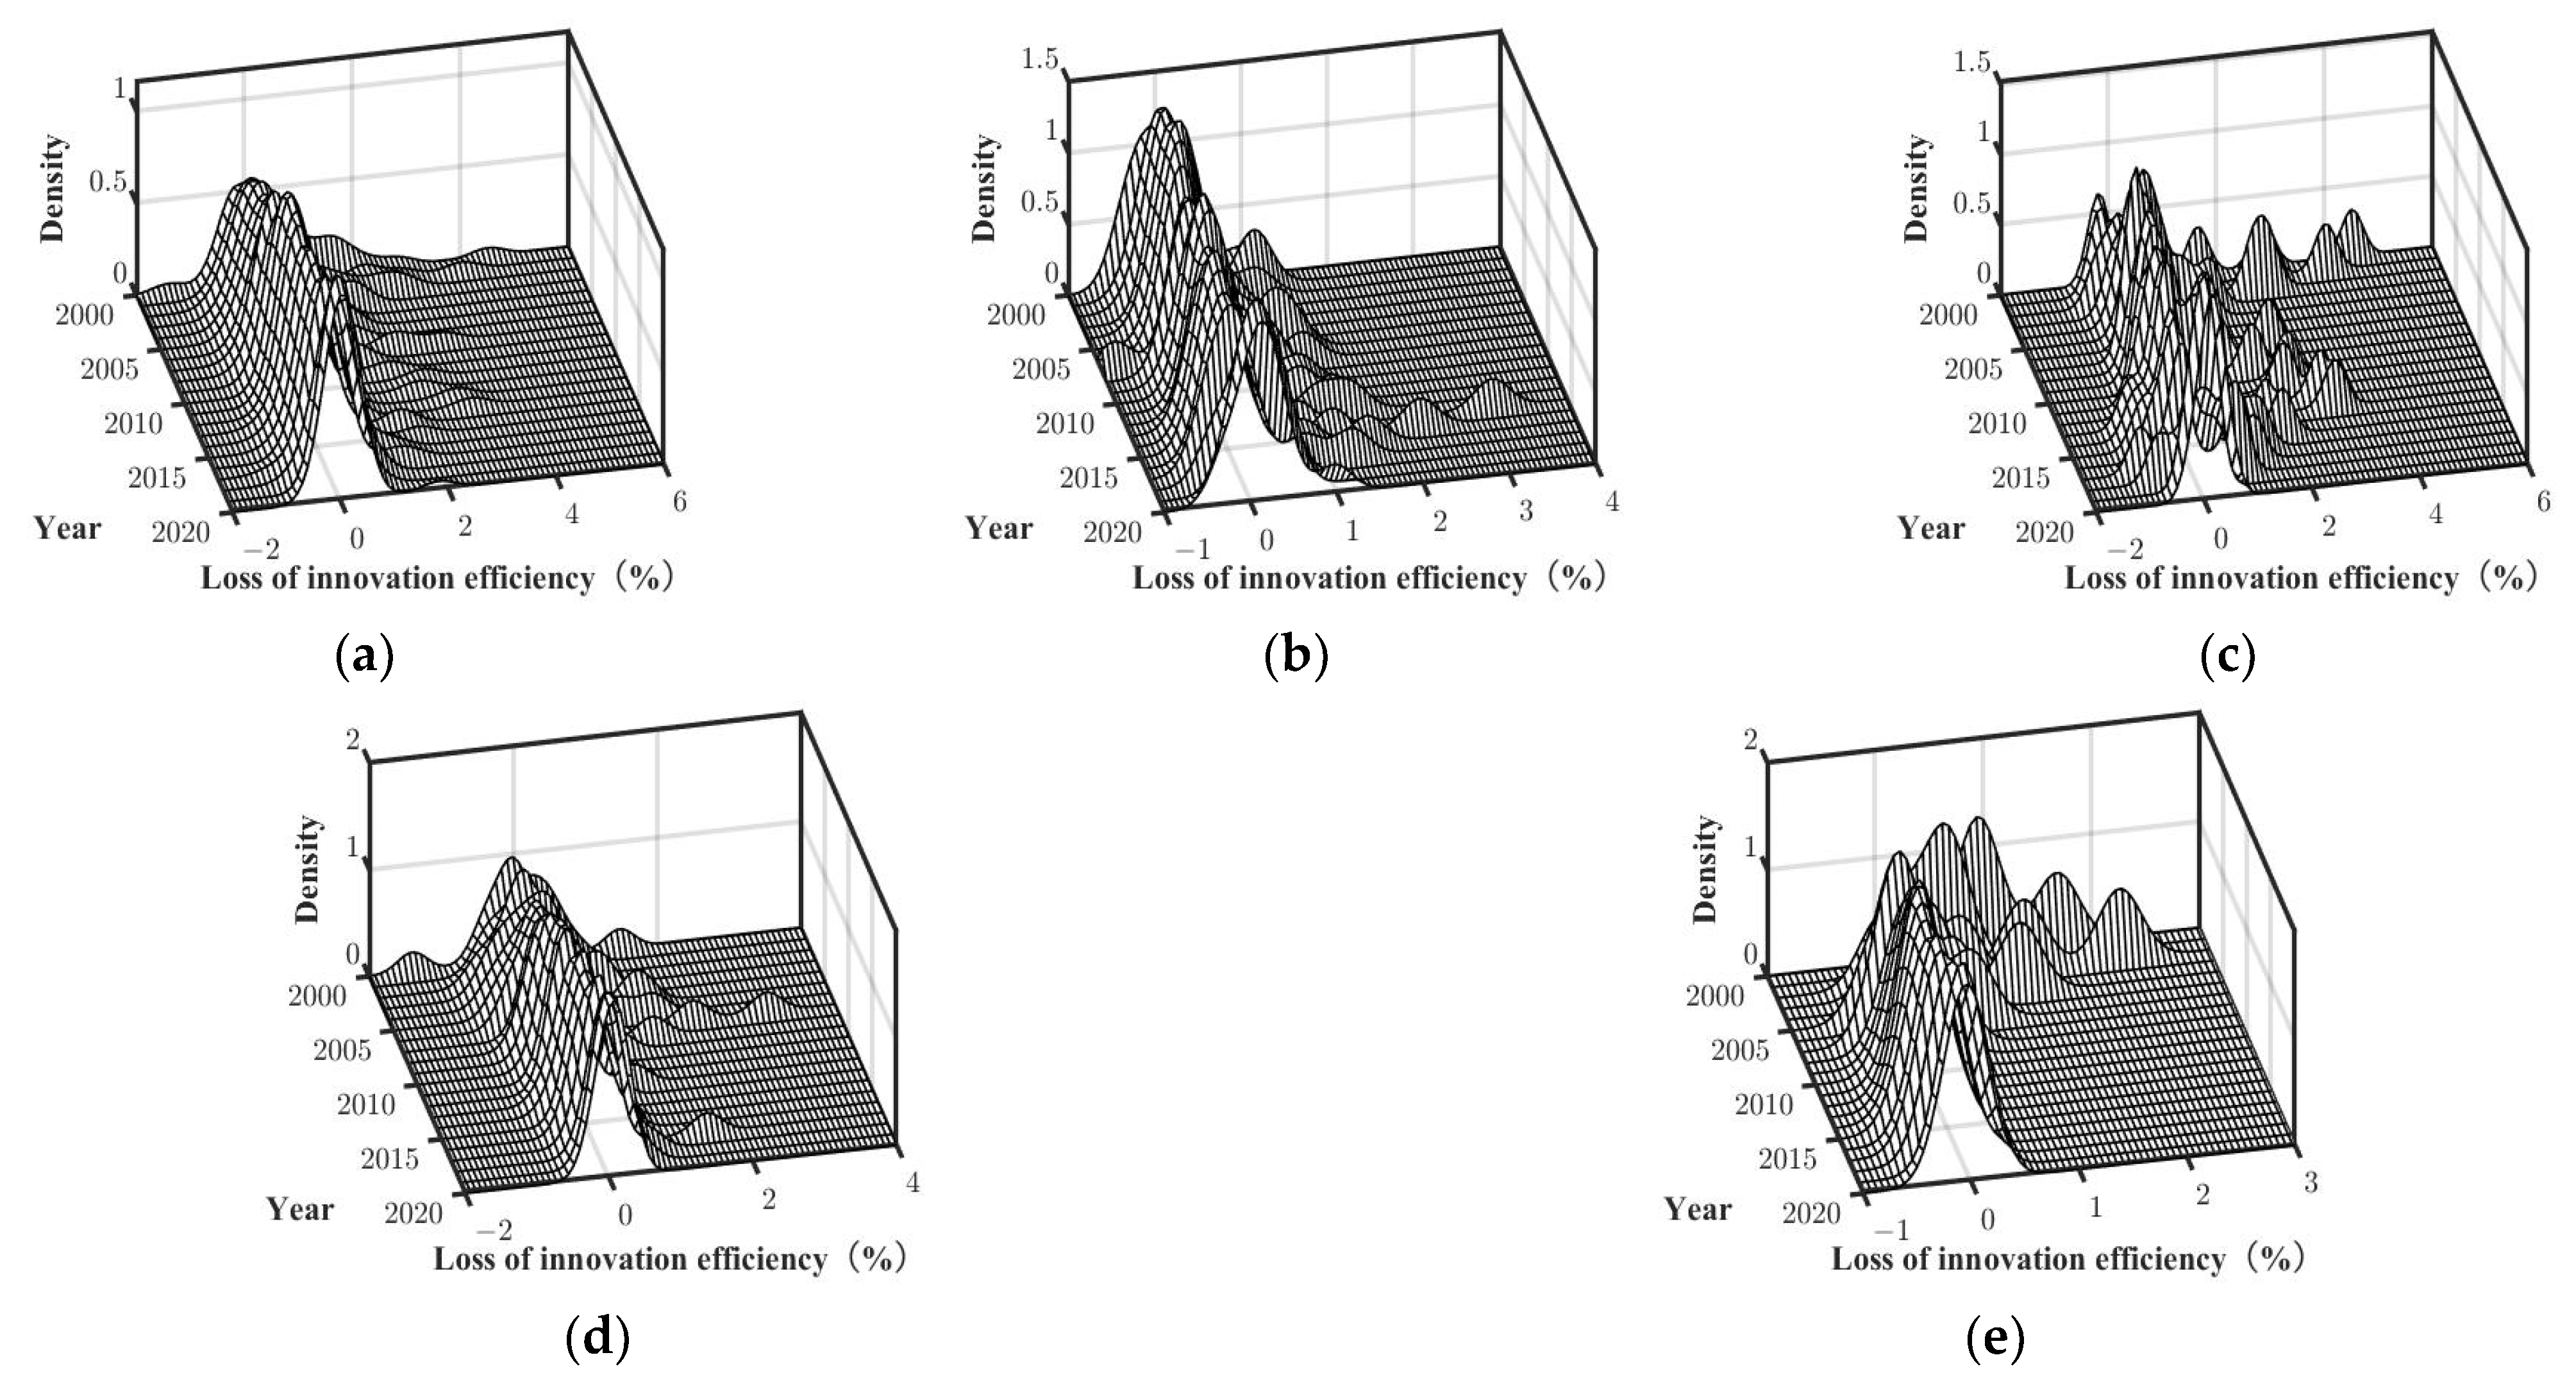
6.2.2. Analysis of Dynamic Distribution Differences

This paper uses the Kernel density estimation to compare the trend difference of efficiency loss caused by innovation resources mismatch in different regions. The Kernel estimation can objectively describe the distribution of green innovation efficiency loss caused by local government competition in different years. Suppose random variable Y = y 1 , y 2 , y n is independent and identically distributed, and there is a random variable X , whose density function is f x . The Kernel density function can be expressed as:
f x = 1 n h i = 1 n K y i y h
where n is the number of individuals in the investigation period. h is the window width, which determines the smoothness of the density function. The kernel function is K . According to (44), this paper employs the Gaussian kernel function to estimate the kernel density. The method of determining the window width of the Gaussian kernel function is h = 0.9 S e N 0.2 , where Se is the standard deviation with the observation of random variables and N is the number of provinces in the region. This paper designs the loss of innovation output growth rate in different years. If this standard is used to determine the window width, the nuclear density maps in different years will be incomparable. Therefore, considering the comprehensive factors such as the mismatch degree of regional innovation elements caused by different competitive factors and the effectiveness of time trend comparison, this paper chooses the same window width in different years to adequately describe the dynamic evolution characteristics.
From the distribution position analysis, as shown in Figure 11a, the core density diagram of the green innovation efficiency loss caused by the national overall expenditure competition tends to concentrate on the zero axis, which indicates that the green innovation efficiency loss caused by the national overall expenditure competition has been alleviated. As shown in Figure 11b,c, there is a left-shift phenomenon in the nuclear density map of the eastern, northeast, and central regions. That is, the loss of green innovation efficiency caused by expenditure competition between eastern and central regions has a downward trend. In Figure 11d, there is a small right-moving trend there is a slight trend to the right, which indicates that there is upward pressure on the efficiency loss in the West. Figure 11e shows that the distribution of northeast China is similar to that of eastern and central China. From the analysis of the distribution pattern, as shown in Figure 11a, the height of the main peak first rises and then falls. The overall performance shows a downward trend, which indicates that the dispersion degree of green innovation efficiency loss caused by the expenditure competition is scattered.
Among all the plates, except Figure 11e, which firstly rises and then falls, the main peaks in other figures gradually decrease. This indicates that the dispersion degree of green innovation efficiency loss caused by the expenditure competition in the entire country, Eastern, Central, and Northeast regions is expanding. From the analysis of distribution extensibility, the distribution curves of Figure 11b,d,e are all right-tailed, but overall, it shows extended convergence, which indicates that in East, West and northeast regions, the difference in average efficiency loss between provinces with higher green innovation efficiency loss and regions gradually decreases. Still, as shown in Figure 11c, the Central region is not right-tailed, which indicates that the difference in green innovation efficiency loss caused by expenditure competition is small among provinces. From the analysis of polarization characteristics of distribution, the distribution curve in Figure 11b shows multi-peaks, which indicates that the loss of green innovation efficiency caused by expenditure competition has polarization characteristics among eastern provinces. Over time, the distribution curve in Figure 11c,e shows a trend of double peaks-single peaks. This indicates that the multi-polarization phenomenon in central and northeast regions is gradually attenuated. As shown in Figure 11d, the distribution curve changes from multiple peaks to single peaks. This indicates that the multi-polarization characteristics in west region are weakened as a whole. In other words, the loss of green innovation efficiency caused by expenditure competition has a spatial diffusion effect.
From the distribution position analysis, as shown in Figure 12a, the distribution curve of green innovation efficiency loss caused by tax competition in China has somewhat changed, which indicates that the green innovation efficiency loss caused by tax competition does not decrease significantly. Among the four plates, as shown in Figure 12b, the distribution curve changes with time and presents a "left-right" evolution state, but overall, it shifts to the right, the loss of green innovation efficiency caused by tax competition in east region decreases first and then increases. but on the whole, it has an upward trend. As shown in Figure 12c, the distribution curve shifts to the left over time. It shows the loss of green innovation efficiency caused by tax competition in this region has a downward trend. However, in Figure 12d, the distribution curves of the Western regions shift slightly to the right over time, this implies that the loss of green innovation efficiency caused by tax competition in these has an upward pressure. Figure 12e shows that the distribution positions of northeast region and central region are similar. From the analysis of the distribution pattern, as shown in Figure 12a, the height and width of the main peaks in China vary slightly. It can be seen that the dispersion degree of green innovation efficiency loss caused by tax competition varies slightly with time all over the country.
And the distribution curves in Figure 12b,c show the characteristics of “low-high-low”, but the overall peak value has declined, which indicates that the dispersion degree of green innovation efficiency loss caused by tax competition in east and central regions has expanded with time. And the peak value in Figure 12d,e has not changed much, but the width has decreased year by year. That is, the dispersion degree of green innovation efficiency loss caused by tax competition in west and northeast regions has been shrinking. From the analysis of distribution extensibility, the distribution curves in each graph all show a right tail phenomenon, but it shows a trend of extended convergence, which indicates that the difference in green innovation efficiency loss among the whole country and each plate is gradually decreasing. From the analysis of the polarization characteristics of distribution, the overall distribution curve in Figure 12a has a double peak in most years, which indicates that the tax competition in a certain province has caused significant efficiency loss. In most years, the distribution curve in Figure 12b,c shows a multi-peak state, with the main peak distributed around 0. Still, there are several sub-peaks on the right side, which indicates that the loss of green innovation efficiency caused by tax competition in east and central regions has a multi-polarization phenomenon in different provinces. In most years, the distribution curve in Figure 12d,e shows a single peak. Moreover, the efficiency loss caused by the internal tax competition in west and northwest regions has a convergent tendency.
From the distribution position analysis, the distribution curve in Figure 13a–c shifts slightly to the left with time, which indicates that the degree of green innovation efficiency loss caused by institutional competition in the whole country, eastern and central regions had a downward trend. As shown in Figure 13d, the distribution curves have shifted slightly to the right with time. The Western region has the most significant shift degree, which indicates that its green innovation efficiency loss caused by institutional competition also has substantial upward pressure. As shown in Figure 13e, the distribution curves have shifted slightly to the left with time, but the change is not obvious. From the analysis of the distribution pattern, as shown in Figure 13a, the peak value of the distribution curve shows a trend from high to low with time and a gradual increase in width. This indicates that the dispersion degree of green innovation efficiency loss caused by institutional competition in the whole has expanded.
Among the four plates, in Figure 13b, the trend of the distribution curve is basically the same as that in the whole country. This indicates that the dispersion degree of green innovation efficiency loss continues to strengthen. In Figure 13c–e, the peak values of the distribution curves all changed from high to low and increase in width with time, which indicates that the absolute difference in the degree of green innovation efficiency loss caused by institutional competition in central, western and northeastern regions shows a narrowing trend. From the analysis of distribution extensibility, the overall distribution curve in Figure 13 shows a right tail. And the whole is in an extended convergence state, which indicates that the overall loss of green innovation efficiency in China has a downward trend. The distribution curve in Figure 13b also showed a right trailing curve, but Figure 13c,d showed some differences in trailing and ductility in different years. Before 2008, there was a right trailing in Figure 13c,d, and the degree of trailing decreased in the later period. There was no obvious trailing in Figure 13e. It can be seen that the loss of green innovation efficiency in the eastern region shows the convergence between provinces. Still, the convergence degree in the central and western regions fluctuates constantly, and there is no convergence trend in the northeast region. From the analysis of the polarization characteristics of the distribution, in most years, there is a main peak in Figure 13a–e. This indicates that the loss of green innovation efficiency caused by institutional competition does not have multi-polarization characteristics in each region.

7. Conclusions

Aiming to help improve green innovation efficiency and facilitate sustainable development, this paper focuses on local government competition. It explores the internal mechanism of how innovation element mismatch reduces green innovation efficiency. Specifically, it evaluates the green innovation efficiency loss caused by innovation factor mismatch caused by local government competition in China (except Tibet, Hong Kong, Macao, and Taiwan). Moreover, this paper analyzes their evolution characteristics. The main conclusions of this paper are as follows.
Firstly, local government competition will cause the mismatch of innovation elements not only locally but also in neighboring regions. Among them, local government expenditure competition contributes the most to innovation talent mismatch, while institutional competition contributes the most to innovation capital mismatch. This means that local governments competing for innovative capital and talents will may result in “harming others but not benefiting themselves”. In the future, local governments may endeavor to pursue collaborative development.
Secondly, the mismatch of innovative talents and capital caused by local government competition reduces green innovation efficiency. However, there are some differences among provinces. The lack of innovative talents partly causes the loss of green innovation efficiency in Beijing, Tianjin, and Shanghai. However, it is compensated for because of the accumulation of innovation capital. This effect on Shanxi, Inner Mongolia, Jilin, Fujian, and Ningxia is the opposite. That means the developed regions of China, such as Beijing, Tianjin, and Shanghai, still need a sustainable development of talents. It is critical for these regions to eliminate the institutional barriers in these regions and attract or cultivate innovative talents. Furthermore, these regions should keep attracting innovation capital.
Thirdly, there is a heterogeneity of government competition strategy in the loss of green innovation efficiency at the provincial level. Among them, the loss of green innovation efficiency caused by tax competition is the most significant in Beijing, Shanghai, Zhejiang, Shandong, and Guangdong due to the lack of innovative talents. At the same time, Heilongjiang, Zhejiang, Guangdong, Yunnan, Chongqing, and other regions are short of innovation capital, resulting in severe efficiency loss. In recent years, China has begun to implement the policy of “tax reduction and fee reduction”. However, if each region does not implement a strategic tax reduction policy instead of a strategy of “race to the bottom”, it may lead to a disorderly flow of innovation factors. Consequently, it may lead to a shortage of innovative talents and capital in some regions, lowering their green innovation efficiency. In addition, our analysis of the four sectors shows that the eastern region suffers the most in innovation efficiency due to government competition, while the northeast region attracts innovative talents due to government competition, improving its green innovation efficiency. Thus, cooperation between provinces within the eastern region should be established to prevent the loss of green innovation efficiency.
Fourthly, the loss of green innovation efficiency caused by local government competition shows a decreasing trend year by year, and the fastest decreasing rate is caused by tax competition. Moreover, the green innovation efficiency of all provinces shows a dynamic convergence trend. Under different competition strategies, there are some differences in the dynamic characteristics of green innovation efficiency loss in the four sectors. However, institutional competition hinders the improvement of green innovation efficiency in the eastern, central and western regions. This means that the influence of competitive tax reduction strategies on innovation factors in different regions is gradually decreasing. The policy of “talent competition” currently implemented in some Chinese cities may have a significant impact on innovation factors. However, this policy may burden public services and has a limited effect on innovation efficiency improvement [51].
In view of the above conclusions, this paper puts forward the following policy recommendations:
(1)
Guide local governments to establish cooperative relationships and prevent excessive competition from hurting the green innovation efficiency.
(2)
Formulate “tax reduction and fee reduction” in light of local conditions to prevent the loss of green innovation efficiency caused by “race to the bottom” tax cuts.
(3)
Cultivate and attract innovative talents and prevent further loss of green innovation efficiency in Beijing, Shanghai, and Tianjin.
(4)
Prevent the loss of green innovation efficiency caused by institutional competition.
To sum up, the main contributions of this paper are as follows. Firstly, based on a multi-sector general equilibrium analysis model, the theoretical mechanism of “local government competition → innovation factor mismatch → loss of green innovation efficiency” is revealed, which is beneficial to explore the “black box” of local government competition affecting green innovation efficiency.
Secondly, the degree of efficiency loss of green innovation caused by innovation factor mismatch due to local government expenditure, taxation, and institutional competition is evaluated. This result can help local governments objectively evaluate their competition strategy. Note that although the literature has shown that intensified local government competition will increase the loss of green innovation efficiency, an objective measurement was unavailable [27].
Thirdly, based on provincial samples and considering the unbalanced characteristics of China’s economic development, the Kernel density estimation method is used to analyze the evolution characteristics of the loss of green innovation efficiency in eastern, central, western and northeastern China, which helps predict and compare the changes of green innovation efficiency in different sectors. Although some scholars described the changing characteristics of China’s green innovation efficiency, they only explored the industrial green innovation efficiency but not its source. Specifically, although Zhao et al. [52] measured the provincial green innovation efficiency, the trend of the provincial green innovation efficiency was only briefly described, and such a trend for the future could not be predicted [53].
There are several limitations in this research. First, only data from China were collected without international data [54]. As a result, it is impossible to make a comparative analysis between China and other countries and further analyze the constraining factors for China’s green innovation efficiency improvement. Second, due to the short disclosure period of data related to green innovation in China, the research is currently limited to analyzing the loss of green innovation efficiency caused by factor mismatch between regions. In China, local government competition will cause industrial isomorphism among regions, thus hindering the improvement in green innovation efficiency. Therefore, in the future, we should not only compare the loss and source of green innovation efficiency in different countries but also continuously collect data on the green innovation of China’s different industries and further investigate the industrial mismatch of innovation factors caused by local government competition.

Author Contributions

Conceptualization, F.L. and X.W.; Methodology, F.L.; Software, T.N.; Validation, T.N.; Formal analysis, X.W.; Investigation, F.L.; Resources, X.W.; Data curation, T.N.; Writing—original draft preparation, F.L.; Writing—review and editing, F.L. and X.W.; Visualization, T.N.; Supervision, X.W.; Project administration, F.L.; Funding acquisition, F.L. and X.W. All authors have read and agreed to the published version of the manuscript.

Funding

This research was funded by the Department of Social Science Research Administration, Northwestern University, China (grant number: 19XNFH026), and Shaanxi Provincial Social Science Planning Project (grant number: 2021D048).

Institutional Review Board Statement

Not applicable.

Informed Consent Statement

Not applicable.

Data Availability Statement

The data used to support the findings of this study are available from the corresponding author upon request.

Conflicts of Interest

The authors declare no conflict of interest.

References

  1. Fan, J.; Teo, T. Will China’s R&D Investment Improve Green Innovation Performance? An Empirical Study. Environ. Sci. Pollut. Res. 2022, 29, 39331–39344. [Google Scholar] [CrossRef]
  2. Rogge, K.S.; Schleich, J. Do Policy Mix Characteristics Matter for Low-Carbon Innovation? A Survey-Based Exploration of Renewable Power Generation Technologies in Germany. Res. Policy 2018, 47, 1639–1654. [Google Scholar] [CrossRef]
  3. Brandt, L.; Tombe, T.; Zhu, X. Factor Market Distortions Across Time, Space and Sectors in China. Rev. Econ. Dyn. 2013, 16, 39–58. [Google Scholar] [CrossRef] [Green Version]
  4. Hsieh, C.T.; Klenow, P.J. Misallocation and Manufacturing TFP in China and India. Q. J. Econ. 2009, 124, 1403–1448. [Google Scholar] [CrossRef] [Green Version]
  5. Sun, X.; Loh, L.; Chen, Z.; Zhou, X. Factor Price Distortion and Ecological Efficiency: The role of institutional quality. Environ. Sci. Pollut. Res. 2020, 27, 5293–5304. [Google Scholar] [CrossRef]
  6. Tiebout, C.M. A Pure Theory of Local Expenditures. J. Political Econ. 1956, 64, 416–424. [Google Scholar] [CrossRef]
  7. Hayashi, M.; Boadway, R. An Empirical Analysis of Intergovernmental Tax Interaction: The case of business income taxes in Canada. Can. J. Econ./Rev. Can. D’économique 2001, 34, 481–503. [Google Scholar] [CrossRef]
  8. Rosário, C.; Varum, C.; Botelho, A. Impact of Public Support for Innovation on Company Performance: Review and Meta-Analysis. Sustainability 2022, 14, 4718–4731. [Google Scholar]
  9. Li, H.B.; Zhou, L.A. Political Turnover and Economic Performance: The incentive role of personnel control in China. J. Public Econ. 2005, 89, 1743–1762. [Google Scholar] [CrossRef]
  10. Zhou, X.G. Reverse Soft Budget Constraint: An organizational analysis of government behavior. Chin. Soc. Sci. 2005, 2, 132–143. [Google Scholar]
  11. Poncet, S. Measuring Chinese Domestic and International Integration. China Econ. Rev. 2003, 14, 1–21. [Google Scholar] [CrossRef]
  12. Tang, J.; Qin, F. Analyzing the Impact of Local Government Competition on Green Total Factor Productivity from the Factor Market Distortion Perspective: Based on the three stage DEA model. Environ. Dev. Sustain. 2022, 1–29. [Google Scholar] [CrossRef]
  13. Mingran, W. Measurement and Spatial Statistical Analysis of Green Science and Technology Innovation Efficiency among Chinese Provinces. Environ. Ecol. Stat. 2021, 28, 423–444. [Google Scholar] [CrossRef]
  14. Yang, H.; Xu, X.; Zhang, F. Industrial Co-Agglomeration, Green Technological Innovation, and Total Factor Energy Efficiency. Environ. Sci. Pollut. Res. 2022, 1–20. [Google Scholar] [CrossRef]
  15. Zhou, J.W.; Zhang, Y.; Jiang, Z.Y. Influence of the Innovation Cluster to Green Economy Efficiency: Empirical Analysis Based on Spatial Econometric Model. Ecol. Econ. 2018, 34, 57–62. [Google Scholar]
  16. Delgado-Verde, M.; Amores-Salvadó, J.; Martín-de Castro, G.; Navas-López, J.E. Green Intellectual Capital and Environmental Product Innovation: The mediating role of green social capital. Knowl. Manag. Res. Pract. 2014, 12, 261–275. [Google Scholar] [CrossRef]
  17. Iqbal, S.; Akhtar, S.; Anwar, F.; Kayani, A.J.; Sohu, J.M.; Khan, A.S. Linking Green Innovation Performance and Green Innovative Human Resource Practices in SMEs; a moderation and mediation analysis using PLS-SEM. Curr. Psychol. 2021, 1–18. [Google Scholar] [CrossRef]
  18. Yumei, H.; Iqbal, W.; Irfan, M.; Fatima, A. The Dynamics of Public Spending on Sustainable Green Economy: Role of technological innovation and industrial structure effects. Environ. Sci. Pollut. Res. 2022, 29, 22970–22988. [Google Scholar] [CrossRef]
  19. Yang, Y.; Wu, D.; Xu, M.; Yang, M.; Zou, W. Capital Misallocation, Technological Innovation, and Green Development Efficiency: Empirical Analysis Based on China Provincial Panel Data. Environ. Sci. Pollut. Res. 2022, 1–14. [Google Scholar] [CrossRef]
  20. Cai, W.; Ye, P. Local-neighborhood Effects of Different Environmental Regulations on Green Innovation: Evidence from Prefecture Level Cities of China. Environ. Dev. Sustain. 2022, 24, 4810–4834. [Google Scholar] [CrossRef]
  21. Bucovetsky, S.; Haufler, A. Tax Competition When Firms Choose Their Organizational Form: Should Tax Loopholes for Multinationals be Closed? J. Int. Econ. 2008, 74, 188–201. [Google Scholar] [CrossRef] [Green Version]
  22. Holmstrom, B.; Milgrom, P. Multitask Principal–Agent Analyses: Incentive Contracts, Asset Ownership, and Job Design. J. Law Econ. Organ. 1991, 7, 24. [Google Scholar] [CrossRef] [Green Version]
  23. Zhang, W.; Li, G. Environmental Decentralization, Environmental Protection Investment, and Green Technology Innovation. Environ. Sci. Pollut. Res. 2022, 29, 12740–12755. [Google Scholar] [CrossRef] [PubMed]
  24. Gao, X.; Wang, S.; Ahmad, F.; Chandio, A.A.; Ahmad, M.; Xue, D. The Nexus Between Misallocation of Land Resources and Green Technological Innovation: A Novel Investigation of Chinese Cities. Clean Technol. Environ. Policy 2021, 23, 2101–2115. [Google Scholar] [CrossRef]
  25. Nie, Y.; Wan, K.; Wu, F.; Zou, W.; Chang, T. Local Government Competition, Development Zones and Urban Green Innovation: An Empirical Study of Chinese Cities. Appl. Econ. Lett. 2021, 1–6. [Google Scholar] [CrossRef]
  26. Deng, Y.; You, D.; Wang, J. Optimal Strategy for Enterprises’ Green Technology Innovation from the Perspective of Political Competition. J. Clean. Prod. 2019, 235, 930–942. [Google Scholar] [CrossRef]
  27. Zhang, N.; Deng, J.; Ahmad, F.; Draz, M.U. Local Government Competition and Regional Green Development in China: The Mediating Role of Environmental Regulation. Int. J. Environ. Res. Public Health 2020, 17, 3485. [Google Scholar] [CrossRef]
  28. Young, A. The Razor’s Edge: Distortions and Incremental Reform in the People’s Republic of China. Q. J. Econ. 2000, 115, 1091–1135. [Google Scholar] [CrossRef] [Green Version]
  29. Zhang, J.; Wang, J.; Yang, X.; Ren, S.; Ran, Q.; Hao, Y. Does Local Government Competition Aggravate Haze Pollution? A New Perspective of Factor Market Distortion. Socio-Econ. Plan. Sci. 2021, 76, 100959. [Google Scholar] [CrossRef]
  30. Krugman, P. Increasing Returns and Economic Geography. J. Political Econ. 1991, 99, 483–499. [Google Scholar] [CrossRef]
  31. Elhorst, J.P. Matlab Software for Spatial Panels. Int. Reg. Sci. Rev. 2014, 37, 389–405. [Google Scholar] [CrossRef] [Green Version]
  32. Elhorst, J.P. Applied Spatial Econometrics: Raising the Bar. Spat. Econ. Anal. 2010, 5, 9–28. [Google Scholar] [CrossRef]
  33. Xu, H.; Zhu, Z.Y.; Li, K. Business Environment Optimization, Group Preference and Technological Innovation. Econ. Rev. 2019, 6, 17–30. [Google Scholar]
  34. Lesage, J.P.; Pace, R.K. Spatial Econometric Modeling of Origin-Destination Flows. J. Reg. Sci. 2010, 48, 941–967. [Google Scholar] [CrossRef]
  35. Corrado, L.; Fingleton, B. Where is the Economics in Spatial Econometrics? J. Reg. Sci. 2012, 52, 210–239. [Google Scholar] [CrossRef] [Green Version]
  36. Aoki, S.A. Simple Accounting Framework for the Effect of Resource Misallocation on Aggregate Productivity. J. Jpn. Int. Econ. 2012, 26, 473–494. [Google Scholar] [CrossRef] [Green Version]
  37. Chari, V.V.; Kehoe, P.J.; McGrattan, E.R. Accounting for the Great Depression. Am. Econ. Rev. 2002, 92, 22–27. [Google Scholar] [CrossRef] [Green Version]
  38. Jin, L.Q.; Hu, S.C.; Zhang, B.C. Research on the Structural Mismatch Degree of Innovation Resources in China. Sci. Res. 2019, 37, 545–555. [Google Scholar]
  39. Wang, W.; Sun, Z. Measurement of R&D Resource Mismatch among Regions in China and Analysis of Influencing Factors. Financ. Trade Econ. 2020, 5, 67–83. [Google Scholar]
  40. Carvache-Franco, O.; Carvache-Franco, M.; Carvache-Franco, W.; Bustamante-Ubilla, M.A. The Relationship between Human-Capital Variables and Innovative Performance: Evidence from Colombia. Sustainability 2022, 14, 3294. [Google Scholar] [CrossRef]
  41. Bai, J.H.; Bian, Y.C. Market Distortion and Efficiency Loss of China’s Innovative Production. Chin. Ind. Econ. 2016, 11, 39–55. [Google Scholar]
  42. Hall, B.H.; Mairesse, J. Exploring the Relationship between R&D and Productivity in French Manufacturing Firms. J. Econom. 1995, 65, 263–293. [Google Scholar]
  43. Zhang, J.W.; Lin, Y.R. Local Government Competition, Capital Flow and Spatial Balance of Regional Economy. J. Yunnan Univ. Financ. Econ. 2018, 34, 23–33. [Google Scholar]
  44. Xiao, Y.; Liu, X.B. Does Tax Competition Promote the Transformation and Upgrading of Industrial Structures? —Based on the Dual Perspective of Total Amount and Structure. Financ. Res. 2018, 5, 60–74. [Google Scholar]
  45. Zhang, K.L.; Liu, Q.J. Household Registration System Competition and Its Economic Development Effect—An Empirical Test Based on Dynamic Spatial Durbin Model. J. Zhongnan Univ. Econ. Law 2019, 4, 78–88. [Google Scholar]
  46. Adikari, A.; Liu, H.; Marasinghe, M. Inward Foreign Direct Investment-Induced Technological Innovation in Sri Lanka? Empirical Evidence Using ARDL Approach. Sustainability 2021, 13, 7334. [Google Scholar] [CrossRef]
  47. Lee, L.F. Asymptotic Distributions of Quasi-Maximum Likelihood Estimators for Spatial Autoregressive Models. Econometrica 2004, 72, 1899–1925. [Google Scholar] [CrossRef]
  48. Deng, Y.; You, D.; Wang, J. Research on the Nonlinear Mechanism Underlying the Effect of Tax Competition on Green Technology Innovation-An Analysis Based on the Dynamic Spatial Durbin Model and the Threshold Panel Model. Resour. Policy 2022, 76, 102545. [Google Scholar] [CrossRef]
  49. Nakada, M. Environmental Tax Reform and Growth: Income Tax Cuts or Profits Tax Reduction. Environ. Resour. Econ. 2010, 47, 549–565. [Google Scholar] [CrossRef]
  50. Deng, J.; Zhang, N.; Ahmad, F.; Draz, M.U. Local Government Competition, Environmental Regulation Intensity and Regional Innovation Performance: An Empirical Investigation of Chinese Provinces. Int. J. Environ. Res. Public Health 2019, 16, 2130. [Google Scholar] [CrossRef] [PubMed] [Green Version]
  51. Li, M.; Zhang, L. Entrepreneurial Urban Governance and Talent Policy: The Case of Shanghai. China Popul. Dev. Stud. 2020, 4, 25–44. [Google Scholar] [CrossRef]
  52. Zhao, T.; Zhou, H.; Jiang, J.; Yan, W. Impact of Green Finance and Environmental Regulations on the Green Innovation Efficiency in China. Sustainability 2022, 14, 3026. [Google Scholar] [CrossRef]
  53. Ruan, J.Y. An Empirical Study on the Efficiency of Green Innovation of Industrial Enterprises in China. In Proceedings of the 14th International Conference on Innovation and Management, Tokyo, Japan, 7–10 February 2017; pp. 554–559. [Google Scholar]
  54. Yin, J.H.; Wang, S.; Gong, L.D. The Effects of Factor Market Distortion and Technical Innovation on China’s Electricity Consumption. J. Clean. Prod. 2018, 188, 195–202. [Google Scholar] [CrossRef]
Figure 1. China’s Innovation Factor Input and Green Innovation Efficiency during 2000–2020. Note: Figure 1 is derived according to the authors’ calculation by taking innovation talents and innovation capital as input variables and green innovation patents as output variables. This paper calculates green total factor productivity from 2000 to 2020 through the DEA-SBM model, which can adequately measure the relative efficiency of green innovation. The data were obtained from the China Statistical Yearbook, the CSMAR database, and the CNRDS database.
Sustainability 14 08338 g001
Figure 2. Empirical Analysis Process.
Sustainability 14 08338 g002
Figure 3. Regional differences in innovation talent mismatch and green efficiency loss caused by local government competition.
Sustainability 14 08338 g003
Figure 4. Provincial differences in innovation capital mismatch and green efficiency loss caused by local government competition.
Sustainability 14 08338 g004
Figure 5. The trend of efficiency loss caused by the mismatch of innovative talents due to local government competition.
Sustainability 14 08338 g005
Figure 6. The trend of efficiency loss caused by innovation capital mismatch caused by local government competition.
Sustainability 14 08338 g006
Figure 7. The trend of efficiency loss caused by a mismatch of innovative talents caused by local government local competition.
Sustainability 14 08338 g007
Figure 8. The trend of efficiency loss caused by innovation capital mismatch caused by local government competition.
Sustainability 14 08338 g008
Figure 9. The local government competition in various regions leads to the efficiency loss due to innovative talent mismatch.
Sustainability 14 08338 g009
Figure 10. Mismatch of innovation capital in different regions leads to efficiency loss.
Sustainability 14 08338 g010
Figure 11. Dynamics of green innovation efficiency loss caused by expenditure competition. (a) Nationwide. (b) East. (c) Central. (d) West. (e) Northeast.
Sustainability 14 08338 g011
Figure 12. Dynamics of Green Innovation Efficiency Loss Caused by Tax Competition. (a) Nationwide. (b) East. (c) Central. (d) West. (e) Northeast.
Sustainability 14 08338 g012
Figure 13. Dynamics of Green innovation efficiency loss caused by institutional competition. (a) Nationwide. (b) East. (c) Central. (d) West. (e) Northeast.
Sustainability 14 08338 g013
Table 1. Morans’ I test results of the allocation of innovative elements.
Year2000200120022003200420052006
μ H i t 0.118 **
(1.702)
−0.007
(0.335)
0.087 *
(1.34)
0.083 **
(1.96)
0.204 ***
(2.945)
0.083 ***
(2.67)
0.144 **
(2.124)
μ R i t −0.017
(0.201)
−0.067
(−0.385)
−0.072
(−0.428)
−0.061
(−0.349)
0.035
(0.781)
−0.003
(0.558)
0.056
(1.045)
Year2007200820092010201120122013
μ H i t 0.181 **
(2.3)
0.168 **
(2.12)
0.144 **
(2.12)
0.244 ***
(3.13)
0.138 **
(2.08)
0.133 **
(1.862)
0.068
(1.19)
μ R i t 0.160 **
(2.109)
0.164 **
(2.100)
0.056
(1.045)
0.241 ***
(3.03)
0.150 **
(2.226)
0.133 **
(1.89)
0.118 **
(1.68)
Year2014201520162017201820192020
μ H i t 0.111 **
(1.69)
0.045
(0.91)0.905
0.079 *
(1.31)
0.08
(1.26)
0.22 ***
(2.73)
0.204 ***
(2.51)
0.158 **
(2.04)
μ R i t 0.084 *
(1.35)
0.140 **
(1.87)
0.135 **
(1.82)
0.104 *
(1.47)
0.132 **
(1.75)
0.121 *
(1.63)
0.109 *
(1.52)
Note: *, **, *** Significance at 10 percent, 5 percent, 1 percent level, “ () ” inside is the z value. Source: Researcher’s calculation using Matlab.
Table 2. Estimated results of the effect of local government competition on the mismatch of innovation elements.
ExcomTaxcomInscom X c o n t r o l ρ LMerrLMlagR2IndividualTime
μ H i t 1.494 ***
(4.056)
0.154 ***
(3.321)
0.903 **
(2.481)
Y0.377 ***
(6.306)
[0.345][0.009]0.2797NY
μ R i t 0.899 ***
(2.596)
0.123 ***
(2.791)
0.906 ***
(2.595)
Y0.361 ***
(6.027)
[0.343][0.023]0.1286NY
Note: ** represents the significance level of 5% and *** represents the significance level of 1%, ”()” inside is the t value and ”[]” inside is the p value. Source: Researcher’s calculation using Matlab.
Table 3. Decomposition results of mismatch effect of innovation factors influenced by local government competition.
Direct EffectIndirect EffectTotal Effect
Effect Category Variable μ H i t μ R i t μ H i t μ R i t μ H i t μ R i t
excom1.549 ***
(4.015)
0.935 **
(2.571)
0.872 ***
(3.083)
0.491 **
(2.219)
2.421 ***
(3.984)
1.426 **
(2.558)
taxcom0.157 ***
(3.429)
0.125 ***
(2.875)
0.088 ***
(2.697)
0.066 **
(2.366)
0.245 ***
(3.354)
0.190 ***
(2.828)
inscom0.959 ***
(2.655)
0.958 ***
(2.774)
0.544 **
(2.274)
0.505 **
(2.396)
1.503 ***
(2.612)
1.464 ***
(2.757)
Note: ** represents the significance level of 5% and *** represents the significance level of 1%, “ ()” inside is the t value. Source: Researcher’s calculation using Matlab.
Table 4. Average value (%) of green innovation efficiency loss caused by factor mismatch due to local government competition in different provinces.
ProvinceInnovative TalentsInnovation Capital
ExcomeTaxcomInscomExcomeTaxcomInscom
Beijing0.5990.3120.605−0.239−0.209−0.370
Tianjin0.0440.0330.033−0.022−0.038−0.037
Hebei−0.005−0.0080.0010.0240.1270.000
Shanxi−0.029−0.029−0.0020.0460.1250.005
Inner Mongolia−0.009−0.017−0.0010.0730.1850.010
Liaoning0.0720.1260.0040.0330.125−0.002
Jilin−0.030−0.045−0.0010.0010.0160.001
Heilongjiang−0.021−0.0300.0000.1410.3920.019
Shanghai0.3070.1810.351−0.151−0.106−0.257
Jiangsu0.0290.0420.0080.0650.1220.020
Zhejiang0.2000.4110.1010.5561.2150.505
Anhui−0.006−0.031−0.0010.1060.117−0.073
Fujian−0.012−0.032−0.0040.0570.1410.013
Jiangxi−0.027−0.0480.0040.0190.027−0.005
Shandong0.0710.2590.0010.0020.1800.001
Henan−0.052−0.1280.0290.0940.383−0.052
Hubei−0.059−0.1270.014−0.019−0.0090.003
Hunan−0.0080.0150.0070.1240.517−0.016
Guangdong0.0850.2070.0760.1330.2620.181
Guangxi0.0000.0000.0050.0990.226−0.014
Hainan0.0120.0100.0010.0480.0450.004
Chongqing0.0730.073−0.0270.2040.383−0.149
Sichuan0.013−0.052−0.008−0.028−0.1190.007
Guizhou0.0070.002−0.0050.1430.119−0.071
Yunnan0.0140.0090.0010.2260.2270.029
Shaanxi0.0110.0240.005−0.106−0.183−0.019
Gansu−0.052−0.0610.001−0.001−0.0060.001
Qinghai−0.128−0.0810.0080.0280.020−0.002
Ningxia−0.008−0.007−0.0010.0480.0480.009
Xinjiang0.0360.0250.0010.2800.433−0.001
Publisher’s Note: MDPI stays neutral with regard to jurisdictional claims in published maps and institutional affiliations.

