Article

A Study on the Reasons for No Soil Liquefaction Occurring in the Lanyang Plain in a Strong Earthquake Area

1
Department of Civil and Construction Engineering, National Taiwan University of Science and Technology, Taipei 10607, Taiwan
2
Department of Civil Engineering, National Ilan University, Ilan 26047, Taiwan
3
Central Geological Survey, Ministry of Economic Affairs MOEA, New Taipei City 23568, Taiwan
*
Author to whom correspondence should be addressed.
Sustainability 2022, 14(14), 8244; https://doi.org/10.3390/su14148244
Submission received: 13 May 2022 / Revised: 17 June 2022 / Accepted: 19 June 2022 / Published: 6 July 2022

Abstract

:
The Lanyang Plain is prone to earthquakes of magnitude 5 or higher. The Central Geological Survey’s soil liquefaction potential map of Yilan County shows that more than 69% of the plain area has high liquefaction potential: but why have there not been any liquefaction cases in the past 23 years? Based on the results of the groundwater pumping test, geological history, and the soil liquefaction analysis method, this study aimed to explore and analyze the causes of no liquefaction occurring in the Yilan region. To understand the permeability of the overall stratum structure of the Lanyang Plain and the spring phenomenon, the relationship between groundwater well-pumping test results and the permeability coefficient experience formulas was first studied. Then the Chapuis’ experience formula of the K value multiplied by 10 was recommended herein such that the permeability coefficient K values of the Lanyang plain could be estimated with large numbers. The reasons for the absence of liquefaction cases in Lanyang plain were then investigated. It was found that less serious earthquakes occurred and combined with the extremely ideal permeable soil conditions existing in the Lanyang plain, this led to no catastrophic liquefaction cases occurring over the last 23 years.

1. Introduction

Taiwan is located on the western side of the Pacific Rim seismic zone and at the junction of the Eurasian Plate and the Philippine Sea plate, and there are 39 officially designated active faults in Taiwan. The geological age of Taiwan is relatively young, and most of the plains belong to the recent alluvial layer, and sandy and powdery soils are the main types of soils, so soil liquefaction is more likely to occur. The Lanyang plain in this study belongs to the alluvial fan plain, where the geology is mainly sand and gravel, the groundwater level is high, and there are even numerous fountains in many places. Therefore, the liquefaction phenomenon should occur frequently. The high, moderate, and low liquefaction potential are accounted for respectively 69%, 21%, and 10% for the Lanyang plain by the official edition of the Central Geological Survey, according to the number of drilling holes [1]. For only Yilan city, these liquefaction potential accounts for 78%, 16%, and 6% respectively. However, no liquefaction has occurred in Yilan urban area in recent years, so it is not surprising that people are suspicious of the official report.
In this study, we use the liquefaction assessment method of Seed et al. (1985) [2] and Ishihara (1985) [3]. They were recommended by one author of this article [4,5] to evaluate the soil liquefaction potential in the Yilan area. The special geological conditions and permeability values of Yilan area were studied and used to interpret the real soil liquefaction potential in the Yilan area.

2. Geological History of the Lanyang Plain

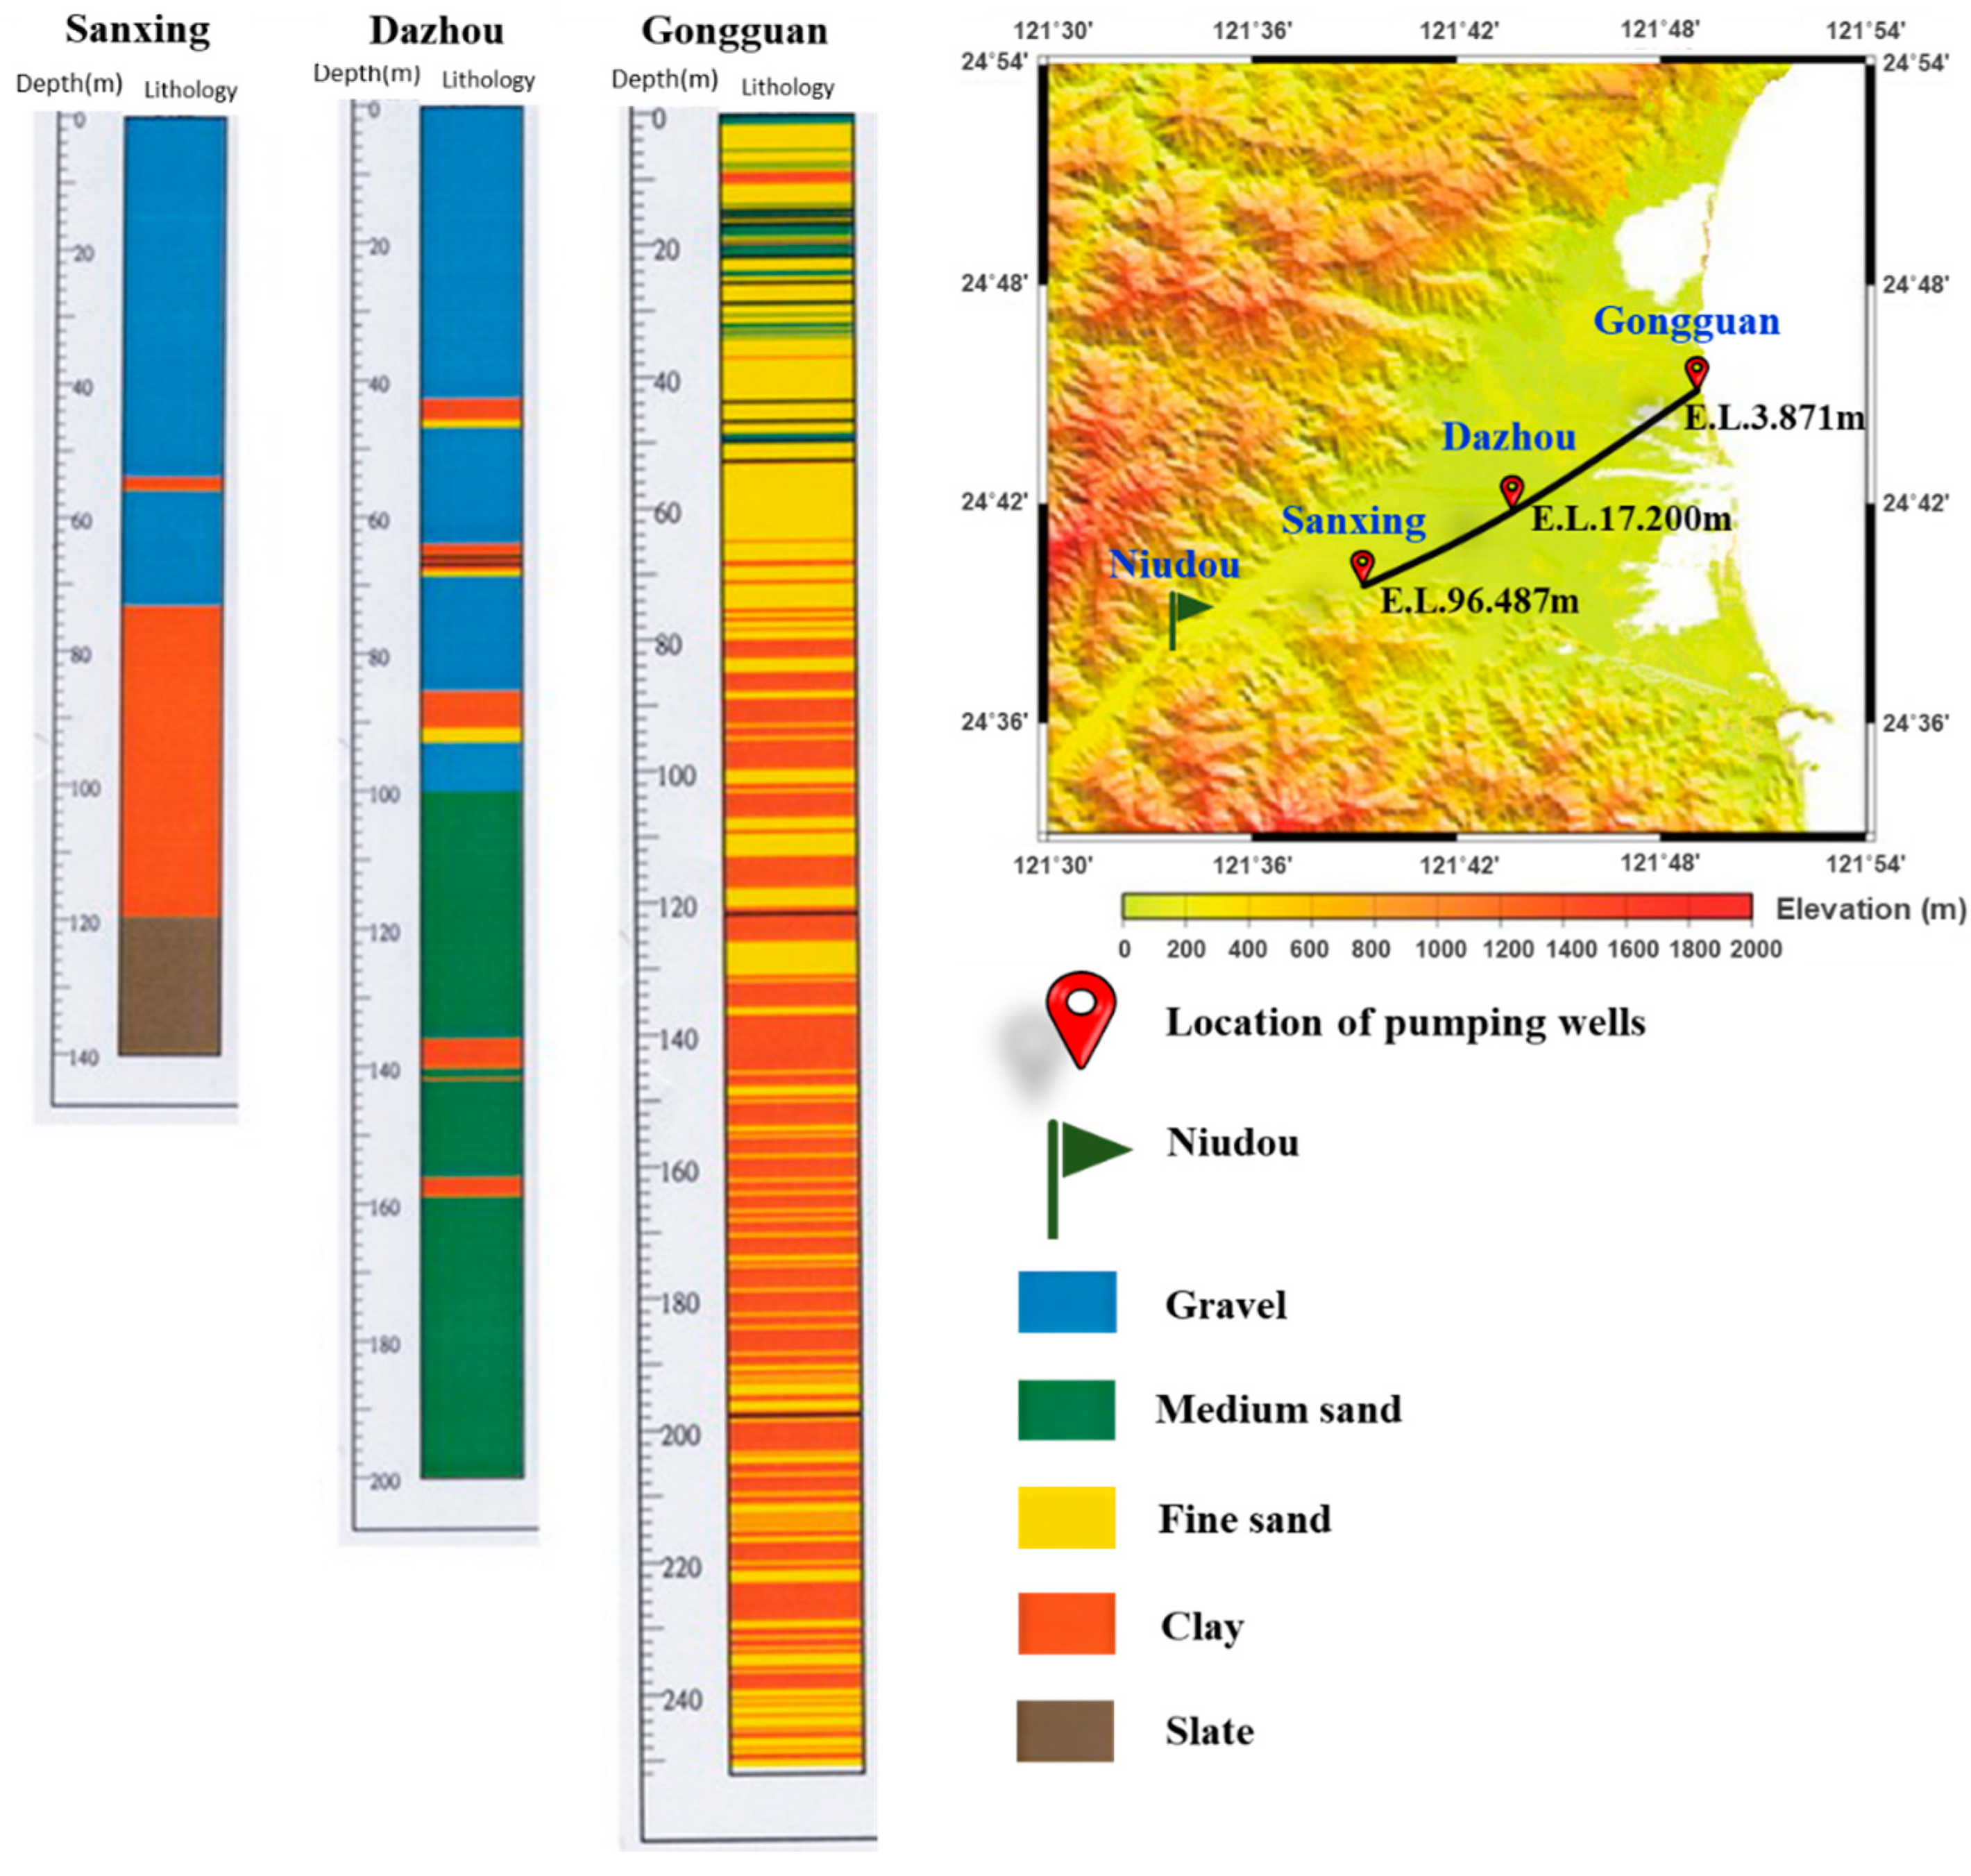
In the past ten years or so, the Water Resources Department Agency, MOEA has drilled more than 20 wells in the plain area to observe changes in the groundwater level in the Lanyang Plain. The depth of the wells is about 50–250 m. According to the drilling data of these wells, the sediments in the west of the plain are mainly gravel and sand, and the sediments in the east are mainly fine sand, silt, and mud [6]. On the west side of the plain it is mostly dry land because it contains more sand and gravel, and the water is not easily retained in the soil. The drilling data also found that, except for the water wells near the mountainside, no rock base had been drilled. It can be seen that the thickness of the sediments in the plain must be hundreds of meters or more [7].
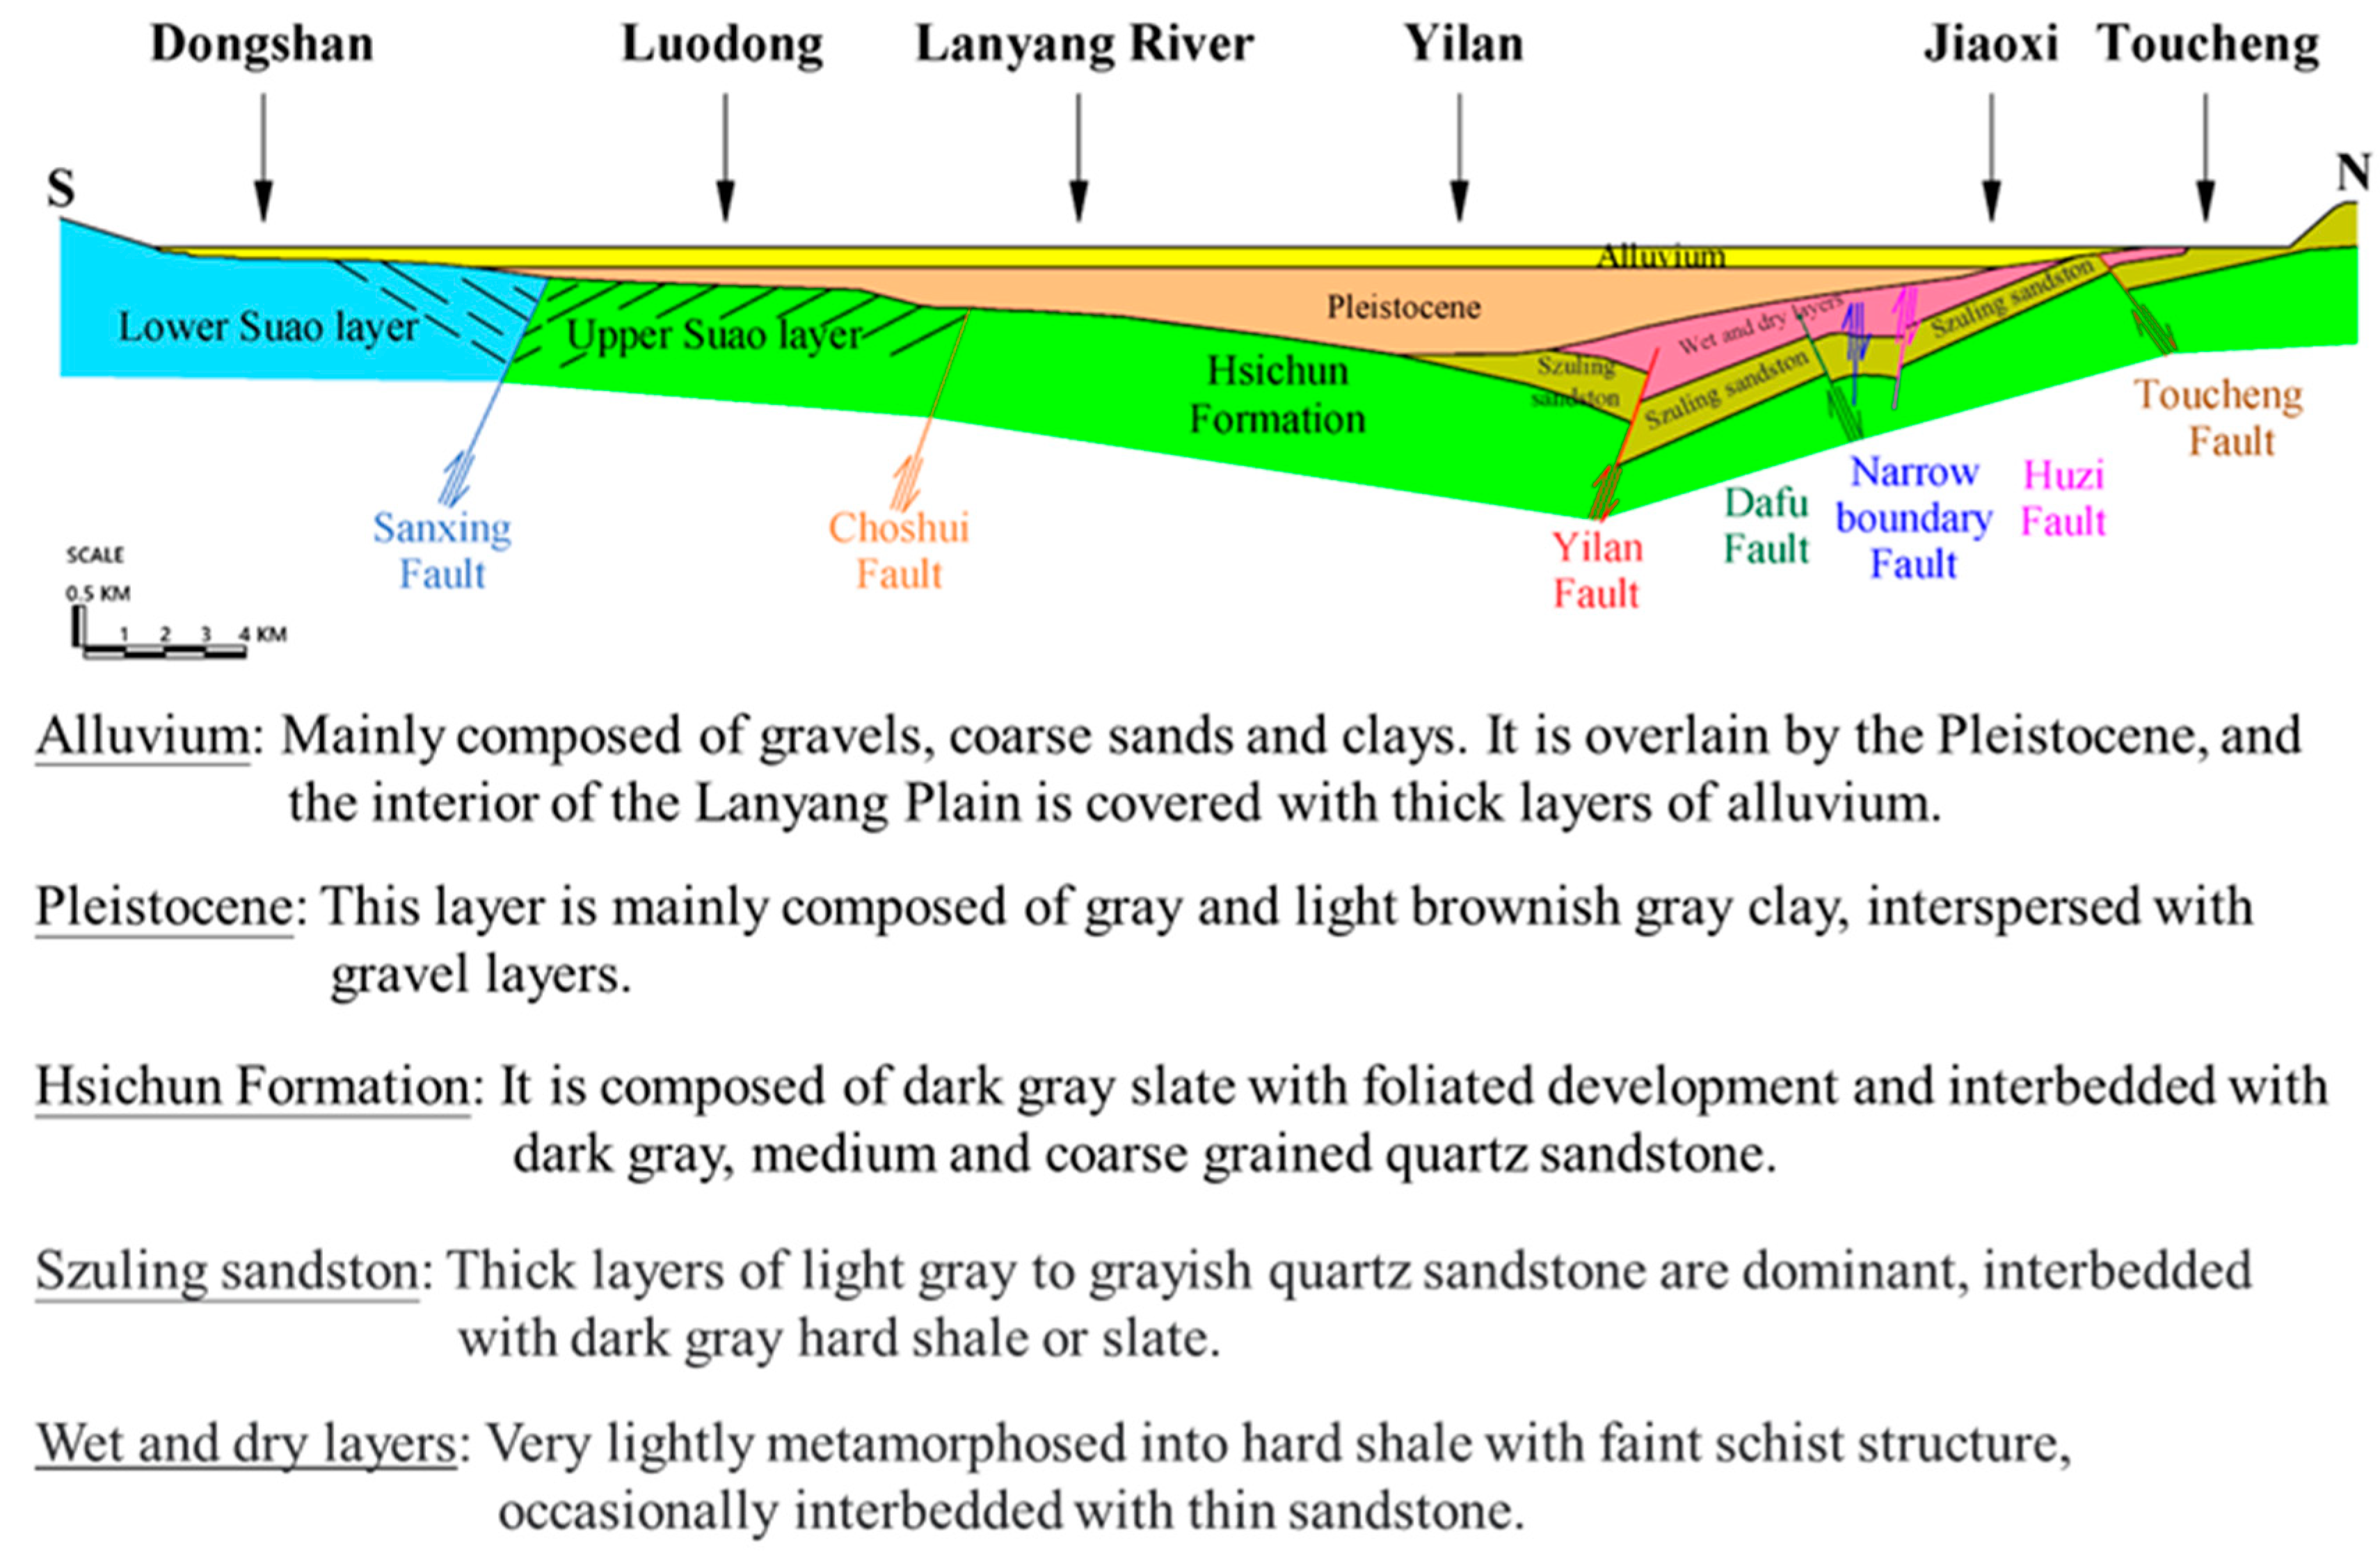
The thickness of subsurface sediments on the Lanyang Plain was mapped by the seismic line survey conducted in 1976 for underground oil exploration (See Figure 1). From the subsurface structures depicted in the north–south seismic section, we find that the thickness of sediments on the Lanyang Plain is the thickest in the center of the plain, about 1600 m or more, and gradually thins to the north, west, and south until it is extinct (see Figure 2). It is in a dustpan shape with an opening toward the Pacific Ocean [8].
The Lanyang plain main welling spring belt in Figure 3 in the purple north and south belt area is a famous welling spring scenic area and distributes roughly in the elevation 7–15 m area [10]. Examples are the crab bubbling pool in the canal of Yuansan Township, Arancheng swimming pool of Yuansan Township, Longtan swimming pool of Jiaoxi Township, the pine tree gate, and Longmu well in the winter mountain area, etc.
Chiang [10] deduced: “When the Lanyang River enters the plain from the mountainous area near Niudou, the slope of the terrain becomes slower, the river surface gradually widens, and the flow velocity of the river decreases, so the gravel carried in the river begins to accumulate. Downstream of the river, the accumulated sediments became finer and finer, and finally only sand and mud are left over there (see Figure 4)”. Together with the alluvial fans formed by other smaller rivers at their mouths, there are 17 alluvial fans of various sizes in the entire Yilan Plain. The common feature is that the gravel accumulation becomes finer and finer from upstream to downstream.

3. Soil Permeability Coefficient

We can conclude. according to the analysis principle and technique, that the evaluation methods of the soil permeability coefficient can be divided into (1) indoor test, (2) field test, and (3) empirical formula.
Hsu and Lee’s [11] analyzed and compared the pumping test results of eight groups of in situ groundwater pumping tests in Taiwan with seven empirical formulas for permeability coefficients. They obtained the permeability coefficient (K value) estimated by the empirical formula (see Equation (1)) of Chapuis [12] and then multiplied by 10, which is the approximate K value of the on-site pumping test in Taiwan.
Chapuis experience formula:
K   = 2.4622 [ ( D 10 ) 2 e 3 ( 1 + e ) ] 0.7825
The permeability coefficient data in Hsu and Lee’s [11] Table 1 and Table 2 were reorganized in Table 1 in this study to review their conclusion. It is obvious again that K values obtained from the Chapuis (2004) empirical formula [12] provide almost ten times the values compared to those from on-site pumping tests. Therefore, Chapuis’s formula was used to calculate the K-values of boreholes with only general physical test results in the Lanyang plain, and then a comprehensive analysis of the permeability of each stratum was enabled in this study.
The permeability coefficients of various soils compiled by DAS [13] are shown in Table 2. Comparing permeability coefficients in Table 1 and Table 2, they are all in the adequate range of medium and fine sand. Thus, a comprehensive analysis of the permeability of each stratum in the Lanyang plain is practicable.

4. Permeability Analysis of the Lanyang Plain

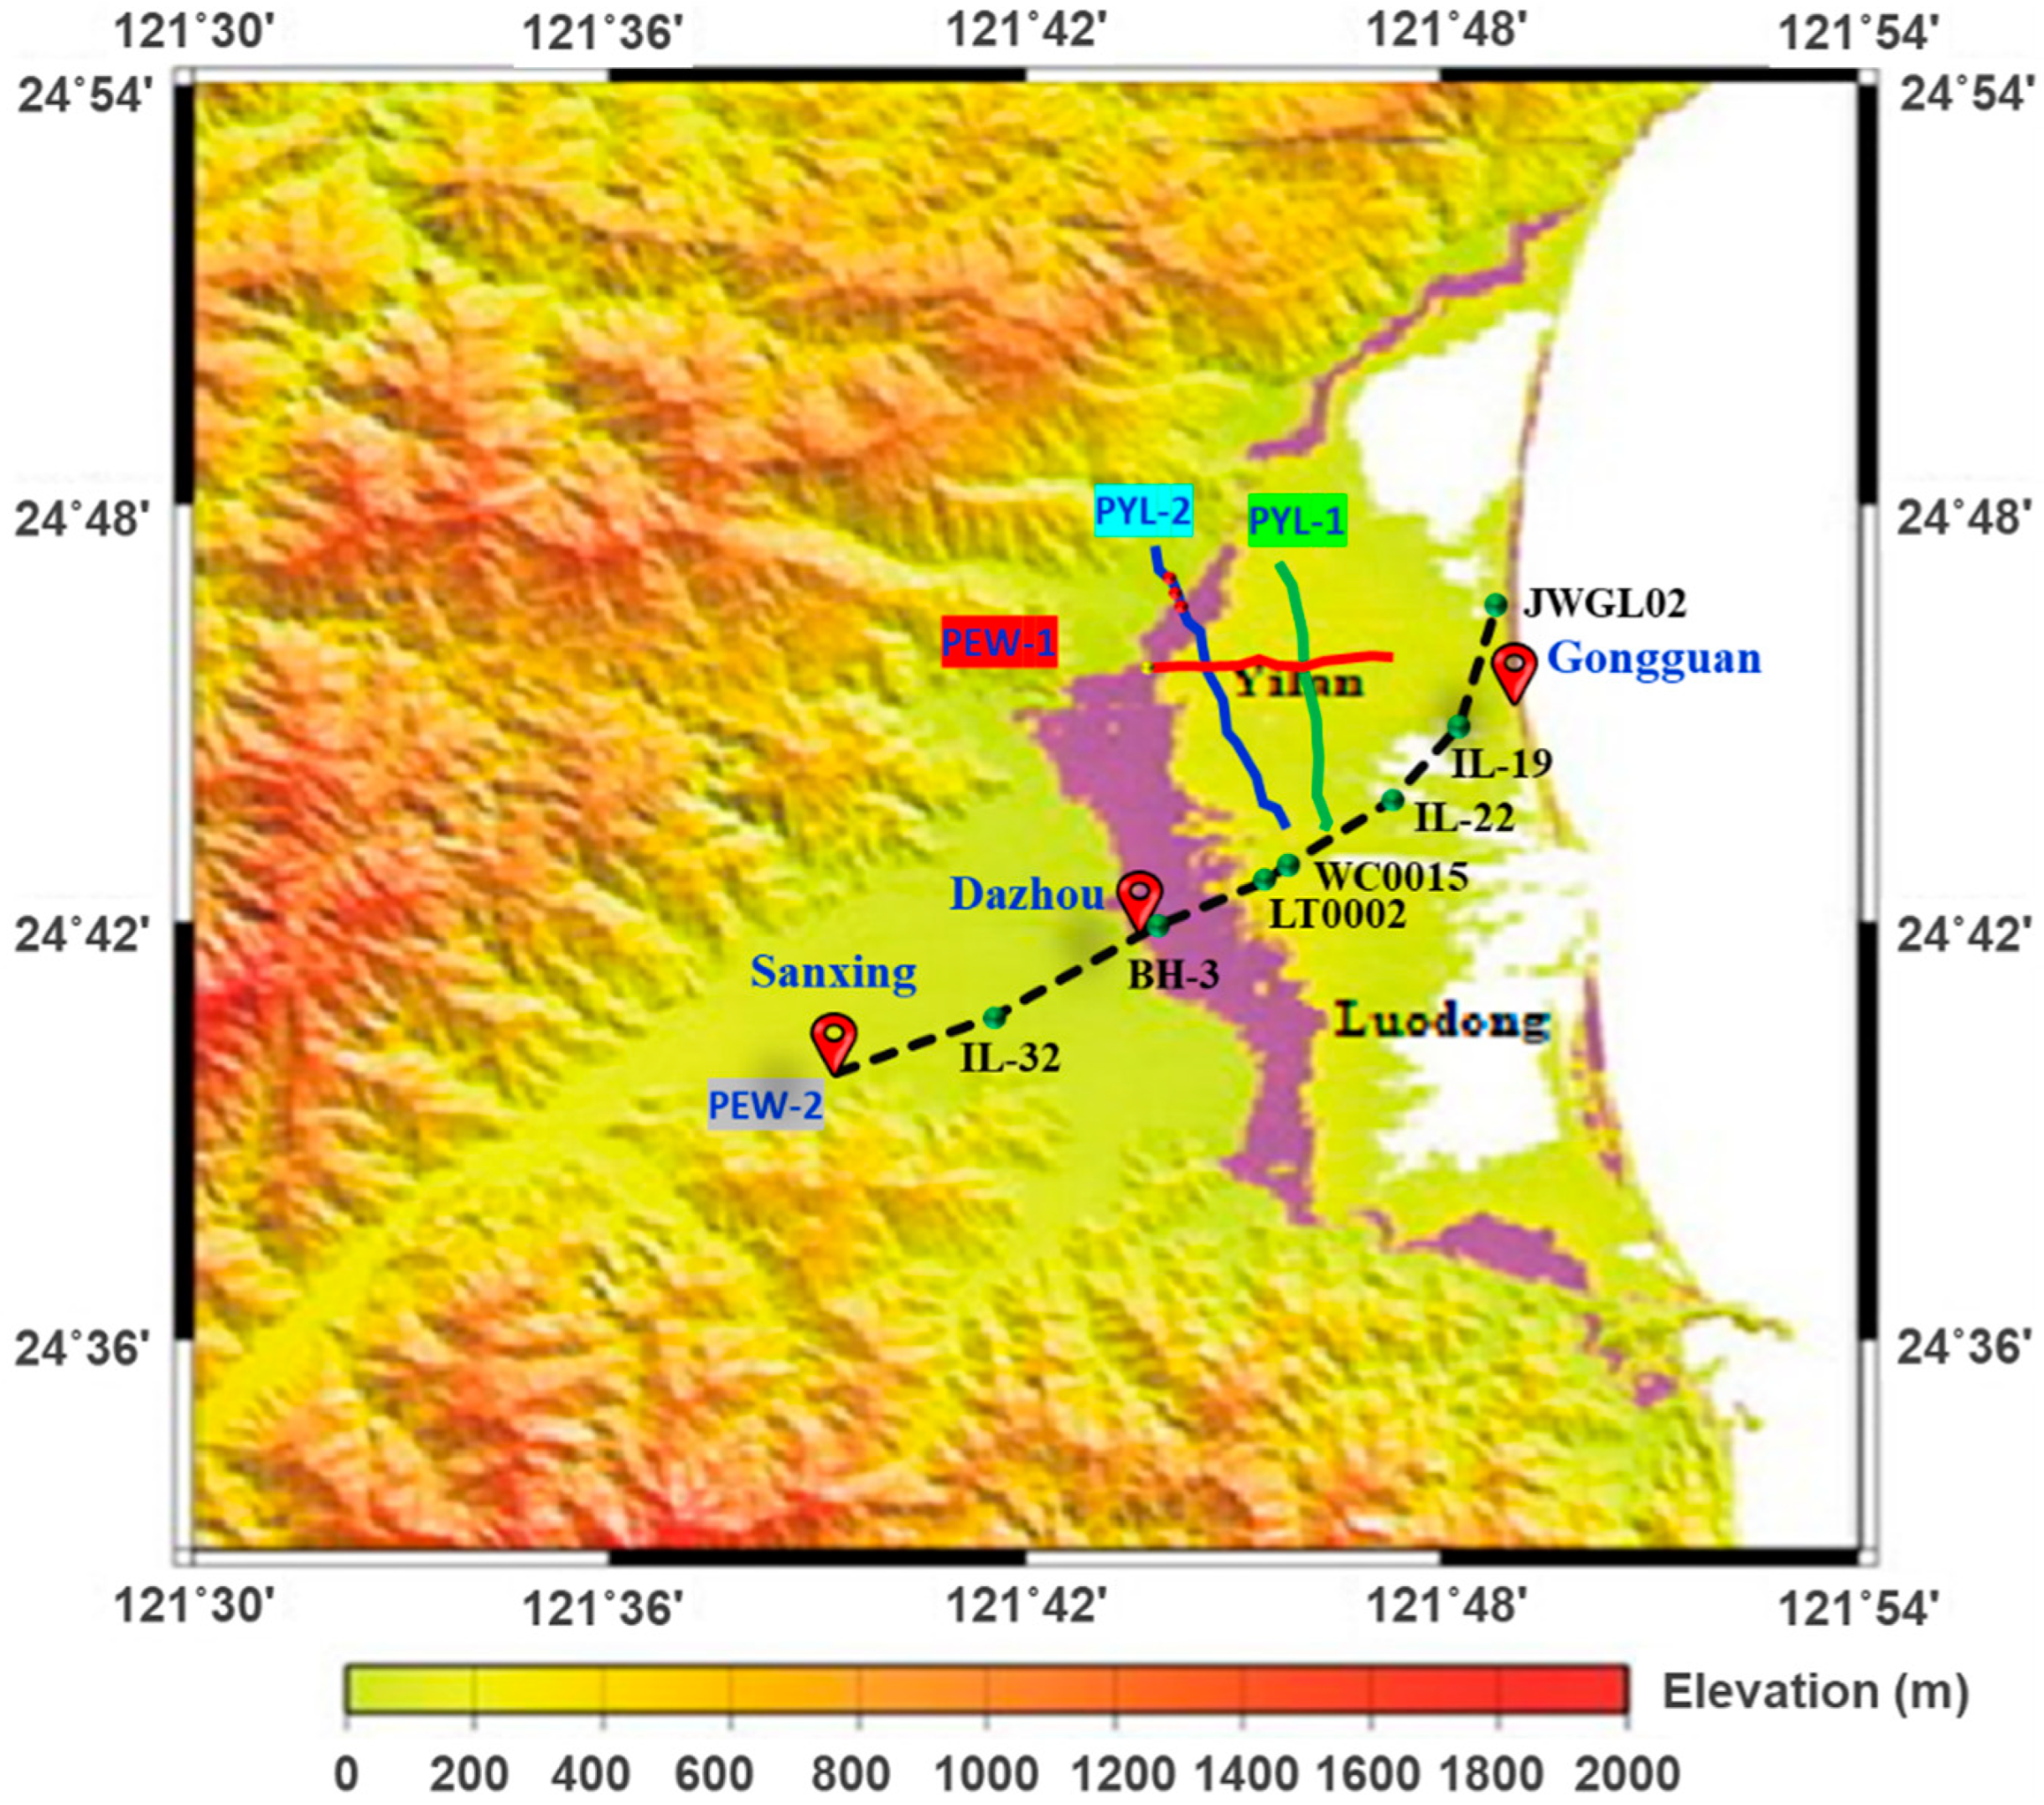
This study takes the soil liquefaction problem as the main research focus; 659 Geological engineering drilling data are distributed in the plains east of Dazhou groundwater level measurement station. On average, four boreholes were arranged in every one square thousand meters. Yilan urban part has 218 boreholes, so the process was as follows. Draw three Geological engineering profile lines PYL-1, PYL-2, and PEW-1. “P” refers to profile, “YL” refers to Yilan, and “EW” refers to east and west. Then overlay the data of the three wells in Figure 4 and Figure 5, to obtain the profile line PEW-2. The borehole IL32, adopted from the website of Central Geological Survey [14], is located in the west area, drilling depth 30 m, and the lithology is gray conglomerate. So, it is consistent with the geological conditions between the Sanxing borehole and Dazhou borehole. Figure 6, Figure 7, Figure 8 and Figure 9 are the profiles of PEW-1, PEW-2, and PYL-1, PYL-2. The profile line PEW-2 is the intersection of the study boreholes and the three wells in Figure 3. (Figure 6, Figure 7, Figure 8 and Figure 9 data from [1,14]).
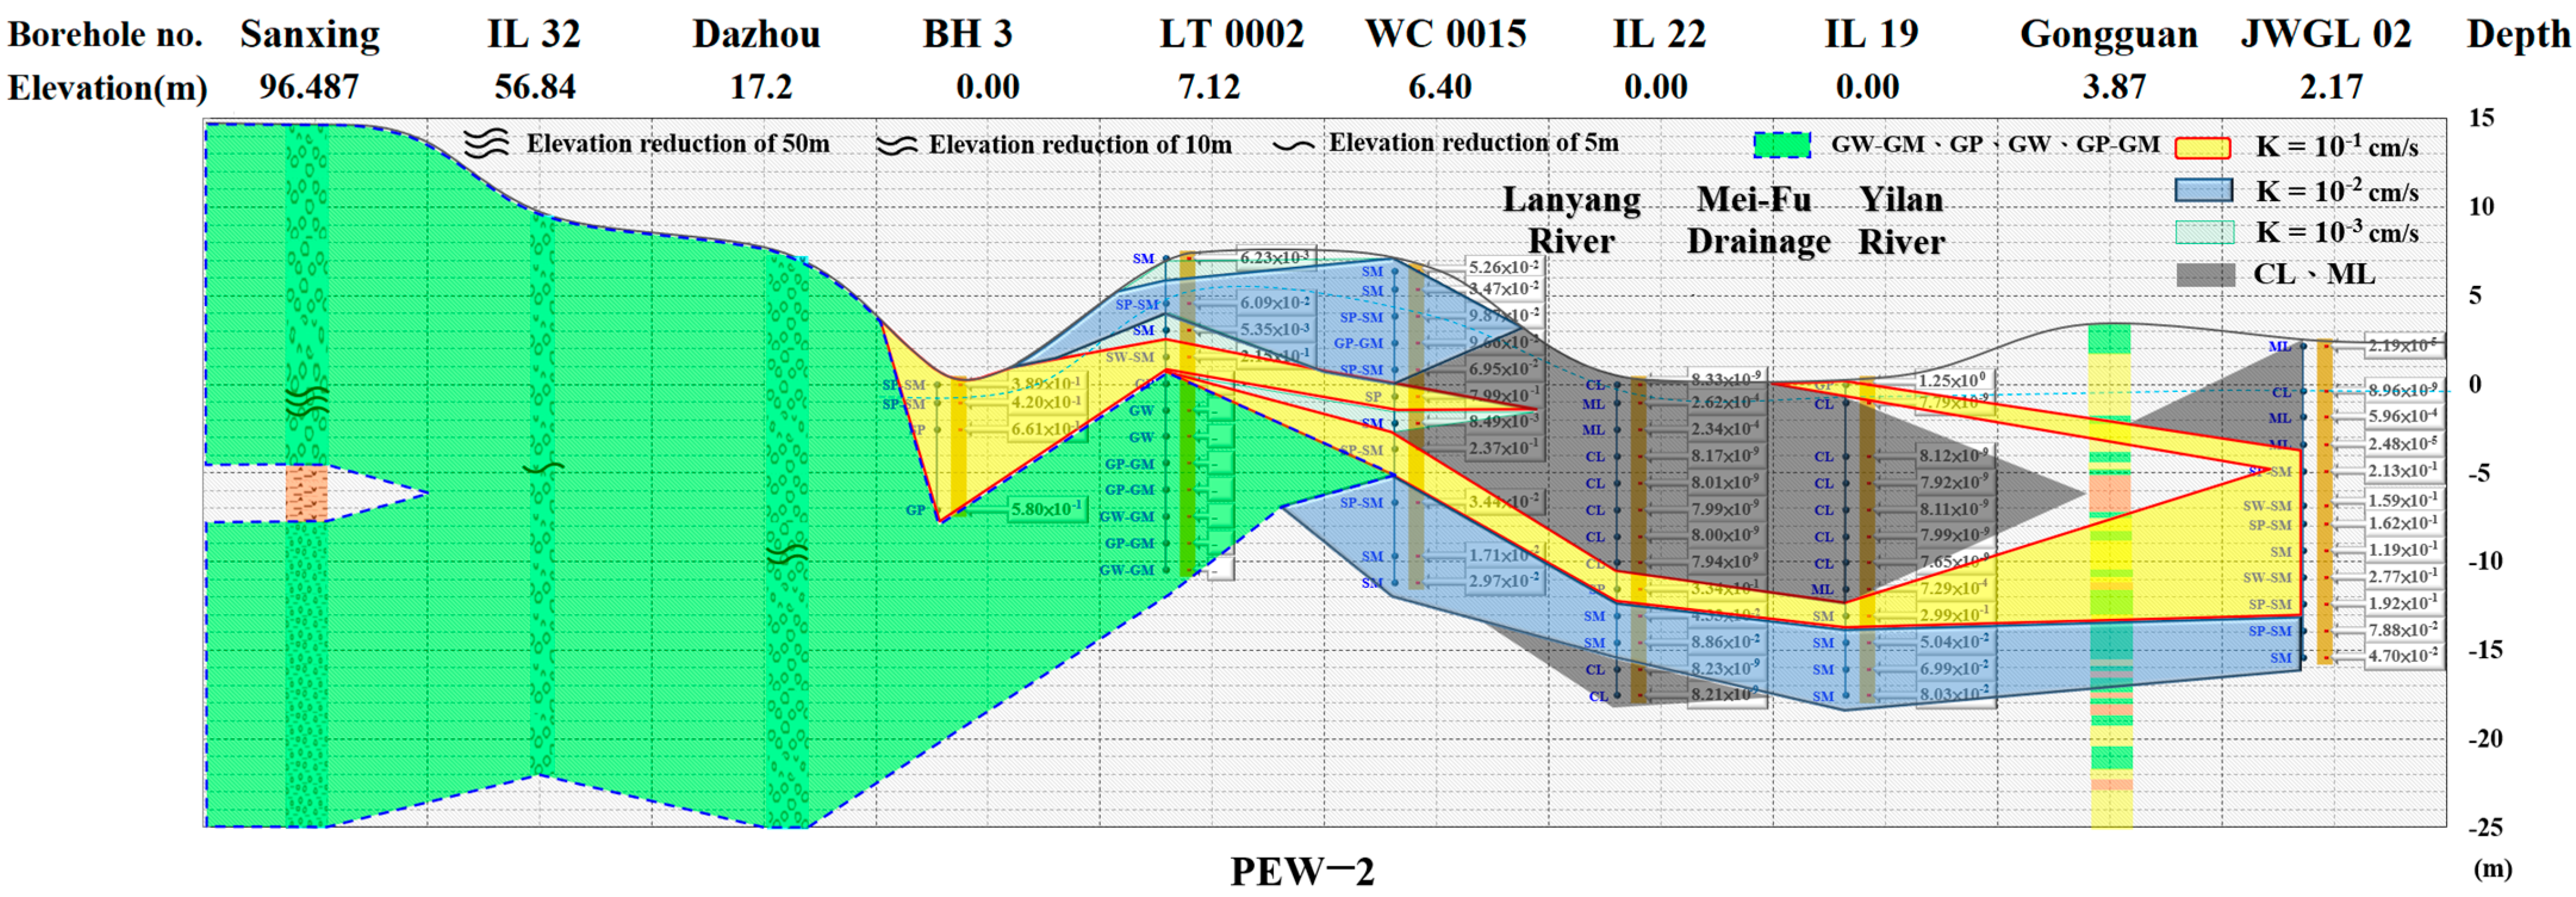
The Gongguan well in the east side in Figure 7 is dominated by medium sand (green) and fine sand (yellow), and slight sediment (light red). The borehole JWGL02 on the downstream side of this study is consistent with this well, but the geological conditions of the borehole IL19 on the upstream side are different.
On the whole, the geological condition of the direction from the west to the upstream of the Dazhou borehole is just like the research description of Chiang [10]. The lithology is a gray conglomerate, the permeability is excellent, and the mountain spring of the upstream of Lanyang stream is revealed in the brown area of the north–south direction in Figure 5. The north–south direction welling spring area is represented by the Dazhou borehole with thickness of about 300 m. Following the geological engineering borehole data of this study, the stratigraphy and geological content of the PEW-2 section from west to east are explained in four sections.
The first section: the Sanxing drill hole to the west of the Dazhou drill hole between, gray gravel, permeability is good, natural welling spring appears.
The second section: between the east of the Dazhou borehole and the borehole WC0015, the ground below can be divided into three strata:
  • 0–5 m, the permeability coefficient is about K = 1 × 10⁻² cm/s, SM/SP-SM, medium sand, or coarse sand layer.
  • 5–7 or 10 m, the permeability coefficient is about K = 1 × 10⁻¹ cm/s, SP/SP-SM, coarse sand layer with excellent water permeability.
  • 7 or 10 m below, gray gravel layer with excellent water permeability, or medium sand or coarse sand layer like the first layer.
The third section: between the east of drilling WC0015 and the west of the Dazhou drilling, the ground below can also be slightly divided into three strata:
  • 0 m to 12 m, the permeability coefficient is about 1 × 10⁻⁹ cm/s, unify soil classification as CL/ML, poorly permeable sediment or clay layer.
  • 12 m to 14 m, the permeability coefficient is about K = 1 × 10⁻¹ cm/s, unify soil classification as SP/SM, coarse sand layer with excellent permeability.
  • 14 m to 20 m, the permeability coefficient is about K = 1 × 10⁻² cm/s, unify soil classification as SP/SM, medium sand, or coarse sand layer.
The fourth section: between the borehole of the Gongguan and the coast, the ground below can also be slightly divided into three strata.
  • 0 m to 7 m, the permeability coefficient is about 1 × 10⁻⁹ cm/s, unify soil classification as CL/ML, poorly permeable sediment or clay layer.
  • 7 m to 16 m, the permeability coefficient is about K = 1 × 10⁻¹ cm/s, SP-SM/SM, coarse sand layer with excellent water permeability.
  • 16 m to 20 m, the permeability coefficient is about K = 1 × 10⁻² cm/s, unify soil classification as SM/SP-SM, medium sand, or coarse sand layer.
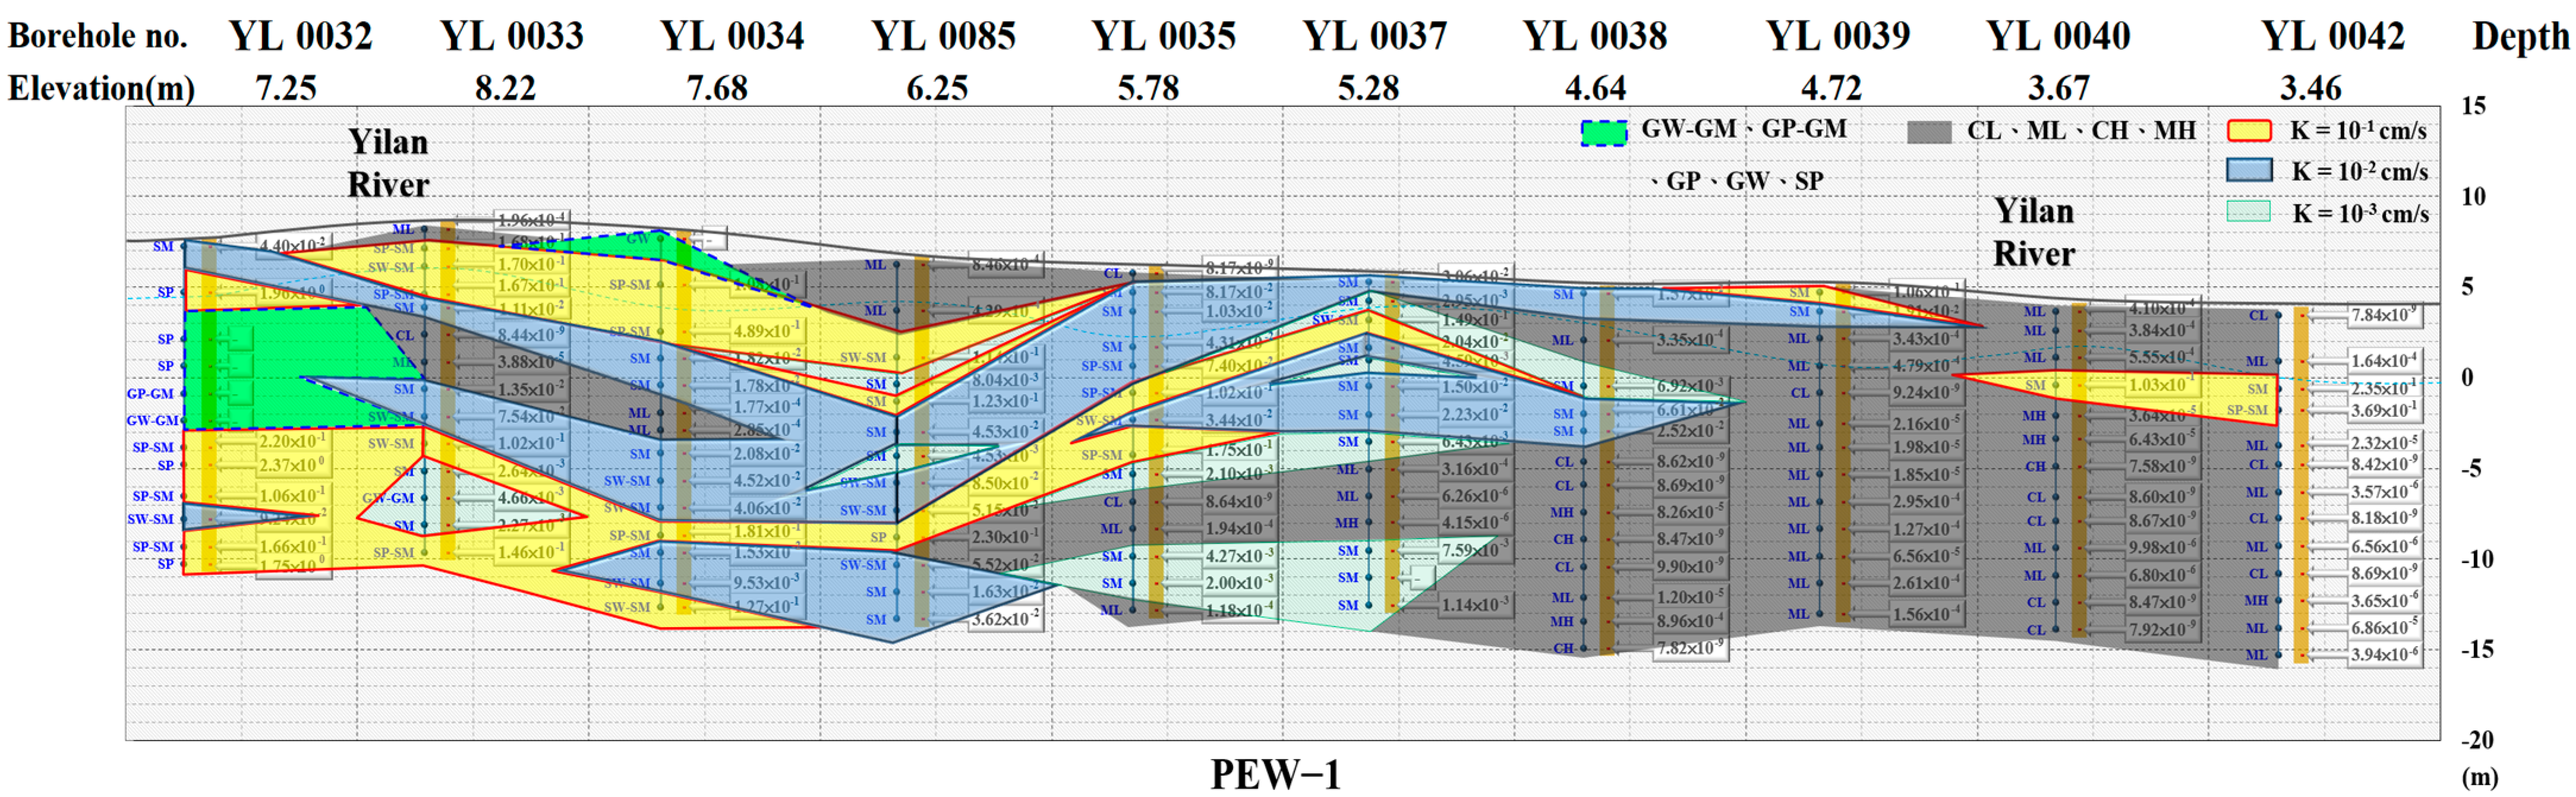
PEW-1 section is from welling spring area and is eastward of the Pacific Ocean. The stratum and geological conditions are similar to the profile PEW-2 from the second section to the fourth section. Therefore, it is divided into three sections for explanation.
The first section: (borehole YL0032-YL0085), has a double layer with excellent permeability coarse sand layer, the unified soil classification belongs to SP-SM/SW-SM, and the permeability coefficient is better than 1 × 10⁻¹ cm/s.
The second section: (borehole YL0085-YL0038), with a double layer of medium or coarse sand with good permeability and a unified soil classification of SM/SW-SM, with a permeability coefficient of about K = 1 × 10⁻² cm/s.
The third section: (borehole YL0038-YL0042), permeability poor, sink mud or clay layer as the main, unified soil classification belongs to CL/ML, permeability coefficient about K = 1 × 10⁻⁹ cm/s, depth 6 m to 9 m also has a layer about 3 m middle sand or coarse sand layer, unified soil classification belongs to SM/SP-SM.
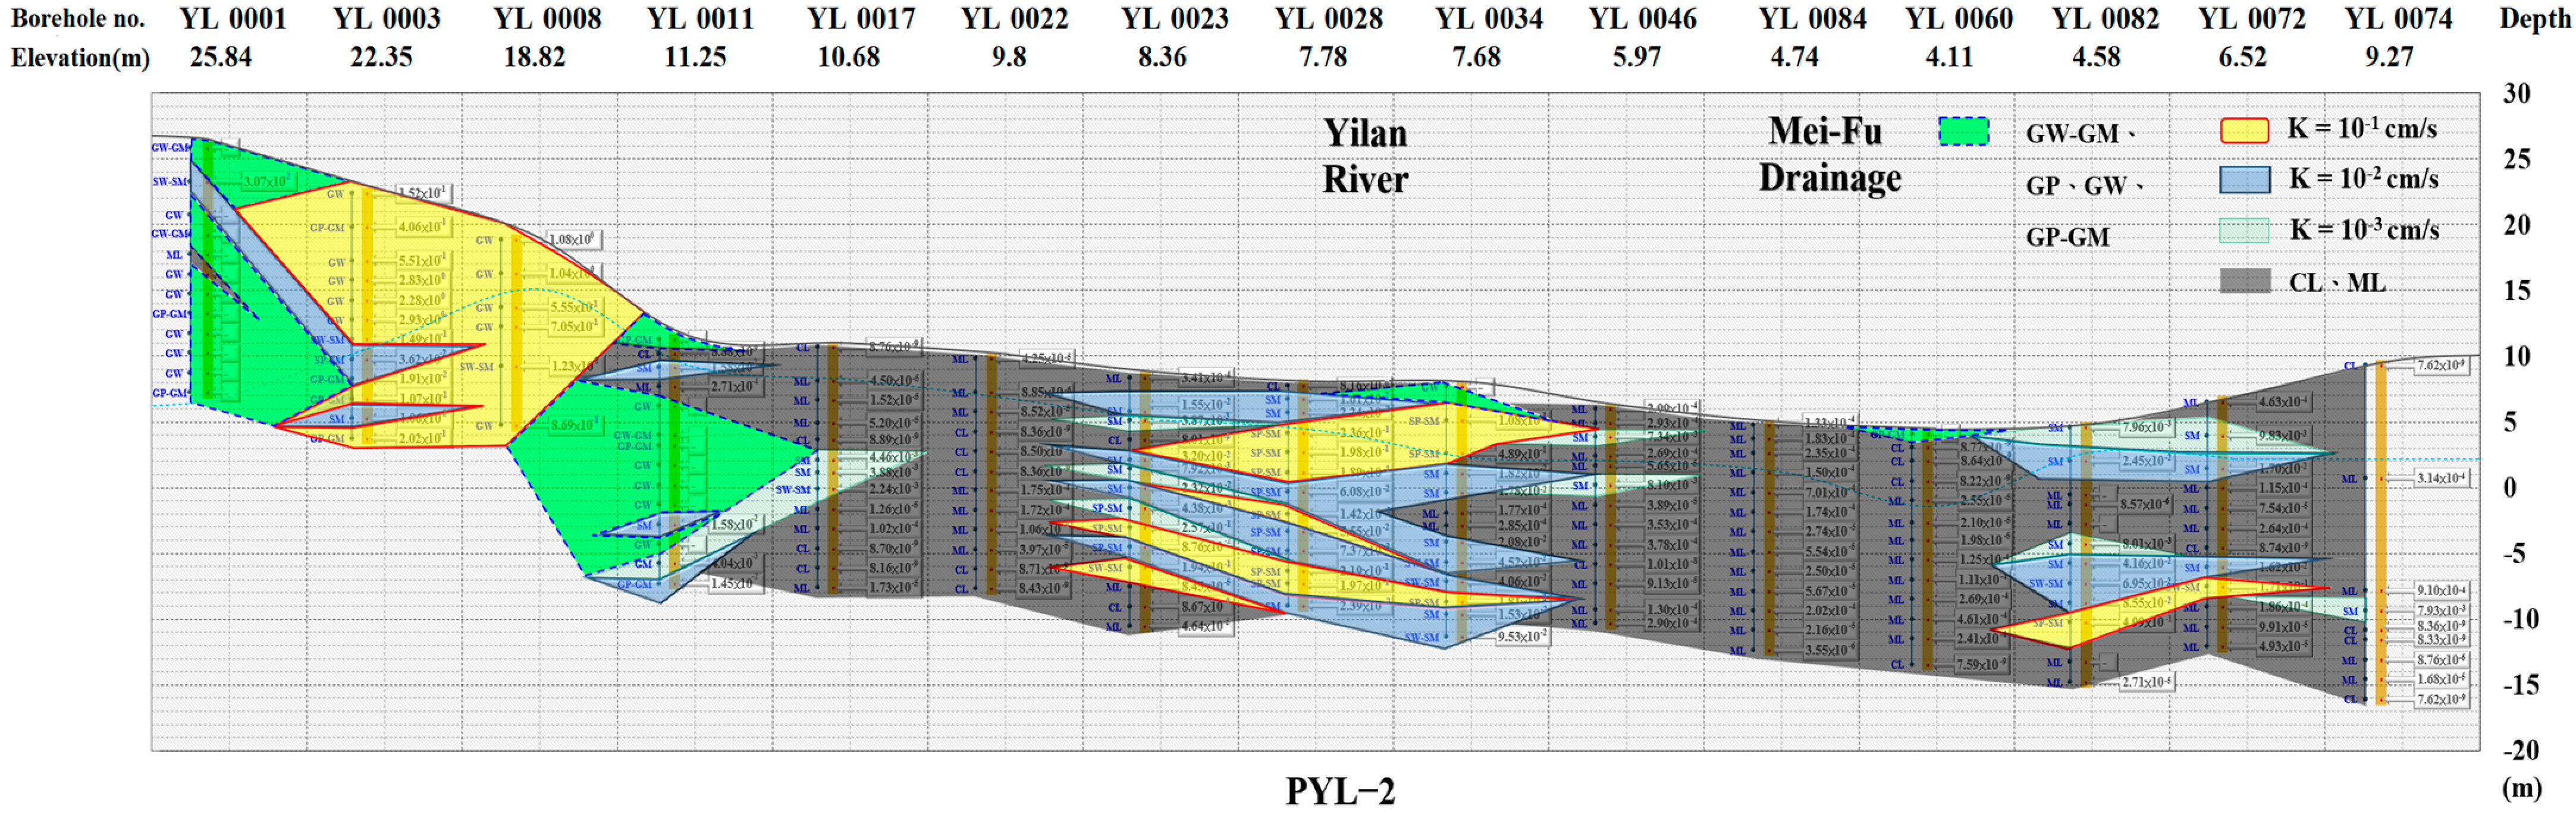
PYL-2 profile is the north–south geological engineering profile line east of the welling spring area (see Figure 5), which can be divided into five sections for explanation.
The first section: (borehole YL0001-YL0011), unified soil classification GW/GP-GM, permeability is excellent, gravel layer, permeability coefficient is better than 1 × 10⁻¹ cm/s. This terrain forms natural welling spring.
The second section: (borehole YL0017-YL0022), permeability poor, sink mud or clay layer as the main soils, unified soil classification CL/ML, permeability coefficient about K = 1 × 10⁻⁹ cm/s. This section is north to GW/GP-GM, permeability excellent gravel layer, south to double, permeability good, middle sand or coarse sand layer, SM/SP-SM.
The third section: (borehole YL0023-YL0034). Interlayers of middle sand or coarse sand layer(SP-SM/SW-SM)and fine sand layer (SM) exist, with permeability coefficients of about 1 × 10⁻¹ cm/s and 1 × 10⁻² cm/s respectively.
The fourth section: (borehole YL0046-YL0060), with poor permeable sediment or clay layer, CL/ML permeability coefficient of about K = 1 × 10⁻⁹ cm/s, and only two thin fine sand (SM) interlayers layers of about 1.5 m each The soil properties of the fourth section are similar to the second section.
The fifth section: (The part-1 of boreholes YL0082-YL0072) Two layers of medium or coarse sand and fine sand exist among poor permeable clay layers. The medium or coarse sand (SP-SM/SW-SM) owns very good permeability of about K = 1 × 10⁻¹ cm/s. The fine sand (SM/SW-SM) has a permeability coefficient of about K = 1 × 10⁻² cm/s. (The part-2 of borehole YL0074) Poor permeable clay layer (CL/ML) is dominant, permeability coefficient is about K = 1 × 10⁻⁹ cm/s, and there is only one thin layer of medium sand (SM).
The PYL-1 profile is a north–south geological engineering profile line with stratigraphy and geology, which can be described in three sections.
The first section: (borehole YL0007-YL0038) has a double layer of medium sand or coarse sand with good permeability, SM/SW-SM, with a permeability coefficient of about K = 1 × 10⁻² cm/s. and a coarse sand layer with excellent permeability, SP-SM, from about 0.5 m below the surface in borehole YL0016 to about 7 m below the surface in borehole YL0055, with a permeability coefficient better than 1 × 10⁻¹ cm/s.
The second section: (borehole YL0055-YL0063) has a double layer of medium sand or coarse sand, SM, with a permeability coefficient of about K = 1 × 10⁻² cm/s. There is also a coarse sand layer with good permeability and a fine sand layer with SP-SM/SM.
The third section: (borehole YL0081-YL0076) has a double layer of excellent permeability gravel layer and coarse sand layer interlayer GW-GM/SP-SM with permeability coefficient better than 1 × 10⁻¹ cm/s. Borehole YL0076 has a layer of medium sand or coarse sand layer of about 3 m at an elevation of 6.5 m. Medium sand or coarse sand layer, SM with permeability coefficient about K = 1 × 10⁻² cm/s.

Section Conclusion

Three permeability nomenclatures were used to classify the soil conditions in the Lanyang plain.
  • “Excellent permeability” was used for a gravel layer with permeability coefficient better than 1 × 10⁻¹ cm/s.
  • “Very good permeability” was used for coarse sand layer with permeability coefficient about 1 × 10⁻¹ cm/s.
  • “Good permeability” was used for fine sand layer with permeability coefficient about 1 × 10⁻² cm/s.
The profile PEW-2, in the east–west direction; there are four different sections based upon permeable capacity. In the first section, exists a gravel layer with “excellent permeability.” In the second section, two “very good permeability” coarse sand layers exist with a gravel layer at the bottom. In the third section, 6.5 m thick impermeable clayey soil is the surface layer. In the fourth section, two “very good permeability” coarse sand layers exist with some clayey soil on top.

5. Analysis of Liquefaction in the Lanyang Plain

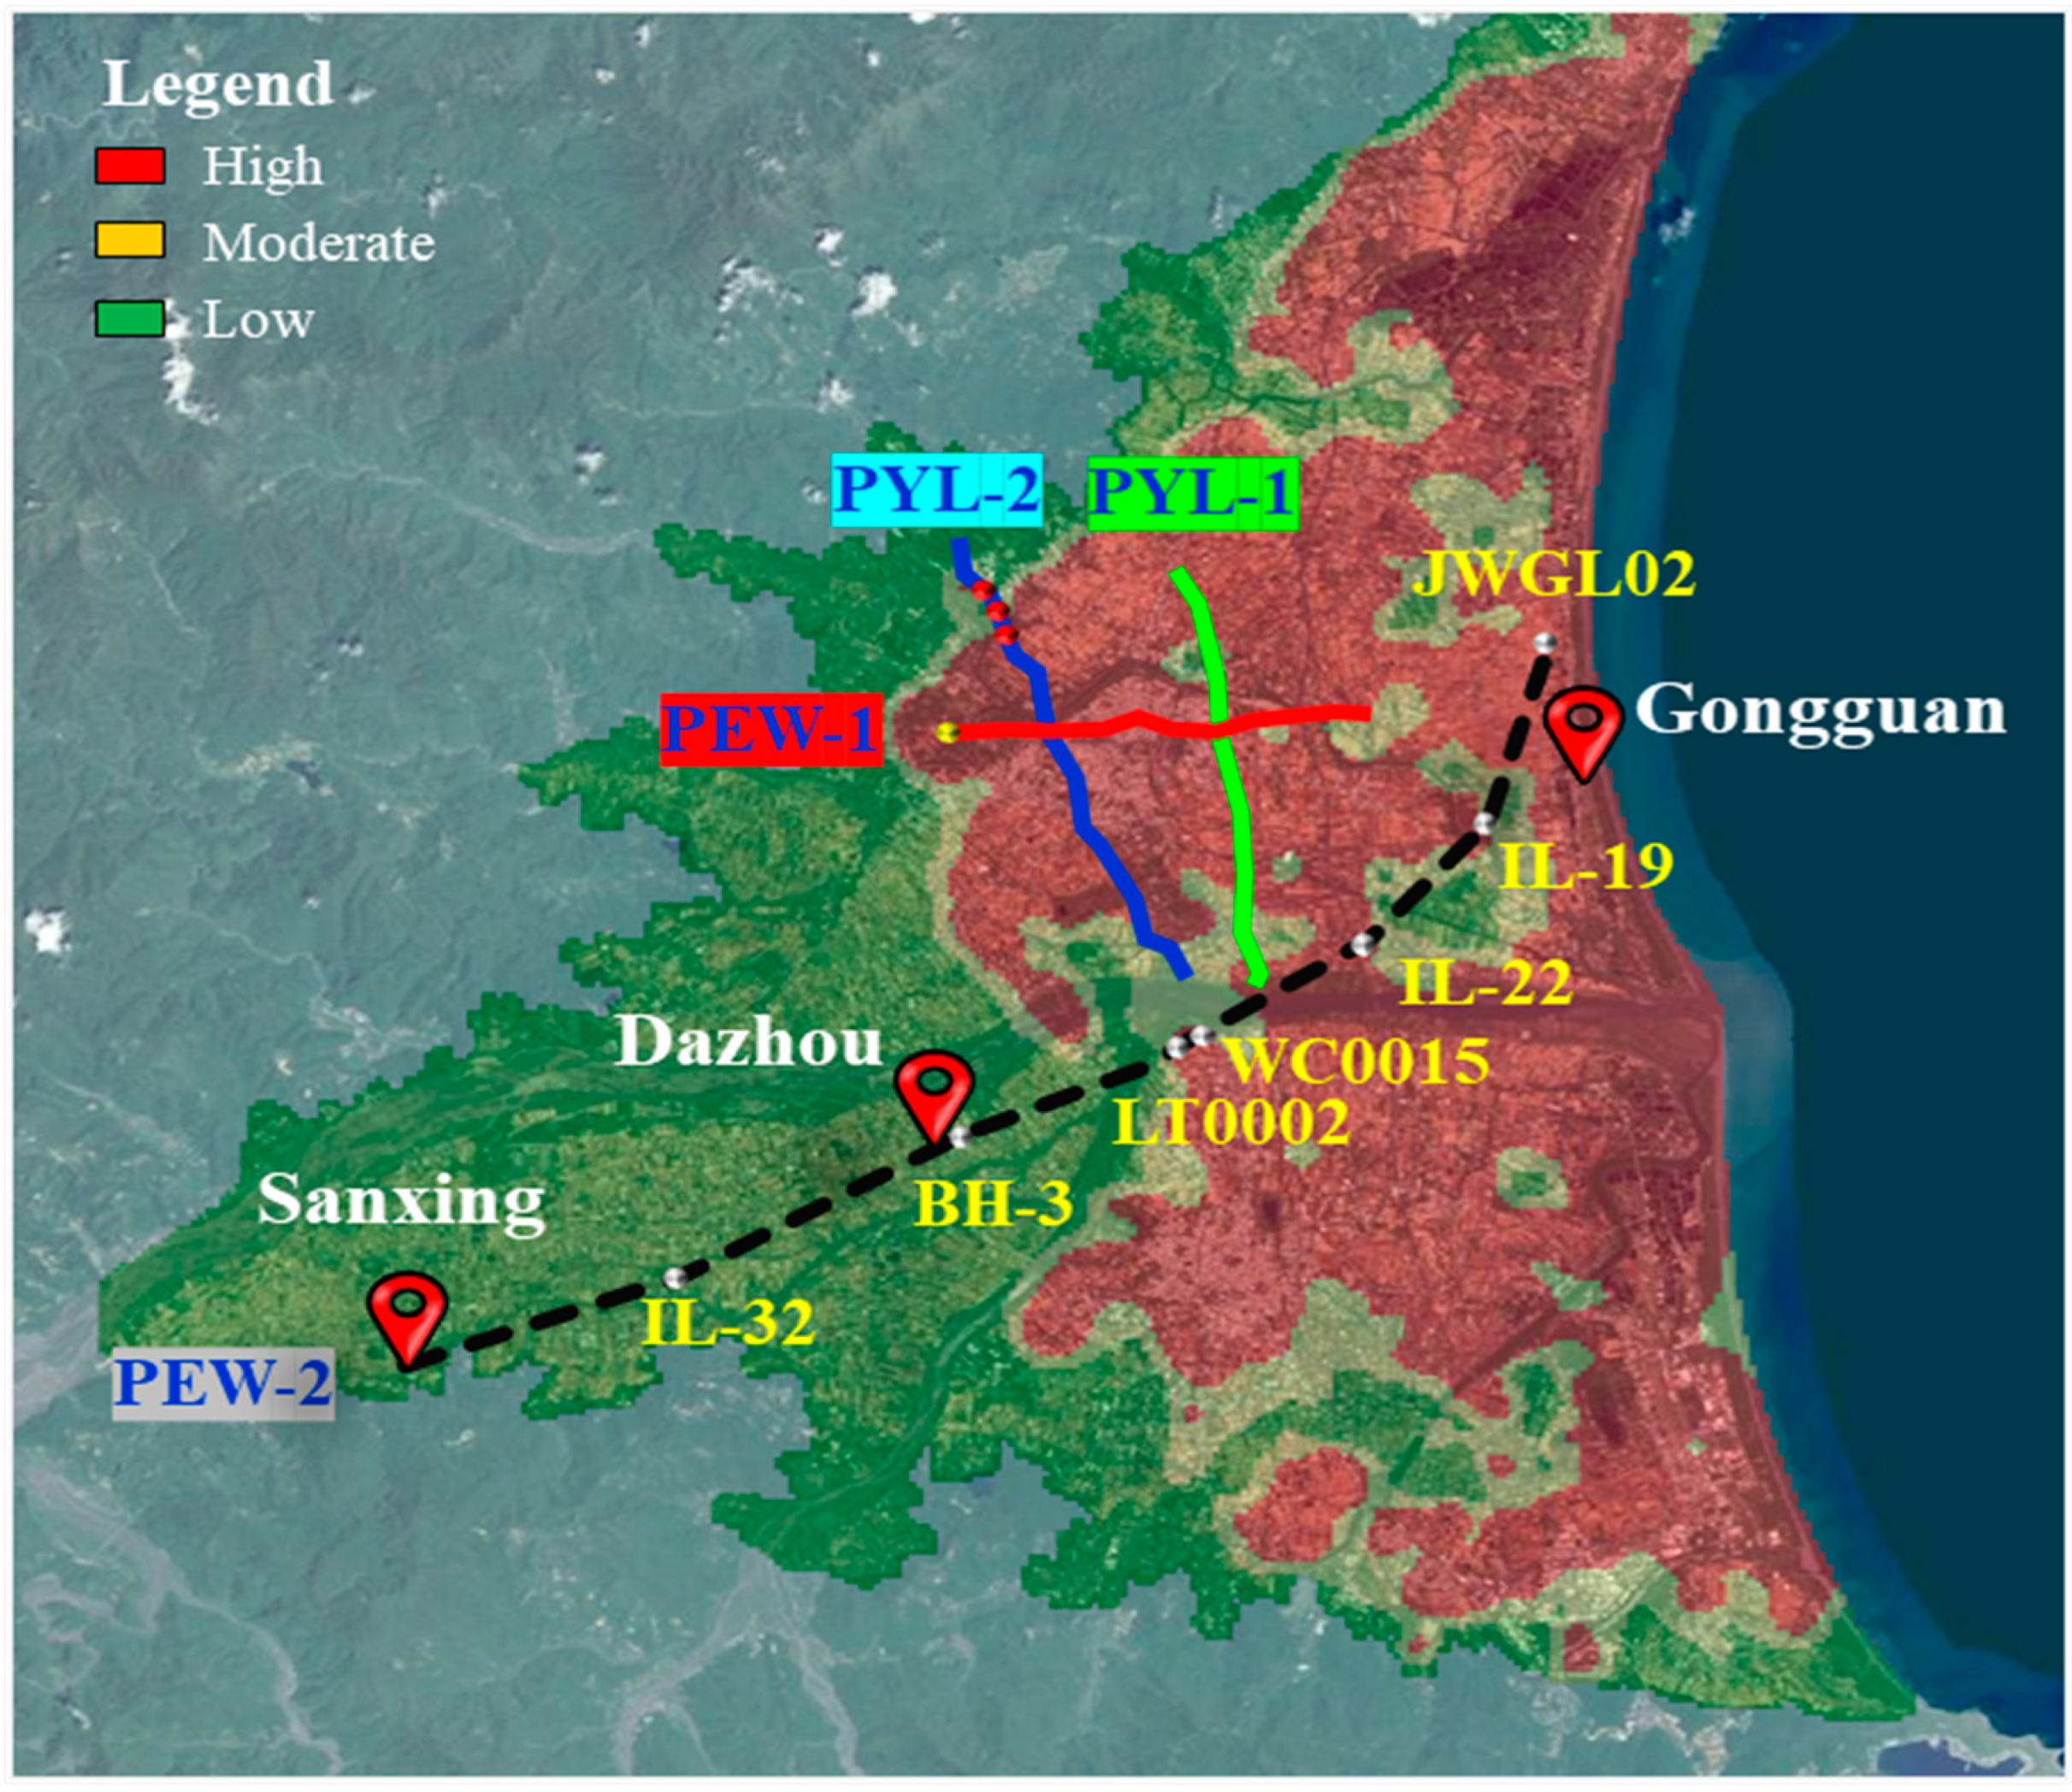
According to the soil liquefaction potential map published by the Central Geological Survey (hereinafter referred to as “CGS”) of the Ministry of Economic Affairs (MOEA), 69% of the soil in the Lanyang plain is at high liquefaction potential and the portion of Yilan city soil at high liquefaction potential is 78%. The liquefaction potential analysis was conducted following the Ministry of the Interior’s “Building Technology Regulations for Building Structures—Design Guidelines for Building Foundation Structures” “Building Seismic Design Guidelines and Explanations”, and the “New Japan Road Association Simple Experience Method” (JRA method) [15]. In the evaluation of soil liquefaction potential, Yilan County used the seismic scale Mw = 7.3 according to the prescribed seismic scale correction factor, and then obtained the horizontal acceleration of small and medium seismicity, design seismicity, and maximum considered seismicity according to the calculation formula. The published soil liquefaction potential map of Yilan is based on a design earthquake horizontal acceleration of 0.32 g.
Figure 10 is the soil liquefaction potential map of the Yilan region published by the CGS [16]. In this study, the four engineering profiles of PYL-1, PYL-2, PEW-1, and PEW-2 are mostly in the high liquefaction potential area. Except for the low liquefaction potential area from the Sanxing borehole to the west of the Dazhou borehole, the liquefaction potential of other boreholes from west to east are as follows: BH-3 shows low liquefaction potential, LT0002 shows high liquefaction potential, WC0015 shows high liquefaction potential, IL19 shows moderate liquefaction potential, and JWGL02 shows high liquefaction potential.

Analysis of Earthquake Data in Yilan Area

In 1980, the Institute of Earth Science (IES) of Academia Sinica, in collaboration with the University of California, Berkeley, established an intensive Phase I digital strong-motion seismometer array (SMART1, Strong Motion Array in Taiwan-1) [17]. SMART1 is located in Luodong Township, Lanyang Plain (Figure 11). SMART1 was designed to record high probability information of strong motions for earthquakes with M > 6.5. A total of 60 earthquakes were recorded in SMART1 between 1980 to1990, of which seven datum with PGA > 120 gals were used for soil liquefaction analysis (Table 3). PEW-2 was selected for soil liquefaction analysis and overall description. Since the liquefaction assessment method of Seed et al. (1985) [2] was strongly recommended by one of the authors in this study [4,5] as being the most accurate, this method was used to analyze the soil liquefaction potential in Yilan area, and then the depth-weighted method of Iwasaki [18] was used to obtain the results shown in Table 4 (Table 4 data from [1,14]). The results of liquefaction potential were obtained by the depth-weighted method of Iwasaki et al. [
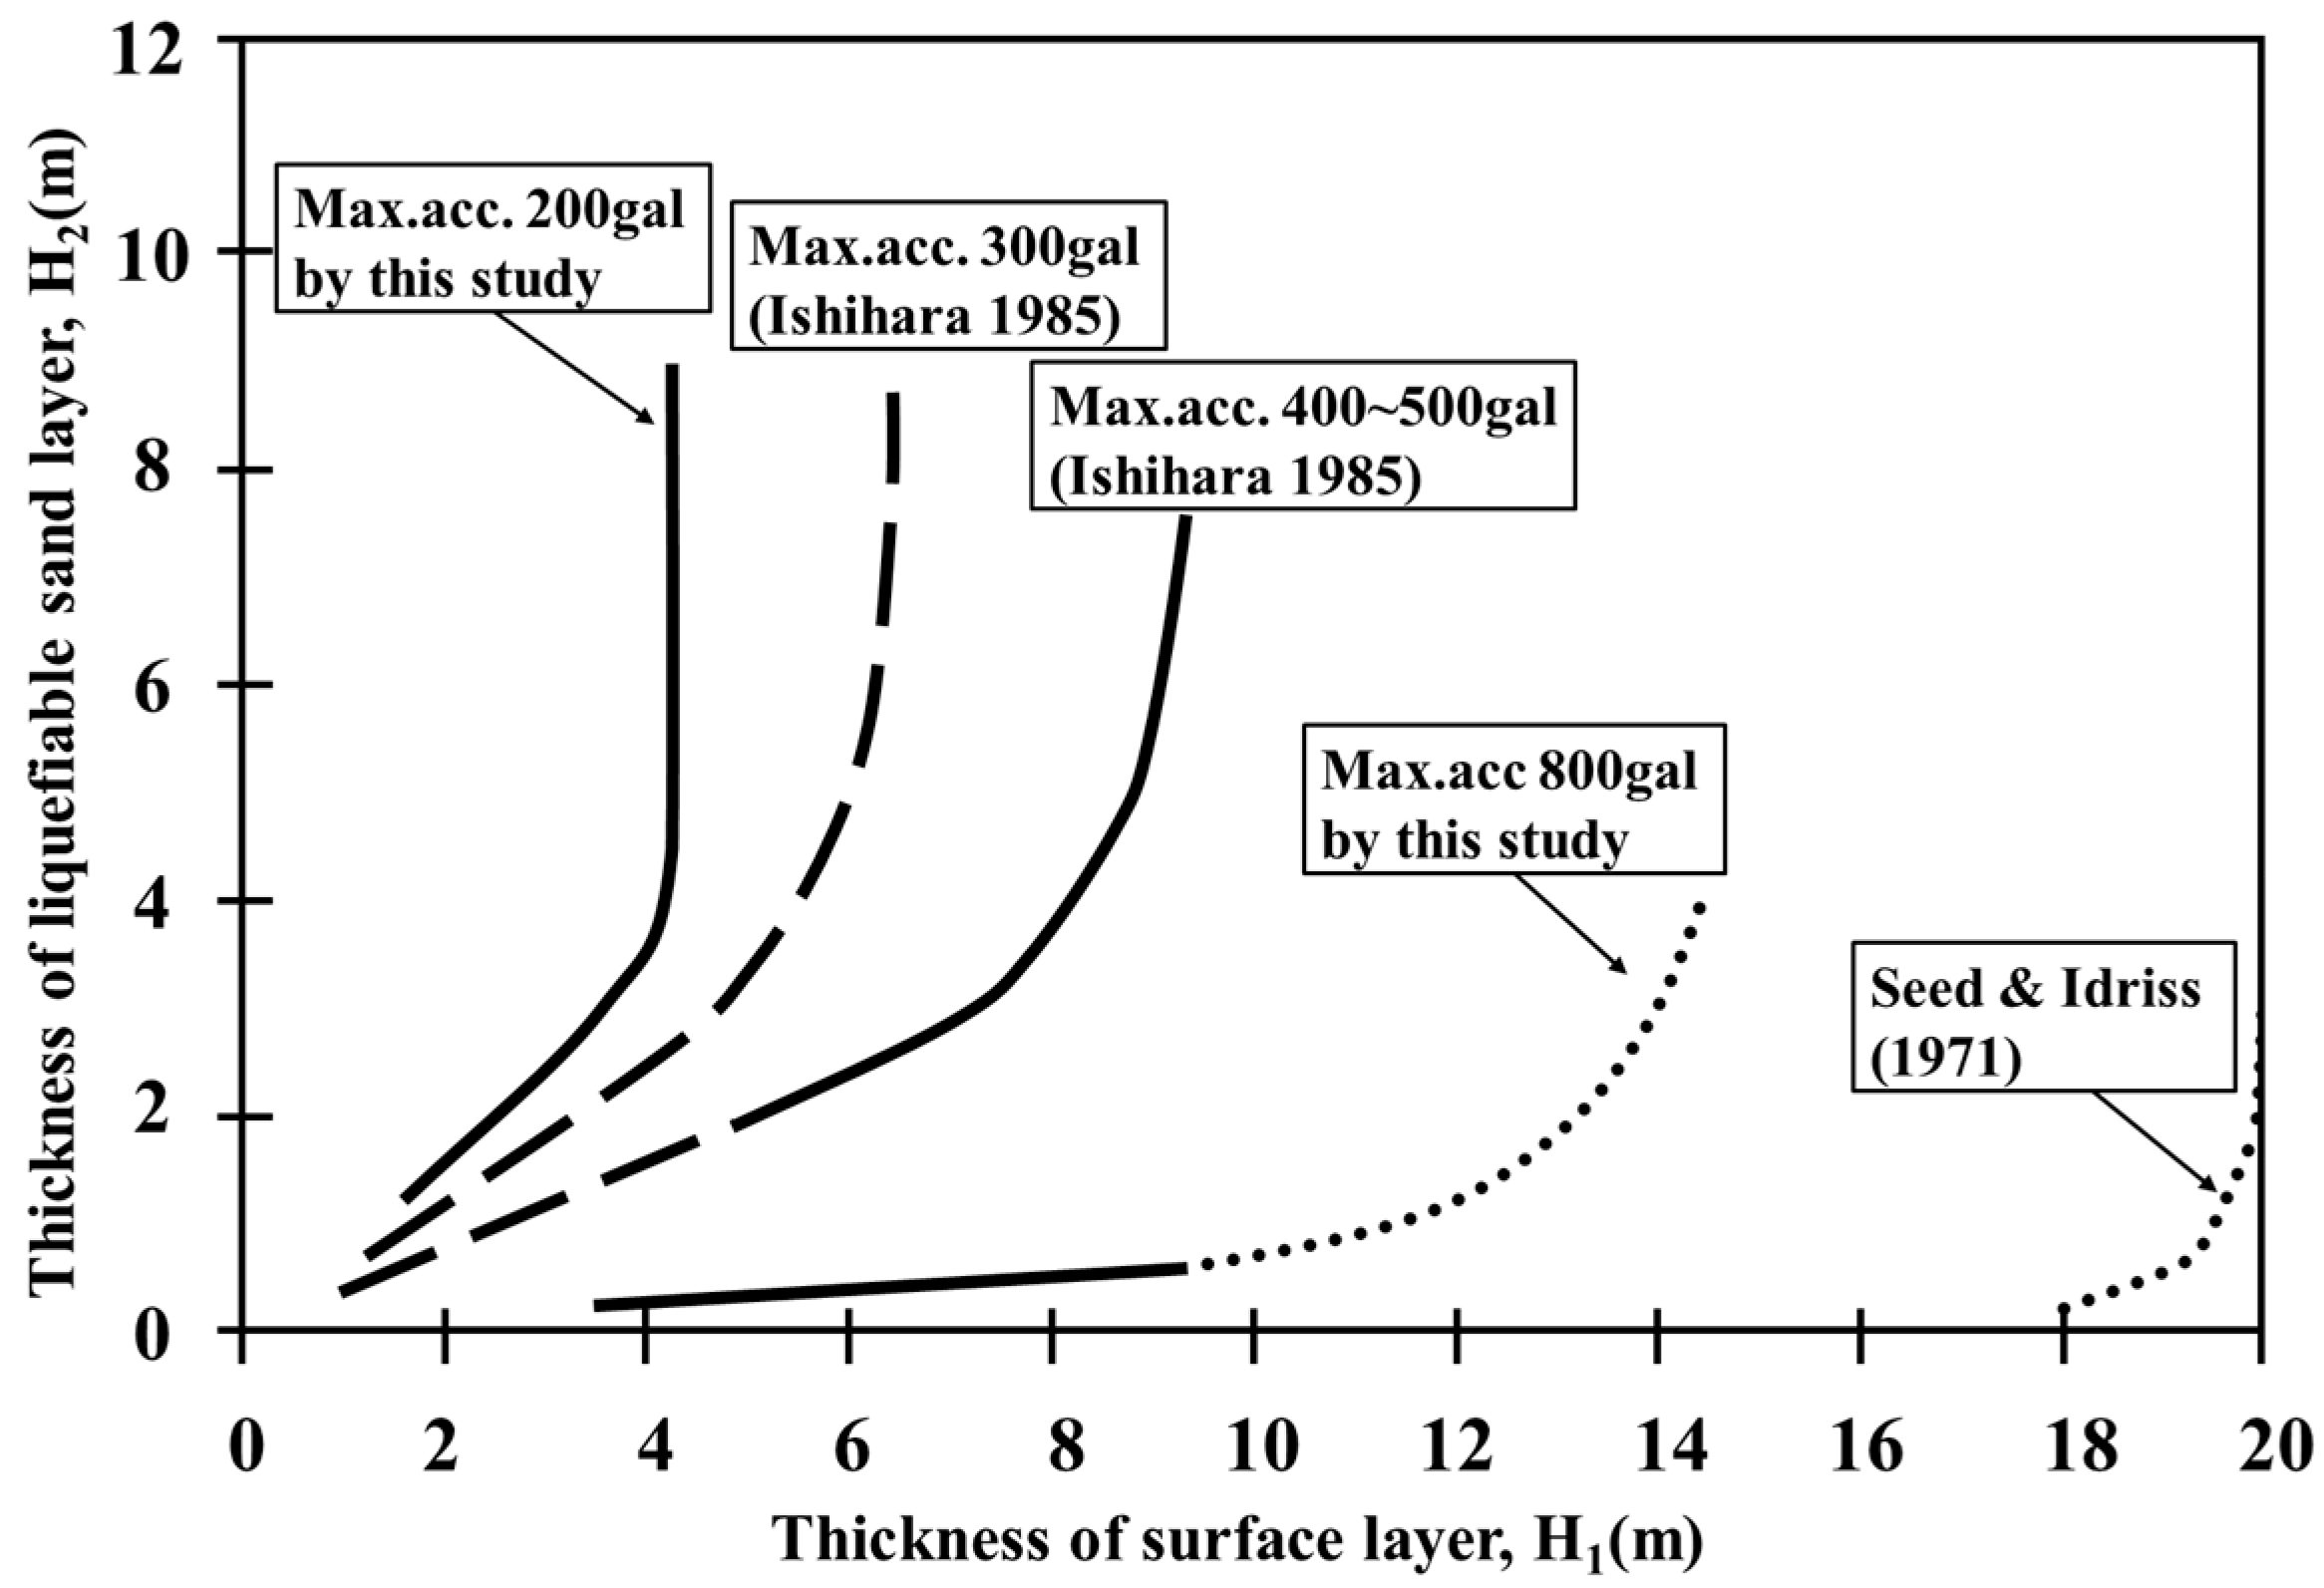
18]. In addition, the thickness H1 of the liquefaction impermeable layers by Ishihara [3], and the thickness H1 suggested by one of the authors in this study [19,20], were used as the thickness of the upper cover layer to inhibit soil liquefaction under different seismic accelerations. In Figure 12, some acceleration data as well as liquefaction symptom information were added into Ishihara‘s original figure. Two more lines, for PGA equaling 200 gals and 800 gals, are based upon Chi-Chi earthquakes data. Another line, for H1 equaling 20 m, is adopted from Seed and Idriss’s principle.
Table 4 shows the results of the liquefaction analysis performed with each event by using the No. 39 maximum strongest shock (PGA = 375.34 gals = 0.383 g) to examine each borehole in detail as shown in Table 5, Table 6, Table 7, Table 8, Table 9 and Table 10 (Table 5, Table 6, Table 7, Table 8, Table 9 and Table 10 data from [1,14]).
The section line PEW-2 except for the Sanxing drill hole to the west of the Dazhou drill hole belongs to the welling spring area, the other hole’s liquefaction potential situation from west to east after BH-3 presents very low liquefaction potential (PL = 0), LT0002 and WC0015 all present high liquefaction potential, IL22, and JWGL02 all present medium liquefaction potential; only IL19 presents low liquefaction potential.
The BH-3 drill hole is the most special of all the drill holes used for liquefaction analysis. The hole is adjacent to the east side of the welling spring area, 0–9 m for SP/SP-SM, SPT-N between 38 and 50, permeability is very good, a coarse sand layer, permeability coefficient about K = 1 × 10⁻¹ cm/s, 9 m below for SPT-N ≥ 50 gravel layer, permeability is similar to the west side of the welling spring area, so, the seven seismic liquefaction analysis results are “0”, belonging to a very low liquefaction potential. We explain now the liquefaction potential of the second lightest borehole IL19, and the most serious borehole LT0002 in this paper.
Borehole IL19 stratigraphic distribution status 0–3 m has excellent permeability, a gravel layer with permeability coefficient better than 1 × 10⁻¹ cm/s, 3–14 m has 9.5 m thick clay layer and 1.5 m thick powder layer, 14–20 m is a medium and coarse sand layer, the permeability coefficient of this section is 1 × 10⁻¹ cm/s and 1 × 10⁻² cm/s respectively, good permeability of a double layer. Table 9 shows that this layer is a liquefaction zone, and all of them have low liquefaction potential for the seven earthquakes. However, the thickness of the impermeable clay layer below the surface of the hole reached 9.5 m, which exceeded the proposed value of 6.5 m in Figure 12. Therefore, we can conclude that the liquefaction behavior will be confined to the surface impermeable layer and no liquefaction symptom will be found around this borehole area.
Drill hole LT0002 showed high liquefaction potential during the No. 39 strong earthquake. Of the seven earthquakes, 2/7 (~29%) showed high liquefaction potential, 3/7 (~42%) showed moderate liquefaction potential, and 2/7 (~29%) showed low liquefaction potential. This is the hole with the most severe liquefaction potential compared to the other holes. Drill hole LT0002 stratum 0–8 m with a fine sand, medium sand, and coarse sand complex layer, below 8 m soil by GP, GW, GM combination and composition, that is, below 8 m there is gravel soil, and at the west side of the welling spring area link, permeability similar, but, standard penetration test only between 16 to 29, hardness is not as hard as drill hole BH-3 of gravel layer of SPT-N ≥ 50, showing a representative welling spring area gravel layer The east side of the boundary line should be in the BH-3 hole and LT0002 hole, and maybe a highly liquefied potential also beginning to the east gradually increasing. Fortunately, this hole of 0–8 m has a permeability coefficient of 1 × 10⁻² cm/s of fine and middle sand layer, and a permeability coefficient of 1 × 10⁻¹ cm/s of a coarse sand layer with excellent permeability, below 8 m it is connected to the gravel layer of the welling spring area, permeability is better, so the pore water pressure with earthquake liquefaction, will dissipate quickly because of the excellent permeability of the stratum, preventing the soil liquefaction phenomenon.
Drill hole WC0015 showed high liquefaction potential during the strong earthquake No. 39, and Table 6 shows that the soil in 10/12 (about 83%) of the hole was liquefied. Under the analysis of liquefaction in the seven earthquakes, 1/7 (about 16%) showed high liquefaction potential, 3/7 (about 42%) showed medium liquefaction potential, and 3/7 (about 42%) showed low liquefaction potential, which is the second most severe hole. The stratigraphic distribution of drill hole WC0015 is 0–8 m with medium sand, coarse sand, and fine sand interlayers, and 8–20 m with gravelly soil. The depth from 11 m to 14 m should not liquefy since the standard penetration test results SPT-N are between 26 and 29. The liquefaction should occur at all other depths. Luckily, the hole depth of 8–17 m has two layers with a very good permeability coefficient of 1 × 10⁻¹ cm/s, and the upper and lower layers are also medium sand layers with a permeability coefficient of 1 × 10⁻² cm/s. So, the transient pore water pressure generated by the earthquake will dissipate quickly and no soil liquefaction phenomenon will occur.
Borehole IL22 is the third most severe hole in terms of liquefaction potential. 5/7 (about 71%) of the 7 seismic liquefaction analyses show moderate liquefaction potential and 2/7 (about 29%) show low liquefaction potential. There are 13 boreholes in Table 8, IL22. At 0–12.5 m there are all non-liquefied impermeable layers with about a 9.5 m thick clay layer and a 3 m thick chalk layer. At 12.5–18 m is a double layer with good permeability with medium and coarse sand layer, and the permeability coefficient of this section is between 1 × 10⁻¹ and 1 × 10⁻² cm/s. At 18–21 m there is a clay layer. In the liquefaction analysis of the strong earthquake No. 39, Table 8 shows that the hole is determined to be of medium liquefaction potential according to the analysis, but in terms of stratigraphic distribution, the thickness of the clay and powder layer in the whole section reached 12.5 m, covering the liquefied sand layer. Thus, the ground surface is not liquefied according to Figure 12.
Borehole JWGL02 is the fourth most severe hole in terms of liquefaction potential, with 2/7 (about 29%) showing medium liquefaction potential and 5/7 (about 71%) showing low liquefaction potential. Borehole JWGL02 has a thick chalk layer with clay from 0 m to 8.5 m, and a double layer with good permeability of medium and coarse sand from 8.5 m to 21 m. The permeability coefficient of this section is between 1 × 10⁻¹ and 1 × 10⁻² cm/s. Although the SPT-N value is not large enough for liquefaction, the coarse sand layer with good permeability can quickly remove the transient high pore water during the earthquake and prevent soil liquefaction.
In the Seismic Information Center of the Central Weather Bureau of the Ministry of Transportation and Communications, in this study the earthquakes were searched with magnitudes larger than 4 and Intensity larger than 5 in Yilan City from 1999 to 2021. Table 11 shows only eight events as required and the maximum PGD is 175.74 gals.
To cause a high liquefaction potential in Lanyang Plain, Table 4 shows that a PGA larger than 283.4 gals is necessary while 237.73 gals are required for a moderate liquefaction potential. So, only a low liquefaction potential might have occurred in the last 23 years in the Lanyang Plain. Event 39 with PGA equaling 375.34 gals is a very specific case only recorded by the SMART-1 array in Luodong town by the IES of Academia Sinica. Even the Seismic Information Center of the Central Weather Bureau does not own such a record. More, the design earthquake horizontal acceleration of 0.32 g, which is required by the “Building Seismic Design Guidelines and Explanations” of the Ministry of the Interior, was used by the CGS to build a liquefaction potential map of Lanyang Plain. Therefore, 69% of high liquefaction potential was shown for the Lanyang Plain but no serious liquefaction report was announced in practice.

6. Conclusions

The seven earthquakes since 1980, with peak ground acceleration larger than 120 gals, occurring in the Lanyang Plain were used to examine the practical liquefaction potential in the Yilan area in this study. The largest PGA (375.34 gals = 0.383 g) was input into the six boreholes in geotechnical profile PEW-2 for soil liquefaction analysis. The hole BH-3 shows very low liquefaction potential (PL = 0), which is the lowest liquefaction potential hole in this study. Although moderate and high liquefaction occurred in boreholes LT0002, WC0015, and JWGL02, soil liquefaction was not observed in the ground surface because the transient high pore water was removed very quickly by the existence of a coarse sand layer with very good permeability, and a gravel layer with excellent permeability. Borehole IL22 and Borehole IL19 are covered with an impermeable layer of more than 6.5 m in thickness, so the soil liquefaction is confined to the deep underground and is not seen on the ground surface.
To sum up, the stratum of the Lanyang Plain contains a gravel layer with excellent permeability and a coarse sand layer with very good permeability, so the drainage condition is extremely ideal. Hence, the high pore water pressure due to earthquake compression behavior can be eliminated and dissipated instantly without causing a soil liquefaction disaster when an earthquake occurs. On the other hand, because the soil is covered with impermeable layers of more than 6.5 m, the liquefied sand layer underneath does not flow to the surface. Therefore, no signs of soil liquefaction can be seen on the ground surface.
In addition, by using 0.32 g for the assumed possible earthquakes occurring, more than 69% of the plain area was shown with high liquefaction potential in the Central Geological Survey’s soil liquefaction potential map of the Lanyang Plain. However, it did not happen in the last 23 years in the Lanyang Plain according to the SIC records of CWB.
Earthquakes with PGA (375.34 gals) are again assumed to have happened nearby to these six boreholes in Lanyang Plain and initiated some high liquefaction. However, it only existed in Lotung county in reality and was only recorded by academic research sensors. Earthquakes with PGA larger than 237.73 gals will cause moderate liquefaction in Yilan area. However, no such earthquake occurred based upon SIC reports of CWB from 1999 to 2021.
As a result, the residents of Yilan have had no opportunity to see an actual liquefaction phenomenon in the last 23 years.

Author Contributions

H.-H.L.: proposes the conceptualization & methodology; supervision, C.-F.H.: performed software, data curation and numerical analyses; H.-H.L. and C.-F.H.: deal with writing—original draft; preparation; writing—review and editing; visualization. S.-J.C. and C.-F.H.: investigate and collect field data; C.-C.C.: provides geological methodology. All authors have read and agreed to the published version of the manuscript.

Funding

This research received no external funding.

Institutional Review Board Statement

Not applicable.

Informed Consent Statement

Not applicable.

Data Availability Statement

The data that support the findings of this study are available from the corresponding author upon reasonable request.

Acknowledgments

The authors also thank (1) Taiwan Engineering Consultants Inc. (CECI) for providing the final report supplied to the Construction Division of Yilan County Government; (2) Central Geological Survey, Ministry of Economic Affairs for providing free downloads of borehole data and liquefaction sensitivity maps for Yilan County; (3) Institute of Earth Sciences, Academia Sinica for providing and free downloads of seismic data for the Luodong area of Yilan; (4) Seismological Center, Central Weather Bureau for providing and free downloads of seismic data for Yilan County.

Conflicts of Interest

The authors declare no conflict of interest.

Abbreviations

Kpermeability coefficient.
evoid ratio.
D10particle sizes corresponding to 10% finer.
Eq. no.earthquake number.
Origin timecoordinated Universal Time (UT).
Epicenterin degree and minute.
Depthfocal depth in kilometers.
Mag.local magnitude of ML.
PGAthe three-component (V, EW, and NS) peak ground acceleration recorded by the station.
Vthe maximum PGA of vertical component recorded by the event.
EWthe maximum PGA of east-west component recorded by the event.
NSthe maximum PGA of north-south component recorded by the event.
Tnumber of stations triggered by the event.
Borehole No.borehole number.
GWTground water table.
USCSunified soil classification system.
amaxpeak ground horizontal acceleration.
ERenergy ratio.
FSfactor of safety.
PLliquefaction potential index.
FCfines Content.
GSspecific gravity.
Mmagnitude.
CRRcyclic resistance ratio.
CSRcyclic stress ratio.
NSPT-N value.
SPTstandard penetration test.
CGSCentral Geological Survey.
MOEAMinistry of Economic Affairs.
SICSeismic Information Center.
CWBCentral Weather Bureau.

References

  1. CECI Engineering Consultants, Inc., Taiwan. Construction of Phase I of Intermediate level Map of Yilan County Soil Liquefaction Potential Areas and Geological Improvement Demonstration Project Technical Services; Final Report of Yilan County Government Construction Division; CECI Engineering Consultants, Inc.: Taipei, Taiwan, 2016. (In Chinese) [Google Scholar]
  2. Seed, H.B.; Tokimatsu, K.; Harder, L.F.; Chung, R.M. Influence of SPT Procedures in Soil Liquefaction Resistance Evaluatio. J. Geot. Geotech. ASCE 1985, 111, 1425–1445. [Google Scholar] [CrossRef]
  3. Ishihara, K. Stability of natural deposits during earthquakes. In Proceedings of the 11th International Conference on Soil Mechanics and Foundation Engineering, San Francisco, CA, USA, 12–16 August 1985; Volume 1, pp. 321–376. [Google Scholar]
  4. Lee, H.S. A study of localized liquefaction assessment method. In Proceedings of the 89th Annual Symposium on Soil Liquefaction Integrative Assessment on Earthquakes, Taichung City, Taiwan, 1 June 2001; Volume 6, pp. B1–B5. (In Chinese). [Google Scholar]
  5. Lee, H.S.; Lee, C.F.; Hsu, W.Y.; Hou, K.C.; Wu, C.M. Evaluation of Liquefaction Potential Analysis Methods. In Proceedings of the 9th Geotechnical Academic Seminar, Taoyuan City, Taiwan, 30–31 August 2001; Volume 8, pp. F010:1–3. (In Chinese). [Google Scholar]
  6. Chen, W.S. Analysis and Stratigraphic Comparison of Sedimentary Material and Sedimentary Environment: Lanyang Plain. In Report of the 89th Annual Central Geological Survey, Ministry of Economic Affairs, Taiwan Groundwater Observation Network Phase II Project—Hydrogeological Survey Research; Ministry of Economic Affairs: New Taipei City, Taiwan, 2000. (In Chinese) [Google Scholar]
  7. Chiang, H.T. The Underground Structure of Lanyang Plain-Geology (18); Lanyang Museum E-Newsletter; Lanyang Museum: Yilan County, Taiwan, 2010; p. 62. (In Chinese) [Google Scholar]
  8. Chiang, S.C. Seismic Survey of the Yilan Plain. Min. Technol. 1976, 14, 215–221. (In Chinese) [Google Scholar]
  9. Chiu, Y.T. Current Crustal Deformation of Ilan Plain Based on GPS Measurements. Master’s Thesis, The Department of Geosciences, College of Science National Taiwan University, Taipei, Taiwan, 2008. (In Chinese). [Google Scholar]
  10. Chiang, H.T. Springs in Lanyang Plain-Geology (12); Lanyang Museum E-Newsletter; Lanyang Museum: Yilan County, Taiwan, 2009; Issue 50. (In Chinese) [Google Scholar]
  11. Hsu, C.F.; Lee, H.S. A study on the relationship between the empirical formula of permeability coefficient and the result of in situ pumping test. In Proceedings of the 19th Geotechnical Engineering Conference, Taipei, Taiwan; 2022. accepted (In Chinese). [Google Scholar]
  12. Chapuis, R.P. Predicting the saturated hydraulic conductivity of sand and gravel using effective diameter and void ratio. Can. Geotech. J. 2004, 41, 787–795. [Google Scholar] [CrossRef]
  13. Das, B.M. Principal of Geotechnical Engineering, 3rd ed.; PWS Publishing Company: Boston, MA, USA, 1994. [Google Scholar]
  14. Geo. Central Geological Survey. 2020. Available online: https://geotech.moeacgs.gov.tw/imoeagis/Home/Map (accessed on 5 January 2022). (In Chinese)
  15. Japan Road Association (JRA). The New Road and Bridge Explanation Book, An Interpretation, Chapter V Seismic Design; JRA: Tokyo, Japan, 1996. [Google Scholar]
  16. Liquefaction Susceptibility Inquiry System. Central Geological Survey. Available online: https://www.liquid.net.tw/cgs/Web/Map.aspx (accessed on 8 January 2022). (In Chinese)
  17. Academia Sinica. Strong Motion Array in Taiwan, Phase I (SMART1). Available online: https://www.earth.sinica.edu.tw/content/labs/slab/smdmc/smart1/smart1.htm (accessed on 5 January 2022). (In Chinese).
  18. Iwasaki, T.; Arakawa, T.; Tokida, K. Simplified Procedures for Assessing Soil Liquefaction During Earthquake. In Proceedings of the Conference on Soil Dynamics & Earthquake Engineering, Southampton, UK, 13–15 July 1982; Volume II, pp. 925–939. [Google Scholar]
  19. Lee, H.S. Northern Engineering Environmental Geology of Taiwan and Elaborations of Soil Liquefaction Potential Investigation in Taiwan; Announcement and Seminar on Engineering Environmental Geological Achievements in Metropolitan Areas; Central Geological Survey: Taipei City, Taiwan, 2021. (In Chinese) [Google Scholar]
  20. Lee, H.S.; Huang, C.H. A Study on the Accuracy of Soil Liquefaction Potential Assessment Methods; Research Report GT201608; Department of Civil and Construction Engineering, National Taiwan University of Science and Technology: Taipei City, Taiwan, 2016. (In Chinese) [Google Scholar]
  21. Seismological Center. Available online: https://scweb.cwb.gov.tw (accessed on 10 January 2022). (In Chinese)
Figure 1. The thickness of underground sediment in Yilan plain. The red solid line is the location of the profile, the green solid line is the location of the fault, and the green dashed line is the location of the presumed fault. (redrawn by this study, which is adapted from Chiang 1976 [8] and redrawn by Chiu [9] in 2008.)
Sustainability 14 08244 g001
Figure 2. The N–S structural profile of the east side of the Yilan Plain in Figure 1 (redrawn by this study, which is adapted from Chiang 1976 [8] and redrawn by Chiu [9] in 2008.)
Sustainability 14 08244 g002
Figure 3. Lanyang plain main welling spring belt distribution in elevation 7–15 m area (purple north and south belt area, coastline saloon height although more than 20 m, but there is no welling spring) (extracted from Chiang 2009 [10]).
Sustainability 14 08244 g003
Figure 4. Stratigraphic bar diagrams of the three wells of Sanxing, Dazhou, and Gongguan, with the locations of the three wells in the lower-left corner. The Gongguan well location is near the Lanyang River outlet, and the stratum is mainly composed of fine sand and mud, which is less permeable (redrawn from Chiang 2009) [10].
Sustainability 14 08244 g004
Figure 5. Welling spring area and four geological engineering section line location maps (redrawn from Chiang 2009) [10].
Sustainability 14 08244 g005
Figure 6. Geological engineering section PEW−1.
Sustainability 14 08244 g006
Figure 7. Geological engineering section PEW−2, including the three wells of Chiang (2009) [10].
Sustainability 14 08244 g007
Figure 8. Geological engineering section PYL−1.
Sustainability 14 08244 g008
Figure 9. Geological engineering section PYL−2.
Sustainability 14 08244 g009
Figure 10. Map of soil liquefaction potential and the location of the four geotechnical profiles in the Yilan area (Mapped from CGS of MOEA, 2022) [16].
Sustainability 14 08244 g010
Figure 11. Location of SMART1 stations in Luodong Township (from the Institute of Earth Science, Academia Sinica) [17].
Sustainability 14 08244 g011
Figure 12. Supplementary proposed diagram of the thickness of liquefaction-resistant impermeable layer H1 originally proposed by Ishihara 1985 [3] (adopted from (Lee 2021) [19] and (Lee & and Huang 2016) [20]).
Sustainability 14 08244 g012
Table 1. Comparison of K values obtained from Chapuis (2004) empirical formula [12] to on-site pumping tests.
LocationWell Name for On-Site Pumping Test and Depth (m)Nearby Borehole No. and Depth (m)On-Site Pumping TestChapuis (2004) Empirical Formula
K (cm/s)K (cm/s)
Yilan areaWu Sha (13.38)YL0007 (13.5)4.83 × 10−24.40 × 10−3
Sanxing (47.83)-1.30 × 10⁻¹-
Chung Hsing (5.29)WC0015 (5.29)1.36 × 10−25.26 × 10−3
Chung Hsing (6.29)WC0015 (6.29)1.68 × 10−23.47 × 10−3
Lize (6.21)WC0067 (6.00)2.10 × 10−25.94 × 10−3
Taipei CityXinsheng Park (20.47)DT0001 (19.5)1.50 × 10−21.39 × 10−3
Youth Park (16.68)BH-4 (18.00)3.69 × 10−11.37 × 10−2
New Taipei CityXinzhuang (16.58)C3 (16.5)1.01 × 10−25.65 × 10−3
Average K =7.67 × 10−25.69 × 10−3
Table 2. Range of soil permeability coefficient (DAS 1995) [13].
Soil TypePermeability Coefficient, K (cm/s)
Clean gravel>10−1
Coarse sand–Fine sand10−1~10−3
Fine sand–Silt10−3~10−5
Silt, Silty clay10−4~10−6
Clay10−7 or less
Table 3. Seven seismic events with PGA > 120 gals in Luodong Township from 1980 to 1990 (From the website of the Institute of Earth Science, Academia Sinica, 2022) [17].
Eq. No.Origin TimeEpicenterDepthMag.PGA (gals)T
(UT)Lat. (N)Lon. (E)(km)(ML)VEWNS
529 January 1981 04:51:3624.42121.9111.15.991.47158.24244.327
3312 June 1985 17:22:5024.57122.193.36.146148.6397.1636
3916 January 1986 13:04:3124.76121.9610.26.1314375.34307.736
4020 May 1986 05:25:4924.08121.5915.86.272.47210.47251.0737
4217 July 1986 00:03:3324.66121.8224.382.02140.83151.0638
4330 July 1986 11:31:4724.63121.791.55.8224.1230.94283.439
4514 November 1986 21:20:0423.99121.83156.5104168.25237.7336
Table 4. Liquefaction potential of each borehole for cases with PGA > 120 gals.
Analysis Method: Seed et al. (1985) [2] + Iwasaki (1982) [18]
Eq. No.5333940424345
PGA (gals)244.3148.63375.34251.07151.06283.4237.73
Borehole No.Liquefaction Severity
BH-30000000
LT0002ModerateLowHighModerateLowHighModerate
WC0015ModerateLowHighModerateLowModerateLow
IL22ModerateLowModerateModerateLowModerateModerate
IL19LowLowLowLowLowLowLow
JWGL02LowLowModerateLowLowModerateLow
Table 5. Analysis of borehole BH3 liquefaction potential by Seed et al. (1985) [2] method.
Borehole No.BH3GWT = 2.10Single-Location Method Assessment = LL
amax =0.383 gMw = 7.5Accurate = 1
ER =72%α(M) = 1.00LL = 1; NL = 0
Depth z (m)1.53.07.510.5
Soil Type (USCS)SP-SMSP-SMSPGP
Unit Weight γt (t/m3)2.142.031.821.96
Gs2.722.712.722.70
Fines Content (%)7.008.004.004.00
SPT-N38505050
Layer Thickness (m)1.501.504.503.00
N6045.6060.0060.0060.00
(N1)60113.8285.7970.7158.60
CRRM0.600.600.600.60
Reduction factor γd0.990.980.940.89
CSR0.250.270.340.37
Analysis Result
FS2.442.261.781.63
PRENNNN
Fi0.000.000.000.00
Wi (z)9.638.737.385.50
LPI0.000.000.000.00
PL = 0.00, Liquefaction Severity: Very Low
Table 6. Analysis of borehole LT0002 liquefaction potential by Seed et al. (1985) [2] method.
Borehole No. LT0002GWT = 1.60Single-Location Method Assessment = LL
amax =0.383 gMw = 7.5Accurate = 1
ER =72%α(M) = 1.00LL = 1; NL = 0
Depth z (m)3.04.56.07.59.010.512.013.515.016.518.019.5
Soil Type (USCS)SMSP-SMSMSW-SMGPGWGWGP-GMGP-GMGW-GMGP-GMGW-GM
Unit Weight γt (t/m3)2.072.122.012.112.521.862.262.292.482.332.152.25
Gs2.722.722.732.68--------
Fines Content (%)19.0010.0020.006.004.002.002.008.008.005.008.006.00
SPT-N510771624292623192128
Layer Thickness (m)3.001.501.501.501.501.501.501.501.501.501.501.50
(N1)609.4215.969.878.9418.4725.6629.2224.5920.4716.0116.9421.71
CRRM0.150.230.150.140.200.300.410.490.300.170.240.32
Reduction factor γd0.980.970.950.940.930.890.850.810.770.730.690.65
CSR0.290.330.360.370.370.370.360.340.330.310.290.28
Analysis Result
FS0.510.690.430.380.550.811.151.420.920.560.821.16
PREYYYYYYNNYYYN
Fi0.490.310.570.620.450.190.000.000.080.440.180.00
Wi (z)8.858.137.386.635.885.134.383.632.882.131.380.63
LPI6.013.816.366.153.991.430.000.000.371.390.370.00
PL = 29.89, Liquefaction Severity: High
Table 7. Analysis of borehole WC0015 liquefaction potential by Seed et al. (1985) [2] method.
Borehole No. WC0015GWT = 2.45Single-Location Method Assessment = LL
amax =0.383 gMw = 7.5Accurate = 1
ER =72%α(M) = 1.00LL = 1; NL = 0
Depth z (m)1.53.04.56.07.59.010.513.516.518.019.5
Soil Type (USCS)SMSMSP-SMGP-GMSP-SMSPSMSP-SMSP-SMSMSM
Unit Weight γt (t/m3)1.692.002.231.942.162.092.291.992.152.162.15
Gs2.712.742.682.692.692.682.722.702.712.712.73
Fines Content (%)26.0025.007.009.008.002.0020.009.0012.0021.0016.00
SPT-N54121010232015141318
Layer Thickness (m)1.501.501.501.501.501.501.503.003.001.501.50
(N1)6016.856.9918.7413.8212.5726.5621.4014.6812.4410.8114.38
CRRM0.240.120.270.200.180.320.320.210.180.160.21
Reduction factor γd0.990.980.970.950.940.930.890.810.730.690.65
CSR0.250.260.290.330.350.360.350.330.310.300.28
Analysis Result
FS0.980.460.910.610.530.890.900.640.590.550.74
PREYYYYYYYYYYY
Fi0.020.540.090.390.470.110.100.360.410.450.26
Wi (z)9.638.648.137.386.635.885.134.002.501.380.63
LPI0.002.551.054.284.650.990.744.353.070.930.24
PL = 22.86, Liquefaction Severity: High
Table 8. Analysis of borehole IL22 liquefaction potential by Seed et al. (1985) [2] method.
Borehole No.IL22GWT = 0.00Single-Location Method Assessment = LL
amax =0.383 gMw = 7.5Accurate = 1
ER =72%α(M) = 1.00LL = 1; NL = 0
Depth z (m)1.53.04.56.07.59.010.512.013.515.016.518.019.5
Soil Type (USCS)CLMLMLCLCLCLCLCLSPSMSMCLCL
Unit Weight γt (t/m3)1.941.921.861.811.821.761.851.801.951.951.941.771.77
Gs2.702.732.702.742.732.712.722.722.702.712.712.742.73
Fines Content (%)88.0066.0071.0096.0096.0099.0096.00100.003.0020.0012.0098.0098.00
SPT-N324234569111344
Layer Thickness (m)1.501.501.501.501.501.501.501.501.501.501.501.501.50
(N1)6013.565.248.193.514.685.706.587.3710.3711.9113.333.923.78
CRRM--------0.110.180.19--
Reduction factor γd0.990.980.970.950.940.930.890.850.810.770.730.690.65
CSR--------0.440.420.39--
Analysis Result
FS3.003.003.003.003.003.003.003.000.260.420.493.003.00
PRENNNNNNNNYYYNN
Fi0.000.000.000.000.000.000.000.000.740.580.510.000.00
Wi (z)9.638.888.137.386.635.885.134.383.632.882.131.380.63
LPI0.000.000.000.000.000.000.000.004.042.491.620.000.00
PL = 8.15, Liquefaction Severity: Medium
Table 9. Analysis of borehole IL19 liquefaction potential by Seed et al. (1985) [2] method.
Borehole No.IL19GWT = 1.20Single-Location Method Assessment = LL
amax =0.383 gMw = 7.5Accurate = 1
ER =72%α(M) = 1.00LL = 1; NL = 0
Depth z (m)1.54.56.07.59.010.512.013.515.016.518.019.5
Soil Type (USCS)GPCLCLCLCLCLCLMLSMSMSMSM
Unit Weight γt (t/m3)2.131.831.811.761.711.771.861.941.871.961.921.84
Gs2.722.722.702.722.722.712.722.692.692.712.722.69
Fines Content (%)4.0099.0097.0097.0098.0095.5095.0052.0013.0013.0014.0013.00
SPT-N197365561216171416
Layer Thickness (m)1.503.001.501.501.501.501.501.501.501.501.501.50
(N1)6043.6713.064.658.506.606.196.9913.1716.6416.8313.2414.55
CRRM0.60-------0.240.240.190.21
Reduction factor γd0.990.970.950.940.930.890.850.810.770.730.690.65
CSR0.26-------0.380.360.340.33
Analysis Result
FS2.313.003.003.003.003.003.003.000.620.660.560.64
PRENNNNNNNNYYYY
Fi0.000.000.000.000.000.000.000.000.380.340.440.36
Wi (z)9.338.507.386.635.885.134.383.632.882.131.380.63
LPI0.000.000.000.000.000.000.000.001.631.080.910.34
PL = 3.96, Liquefaction Severity: Low
Table 10. Analysis of borehole JWGL02 liquefaction potential by Seed et al. (1985) [2] method.
Borehole No.JWGL02GWT = 3.00Single-Location Method Assessment = LL
amax =0.383 gMw = 7.5Accurate = 1
ER=72%α(M) = 1.00LL = 1; NL = 0
Depth z (m)3.04.56.07.59.510.512.013.515.016.518.019.5
Soil Type (USCS)MLCLMLMLSP-SMSW-SMSP-SMSMSW-SMSP-SMSP-SMSM
Unit Weight γt (t/m3)1.931.752.001.601.861.921.981.961.901.981.971.98
Gs2.732.712.602.632.712.732.712.722.732.742.742.75
Fines Content (%)88.0088.0068.0089.009.0011.0010.0013.0012.009.0012.0014.00
SPT-N75911159121314192016
Layer Thickness (m)3.001.451.551.501.951.051.501.501.501.501.501.50
(N1)6011.047.5412.3514.0117.8510.0812.7813.1113.4717.5017.6813.61
CRRM----0.250.150.190.190.200.250.250.20
Reduction factor γd0.980.970.950.940.920.890.850.810.770.730.690.65
CSR----0.350.360.350.340.330.320.310.29
Analysis Result
FS3.003.003.003.000.720.430.530.560.590.780.820.68
PRENNNNYYYYYYYY
Fi0.000.000.000.000.280.570.470.440.410.220.180.32
Wi (z)8.508.147.396.635.765.014.383.632.882.131.380.63
LPI0.000.000.000.003.142.993.082.411.780.700.370.30
PL = 14.77, Liquefaction Severity: Medium
Table 11. The earthquakes with magnitude larger than 4 and intensity larger than 5 in Yilan City from 1999 to 2021 (based on the web site of Seismic Information Center of CWB by this study, 2022) [21].
Yilan Weather StationLongitudeLatitudeMagnitudeDepthPGA (gals)
8 August 2019 05:28:04121.9124.446.2424.15175.74
18 April 2019 13:01:07121.5624.056.3220.3345.16
12 May 2016 11:17:15121.9824.696.18.8658.68
6 March 2005 03:08:00121.824.655.966.95123.28
6 March 2005 03:06:51121.8424.655.96.39131.72
31 March 2002 14:52:49122.1924.146.813.81158.86
14 June 2001 10:35:25121.9324.426.317.29125.72
21 September 1999 01:47:15120.8223.857.3881.58
Publisher’s Note: MDPI stays neutral with regard to jurisdictional claims in published maps and institutional affiliations.

