1. Introduction
The current European regulations on the energy performance of buildings [
1,
2] and their transposition into Spanish regulations [
3,
4] have led to a significant increase in the construction requirements of buildings in recent years. These changes have led to a significant increase in the thermal insulation of new and renovated buildings in all European countries, with requirements similar to the Passive House standard [
5]. However, in hot and semi-arid climates with high annual insolation, such as the dry Mediterranean climate of southeastern Spain, proper solar control of glazing is even more important to reduce the overheating of indoor air [
6,
7,
8]. Therefore, adapting design criteria to climate characteristics has become essential in order to meet the Nearly Zero Energy Buildings (NZEB) requirements [
9] and to reduce the carbon footprint of the building sector [
10].
Three aspects are necessary to achieve these objectives. First, we start with architectural designs and construction systems that avoid energy needs by increasing thermal insulation and eliminating thermal bridges in facades [
11,
12,
13]. Secondly, it is necessary to install air-conditioning equipment with maximum efficiency that reduces energy consumption. Third, it is necessary to use as much renewable energy as possible. In addition, the use of passive design strategies in accordance with the Kyoto Pyramid [
14] does not only reduce energy consumption and CO2 emissions, but also increases comfort and quality of life with thermal and lighting conditions [
15].
However, in dry Mediterranean climates, excessive sunlight in buildings with glazed surfaces of more than 70% or 80% of the total envelope area (such as heated swimming pool roofs or sports facilities) requires very different energy efficiency strategies compared to continental and Central European climates. This is due to the high solar gains and the greenhouse effect inside buildings.
Current Spanish energy efficiency regulations are based on European standards, and the calculations are based on very airtight and highly insulated building envelopes. These regulations do not sufficiently take into account the particularities of the Mediterranean climate, where architecture has historically been characterised by more permeable envelopes with a lot of natural ventilation, taking advantage of the benevolent climate.
Considering the characteristics of this climate, with increasingly hot summers and many sunny days a year, it is more difficult to comply with the standard in buildings with a large glazed surface area. In these cases, it is necessary to study alternative solutions in order to avoid economically unviable, socially unacceptable and even contradictory constructive solutions to the spirit of the standard and the most elementary criteria of energy efficiency.
Mediterranean vernacular architecture has always had constructive and spatial solutions that favoured the passive control of heat and sunlight, such as courtyards and fountains that promoted cross-ventilation and evaporative air cooling. However, current energy certification regulations and software do not facilitate the modelling of these passive systems despite their advantages [
16,
17]. In climates such as this one, with mild winters and moderate summers, natural cross-ventilation is very beneficial for dissipating heat and lowering the temperature and relative humidity of the air [
18,
19]. The advantages of natural ventilation can also be applied in building systems with ventilated and adaptive facades [
20,
21,
22].
Additionally, in climates with high solar radiation, the use of elements that protect from the direct action of the sun can control thermal gains, especially if they are external mobile solar protection systems such as canopies, external roller shades or louvres [
23,
24].
The aim is to reduce the use of active air-conditioning systems with an architectural and constructional design that optimises the thermal performance of the building to meet current regulatory requirements [
25,
26] while better adapting to the characteristics of each climate [
27,
28,
29].
The dry Mediterranean climate, characterised by high annual insolation, affects a very small geographical area of Europe and is quite different from the rest of the European climate zones [
30]. On the other hand, existing studies on this climate deal with projects in other parts of the world without European regulations [
31,
32].
The dry Mediterranean climate, characterized by dry and hot summers, has warmer winter temperatures than the typical Mediterranean climate. With less rainfall and high insolation throughout the year, it is a very specific exception in Europe that is located exclusively in the provinces of Alicante, Murcia and Almeria in southeastern Spain, which requires particular considerations in architectural design that are very different from the rest of the European climates.
This paper explains the research carried out in three heated swimming pools with semi-transparent roofs located in southeastern Spain. This type of building is characterised by heated pool water, a heated indoor environment, and the high thermal loads produced by solar radiation. As a result, due to these constructive and functional characteristics, very high temperatures are reached in the interior space, which do not comply with thermal comfort standards for heated swimming pools [
33,
34] and cause very high energy costs for cooling. These circumstances are common in many heated pools, and appropriate solutions are urgently needed [
35,
36,
37]. This work analyses the benefits in the energy performance of retrofitting these pools by applying natural cross-ventilation and increased solar control of the enclosure.
The aim of this study was to analyse the advantages of using cross-ventilation development strategies and solar shading to improve the hygrothermal quality of the indoor environment and to optimise the energy performance of buildings for energy retrofitting. The most optimal solutions for the semi-arid warm Mediterranean climate have been searched for by means of energy calculations using a multi-criteria methodology [
38,
39,
40]. The study focused on passive energy efficiency measures, avoiding their energy rehabilitation through new installations required by the regional authorities of the Spanish Ministry of Industry. This study does not analyse other possibilities based on active systems, such as micro-cogeneration or mechanical cooling. Neither does it include the study of renewable energies through thermal or photovoltaic panels that could be architecturally integrated [
41] or other innovative solutions such as solar-assisted air conditioning systems with integral absorption energy storage [
42] or photovoltaic Trombe wall system with Venetian blinds [
43]. The optimal results of these solutions in semi-arid climates have been demonstrated in other research but require active systems. The objective of this paper is to analyse the advantages of traditional passive systems, such as cross-ventilation [
44] and solar control [
45] for energy savings and improvements in thermal comfort and environmental quality [
46,
47,
48]. The aim is to propose an alternative solution to mechanical air conditioning methods through bioclimatic design strategies [
49,
50].
The choice of the passive systems used took into account their thermal effectiveness, but also economic conditions and user comfort, which influenced the multi-criteria evaluation [
51,
52]. The methodology employed consisted of the study and analysis of the hygrothermal behavior of existing buildings and of a systematized study using natural ventilation design strategies and solar protections for improving the hygrothermal quality of the indoor environment and to optimize the energy performance of the buildings.
The usefulness of the study is that it quantitatively evaluates the improved hygrothermal performance and energy efficiency produced by passive systems, like natural ventilation and solar protection strategies tested, in this type of glazed heated swimming pool located in a dry Mediterranean climate. This research may also be useful for other types of buildings with many glazed surfaces and in other climates with high annual sunshine.
The study contributes to more sustainable renovation methodologies, enhancing thermal comfort in accordance with the standard requirements for heated swimming pools and seeking interventions that are compatible with the existing building.
2. Materials and Methods
The selected case studies are public heated swimming pools located in the provinces of Alicante and Murcia in southeastern Spain: (1) El Toscar Sports Centre, located in the town of Elche (Alicante); (2) Infanta Cristina High-Performance Centre, located in the town of Los Alcázares (Murcia); (3) Aquadel Sports Centre, located in the town of San Cayetano (Murcia).
All three pools have semi-transparent and telescopic retractable domed covers. The cover of the El Toscar swimming pool is 34.34 m. long, 19.20 m. wide and 5.60 m. high, and is oriented north-south along its length (
Figure 1).
The cover of the swimming pool of the Infanta Cristina High-Performance Centre is 57.20 m. long, 15.23 m. wide and 5.75 m. high, and has a longitudinal northwest-southeast orientation (
Figure 2).
The cover of the swimming pool of the Aquadel Sports Centre is 28.98 m. long, 14.12 m. wide and 4.32 m. high, and has a longitudinal northwest-southeast orientation (
Figure 3).
These pools were selected for this research because they have significant problems with hygrothermal control and energy consumption. During the months when the roofs are air-conditioned with the roofs closed, high indoor temperatures build up in the indoor environment. This breaches the environmental quality conditions of the regulations and generates very high cooling costs to reduce the overheating of the air. As a result, the regional authorities required the municipalities to install expensive new air-conditioning equipment. However, through this research, solutions based on passive systems at a much lower cost were proposed to the municipalities and the company Metalisteria Vega Baja S.L., the manufacturer of the pool covers. The proposed solutions consist of increasing the sun control of the envelope to reduce heat gains from solar radiation and the use of natural ventilation to dissipate excess heat and relative humidity from the interior space.
The methodology used in this work consisted of two phases. Firstly, the study and measurements of the current hygrometric conditions and behaviour of the three pools studied were carried out. Secondly, a systematised and ordered study of different alternative solutions for natural ventilation and solar control was carried out to analyse the improvement in energy performance.
In order to study the current hygrometric behaviour of the pools, three types of on-site measurements were carried out. First, thermographic photographs were taken to analyse the different characteristics of the thermal envelope of the pools. Secondly, the thermal transmittance of the roof enclosures was measured with a thermal transmittance flowmeter. Thirdly, the distribution of temperatures and air velocity in the different areas inside the covered space of the swimming pools were measured using a hot-wire probe (
Figure 4).
On-site measurements were taken from October to April, when the pools are heated with the covers closed. No measurements were taken from May to September, because the pools remain outdoors with the covers open and unheated.
Data collection was carried out under a strict procedure in all visits to ensure that all measurements were made under the same pre-established conditions. First, the temperature of the water surface had to be between 24 °C and 30 °C, in accordance with the regulations applicable to heated pools. Second, the measuring instruments had to be connected 5 min before use to allow the sensors to acclimatise to the indoor environment. Thirdly, the temperature measurements were taken at 18 points located at the four corners of the pool and at the midpoint of the longitudinal sides of the pool at three different heights (0.20 m, 1.80 m and 2.50 m). The humidity and outside temperature of the enclosure were also measured.
A Flir Thermacam P25 thermal imaging camera was used for the thermography measurements. The thermal transmittance flowmeter used included the multifunctional instrument Testo 435-2, an humidity/temperature probe with a wireless handle and a surface probe. For temperature and air velocity measurements, a hot-wire probe was used, which was also connected to the Testo 435-2 multifunctional instrument (
Figure 5 and
Table 1). The equipment is calibrated as standard. To measure the temperatures resulting from solar radiation and the greenhouse effect on-site, it was necessary to take the measurements with the air-conditioning installations switched off. This made it necessary to conduct measurements on specific days so as not to make it impossible to use the pools for too long and to disconnect the air-conditioning installations the day before each measurement was taken. For this reason, an automatic data collection system was not used.
The solar radiation incident on each of the pools was also calculated based on their orientation and adjacent buildings by simulating virtual models using Ecotect Analysis software (version 2017, Autodesk, San Francisco, CA, USA). The Ecotect Analysis program was used to calculate the incident radiation because of its capacity and accuracy to study the effect of orientation and nearby obstacles on the incident radiation of the different pools studied. These virtual simulations considered the weather and sunshine conditions on the same days as the on-site measurements so that the virtual simulations had the same environmental circumstances as the real measurements made.
On the other hand, for the study of alternative solutions for natural ventilation and solar control, calculations were carried out by simulation of virtual models using the El Toscar swimming pool as a case study. For this purpose, several proposals were studied in a systematised and ordered way according to the following procedure: (1st) simulation of the current hygrothermal behaviour, (2nd) simulation of the hygrothermal behaviour of each improvement proposal, and (3rd) a three-dimensional computational fluid dynamics (CFD) model was developed to determine the indoor air circulation velocity.
Taking into account the construction characteristics of the pool enclosures studied, the research proposed taking advantage of their telescopic and retractable movement to facilitate natural ventilation. To this end, it was proposed to open the ventilation openings depending on the temperature of the indoor environment to prevent overheating.
Using virtual models, different distributions of natural ventilation openings were simulated to minimise the operation and consumption of the cooling systems. For this purpose, thermal loads, indoor and outdoor air temperatures and optimal setpoint temperatures for activating natural ventilation were calculated.
For the virtual calculation of the alternative natural ventilation and solar control solutions, the Design Builder software (version v6.1.8.021, DesignBuilder Software Limited, Stroud, UK) with an EnergyPlus calculation engine was used [
53]. The Design Builder software was used for its capacity and precision to generate a virtual model of the cover of each pool, controlling both the geometric characteristics and the usage profiles, and to allow passive ventilation systems based on a schedule and the temperatures at any given time. For the CFD simulation, factors such as construction materials, prevailing winds and geographical position were taken into account. For the initial settings and boundary conditions to simulate the heat transfer to the envelopes, a heat transfer coefficient of 20 W/m
2·K and a reference temperature equal to the ambient temperature were considered. To define the inlet of the air, the wind speed was assigned as a velocity boundary condition, and to define the outlet of the air, a static gauge pressure equal to 0 was assigned. The simulation is of the static linear type, which allows the natural ventilation generated in the interior space without the external wind currents altering the calculations. Convergence criteria of the CFD model were based on field variable fluctuations, stopping the calculation when the fluctuation or deviation was below the set level. An air box large enough that no artificial air accelerations occur, with a variable fluid materials environment and a number of iterations greater than 500, was established [
54,
55,
56]. A high number of iterations was set to ensure convergence, but the set iterations were never reached because the process stopped when 20% of the last iterations had a change of less than 5%.
The calculation method used, in accordance with current regulations, took into account the gains and losses due to conduction, the transmission of solar radiation through semi-transparent surfaces with the correcting coefficients of the solar factor, air infiltration, ventilation in renovations/hour and internal loads [
3]. For the virtual simulations of the current hygrothermal behaviour, the outdoor temperature and relative humidity data recorded on the same days of the on-site measurement campaign were taken into account.
In the thermal simulations, the particular conditions of the climatic zone where the buildings are located have been considered: Elche (Alicante), Los Alcázares (Murcia), and San Cayetano (Murcia). The pools studied are located in climate zone B4 according to Spanish legislation [
57], which corresponds to climate BShs (dry Mediterranean climate within a warm semi-arid climate) in the Köppen climate classification [
58]. This climate is characterised by mild winters and warm summers, with average annual temperatures of 18.3 °C and summer night-time temperatures above 22 °C. The sea breeze from the Mediterranean Sea helps to temper the sensation of heat, acting as a natural thermal regulator. It is a dry climate, with very little rainfall throughout the year (less than 500 mm), although with regular storms and torrential episodes in autumn. The most important characteristic of this climate is its high annual sunshine. There are more than 3000 h of sunshine per year and a high average relative humidity (
Figure 6).
The climatic databases used in the simulations correspond to the climatic station of El Altet (Alicante) for the calculation of the Elche swimming pool and to the climatic station of San Javier (Murcia) in the case of Los Alcázares and San Cayetano. The El Altet station reflects the maximum average monthly temperature in August of 34.9 °C, while the minimum average monthly temperature is in January of 3.4 °C. The average annual temperature is 17.8 °C, and the average annual relative humidity is 72.5% at 9 a.m. and 44.7% at 3 p.m. The average monthly maximum temperature at the San Javier station is 32.8 °C in August, while the average monthly minimum temperature is 4.4 °C in December. The annual average temperature is 16.8 °C, and the annual average relative humidity is 78.3% at 9 a.m. and 51.9% at 3 p.m. The “Atlas de Radiación Solar en España utilizando datos del SAF de Clima de EUMETSAT” was used to obtain annual average daily global solar radiation data [
59]. This document shows that for Elche, the annual average daily direct radiation is 3.44 Kwh/m
2·day, and the annual average daily diffuse radiation is 1.61 Kwh/m
2·day. Meanwhile, for Los Alcazares and San Cayetano, the annual average daily direct radiation is 3.52 Kwh/m
2·day, and the annual average daily diffuse radiation is 1.61 Kwh/m
2·day.
The setpoint temperatures for the indoor climate control were defined in accordance with the standard requirements for heated swimming pools [
33,
34]. The dry indoor air temperature should be between 1 °C and 2 °C above the pool water temperature, with a maximum of 30 °C. As a result, since the water temperature must be between 24 °C and 30 °C according to the regulations, the air setpoint temperature must be between 25 °C and 30 °C.
The computer model of the swimming pools took into account their situation, dimensions, orientations, geometry and inclination of all its enclosures, glazing arrangements, and construction features of the thermal envelope (
Figure 7).
The pool enclosures are telescopic retractable enclosures made of extruded aluminium profiles with high inertia cold-curved monolithic sections. (
Figure 8a,b and
Table 2). The roof cladding consists of 16 mm cellular polycarbonate sheets with a triple-walled rectangular tunnel structure with UV protection on both sides (
Figure 8c and
Table 3).
By means of simulations, different layouts of the openings were studied to facilitate natural ventilation, and the solar factor of the semi-transparent roof panels was reduced to reduce solar gains and dissipate excess heat indoors. Subsequently, a comparative analysis of the results on the thermal behaviour of the building, the heating and cooling needs and the energy consumption of the installations was carried out.
To this end, the solutions for ventilation openings and improved solar control of the roof that were easiest to implement in the existing roofs and in the manufacturing process of future roofs were discussed with the manufacturing company. The manufacturer proposed using ventilation grilles incorporated between the aluminium profiles and polymeric sheets bonded to the polycarbonates to increase solar control. From this research, these constructive solutions began to be developed by the manufacturer.
Finally, five different options for the distribution of natural ventilation openings and a solution for reducing the solar control (g) of the semi-transparent roof panels were selected. These solutions were analysed and modified gradually and sequentially to obtain the most optimal solution, and comparative graphs were produced to analyse the consistency and causes of the results obtained (
Figure 9 and
Table 4).
3. Results
The results obtained from the on-site measurements of the current hygrothermal behaviour of the indoor covered space of the El Toscar pool show that the temperatures obtained from October to April, when the pool remains covered, exceeded 30 °C in 43% of all the measurements taken at 0.20 m height, 47% of the measurements taken at 1.80 m height and 50% of the measurements taken at 2.50 m height. Temperatures exceeded 40 °C in 10% of the measurements taken at 1.80 m height and 20% of the measurements taken at 2.50 m height. The average temperature was 30.6 °C at 0.20 m height, 31.1 °C at 1.80 m height and 31.4 °C at 2.5 m height. Additionally, the maximum temperature was 40.1 °C at 0.20 m height, 40.5 °C at 1.80 m height and 41.4 °C at 2.5 m height (
Figure 10). All these indoor temperatures are much higher than the outdoor temperatures. It should be noted that the average outdoor temperature recorded was 14.4 °C at 9:00 h, 19.6 °C at 12:00 h, 19.8 °C at 15:00 h, and 16.4 °C at 18:00 h. The maximum outdoor temperatures were recorded in April, with 23 °C at 9:00 h, 27 °C at 12:00 h, 27 °C at 15:00 h, and 25 °C at 18:00 h.
On the other hand, the average annual indoor relative humidity was 75.82%, with an annual average temperature of 31.0 °C, reaching the highest indoor relative humidity in January with a value of 98.0% at 22.7 °C, and the lowest indoor relative humidity in April with a value of 55.8% at 39.8 °C.
The plan distribution of the temperatures obtained shows that the temperatures in the areas closest to the east and south façades are slightly higher. At the time of greatest insolation, around 12:00 h, the interior space of the enclosure closest to the north façade of the roof had an average internal temperature of 30.7 °C at 0.20 m height, 31.1 °C at 1.80 m height and 31.3 °C at 2.5 m height. The interior space of the enclosure closest to the south façade of the roof had an average interior temperature of 30.7 °C at 0.20 m height, 31.2 °C at 1.80 m height and 31.8 °C at 2.5 m height. The interior space of the enclosure closest to the east façade of the roof had an average interior temperature of 30.9 °C at 0.20 m height, 31.3 °C at 1.80 m height and 31.8 °C at 2.5 m height. The interior space of the enclosure closest to the west façade of the roof had an average interior temperature of 30.4 °C at 0.20 m height, 30.9 °C at 1.80 m height and 31.1 °C at 2.5 m height. As can be seen from the measurements, the temperatures in the areas closest to the east and south facades were approximately 0.2 °C higher than the north and west areas at 0.2 m height, 0.3 °C higher at 1.8 m height and 0.5 °C higher at 2.5 m height (
Figure 11).
The results obtained from the measurements of the Infanta Cristina pool show that the temperatures obtained from October to April exceeded 30 °C in 32% of the measurements taken at 0.20 m height, 36% of the measurements taken at 1.80 m height and 40% of the measurements taken at 2.50 m height. The temperatures obtained did not exceed 40 °C in any case. The average temperature was 25.2 °C at 0.20 m height, 26.4 °C at 1.80 m height and 26.9 °C at 2.5 m height. Additionally, the maximum temperature was 35.5 °C at 0.20 m height, 36.7 °C at 1.80 m height and 37.3 °C at 2.5 m height (
Figure 12). All these indoor temperatures were also much higher than the outdoor temperatures. It should be noted that the average outdoor temperature recorded was 17.2 °C at 9:00 h, 20.3 °C at 12:00 h, 19.8 °C at 15:00 h, and 17.0 °C at 18:00 h. The maximum outdoor temperatures were recorded in April, with 26 °C at 9:00 h, 30 °C at 12:00 h, 26 °C at 15:00 h, and 23 °C at 18:00 h.
On the other hand, the average annual indoor relative humidity was 70.6%, with an annual average temperature of 26.2 °C, with the highest indoor relative humidity reached in December with a value of 81.0% at 21.8 °C, and the lowest indoor relative humidity in April with a value of 56.5% at 36.5 °C.
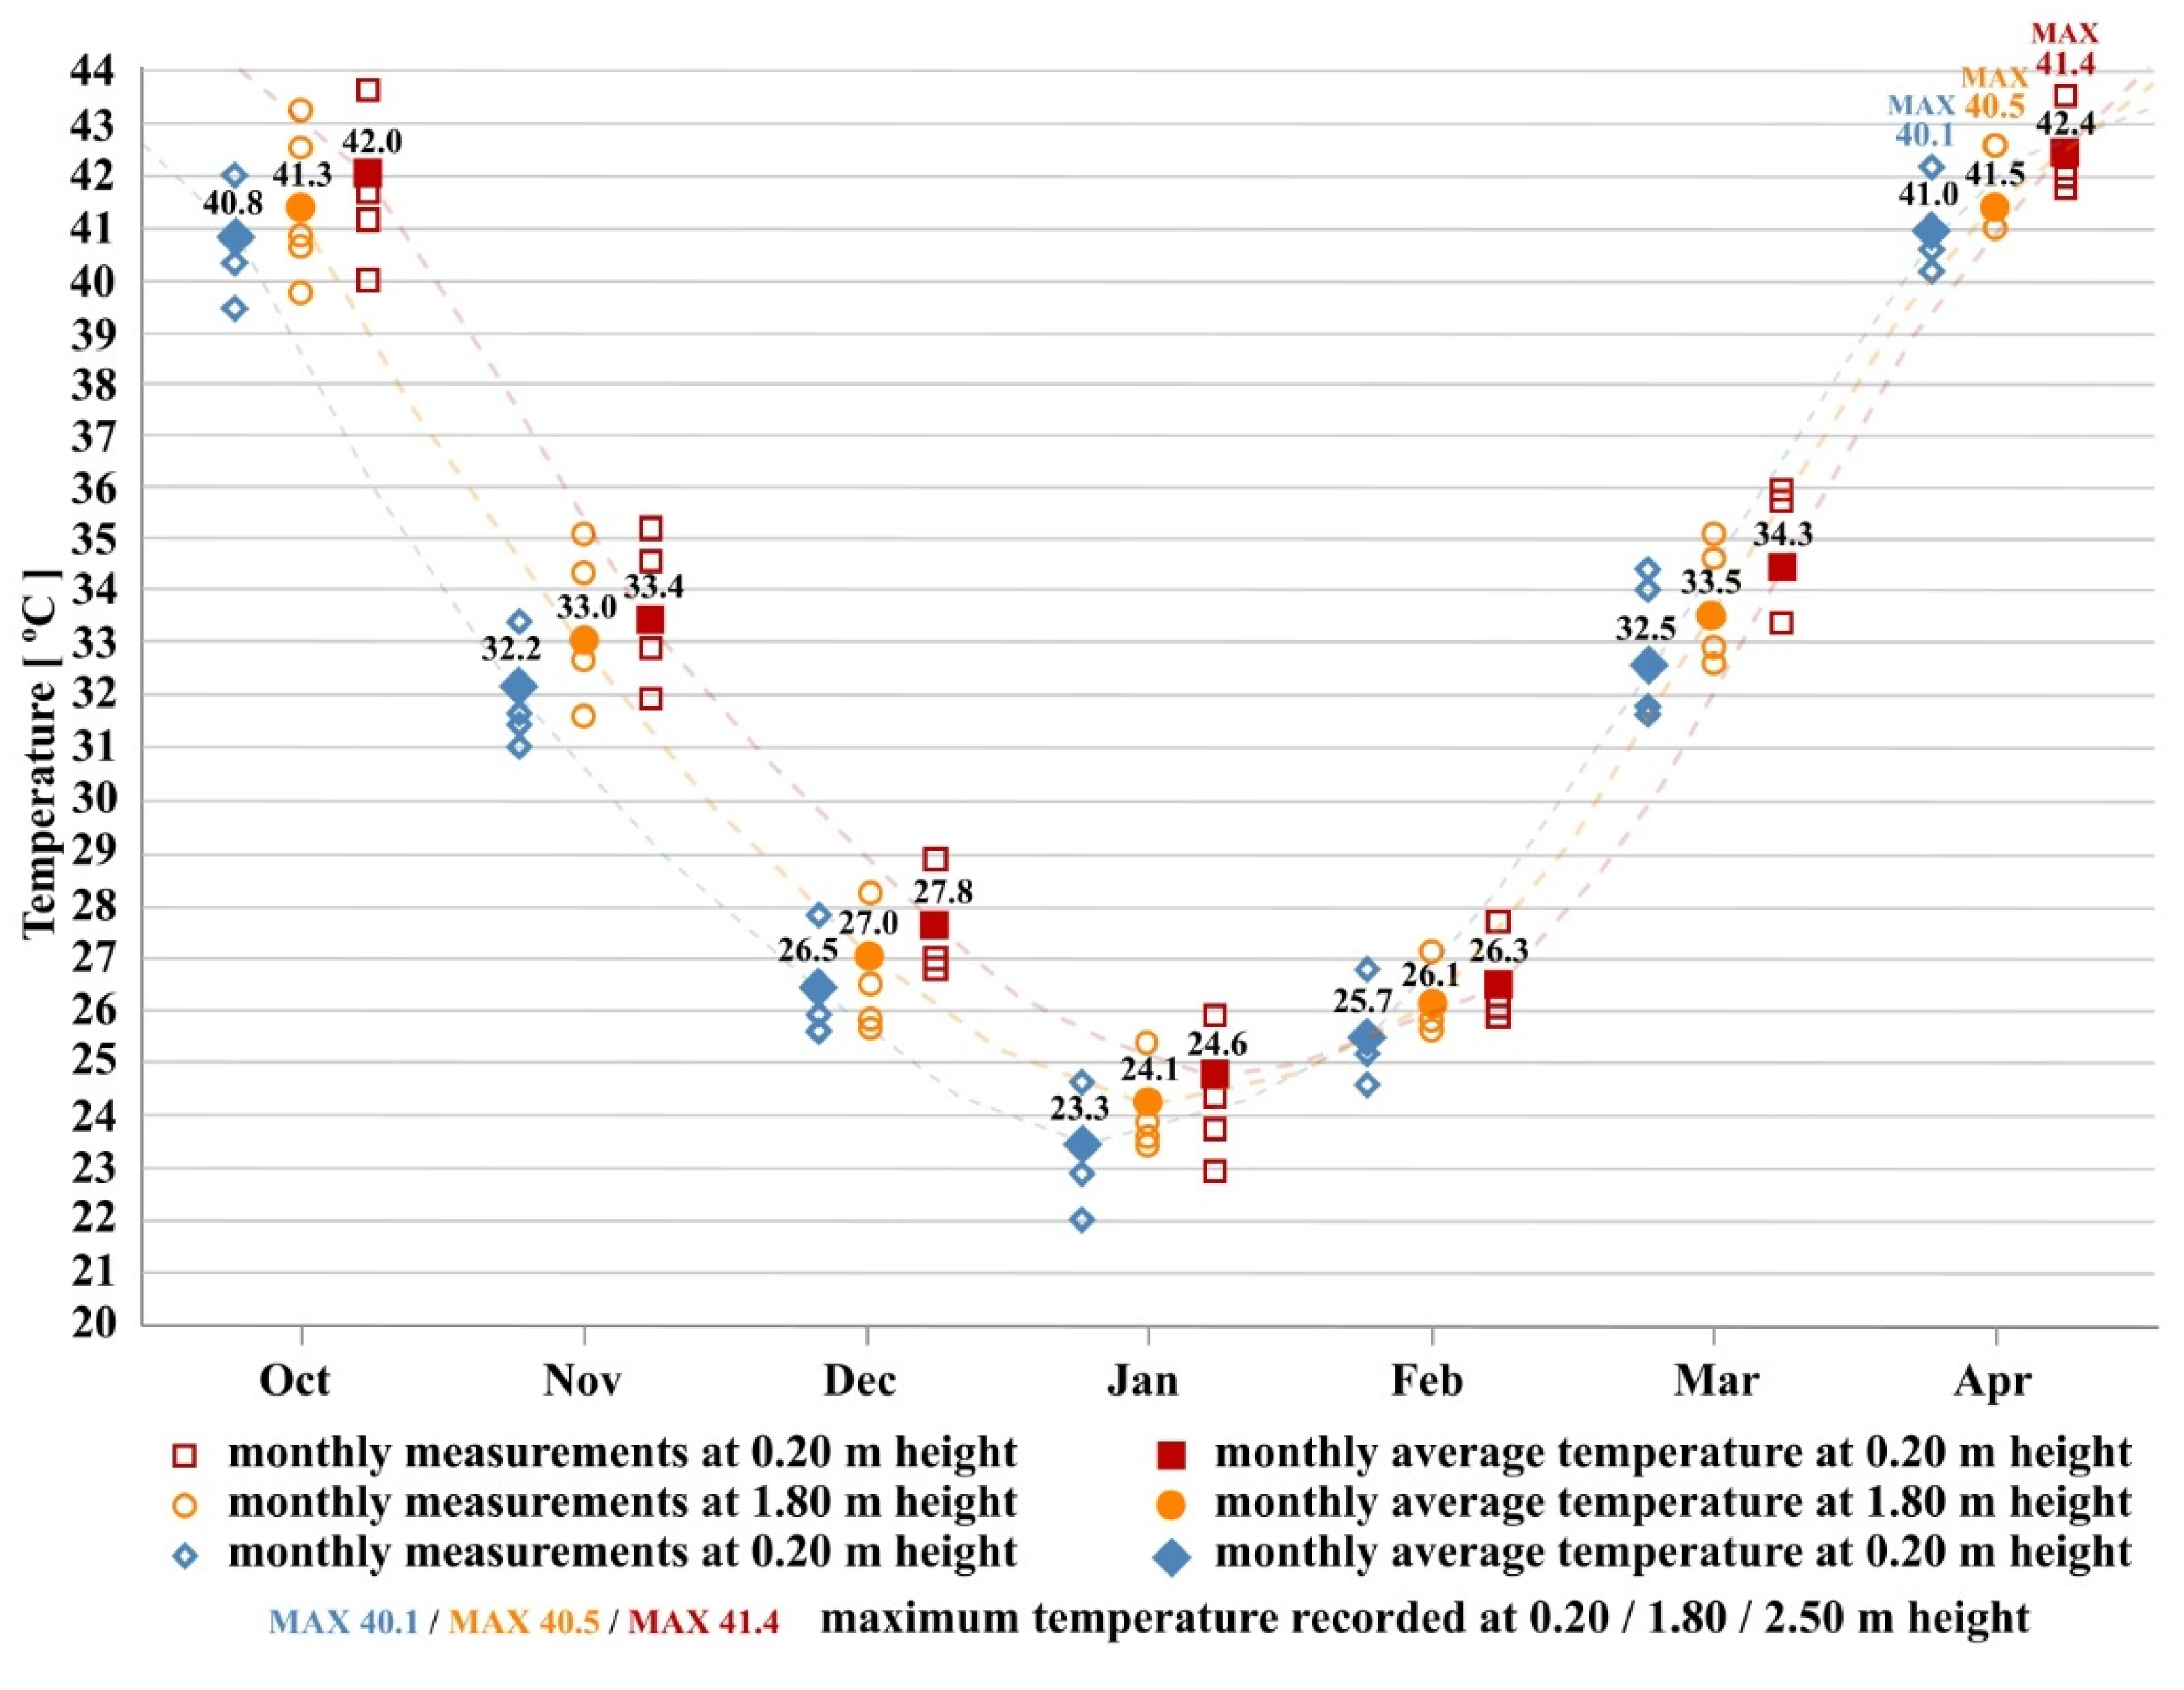
The results obtained from the measurements of the swimming pool of the Aquadel Center Sports Centre show that the temperatures obtained from October to April exceeded 30 °C in 44% of the measurements taken at 0.20 m height, 57% of the measurements taken at 1.80 m height and 66% of the measurements taken at 2.50 m height. The temperatures obtained exceeded 40 °C in 15% of the measurements taken at 0.20 m height, 22% of the measurements taken at 1.80 m height, and 33% of the measurements taken at 2.50 m height. The average temperature was 32.2 °C at 0.20 m height, 32.9 °C at 1.80 m height and 33.1 °C at 2.5 m height. Additionally, the maximum temperature was 41.0 °C at 0.20 m height, 41.5 °C at 1.80 m height and 42.4 °C at 2.5 m height (
Figure 13). As in the other two pools, all indoor temperatures were much higher than outdoor temperatures. It should be noted that the average outdoor temperature recorded was 17.8 °C at 9:00 h, 18.2 °C at 12:00 h, 18.6 °C at 15:00 h, and 15.8 °C at 18:00 h. The maximum outdoor temperatures were recorded in April, with 26 °C at 9:00 h, 30 °C at 12:00 h, 26 °C at 15:00 h, and 23 °C at 18:00 h.
On the other hand, the average annual indoor relative humidity was 77.9%, with an annual average temperature of 32.7 °C, reaching the highest indoor relative humidity in February with a value of 92.4% at 26.0 °C, and the lowest indoor relative humidity in October with a value of 62.9% at 41.4 °C.
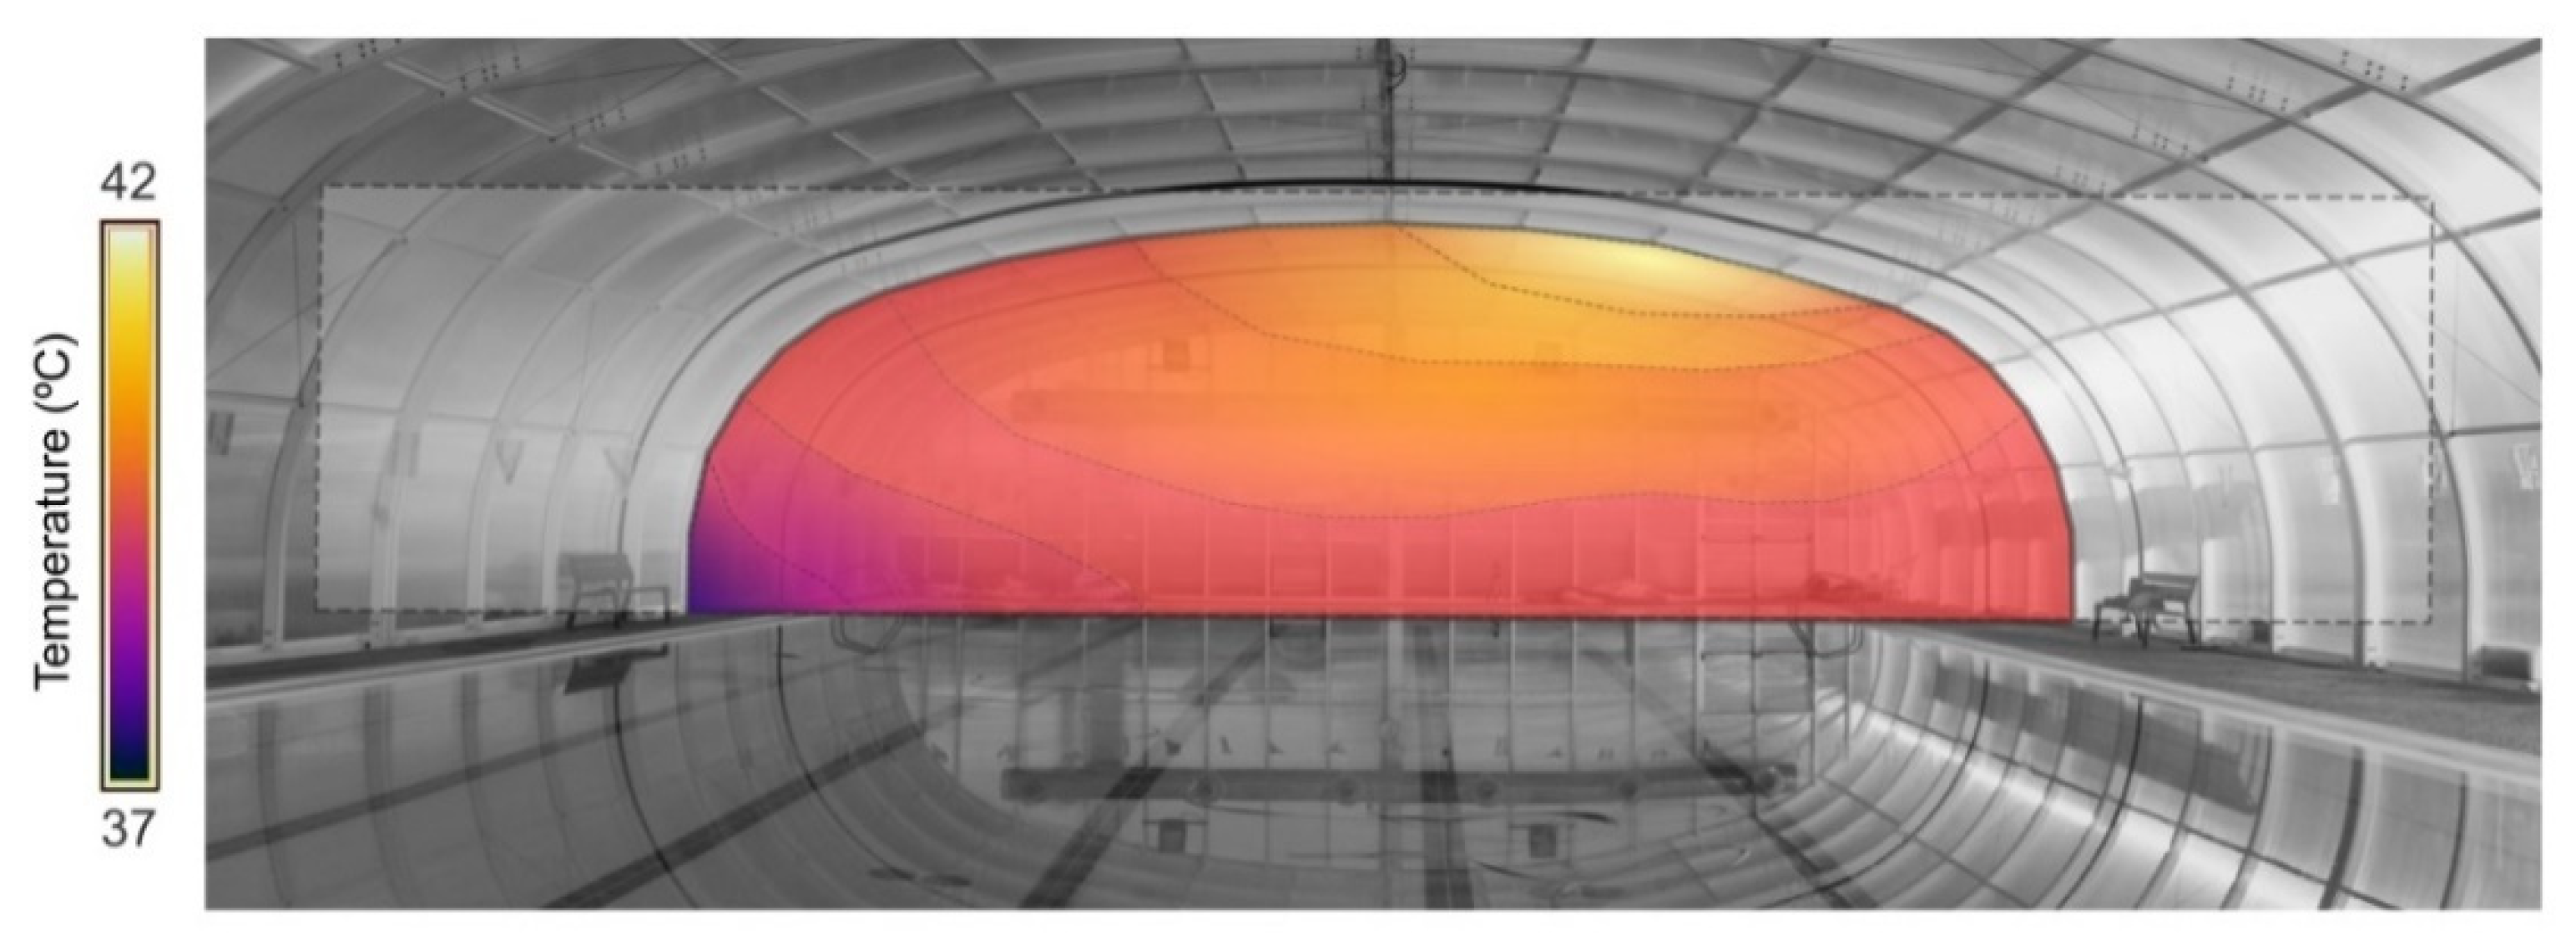
Thermographic measurements show that the temperatures of the interior surfaces of the roofs at 0.20 m height have average values of around 20 °C on polycarbonate surfaces and 5–10 °C on aluminium surfaces. At a height of 1.80 m, the average temperatures are around 25 °C for polycarbonate surfaces and 10–15 °C for aluminium surfaces. Additionally, at the top of the roofs, temperatures exceed 35 °C for polycarbonate surfaces and 40 °C for aluminium surfaces (
Figure 14).
The thermographic measurements also show that the roofs of the three pools have two areas of major energy losses. On the one hand, the profiles of the metal structure of the roof constitute an important thermal bridge. The thermo-graphic photographs show that the metal profiles have a temperature difference of more than 10 °C compared to the polycarbonate surfaces. On the other hand, the joints between the different independent sections of the retractable roof are a hot air outlet from the inside of the enclosure to the outside. The thermographic photographs show that the airtightness mat areas of the joints have a temperature difference of more than 5 °C with respect to the rest of the metal profiles of the structure. This thermal difference is caused by hot air escaping from the inside of the enclosure to the outside (
Figure 15).
With regard to the studies of incident solar radiation by means of virtual model simulation, the results obtained show that the roofs of the Elche and San Cayetano swimming pools have very similar average accumulated radiation. In the months of October, March and April, these covers reach 3000 Wh/m
2 of average accumulated radiation per day in the upper area of the cover in the south orientation, 1800 Wh/m
2 in the east orientation, and 1000 Wh/m
2 in the west orientation. In the months of November, December, January and February, the average cumulative radiation per day is less than 2000 Wh/m
2 in the upper canopy area and south orientation, 1200 Wh/m
2 in the east orientation, and 500 Wh/m
2 in the west orientation (
Figure 16 and
Figure 17). However, on the roof of the Los Alcazares pool, the average cumulative radiation is lower. In the months of October, March and April, this pool reaches 2500 Wh/m
2 of average cumulative radiation per day in the upper area of the roof, with 1500 Wh/m
2 in the east orientation, and there is hardly any average cumulative radiation in the south and west orientations, where the buildings adjacent to the pool are located and overhang the pool (
Figure 18).
On another note, the results obtained from the virtual model simulation calculations of the alternative solutions for natural ventilation and solar control of the roofs show significant improvements in the hygrothermal performance of the pools. The improvement of the results depends on the layout of the proposed natural ventilation openings and solar control.
Solution 1, consisting of 6 lateral openings in the lower part of one of the longitudinal sides of the enclosure and 6 openings in the upper part of the enclosure, causes an average reduction of 17.46% in the average monthly temperatures inside the enclosure. Considering the months from October to April when the pool is heated, the maximum reduction is reached in the month of April with a reduction of 20.40% of the average temperatures. This solution makes it possible to reduce the average monthly temperatures to below 30 °C in all the months that the cover is closed (
Figure 19a). However, during the hours of maximum sunshine, temperatures exceed 30 °C all year round, reaching over 38 °C in April (
Figure 19b).
Solution 2, consisting of 12 lateral openings in the lower part of the two longitudinal sides of the roof and 6 openings in the upper part of the roof, causes an average reduction of 20.21% of the average monthly temperatures inside the enclosure. The maximum reduction is reached in April, with a 23.65% decrease in average temperatures. This solution makes it possible to reduce the average monthly temperatures to below 30 °C every month of the year (
Figure 20a). However, during the hours of highest insolation, temperatures exceed 30 °C all year round, reaching maximum temperatures at 16:00 h of 37.45 °C in April and 39.12 °C in October (
Figure 20b). There are a total of 1530 off-set hours (above 30 °C) during the months when the roof is closed.
This solution achieves a maximum temperature of 33.52 °C at 16:00 h and a total of 180 h off setpoint in January, a maximum temperature of 34.50 °C at 16:00 h and a total of 180 h off setpoint in February, a maximum temperature of 35.68 °C at 16:00 h and a total of 240 h off setpoint in March, a maximum temperature of 37. 45 °C at 16:00 h and a total of 240 h off setpoint in April, a maximum temperature of 39.12 °C at 16:00 h and a total of 270 h off setpoint in October, a maximum temperature of 35.67 °C at 16:00 h and a total of 240 h off setpoint in November and a maximum temperature of 33.85 °C at 16:00 h and a total of 180 h off setpoint in December.
Solution 3, consisting of four openings in the upper part of the roof, causes an average reduction of 9.98% of the average monthly temperatures inside the enclosure. The maximum reduction is reached in the month of April, with a reduction of 11.00% of the average temperatures. This solution allows the monthly average temperatures to be reduced to below 30 °C every month that the roof is closed (
Figure 21a). However, during the hours of highest insolation, temperatures exceed 30 °C excessively all year round (
Figure 21b).
Solution 4, consisting of two openings in the façades of the opposite sides of the pool, causes an average reduction of 20.10% in the average monthly temperatures inside the enclosure. The reduction reaches 23.58% in the month of April. This solution allows the monthly average temperatures to be reduced to below 30 °C every month of the year (
Figure 22a). However, during the hours of highest insolation, temperatures exceed 30 °C all year round, reaching maximum temperatures at 16:00 h of 34.85 °C in April and 36.12 °C in October (
Figure 22b). There are a total of 1340 off-set hours (above 30 °C) during the months when the roof is closed.
Solution 5, consisting of six lateral openings in the lower part of the two longitudinal sides of the roof and three openings in the upper part of the roof of 40 cm, causes an average reduction of 20.12% of the monthly average temperatures inside the enclosure. The reduction reaches a reduction of 23.55% in the month of April. This solution allows the monthly average temperatures to be reduced to below 30 °C every month of the year (
Figure 23a). However, during the hours of highest insolation, temperatures exceed 30 °C all year round, reaching maximum temperatures at 16:00 h of 34.97 °C in April and 36.52 °C in October (
Figure 23b). There are a total of 1200 off-set hours (above 30 °C) during the months when the roof is closed.
This solution achieves a maximum temperature of 31.57 °C at 16:00 h and a total of 120 h off setpoint in January, a maximum temperature of 32.24 °C at 16:00 h and a total of 120 h off setpoint in February, a maximum temperature of 33.35 °C at 16:00 h and a total of 180 h off setpoint in March, a maximum temperature of 34. 97 °C at 16:00 h and a total of 240 h off setpoint in April, a maximum temperature of 36.52 °C at 16:00 h and a total of 240 h off setpoint in October, a maximum temperature of 33.35 °C at 16:00 h and a total of 180 h off setpoint in November and a maximum temperature of 31.57 °C at 16:00 h and a total of 120 h off setpoint in December.
Solution 6, using polycarbonates with a total solar transmittance of 0.46 instead of 0.86, results in an average reduction of 8.76% of the monthly average temperatures inside the building. The reduction reaches a reduction of 9.91% in the month of April. This solution allows the monthly average temperatures to be reduced below 30 °C in all the months that the roof is closed (
Figure 24a). However, during the hours of highest insolation, temperatures exceed 30 °C all year round (
Figure 24b).
Solution 7 consists of a combination of solution 6 and solution 5, the latter solution being the one that allows lower maximum temperatures and fewer total hours outside the setpoint. With this solution, which combines natural ventilation and solar protection, an average reduction of 22.20% of the average monthly temperatures inside the building is obtained. The reduction reaches a reduction of 25.87% in the month of April. This solution allows the monthly average temperatures to be reduced below 30 °C every month of the year (
Figure 25a). However, during the hours of highest insolation, temperatures exceed 30 °C from March to November, reaching maximum temperatures at 16:00 h of 32.07 °C in April and 33.65 °C in October (
Figure 25b). There are a total of 340 off-set hours (above 30 °C) during the months when the roof is closed.
With this solution, a maximum temperature of 29.98 °C at 16:00 h and a total of 0 h off setpoint is reached in February, a maximum temperature of 30.77 °C at 16:00 h and a total of 60 h off setpoint in March, a maximum temperature of 32. 07 °C at 16:00 h and a total of 90 h off setpoint in April, a maximum temperature of 33.65 °C at 16:00 h and a total of 130 h off setpoint in October, a maximum temperature of 31.02 °C at 16:00 h and a total of 60 h off setpoint in November.
Solution 7 was selected because it offers the best hygrothermal performance. The indoor air circulation was then calculated using CFD. The results obtained show that the average air velocity inside the enclosure caused by natural ventilation does not exceed 0.20 m/s (
Figure 26), meeting the environmental thermal quality requirements of the applicable regulations [
33,
34].
The outcomes obtained show that solution 7 reduces cooling needs in winter by up to 93% (
Figure 27 and
Figure 28).
Considering that the regulations allow up to 4% off-set hours per year, equivalent to 350 h per year, and considering that Solution 7 offers only 340 off-set hours (above 30 °C) during the months when the roof is closed, the cooling systems can be deactivated, and the cooling needs may not be taken into account (
Figure 29).
4. Discussion
The comparative analysis of the three pools studied according to their orientation shows that the Aquadel Center pool has a greater enclosure surface area that receives the maximum solar radiation. This is explained by the fact that the pool has a larger area of a vaulted roof with a southwest orientation and therefore has a larger area of enclosure that receives the sun’s rays perpendicular to it (
Figure 30c).
On the other hand, the Infanta Cristina pool is longer than the other two and has a building for changing rooms adjacent to the west side that reduces the surface area of the vaulted roof. In addition, there is another building very close to it that casts shade on its south façade. Due to its shape, orientation and annexed buildings, the roof of this pool is the one that receives the least sunlight perpendicular to its surface (
Figure 30b).
These aspects have a significant influence on the solar gains received by each of the three pools. The Aquadel Center pool receives the most accumulated solar radiation, and the Infanta Cristina pool receives the least, as corroborated by the solar radiation calculations (
Figure 31).
The comparative analysis of the calculations of incident solar radiation by simulation shows that the southwest-facing area of the Aquadel Center pool enclosure receives the highest amount of radiation of the three enclosures (
Figure 31c). It can also be seen that the Infanta Cristina pool enclosure has much less accumulated radiation on its south façade because it is shaded by a nearby building, and no radiation on the west-facing side because the changing room building is attached to the pool. (
Figure 31b).
These differences in solar gains from radiation allow us to understand the different indoor temperatures recorded in each pool. The comparative analysis of the three pools shows that the indoor temperatures of the Infanta Cristina pool are approximately 4 °C lower than those recorded in the El Toscar pool and 6 °C lower than those recorded in the Aquadel Center pool (
Figure 32). The results show the great influence that the different solar incidence on each roof has on the thermal behaviour of the buildings, considering that the three pools have the same construction characteristics and that they are in the same climate zone.
The analysis of the results obtained from the on-site measurements of the swimming pools shows that the temperature exceeds 30 °C at many points in the indoor covered space and even exceeds 40 °C. However, the analysis of the measurements also shows that the air temperature in the enclosure is not homogeneous. The temperature increases with height, being between 1 °C–2 °C higher at a height of 2.5 m with respect to the air temperature above the water surface and up to 4 °C higher in the higher areas of the roof.
These temperature differences are explained by the large accumulation of warm air in the upper air layers due to their lower density and by the higher heat emitted by the surfaces of the roof areas that receive more solar radiation.
The influence of solar radiation can also be seen in the plan distribution of the building’s interior temperatures. The temperature distribution shows that, at the hours of greatest sunshine, the areas of the enclosure closest to the façades that have received the most solar radiation have higher temperatures than the rest of the areas. This temperature increase is greater in the higher areas of the roof. Specifically, the indoor air temperatures in the areas close to the east and south façades located at a height of 2.5 m are between 0.5 °C and 1 °C higher than the rest of the areas (
Figure 33). These data can be explained by the fact that the thermal gradient of the indoor temperature distribution is directly influenced by the thermal radiation of the roof surfaces that have absorbed more heat because they have received more solar radiation.
The high temperatures that accumulate inside indoor swimming pool enclosures do not comply with environmental quality standards [
33,
34]. In addition, this heat build-up exaggeratedly increases the cooling demand of buildings and the energy consumption of air conditioning systems. Therefore, passive solutions were proposed to reduce the solar gains of the roofs and to allow the dissipation of excess heat from the enclosure air.
From the comparative analysis of all the proposed solutions for improving hygrothermal behaviour, solution 2 achieves the greatest reduction in the average monthly temperatures inside the enclosure, with a value of 20.21%. However, analysing the evolution of temperatures throughout the day, solution 5 achieves lower temperatures during the hours of highest insolation. With this solution, the maximum temperature at 16:00 h is 34.97 °C in April and 36.52 °C in October, which are the months of greatest sunshine when the roof remains closed. Solution 5 also has fewer off-set hours during the period when the roof is closed, with 1200 h with indoor temperatures above 30 °C.
Therefore, solution 7 was proposed by adding the advantages of the increased solar protection of solution 5 and the benefits of the natural ventilation of solution 6. This solution obtained the best results in terms of hygrothermal performance, with an average decrease of 22.20% in the average monthly temperatures inside the building. It also achieves a maximum annual temperature of 33.65 °C and only 340 h out of setpoint, which are much lower values than the rest of the tested solutions.
The analysis of the results obtained shows that natural cross-ventilation greatly facilitates the dissipation of the excess energy accumulated inside the space covered by the greenhouse effect. The different solutions proposed allow a greater or lesser thermal dissipation depending on the number and distribution of the ventilation openings. The best results are obtained with natural cross-ventilation solutions with openings located on opposite facades and at the top of the roof, such as solution 5 (
Figure 34). This is explained by the fact that as the openings are distributed on two façades with opposite orientations, cross-ventilation is enhanced by the natural flow of airflow due to differences in pressure and temperature.
In addition, the difference in height between the façade openings and the upper openings facilitates the natural upward flow of warm air towards the roof ridge.
On the other hand, in cases 5 and 7, as the openings are distributed along the vault, the air flow is better distributed without generating discomfort to the user and with air velocities below the limit established by the regulations. As can be seen in the CFD calculations (
Figure 26), solution 7 distributes the air inlet and outlet in several openings that dissipate the air flow by reducing its velocity, thus avoiding discomfort to users.
Finally, the combination of natural cross-ventilation with greater solar control of the semi-transparent envelope significantly optimises the results and reduces the greenhouse effect (
Figure 35) and the interior temperatures of the enclosure to comply with regulations. As can be seen from the results obtained with solution 7, the combination of solutions 5 and 6 (
Figure 36) makes it possible to reduce the average indoor temperatures to below 30 °C all year round and the temperatures by time bands in the months when the roof is in use to below 30 °C, with only 340 h per year outside the set point.
The reduction of heat loads due to solar gains and the reduction of the indoor ambient temperature contribute to a significant reduction of the total cooling needs of the building and to a reduction of the cooling energy consumption (
Figure 37).
Other publications have already explained the great influence of solar radiation on the thermal behaviour of buildings in climates with high annual insolation. However, this work shows how solar gains can lead to excessively high temperatures in buildings located in this climate zone, especially if they have high thermal loads and a large glazed surface, such as heated swimming pools or sports fields.
The results obtained show that the problem of thermal discomfort in the pools studied is not caused by the temperature of the outside environment but by the thermal gains caused by the high solar radiation throughout the year in this climate. This is explained by the fact that the air inside the glazed enclosure reaches temperatures much higher than outside temperatures due to the greenhouse effect inside the covered space.
Although the roofs studied in this study make it possible to take advantage of the greenhouse effect to heat the covered space passively, reducing heating consumption in winter; the lack of control of this overheating generates problems of excess temperature. Furthermore, as the envelope is not breathable, it complicates the reduction of the high relative humidity inside the covered spaces.
Uncontrolled heating raises temperatures to the point where they do not comply with regulations. This problem occurs not only in the summer months, when the covers are open, and the pools are not heated, but also in most months of the year. As a result, the overheating of the enclosure leads to high cooling consumption. The increase in indoor temperature favours a reduction in the relative humidity of the environment, with comfortable humidity values below 60% in the warmer months and values higher than 90% in the colder months. However, due to the semi-transparent and watertight covers, the excess heat caused by solar radiation and the greenhouse effect generates a lot of evaporation and causes surface condensation on the inside face of the enclosure all year round. This is because there is an increase in the specific humidity (W) due to the evaporation of the water film higher than the increase in the saturation vapour pressure (Ws) that it could contain at the same temperature. As a result, the relative humidity (RH) increases, reaching values close to the dew point.
In conclusion, uncontrolled overheating leads to a lack of energy savings due to excessive cooling needs and consumption, a lack of thermal comfort due to excessive indoor air temperature, and a lack of healthiness due to excessive relative humidity and condensation. Improved solar control and natural ventilation are particularly effective in reducing the building’s thermal loads and renewing the indoor air.
Other previous work and research on energy efficiency in heated swimming pools also offer large reductions in energy consumption but use active systems or are based on other passive systems [
60,
61].
Different publications have explained the advantages of passive systems such as solar shading and natural ventilation to achieve thermal comfort and less consumption of air conditioning systems [
62,
63,
64]. However, these other investigations focus on buildings with other uses and climate zones. However, this work allows us to quantitatively and qualitatively verify the great potential of these passive systems, specifically in sports buildings with large glazed surfaces and high thermal loads located in climates with high annual sunshine and warm or hot temperatures, such as the dry Mediterranean BShs climate.
The improvement of thermal and energy performance achieved in this work could be further enhanced by applying analytical multi-objective optimization methods [
65,
66]. These types of methods make it possible to replace parametric studies with algorithms, optimizing the calculations to be carried out with energy simulation software [
67,
68,
69].
This research can be adapted to other types of buildings, taking into account that they will have lower internal loads than heated swimming pools and comfort temperatures between 21 °C and 25 °C according to Spanish regulations [
33,
34]. As a consequence, the greenhouse effect will be lower, and cross-ventilation and solar control can contribute to maintaining an adequate temperature for many months of the year. However, additional passive and active systems are needed to ensure comfortable temperatures on the hottest summer days and are being studied in further research.


