1. Introduction
The rapid deterioration of the global ecological environment is a major crisis facing human survival and development in the 21st century, which has become one of the focuses of the international community [
1]. With the rapid development of the world vehicle industry, the contradiction between the vehicle industry and environmental protection has become increasingly prominent [
2]. The damage of vehicles to the ecological environment is multifaceted, which is mainly reflected in resource consumption, air pollution, greenhouse effect, traffic noise, and so on [
3]. In addition, the energy consumed by vehicles in many countries accounts for a large share of the total energy consumption of transportation. It can be seen that when the vehicles bring convenience to mankind, they also become the culprit of damaging the environment and the largest consumer of energy, and have an unshirkable responsibility for the pollution of the ecological environment, and would gradually become a serious economic and even social issues which could affect the global sustainable development [
4].
With the concept of green sustainability gradually pushed to the vehicle industry and the continuous upgrading of environmental protection requirements, the vehicle production process pays more and more attention to the energy-saving growth mode of low consumption, low emissions and high efficiency [
5]. Under the development trend of “green, energy saving and environmental protection” in the vehicle industry, how to deal with the relationship between the vehicle industry and environmental protection, reduce the impact of the vehicle production and consumption process on the environment, and deeply study the vehicle energy-saving technology is conducive to China’s environmental protection and energy security, and realize the sustainable development among human, resources and environment in the field of the vehicle industry.
The development of the vehicle industry promotes social production, but at the same time, we could not ignore its negative impact on the environment. In order to make the vehicle industry pursue its own development while taking into account the environmental protection, and then become a crowd-pleasing ecological industry, it is necessary to strengthen scientific research and capital investment from the aspects of vehicle engineering technology, and take various reasonable and effective measures and schemes [
6,
7]. In particular, the researchers engaged in the vehicle or related industries should take action to adopt new energy-saving technologies and strengthen management, so as to protect the environment and finally achieve sustainable development of the vehicle industry. It can be said here that intensifying the deep understanding of the relationship between environmental protection and vehicle industry, as well as establishing the correct development idea and direction have become the key to the sustainable development of the vehicle industry [
8].
A large number of studies have shown that improving the vehicle’s shifting smoothness could help the driver to be engaged in green driving as much as possible, so as to effectively reduce the environmental pollution and save energy [
9,
10,
11]. Shifting smoothness refers to the size and degree of frustration and impact that could be perceived by a human body in the process of vehicle shifting [
12]. The unsmooth shifting process is a common problem in vehicle driving, which would directly affect the driver’s vehicle control and interfere with the relationship between fuel consumption, emission and driver personality [
13]. The frustration caused by the discordant shifting behavior would debase the driver’s enjoyment of driving, which is easy to cause the driver to feel fatigued, affect the driver’s green driving and operational efficiency. In addition, the impact phenomenon in the shifting process would also have an adverse impact on the stability, safety, energy consumption and service life of the whole vehicle [
14,
15]. In recent years, with the development of the times and the improvement of high intelligence technology, the commercial vehicle users are not only satisfied with the vehicle’s ability to complete engineering operations, but also pay more and more attention to the comprehensive quality in terms of the vehicle gearshift performance [
16]. Particularly in the crowded urban environments, the driver is very susceptible to the comfort and smoothness of the shifting process, which directly affects the driver’s evaluation of multiple vehicle brands and models.
To sum up, the gearshift performance of vehicle transmission would be connected to and affect the vehicle driveability to a great degree. As the carrier of human–computer interaction in the vehicle, the shifting control mechanism should have good handling reliability and portability. The shifting smoothness of vehicles has gradually become an important index to evaluate the comprehensive performance of vehicles. In the shifting control process of the vehicle gearbox, it is necessary to conduct a comprehensive analysis of vehicle gearshift performance to master the main limiting factors that may potentially affect the shifting smoothness, and then continuously optimize and explore the gearshift performance of the vehicle gearbox from diverse aspects, so as to make the vehicle shifting operation more efficient in the driving process. Therefore, improving the shifting smoothness and reducing shift impact are of great significance to promote the quality of the whole vehicle, and further provide impetus to the sustainable development of the vehicle industry, which is exactly the purpose and meaning of this paper.
The remainder of this paper is organized as follows:
Section 2 provides a description of the related work and the research background for the performance testing of shifting control system;
Section 3 explains the methodology and testing analysis of shifting control performance used in this paper;
Section 4 presents the results of gear shifting system, corresponding discussions and findings for this study;
Section 5 presents the conclusions and future work related to this study.
2. Performance Testing of Shifting Control System
With the continuous improvement of the market requirements for vehicle driving comfort and energy saving, the gearshift performance of many existing vehicle gearboxes in the domestic market is too poor to meet the higher and higher requirements of the consumers [
17]. As a result, major vehicle enterprises are actively exploring reasonable evaluation methods and evaluation indicators for vehicle gearshift performance, in order to design better vehicle products and enhance the market competitiveness of vehicle products.
There are mainly two methods in use for the functional testing and evaluation of the vehicle shifting control system: test evaluation in subjectivity and test evaluation in objectivity [
18,
19]. Test evaluation in subjectivity is an important method, which accounts for a very large proportion. Generally, multiple drivers with skilled driving experience or professional training are appointed to drive similar test sample vehicles for a period of time, and assign scores to the shifting characteristics of the vehicle according to their subjective feelings through multiple tests, and then obtain the evaluation value of the vehicle by statistical analysis.
Many experts and scholars have made efforts to conduct a lot of research on subjective test evaluation. The authors of [
20] propose a subjective evaluation method of the vehicle shifting quality based on D-S evidence theory, which overcomes the fuzziness and uncertainty of traditional subjective evaluation. In [
21], the subjective feeling of drivers and passengers in the process of shifting is thoroughly studied, and four objective evaluation indexes are proposed based on the acceleration in the process of shifting. The work in [
22] summarizes and formulates the subjective evaluation table and scoring mechanism according to the market feedback, ergonomics and system design concept, which provides a data basis for improving the shifting quality of their self-developed vehicle models. However, test evaluation in subjectivity has the characteristics of contingency, subjectivity and discreteness. This resulted in the operator being able to only roughly classify the shifting quality, but not being able to carry out specific and accurate quantitative analysis, and so is not convenient for optimal design. Therefore, it is of great significance to build a simple and accurate objective test system.
In recent years, with the rapid development of the vehicle industry, the corresponding objective testing theory and technology for the vehicle gearshift performance have been progressively improved and deepened, mainly involving roadway tests and bench tests [
23]. The roadway test is carried out under the driving conditions of the actual road, mainly based on empirical judgment, heavily weighted in qualitative analysis, and it has high requirements for the experience and quality of the test personnel. It is easily affected by road conditions, traffic jams, weather, environment, safety and other test conditions. Relatively stable trial pavement sections are needed to ensure the test effect, which is difficult to achieve in modern cities with increasingly tight traffic. The restriction of the roadway test conditions affects the test scope and content to some extent, which poses certain limitations [
24,
25]. Therefore, the bench test technology suitable for the indoor test of the whole vehicle urgently needs to replace the road test.
With many years of development, major vehicle enterprises at home and abroad have formed a set of standardized testing standards and complete testing equipment for bench test. The test system has developed from a single function in the past to a diversified, intelligent and comprehensive gearshift performance test platform, including research on acceleration and deceleration shifting characteristics under no-load or load conditions, as well as the slip measurement for forward gear and reverse gear, respectively [
26]. SWRL Company from the United States has adopted the design of a full electronic control system and launched an electronically driven vehicle shifting actuator with electronic control drive mode, which could effectively avoid the problem of interference in the shifting process [
27]. The shifting robot arm designed by Japanese auto Max Company has stable and reliable performance, good flexibility and high precision, which could effectively simulate the shifting action of vehicle gearbox and realize the full automatic control of the bench test [
28].
A large number of bench tests on the gearshift performance have also been carried out in China [
29,
30,
31]. The works in [
32,
33] draw lessons from AMT control theory and control method of automatic gearbox, and make full use of the virtual instrument technology to establish an versatile test bench of vehicle gearbox with a high degree of automation, high acquisition accuracy and comprehensive safety monitoring, which could be used for shifting tests, clutch tests and transmission efficiency tests for different transmission types of vehicle gearboxes. In [
34], trial data from bench tests are used to establish the main component models of each shifting position and synchronizer in a parametric way in UG software, and calculates the shifting elements of the synchronizer under the ideal state, which would reflect the vehicle gearshift performance to a certain extent. However, the bench test is basically driven by motor or cylinder, and mainly relies on one or more groups of the variable inertia flywheels to simulate the working conditions during the running of the vehicle [
35]. Its visible deficiency is that it is separated from human participation, and does not consider the shifting characteristics of the vehicle gearbox from the perspective of the working conditions of the whole vehicle.
It can be seen from the above that under the pressure of increasingly stringent environmental standards, cost control and R&D cycle, the advanced system analysis tools and the new-type test processes are key to the development of innovative products [
36]. The implementation of a GSA test system in the analysis and evaluation of vehicle shifting quality presented in this study is facing such an urgent requirement, which would provide an effective evaluation method and index for the objective evaluation of the vehicle gearshift performance. The system analysis tool could not only help the engineers analyze the product design with a greater degree of freedom, but also improve the efficiency of the integrated software development process of the whole vehicle. Especially in different design and implementation stages of vehicle gearbox, we could predict and evaluate the gearshift performance completely through the simulation analysis method, and then find out the possible causes of the shifting problems from the objective test data in combination with the subjective evaluation, and finally put forward reasonable solutions and improvement schemes to improve the product performance and design efficiency. Its purpose is to further impel the reduction of vehicle energy consumption and emission in an attempt to improve the competitiveness of vehicle powertrain in power, economy and comfort.
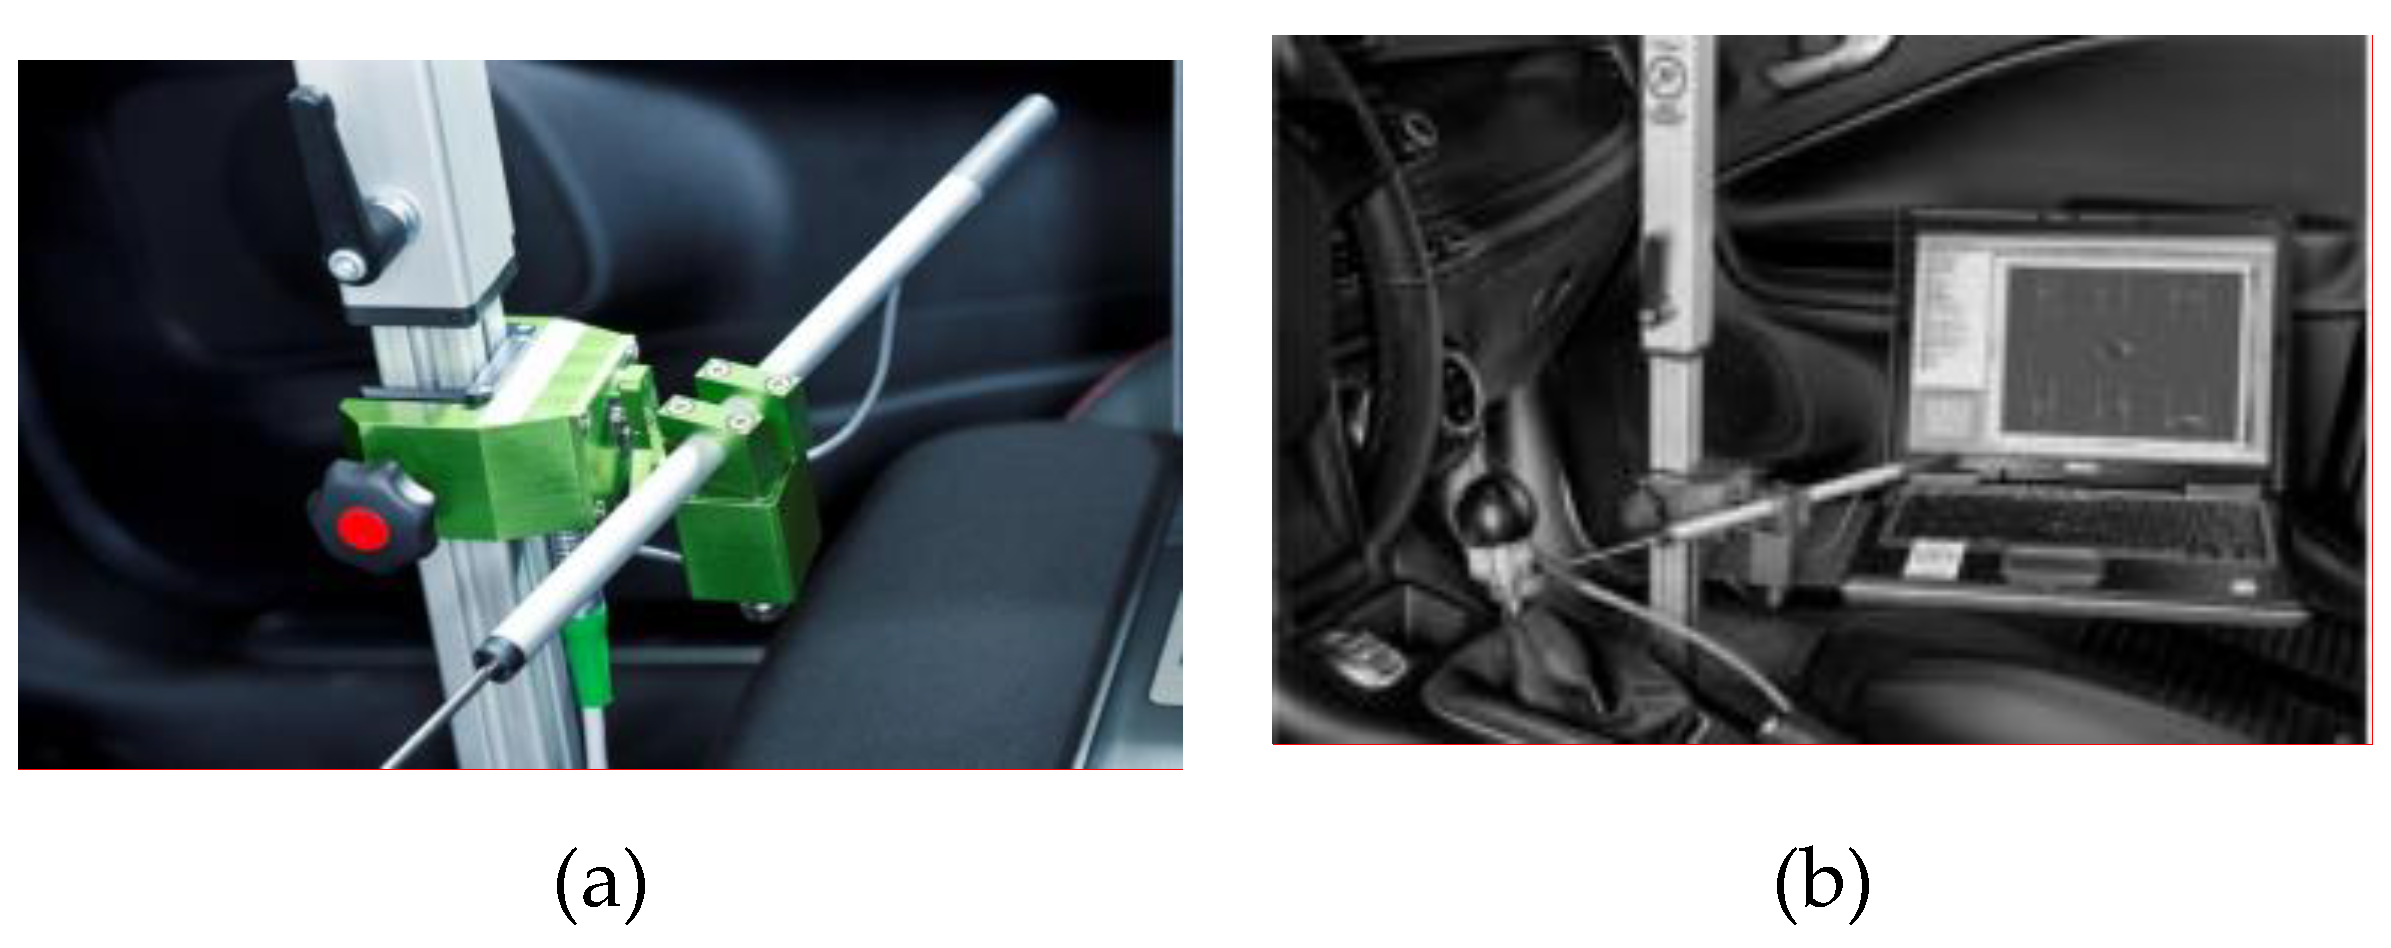
In this paper, the proposed on-board GSA test data acquisition and analysis system for the vehicle shifting characteristics is an electromechanical integration detecting device based on real vehicles. It constructs an objective evaluation index to describe the shifting characteristics combined with static and dynamic test. The system would collect objective data from the position of the shift ball head through multiple types of force sensors in the on-board environment, and then import the shifting force, shifting stroke and other parameters collected during the operation of the tester into the shifting quality evaluation system, and then automatically generate the test analysis report and evaluation results (as shown in
Figure 1). Among them, the users could freely set the software output content according to their needs, and then represent the relationship between different parameters in the form of a two-dimensional diagram, or conduct off-line analysis to evaluate the gearshift performance of vehicle gearbox. The main test item categories involved in this study include:
- (1)
Gear clarity. H pattern of the vehicle is detected by measuring the shifting trace at the shift handle. H pattern is a principal indicator for evaluating the clearness of the shifting position.
- (2)
Gear selection and shifting test. Testing the shifting force, selection force and travel range.
- (3)
Free play. The dimension of free play is directly related to the preciseness of the shifting position selection. It is generally established that the free gap control at 30 × 15 is better. If the dimension of free play is a bit large, it would have a significant influence on the shifting accuracy, which would make it troublesome in searching for an accurate shifting position.
- (4)
Dynamic shift. If the synchronization impulse is rather large, the synchronization time is rather long, and the synchronizer capacity is rather large, and if there is no timely synchronization implementation, the driver may find it hard to complete the shifting operation.
The attractive highlights of this study are mainly reflected in two points. One is that the researchers recognize and analyze the vehicle gearshift performance from a quantifiable perspective, which could give scientific guidance to the vehicle simulation model and bench test. The other is that the situation analysis of the vehicle shifting process on the whole vehicle makes the result closer to the actual operation of the driver.
It is the common duty and target of the stakeholders in the global vehicle domain to strive to promote the sustainable development of the vehicle industry. This study applied it to the commercial vehicle gearbox for objective testing and analysis of gearshift performance, combined with the subjective experience of testing and evaluation in previous studies, so a relatively comprehensive test evaluation method in objective aspects would be established. The comprehensive evaluation process based on the combination of subjective and objective evaluation of gearshift performance could assist the relevant technicians to estimate the gearshift performance of vehicle gearbox at all stages of development systematically and comprehensively. As the novel way of using objective tests to explain the subjective phenomenon could more intuitively detect the data feedback of gearshift performance under various operating modes, the most appropriate evaluation parameters on the operating performance could be debugged by reflecting the data on the test software, and then the comprehensive energy efficiency of the vehicle shifting system could be improved, enhancing the sustainable development of the vehicle industry, which would inevitably exert a positive impact on ensuring global energy security, coping with climate change and improving the ecological environment, which would be an important engine for promoting the sustainable growth of the global economy in the future.
3. Testing Analysis of Shifting Control Performance
The vehicle shift process starts from the moment the driver depresses the clutch, and then the driver manipulates the shift ball head with one hand and passes through the shift cable to engage or disengage the synchronizer of the transmission. Here, the synchronizer would play an important role in transmitting the force acting on the shift joystick to the shift fork through a series of transmission mechanism. Then, the shift fork pushes the gear sleeve of the synchronizer, and the gear sleeve continues to push the lock ring, so that the conical surface of the lock ring contacts with the conical surface of the engaged gear to produce frictional force, so as to reduce the angular velocity difference between the output end and the input end of the synchronizer to zero, and finally complete synchronization.
In general, the vehicle shifting process should be stable, impact-free and gentle, and the wear of various components should be minimized, so as to improve fuel economy and prolong service life. The vehicle shifting process, in short, is the process of vehicle transmission ratio change, and it is also the process of coordinated operation of engine, clutch and gearbox, including many control stages, such as clutch separation, gear removal, gear selection and gear engagement, as well as clutch combination, and so on. The factors affecting the gearshift performance are not only related to the structure of the gearbox and the performance of components and parts, but also related to the control mechanism and even the whole shifting system. Here, the vehicle shifting system includes three parts: shift joystick, shift actuator and shift transmission mechanism. It is an important component connecting the driver and the vehicle. The quality of the system directly affects whether the shifting action is stable and the shifting result is accurate.
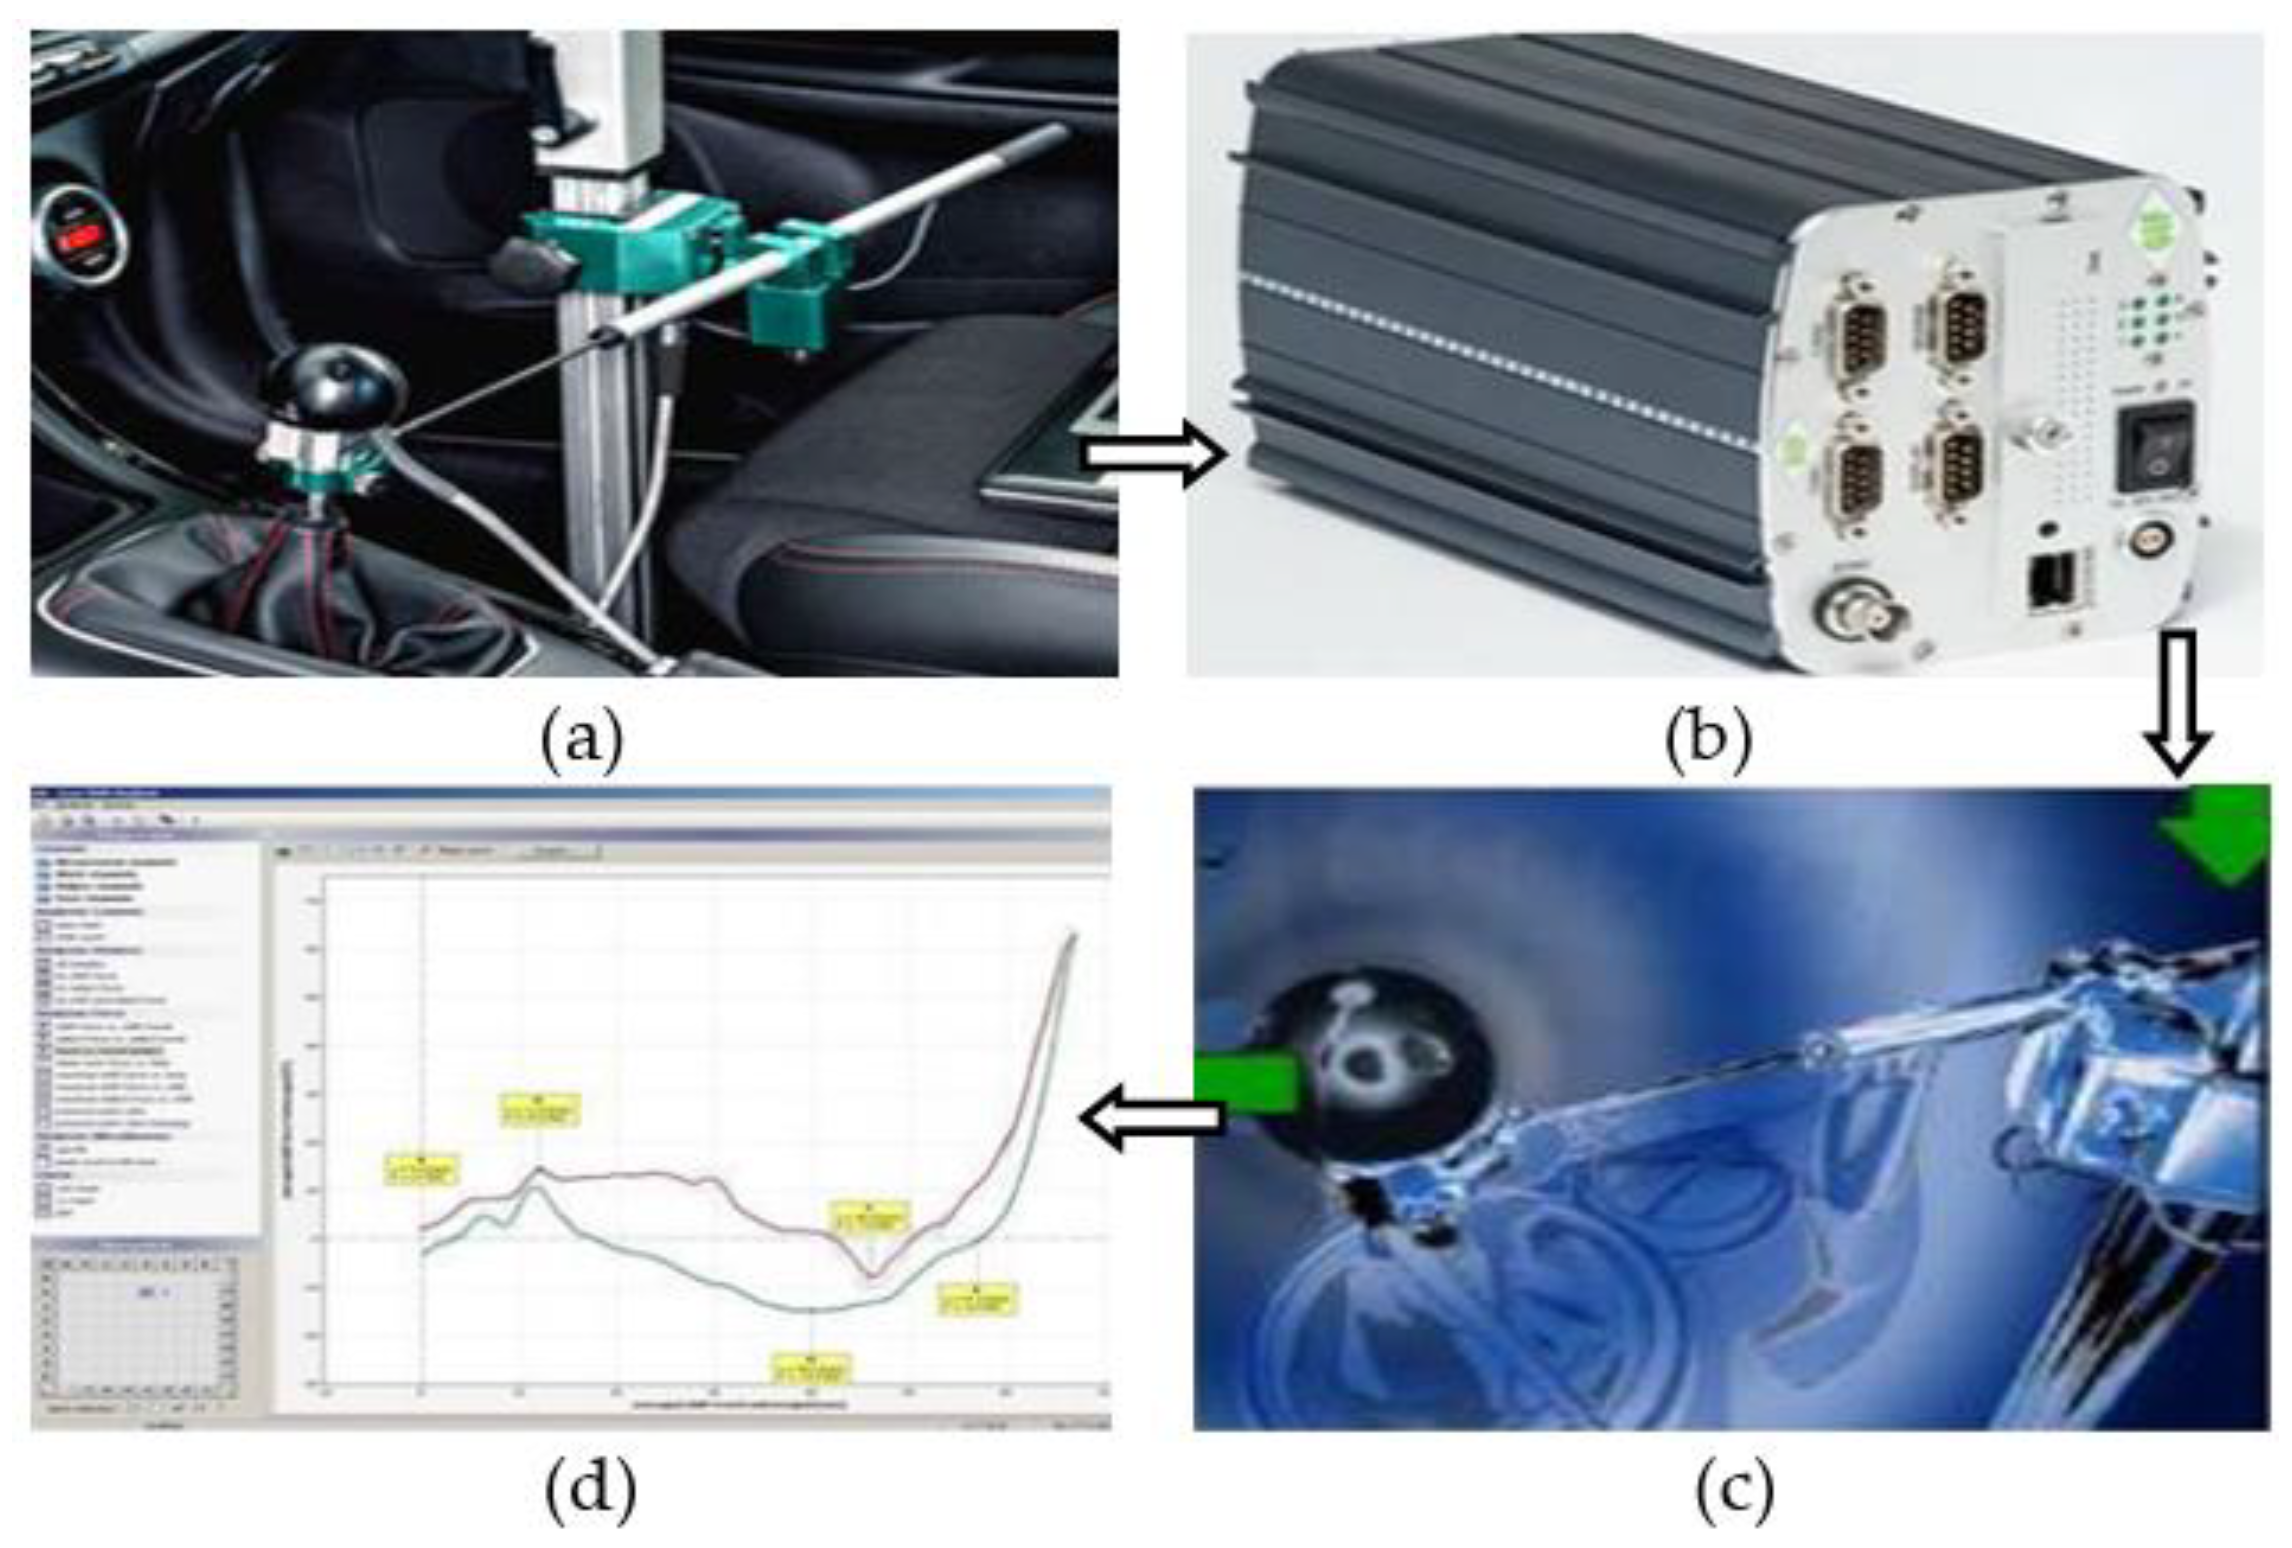
With the background of reviewing the current research on vehicle shifting quality and the development of shifting test technology at home and abroad, this paper focuses on the test system method of vehicle shifting characteristics based on GSA, and designs the corresponding on-board GSA test system and test method for the commercial sample vehicle provided by cooperative institutions, as shown in
Figure 2. The whole work flow could be described as follows: firstly, analyze the test requirements of on-board test of vehicle shifting characteristics, for there are many factors to be considered in the demand analysis, including clarifying the measurement parameters and functional requirements, preparing to make up the hardware experimental platform of the test system, laying special emphasis on selecting angle displacement sensor to collect signals in addition to linear displacement sensor, so as to ensure high test accuracy, for the track of the shift lever is not a straight line, but an arc in the actual shifting process, and then programming the software part of the test system with the development tools built in GSA system. Secondly, take the real vehicle test as the data acquisition platform, set up the on-board test system on the real vehicle equipped with a certain type of gearbox, collect the feature parameters signals used to represent the vehicle gearshift performance through the corresponding multichannel sensors installed on the vehicle, especially giving more prominence to the sampling frequency and sampling accuracy, so as to ensure the authenticity and effectiveness of the sampling data, and then process the collected pre-test and post-test data in detail in the acquisition interface, display them dynamically and intuitively, and then store the test data simultaneously, so as to facilitate the staff to call the test data at any time for off-line analysis. Thirdly, debug and summarize the implementation path of the detection method in the real vehicle environment, obtain the program block diagrams and index change charts under different detection conditions, analyze the pre-test and post-test results of the on-board test in detail, and then evaluate the gearshift performance of the tested gearbox.
The establishment of the whole test evaluation solution has far-reaching significance for the research of shifting quality evaluation systems, striving to alleviate the associated ecological burden throughout the operation cycle of the vehicle’s drivetrain, realize the mutually beneficial situation between environmental protection and economic benefits, contribute to mitigating climate change and solving environmental problems, and continue to assist in the pursuit of low-carbon society.
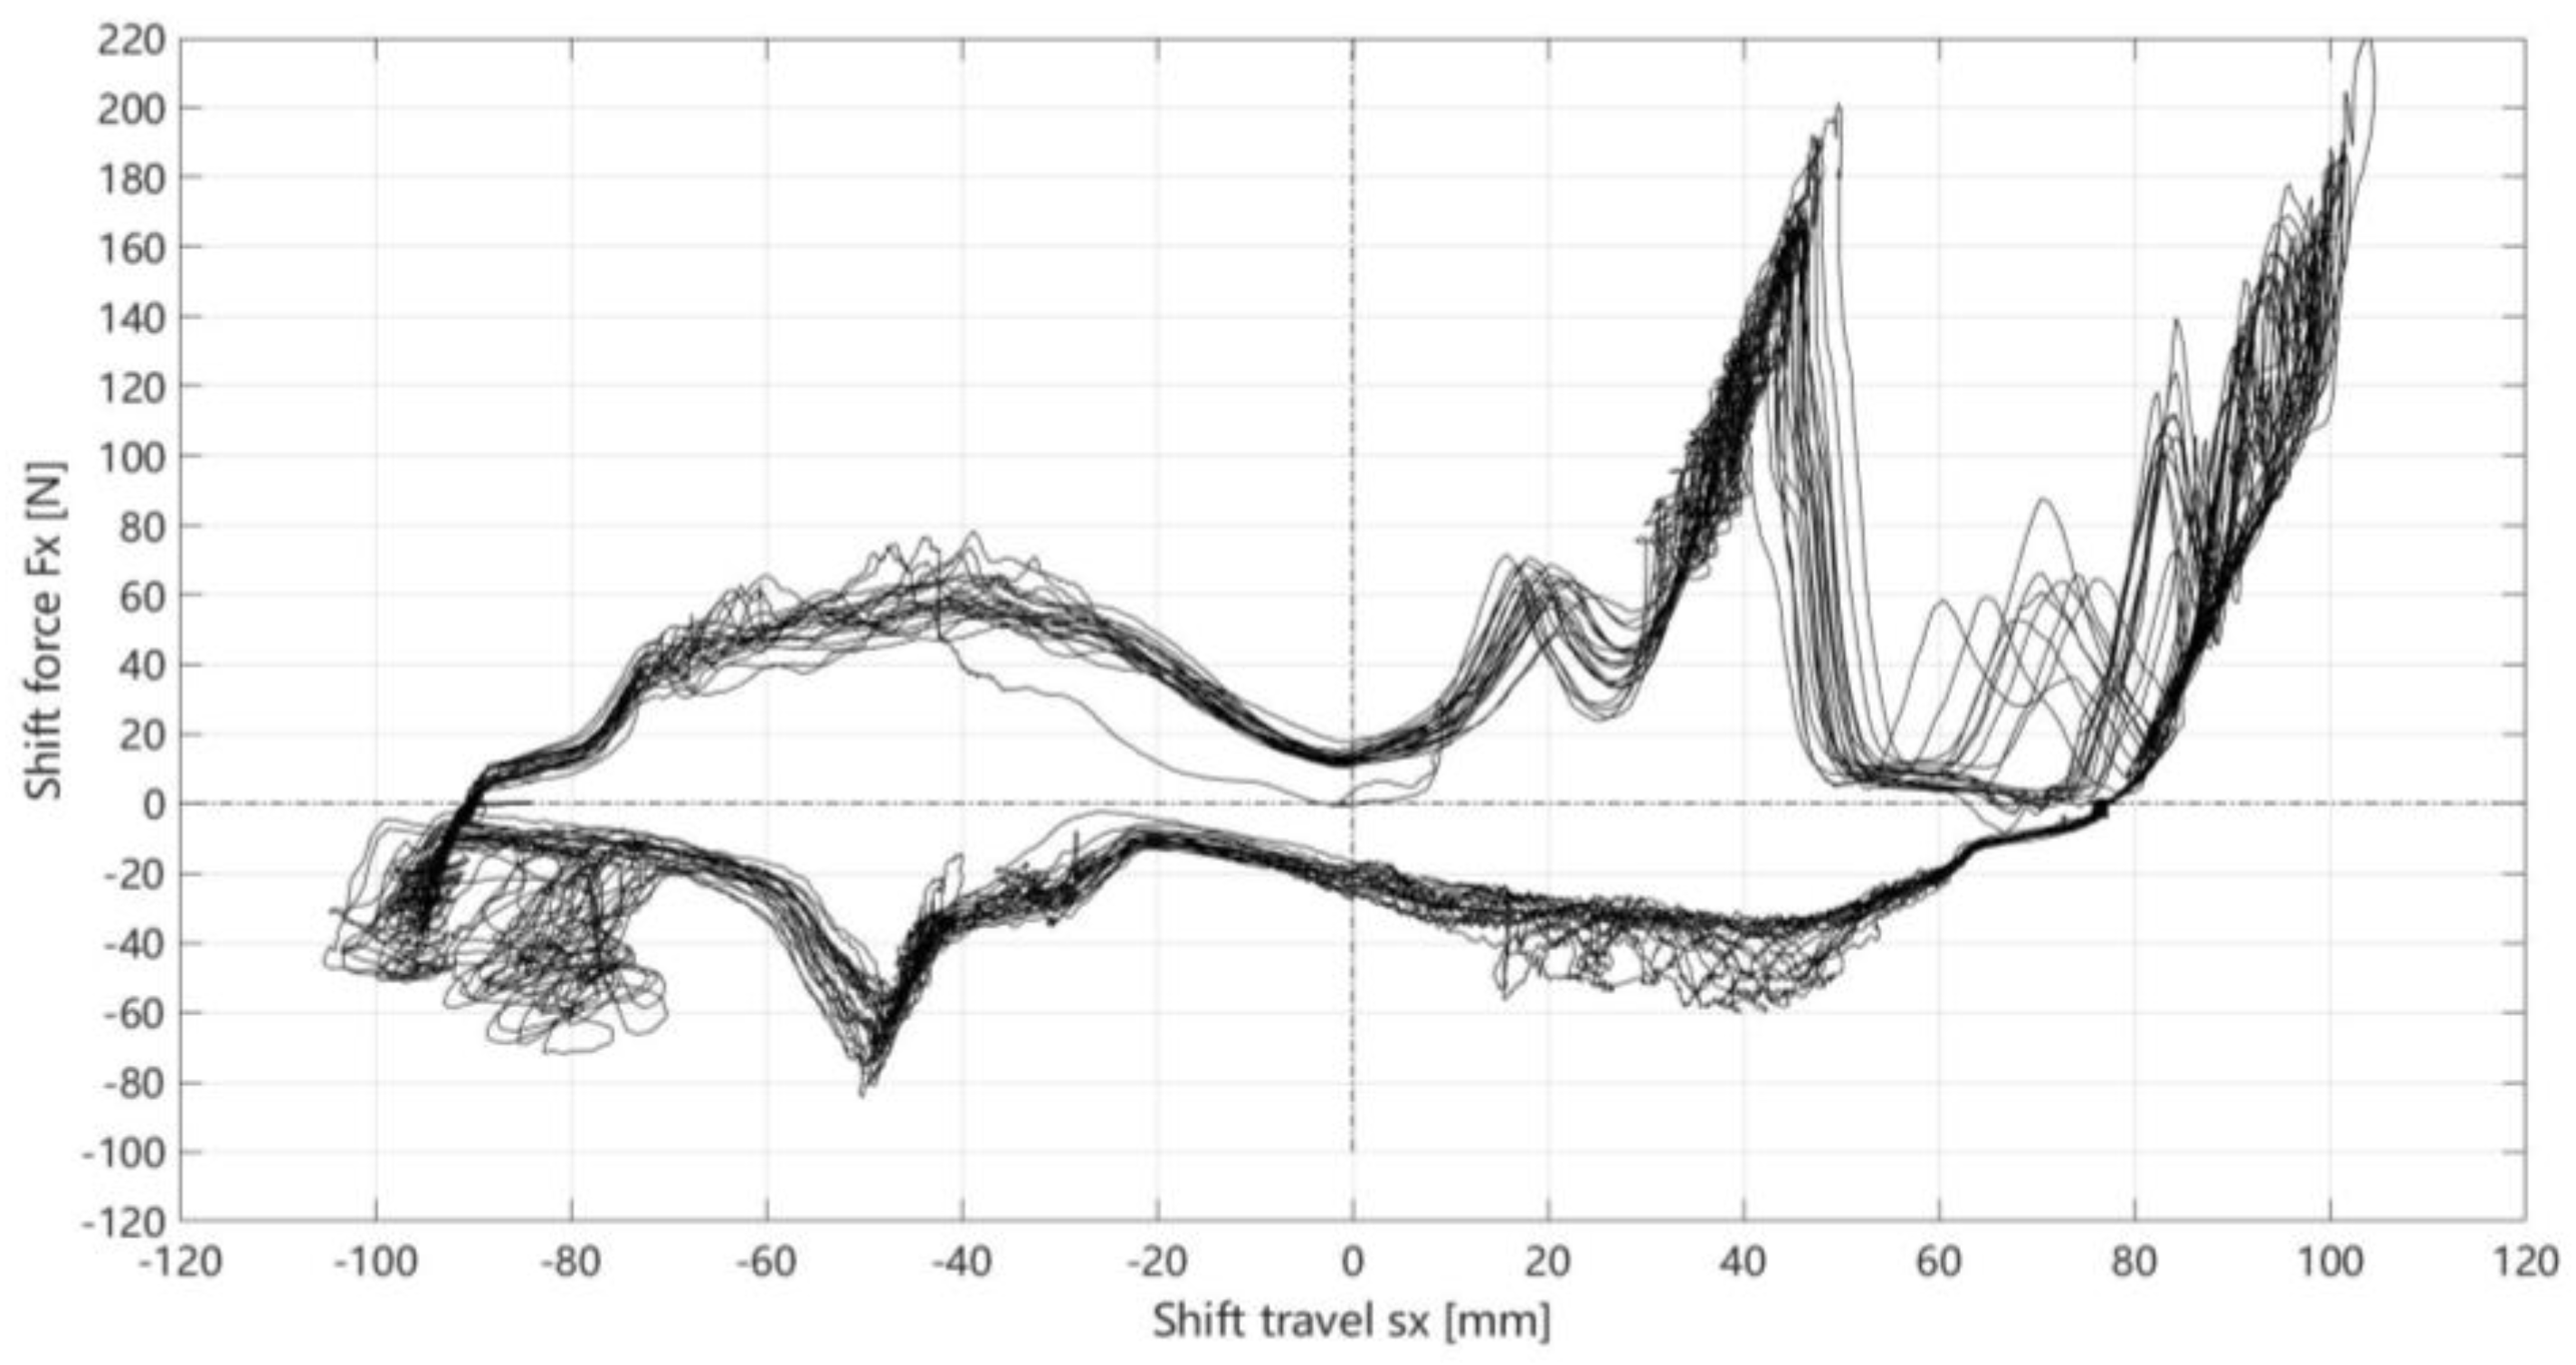
3.1. Gear Shifting Force
The prominent test performance for vehicle shifting force is a necessary condition to ensure the high-quality dynamic gearshift performance. The shifting force test analyzes the comprehensive performance of the whole manipulating system from the shift handle to the shift mechanism and then to the transmission fork in the shifting process. Specifically, it mainly tests the shifting process of each specific shifting position, analyzes the shifting force and shifting displacement of each shifting position, embodies the gear clarity of the test vehicle and evaluates the shift inhalation feeling. Its sense of force and shifting curve could reflect the shifting smoothness of different vehicle gearboxes.
- (1)
The shifting force of each shifting position is generally appropriate, only backward shifting force of gear 1/3/5 is slightly larger;
- (2)
The consistency of the characteristic curve of each shifting position is preferable;
- (3)
The shifting traverses of each shifting position have slight differences;
- (4)
The inhalation sensation of each shifting position was not obvious, except that the gear 1/3 has a perceptible inhalation force of 1 N.
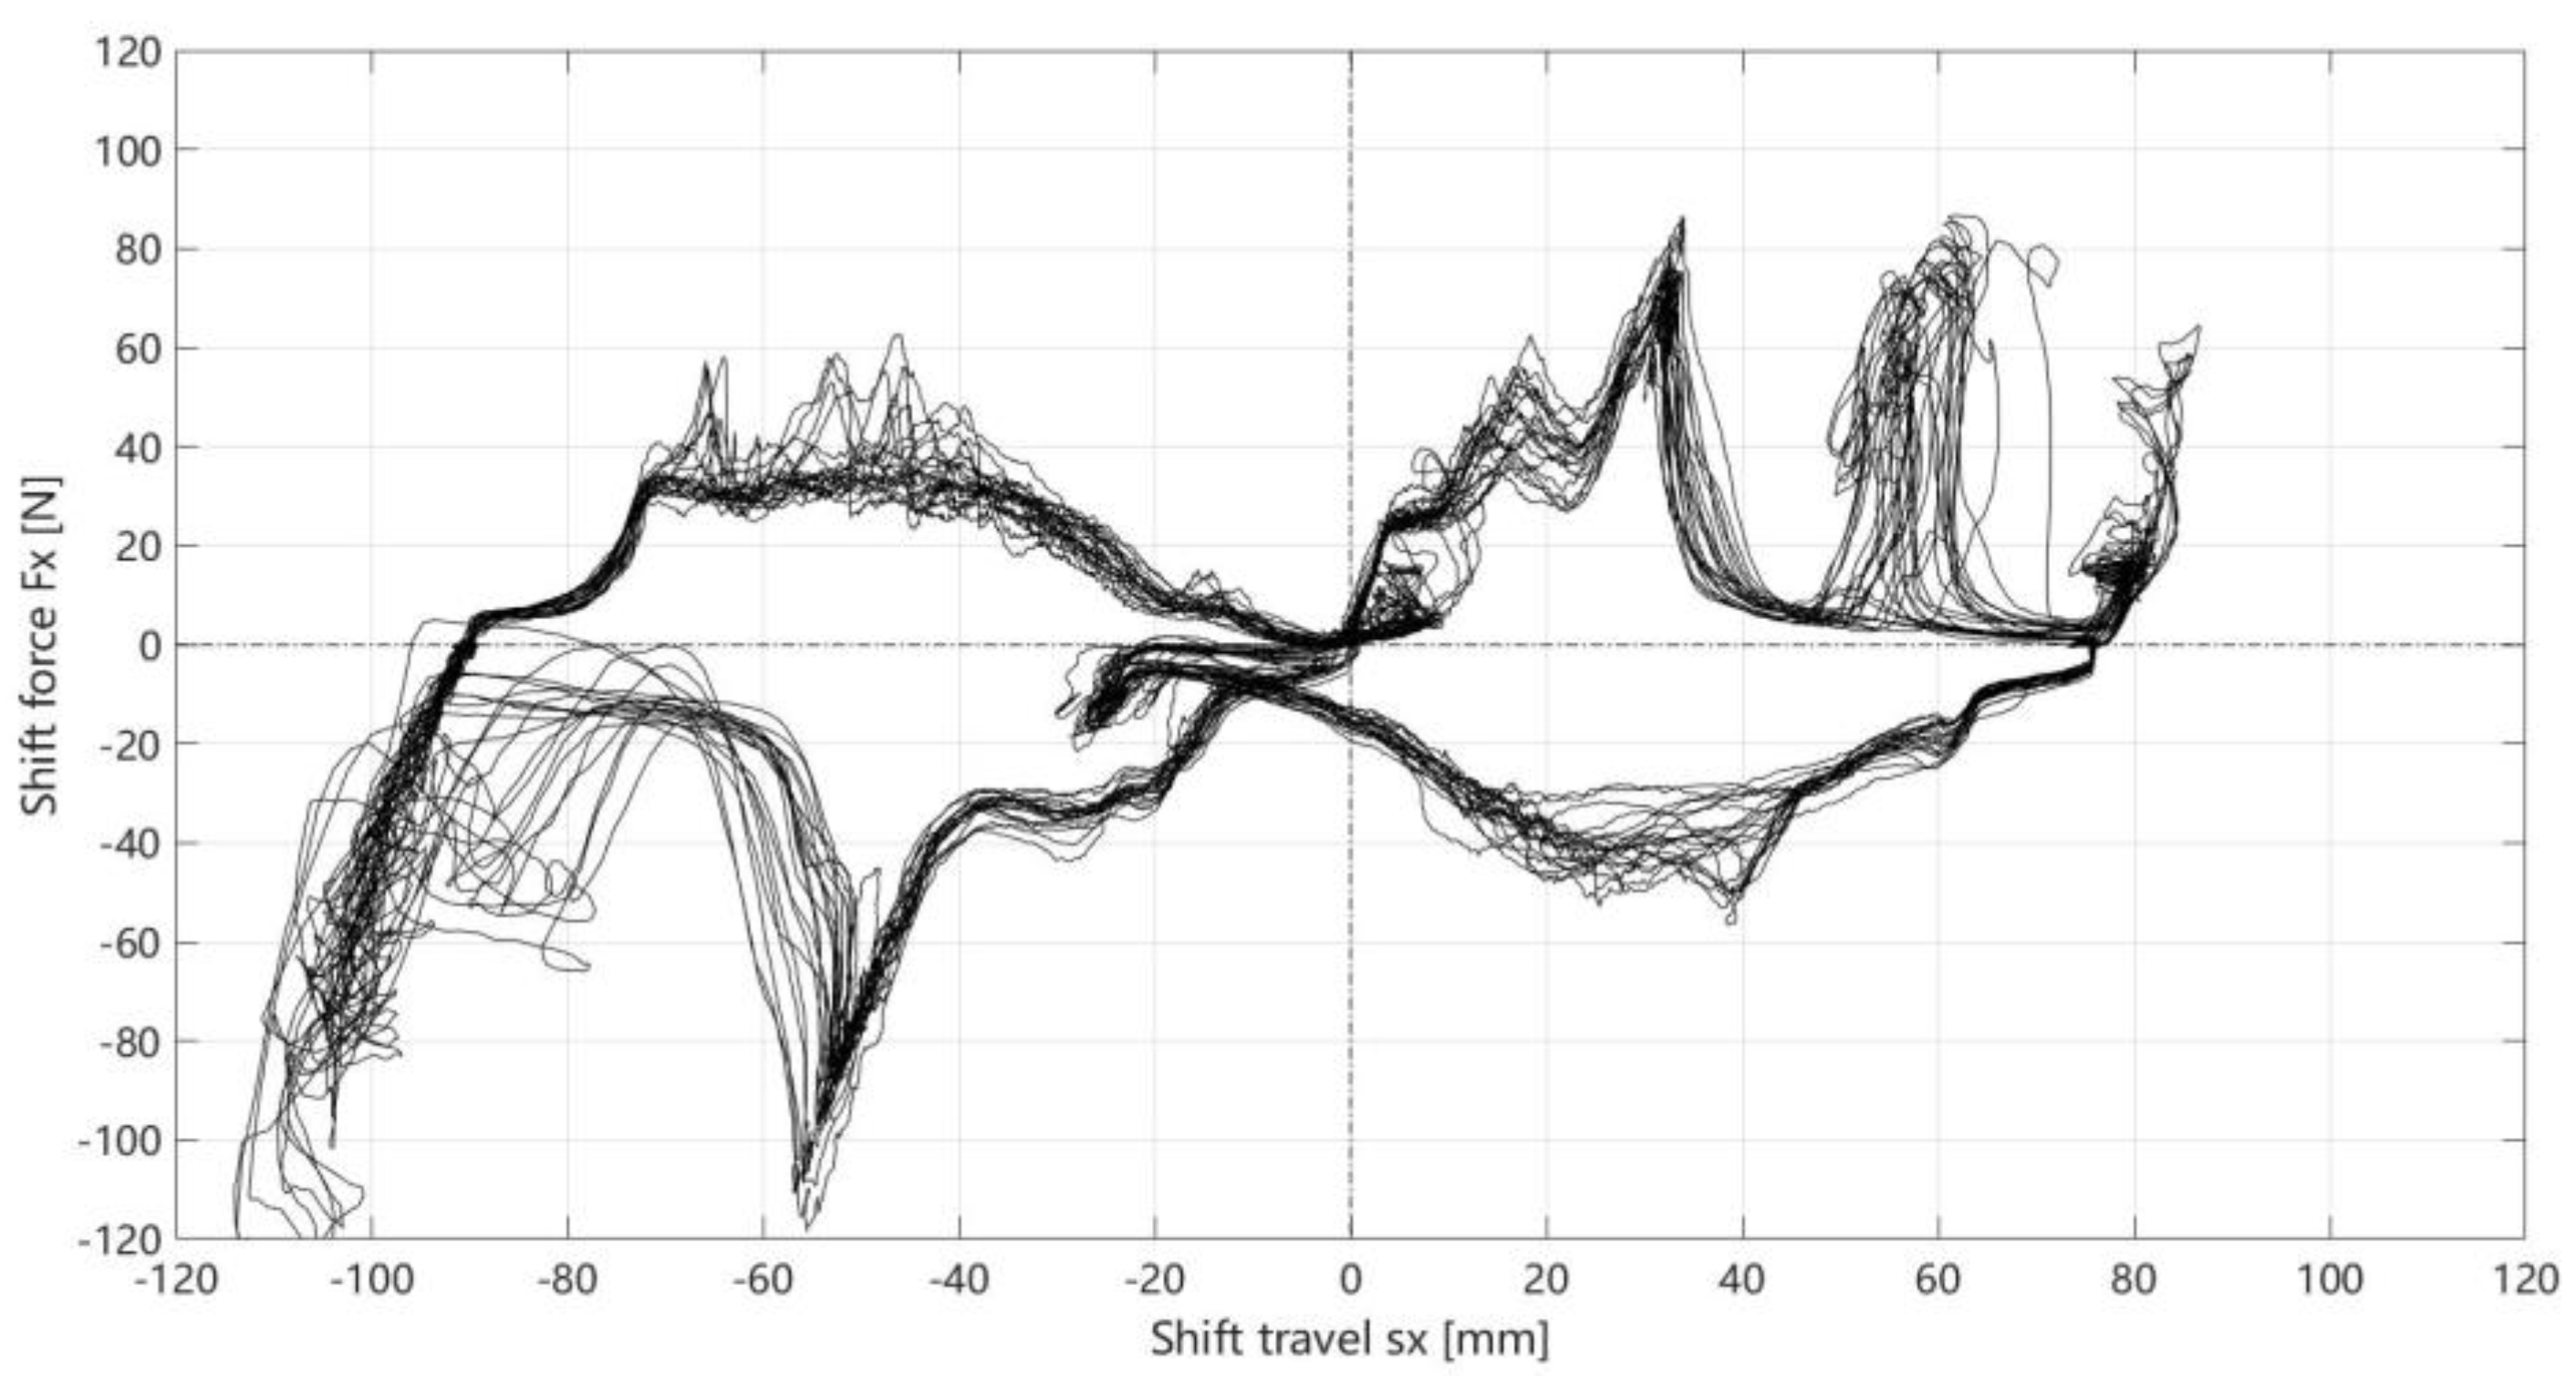
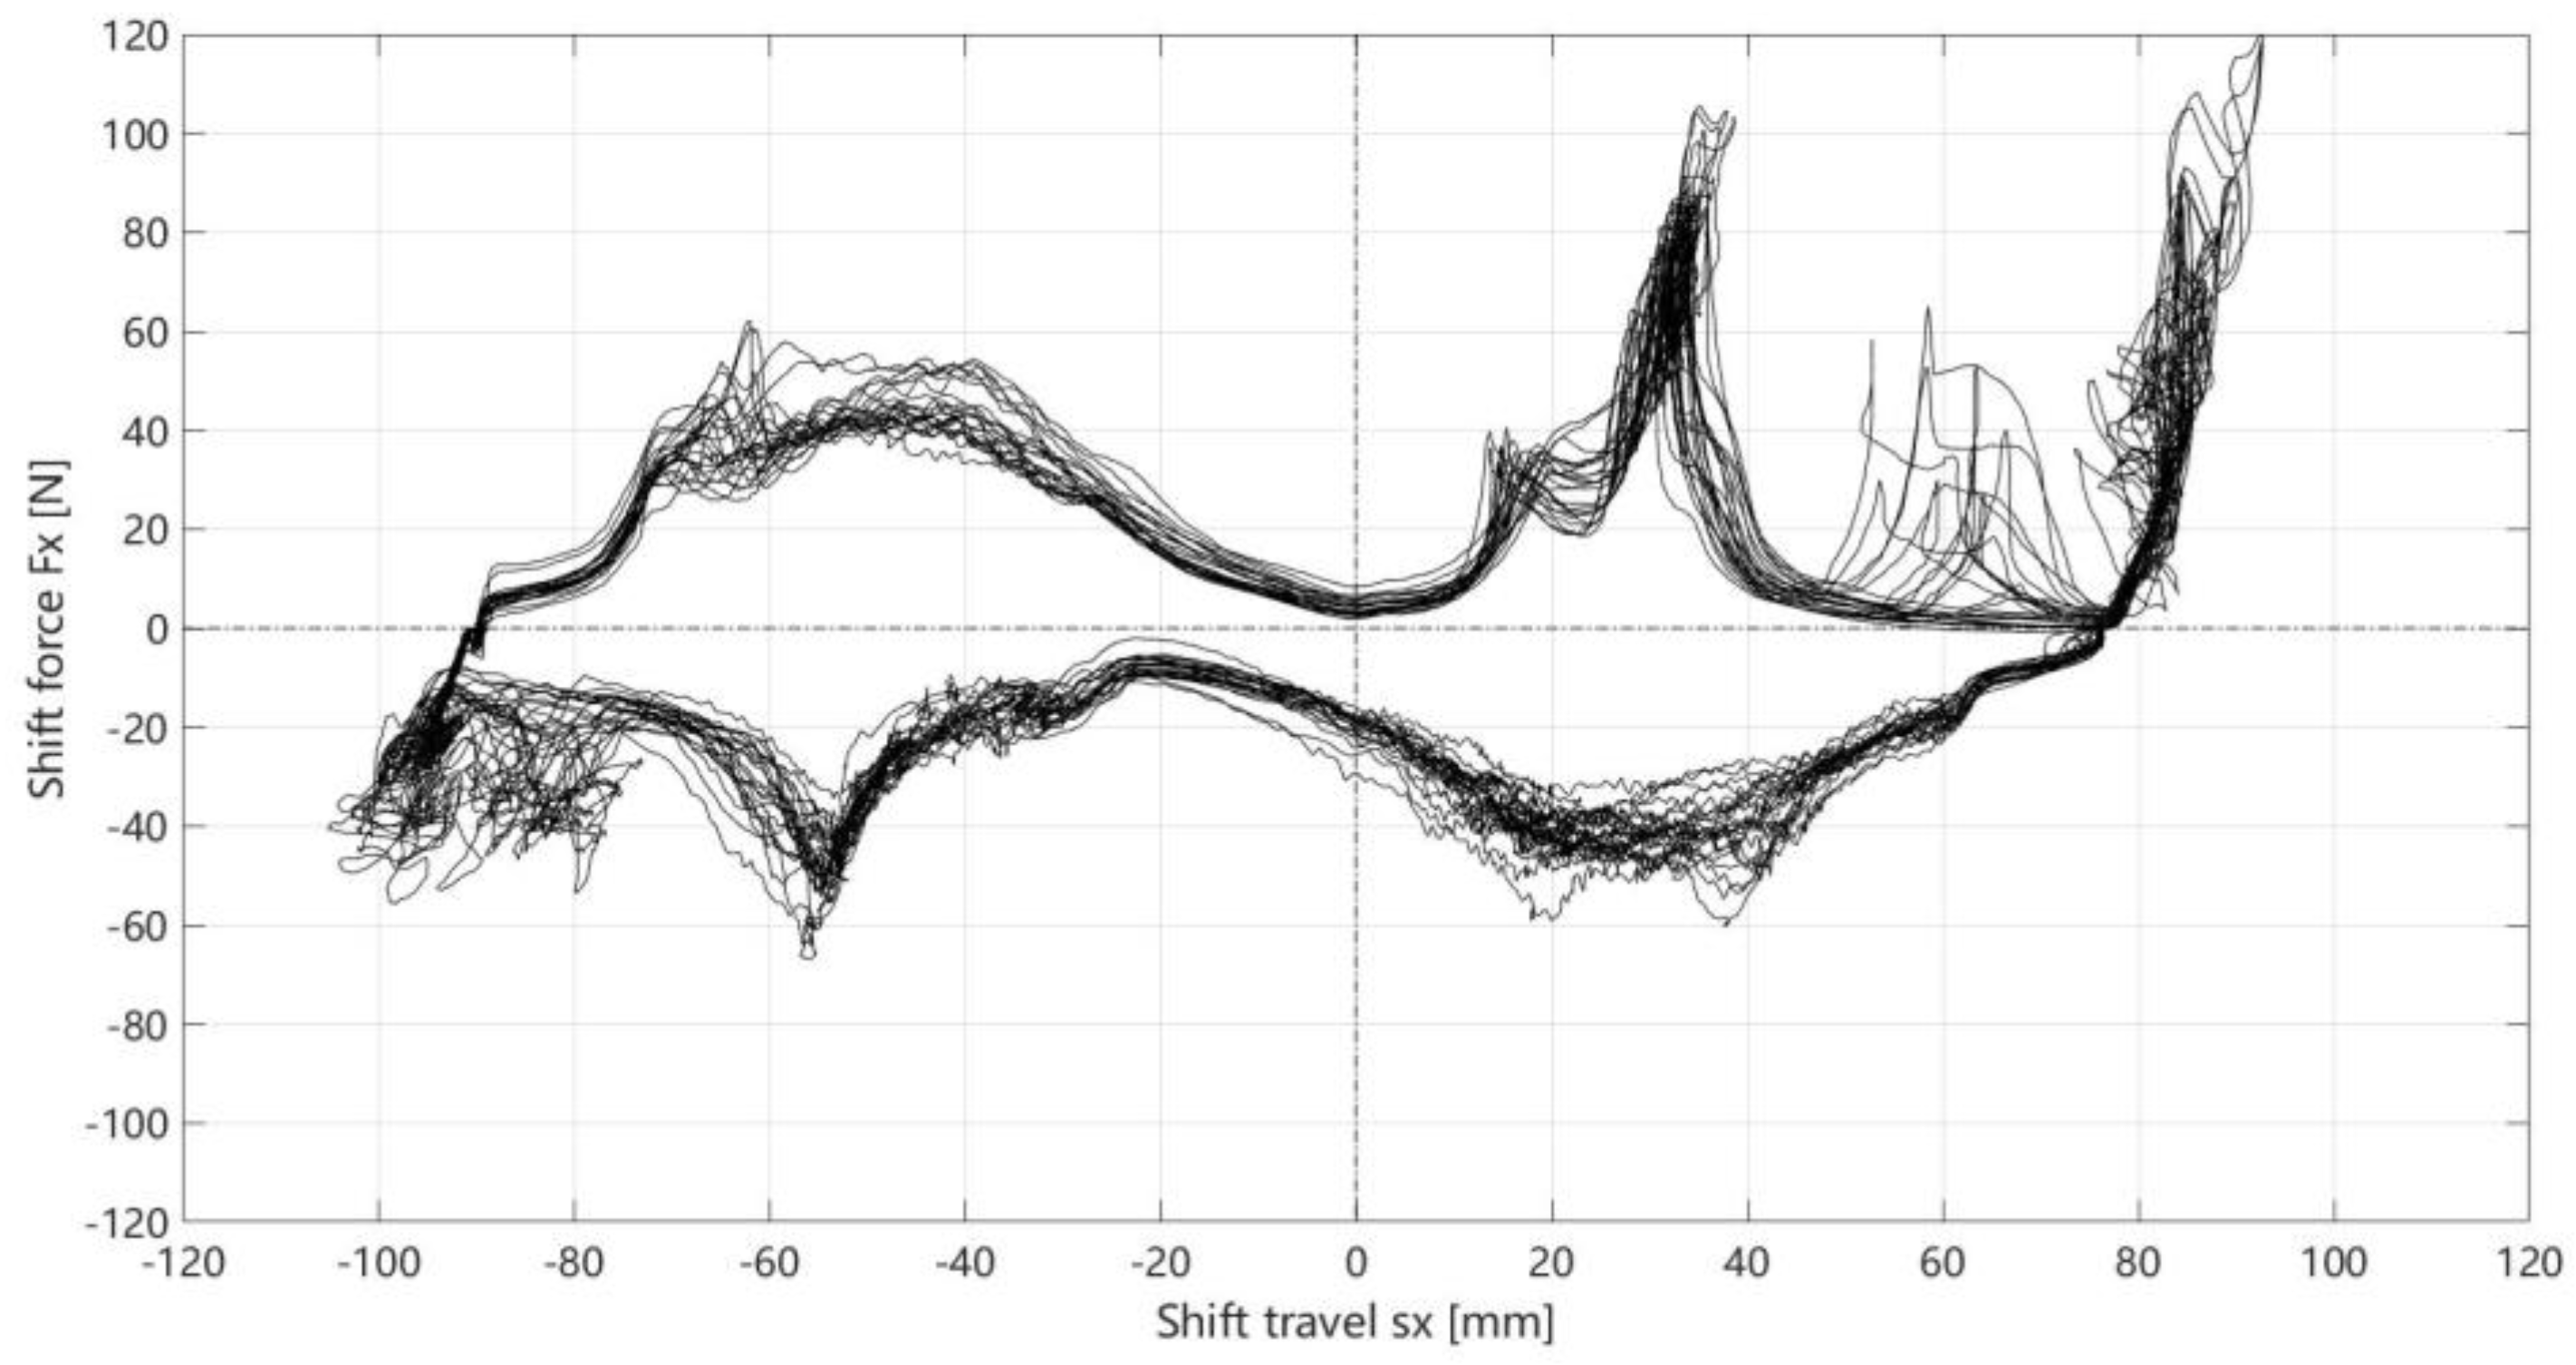
3.2. Gear Selection Force
The gear selection force test mainly measures the change value of gear selection force and gear selection displacement in the process of vehicle gear selection, analyzes the asymmetric force characteristics existing in the gear selection operation, and studies the influence of gear selection mechanism and torsion spring on gear selection performance. Its final main purpose is to evaluate the gear selection characteristics of the vehicle gearbox. The characteristic of gear selection force plays an important role in affecting the driver’s feeling of the vehicle, and it would also have a great impact on the dynamic shift of the vehicle.
The characteristic curve of actual gear selection performance is shown in
Figure 7. The final summary testing data is shown in
Table 2. The following conclusions can be drawn from
Table 2:
- (1)
The selecting force of each shifting position is suitable, the gear selection process is smooth and there is no clamping stagnation;
- (2)
The gear selection and its homing action are relatively fast and flexible;
- (3)
The consistency of gear selection characteristic curve is better, and the sense of leaning against the wall is obvious;
- (4)
The selecting traverses of each shifting position are slightly inconsistent.
3.3. Free Play and H Pattern
Free play is the size of the free space of the shifting position after the shift handle is engaged into a shifting position, and H pattern is an indicator of the moving boundary of the shift lever at each shifting position. The combination of the two could well evaluate the accuracy of each shifting position.
Proper free play and H pattern could ensure the sense of the shifting position and sufficient gear accuracy. The gear accuracy is related to the clearance of various parts inside the gearbox, the arrangement of shifting mechanism and the direction of the shift soft shaft. Vehicles with a good sense of gear accuracy are conducive to cultivating the driver’s sense of gear, so that the driver could carry out the shifting operation accurately and quickly when driving on complex roads, so as to improve driving safety and comfort.
The actual chart of H pattern and free play is shown in
Figure 8. The following conclusions can be drawn from
Table 3:
- (1)
There is about 10–20% overlap areas in adjoining gear 1/2 and 3/4, and the arrangement position is clear and tidy;
- (2)
The free play of each shifting position is basically the same size, not very large.
3.4. Cross Shift
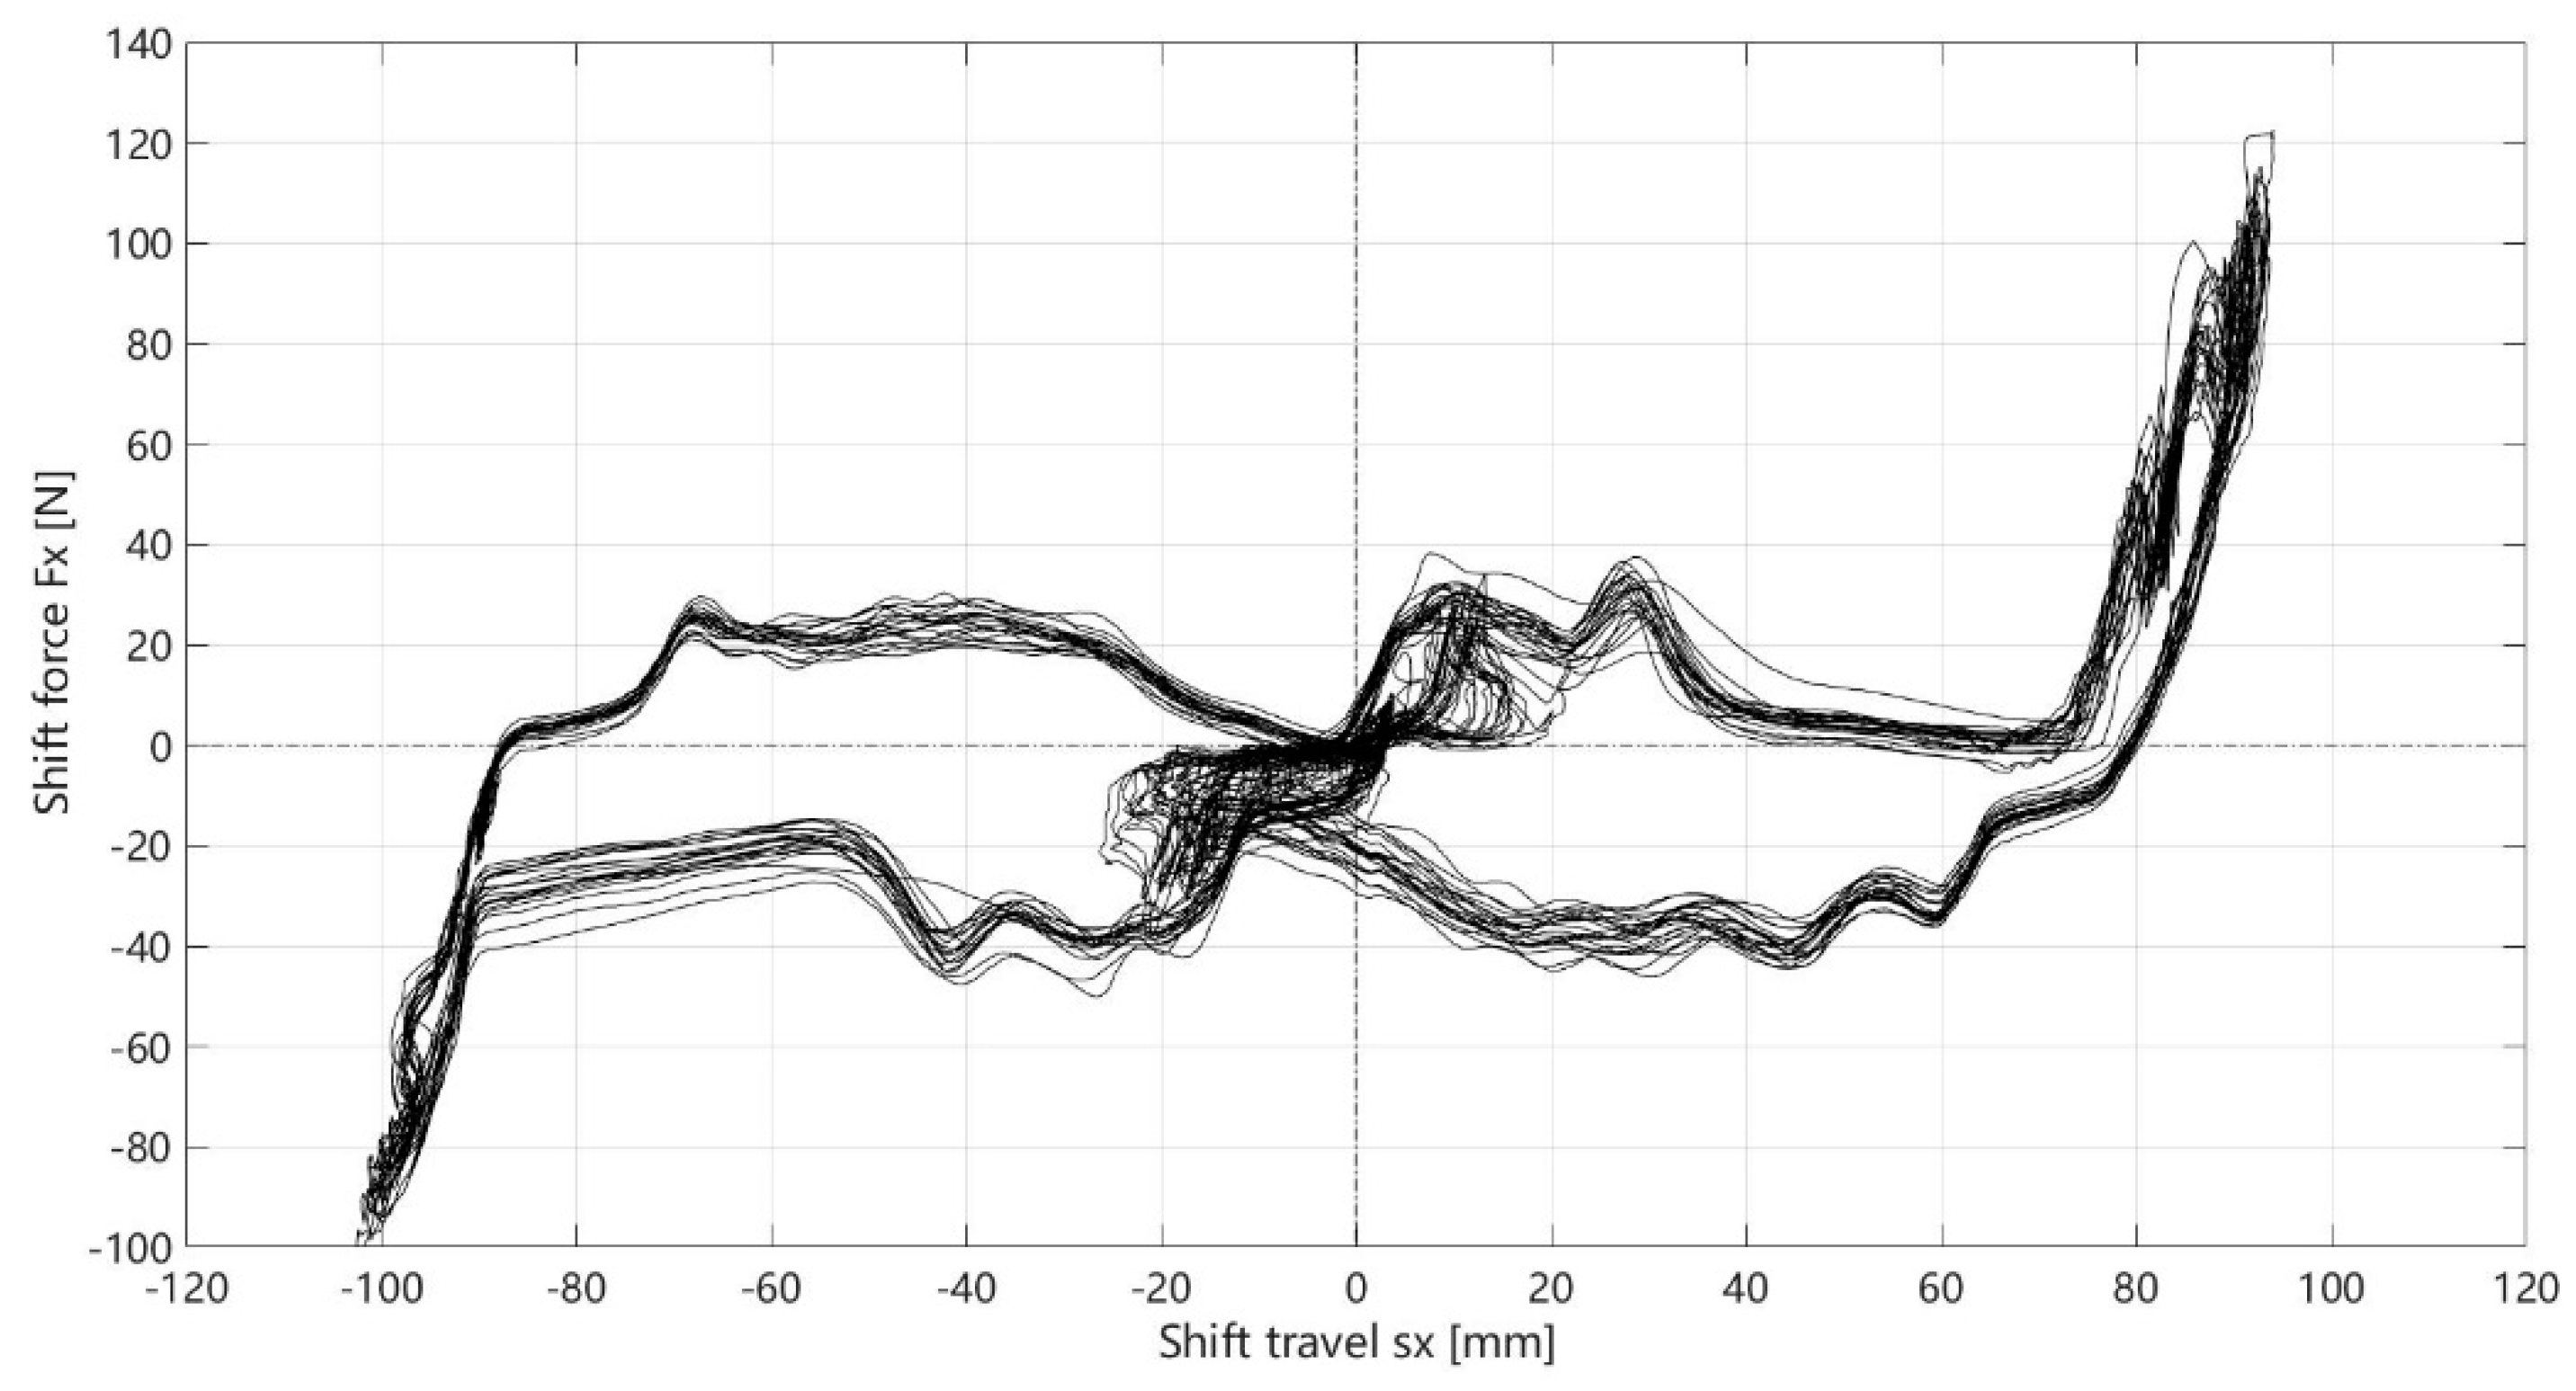
Cross shift is another important aspect in evaluating the shifting characteristics of the vehicle. It is emphasized to understand the range and angle of oblique passing in the process of cross shift by analyzing the test data, in order to evaluate the accuracy, guidance and smoothness of cross shift for the measured vehicle gearbox. The characteristic of cross shift is based on the internal shift structure design of the vehicle gearbox. Through the reasonable matching of some cutting angles on interlocking plates and other components, it could ensure that there would be no clamping stagnation and interference in the process of cross shift.
The characteristic charts of cross shift are shown in
Figure 9 and
Figure 10. The following conclusions can be drawn from the charts:
- (1)
The characteristic curves from gear 2 to gear 3 show that there is shift clamping stagnation in the process, with a probability of 20–30%;
- (2)
The characteristic curves from gear 4 to gear 5 show that there is shift clamping stagnation in the process, with a probability of 20–30%.
3.5. Shifting and Selection Rigidity
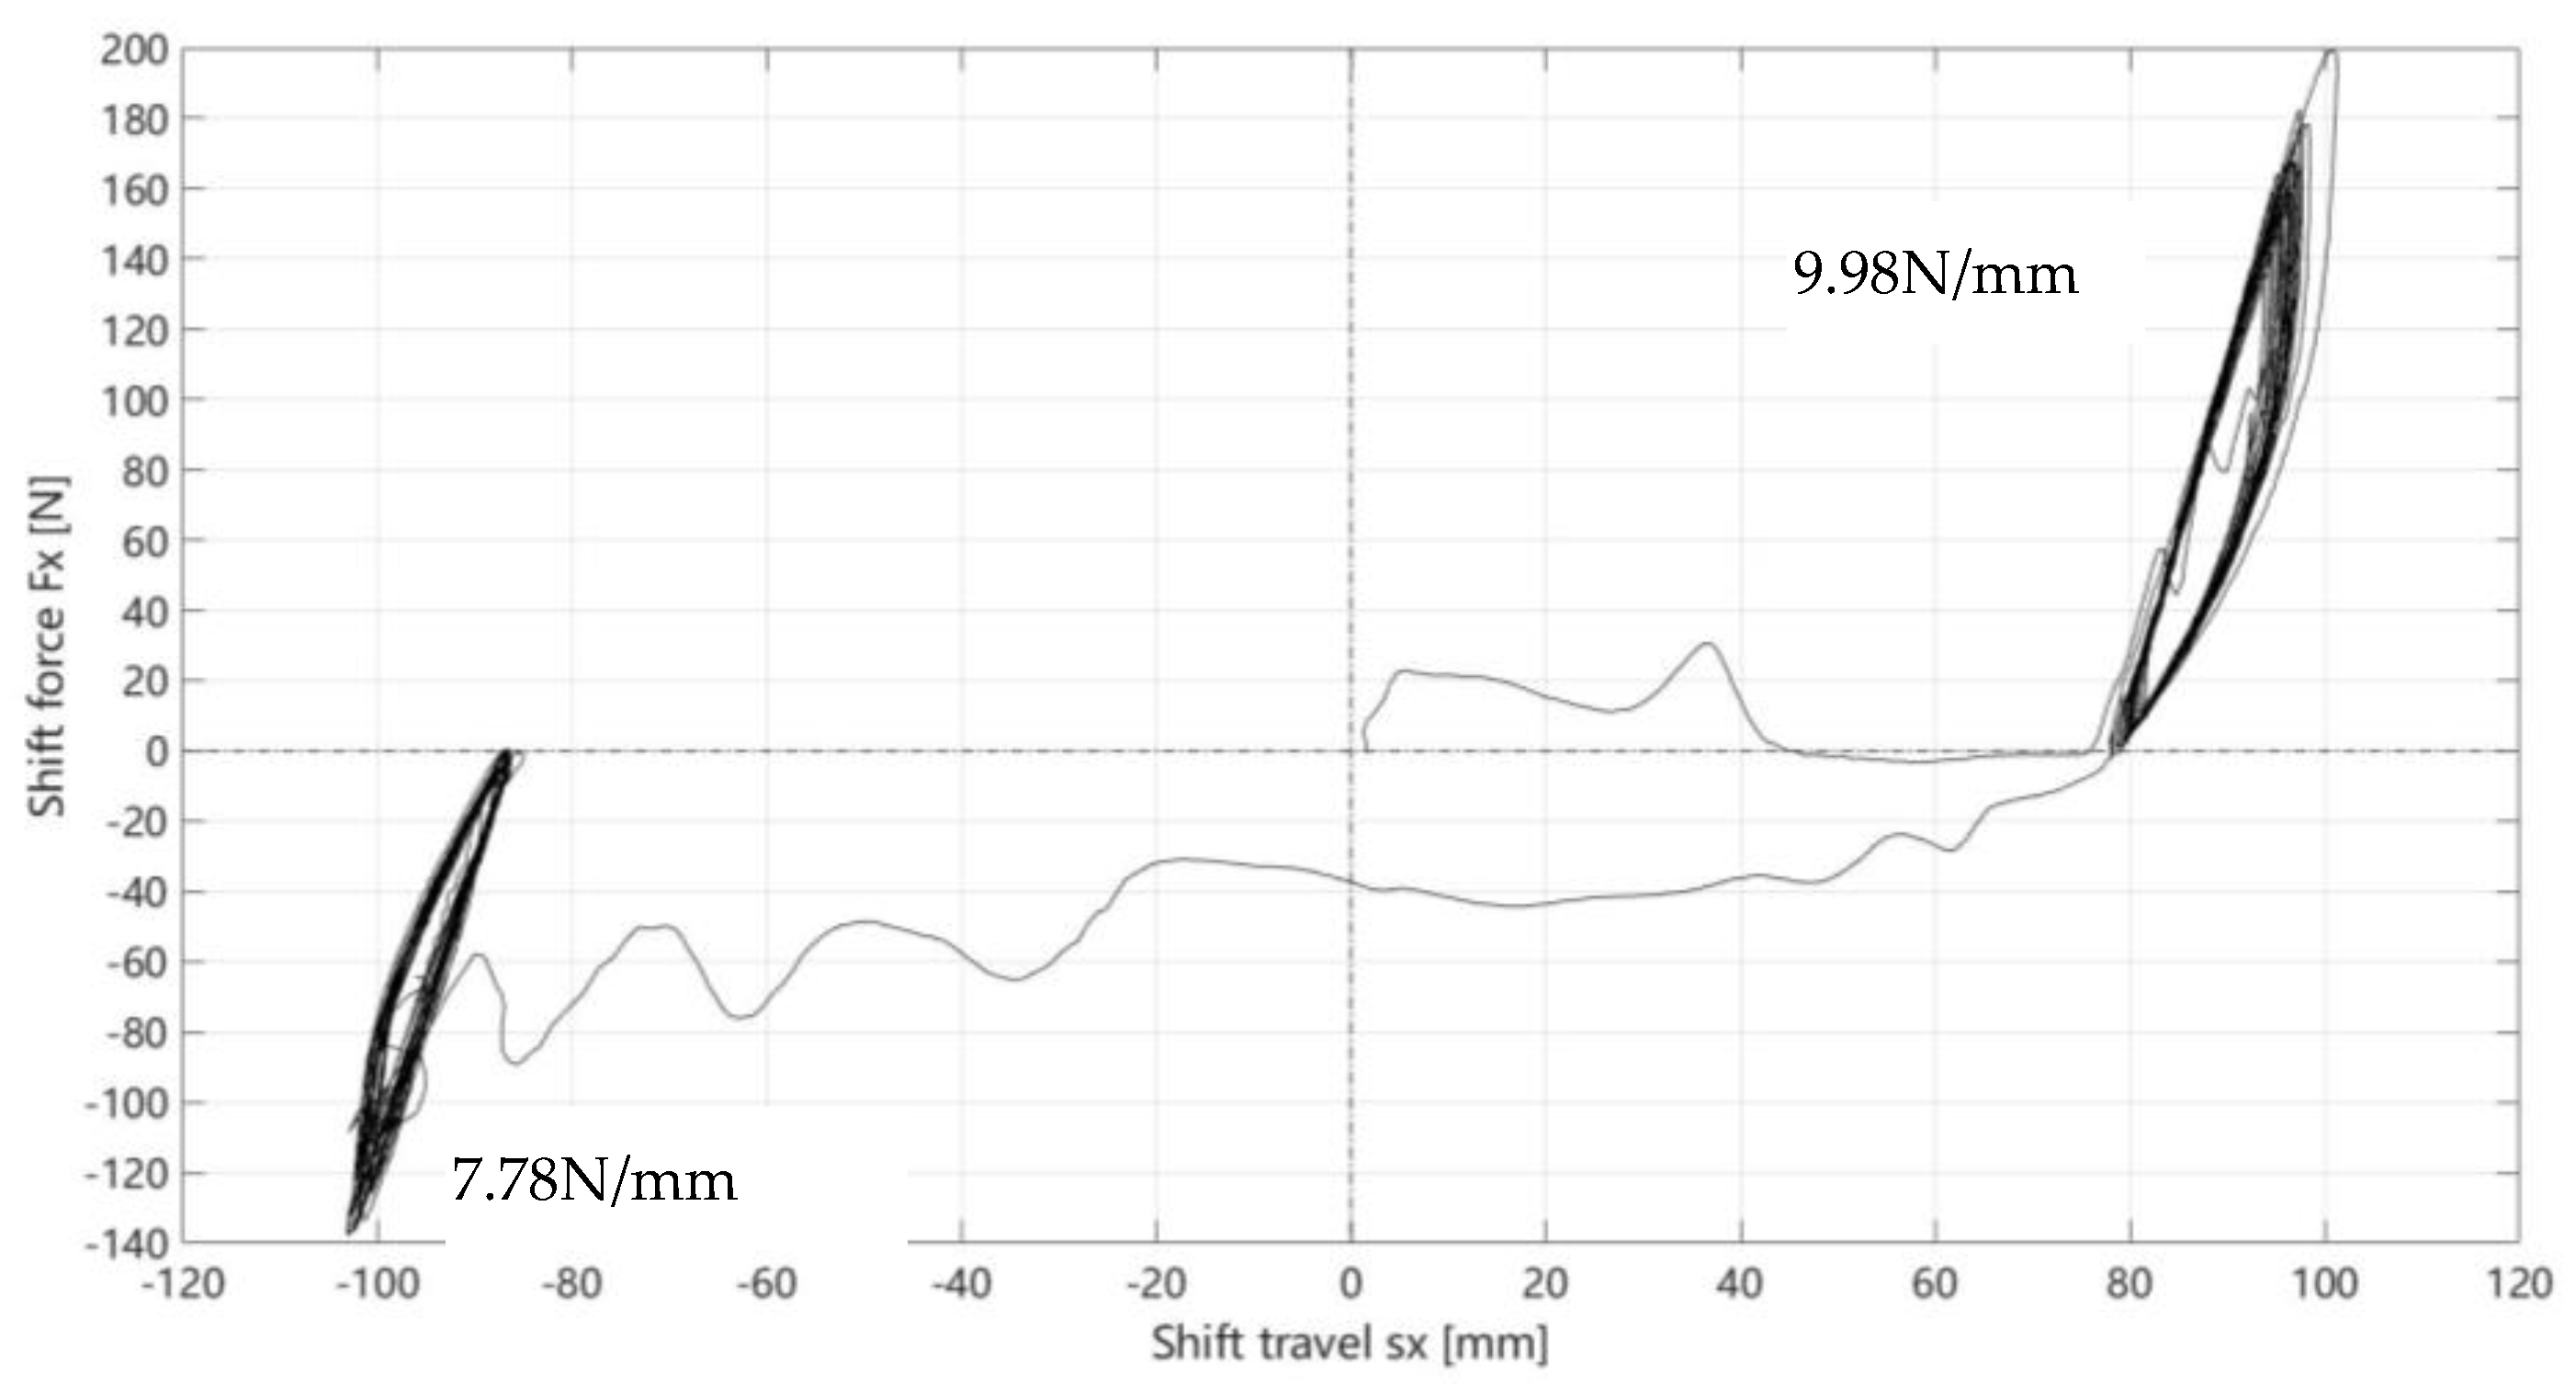
Shifting and selection rigidity are also key parameters in evaluating the vehicle shifting characteristics. They are used to analyze the rigidity of the shifting system in the gear shifting and selection direction, and estimate the reliability of the shift manipulating mechanism. An overly flexible shift lever would lead to shift lag and affect the accurate displacement. However, if the rigidity is too large, the shifting accuracy would be reduced and the shift combination feeling would be worse. The appropriate rigidity could alleviate the vibrating and impact in the shifting process and reduce the clamping stagnation phenomenon.
The ranges of actual shifting rigidity as well as selection rigidity are shown in
Figure 11 and
Figure 12. The following conclusions can be drawn from the graph:
- (1)
The reference value of shifting rigidity recommended by the GIF organization is in the range of about 5 N/mm–8 N/mm, and the actual measurement values are in the range of 7.78 N/mm–9.98 N/mm. The sample measured value of the forward and backward selection rigidities basically conforms to the above recommended value;
- (2)
The reference value of selection rigidity recommended by GIF organization is in the range of about 4 N/mm–6 N/mm, and the actual measurement values are in the range of 11.26 N/mm–13.13 N/mm. The sample measured value of the forward and backward selection rigidities is somewhat large.
3.6. Synchronous Impulse
Synchronous impulse is one of the key parameters in evaluating the vehicle shifting smoothness, which is directly related to the driver’s impact experience. Synchronization time refers to the time from mutual contact between the coupling sleeve and the end face of the lock gear ring in the vehicle synchronizer until full synchronization during gear shifting. Accordingly, the integral of the shifting force generated in this process to the synchronization time is the synchronization impulse.
Due to the difference of the driver’s operation habit and driving state, the shifting speed is different in the shifting process, so the synchronous force acting on the coupling sleeve is also different. Considering that the driver could achieve synchronization with less force and longer time, or with larger force and shorter time in the process of shifting operation, the shifting characteristics could not be simply expressed by virtue of the collected shifting force and shifting time, but should be characterized by the synchronous impulse unassociated with the driver’s shifting operation. This index value is inherent in the shifting system and does not change with the change of driver characteristics.
3.7. Shift Impact
Shift impact is another key parameter to evaluate the vehicle shifting smoothness, which is a poor shift experience produced by the vehicle gearbox in the process of shifting. The magnitude and frequency of shift impact have a great impact on the vehicle shifting comfort. Usually, after the shifting process reaches the synchronization time, due to the meshing of the gear, the shift impact would occur when the maximum synchronization force occurs. Excessive shift impact value would affect the driver’s shifting smoothness.
Shift impact is a very important index to evaluate the shifting comfort. It is a sudden longitudinal peak force on the engaged gear after full synchronization. The force ratio is usually used to define the level of shift impact, that is, the percentage of shift impact value in the maximum synchronous force.
4. Results Analysis and Control Strategy of Gear Shifting System
This study adopted a GSA testing instrument and analyzing equipment, after purposefully implementing its functional extension development, to carry out the omnidirectional installation test of the shifting control process of the vehicle gearbox, and then complete the necessary comprehensive analysis of the vehicle gearshift performance, so as to find out the main limiting factors that may affect the vehicle shifting smoothness. From the analysis results and field test evaluation, the following deficiencies are identified in the shifting process of the sample vehicle:
- (1)
It is not very clear about the sense of inhalation during the whole shifting operation;
- (2)
The possibility of clamping stagnation may be somewhat high during the cross-shift operation;
- (3)
There may be some defects of slightly larger deformation during gear selection, which may cause the feeling of clamping stagnation and shift impact, resulting in the reduction of the driver’s subjective feeling of shifting operation, and then directly affecting the driver’s driving comfort and the vehicle’s fuel efficiency.
In view of the above vehicle shifting problems affecting the driver’s green driving and fuel economy, this study further studied and tested two performance items of the synchronous impulse and shift impact, which are closely related to the driver’s operation feeling in the vehicle shifting process, and explored in depth the key influencing factors. Some key conclusions can be drawn from the test charts of synchronous impulse and shift impact:
- (1)
The dynamic gearshift performance of each gear enables the driver to have a relatively easy, comfortable and convenient experience on the whole;
- (2)
The synchronous impulse from second gear to first gear is slightly larger than that for other gears, but the driver rarely engages in such shifting operations in the process of driving the vehicle, so the influence range here is not serious;
- (3)
Although the probability of backward shift impact ratio greater than 50% for all gears is better, the forward shift impact of all gears is slightly larger. To this end, we could take the matter from the internal structure of the vehicle gearbox, to eliminate the trouble of excessive shift impact through the improvement of the closely related shifting structure and the adjustment of relevant design parameters inside the gearbox. For example, in the case of large deformation of the shifting system, the rigid cast-steel shift arm with inertia block should be reasonably selected to improve the shifting stiffness. Furthermore, we could choose to increase the overall moment of inertia by adding counterweight to the shift arm, or design a high-capacity synchronizer to increase the structural stability of the synchronizer, so as to effectively reduce the assessment index of shift impact to an appropriate range, and then make navigation for high shifting efficiency and low fuel consumption, as well as subsequent green driving.
In brief, environmental protection, safety and energy conservation have become three major themes of vehicle technological progress. Most countries have also formulated strict vehicle emission regulations and standards to minimize the harm of vehicle exhaust to the environment. This study introduces the sustainable development of China’s vehicle industry from the fuel economy and energy crisis, discusses the main existing problems that need to be solved to realize the sustainability of the vehicle industry development, analyzes various difficulties faced by the vehicle industry through detailed elaboration, and finally points out that the development of energy-saving technology is the key to the sustainable development of China’s vehicle industry. In this regard, this study presents original research on theories and developments as well as practical applications on principles of GSA testing technology, combined with an example of sample vehicle provided by the cooperative institutions, systematically analyzes the gear shifting process of the vehicle gearbox, and finds out the causes of the fault point and the improvable technical aspects, as well as pointing out the key factors that should be focused on in improving the vehicle shifting smoothness and driving comfort, and thus lays a good foundation for the realization of reducing environmental pollution and saving energy, as well as the follow-up research work in green driving behavior, so as to provide intellectual support and effective ways to realize the sustainable development of the vehicle industry.
5. Conclusions
For a long time, especially after the industrial revolution, mankind’s ability to influence and transform nature has become stronger and stronger. The ideas that “man will conquer nature” and “man is the master of nature” are increasing in popularity. Mankind takes nature for granted as an inexhaustible resource pool, wantonly plundering development and utilization, and regards nature as a huge garbage dump, to discharge waste gas, wastewater and waste residue to it without scruples. Similarly, the rapid development of China’s reform and opening up for decades also comes at the cost of consuming resources and sacrificing the environment. The consequences of such extensive development eventually lead to the current global crises such as serious environmental pollution, sharp ecological imbalance, near depletion of resources and deteriorating climate. In turn, these crises seriously affect the likelihood of human beings being able to continue to survive and develop. Therefore, it is urgent to solve the problem of sustainable development. The provision of effective technical means and methods for energy conservation and emission reduction is the core issue of the sustainable development of the global energy supply.
As China’s vehicle industry is currently in a stage of rapid development, how to deal well with the relationship between the vehicle industry and environmental protection, reduce the impact of vehicle production and consumption on the environment, and maintain a healthy and sustainable development trend are vital issues in the development of the vehicle industry. With the continuous growth of motor vehicle ownership, reducing the fuel consumption and pollutant emission of motor vehicles has become an important breakthrough in energy conservation and emission reduction. Considering that the fuel economy of the vehicle is directly related to the driver’s driving operation, and then closely linked with the vehicle shifting quality, this study has established a set of cycle improvement system after the test and evaluation of the vehicle shifting quality based on GSA. By analyzing the shifting quality problems of the trial-production sample vehicle reflected by the customers, the technician first formed a targeted troubleshooting scheme and corresponding objective indicators in the initial stage, then used GSA test technology to identify the quantitative factors affecting the shifting quality, mainly related to the gear shifting and selection force, free play and H pattern, shifting and selection rigidity, synchronous impulse and shift impact, etc., and then put forward the targeted corrective actions and schemes, and matched them to the case. Finally, a loading test after optimization and improvement was carried out to verify the effectiveness of this study in improving the vehicle shifting quality, thus promoting the vehicle’s fuel economy. The results of this study indicate that the potential for vehicle shifting smoothness to make contributions to mitigating the impact of environmental pollution and sustainable development is expected to increase significantly in the longer term.
In short, combined with the engineering practice requirements of domestic commercial vehicles, this study would explain the subjective evaluation phenomenon in the process of vehicle driving with the objective data obtained from GSA test process, in order to provide strong support for systematically improving the shift performance and transmission efficiency of vehicle gearbox, which would be of great significance to realizing the energy-saving transformation of commercial vehicles. Furthermore, the study’s findings would also be applied to all of the vehicle industry, which could provide theoretical guidance and method reference for promoting the shift performance in China’s vehicle industry, so as to reduce the environmental burden in the entire life cycle of vehicle transmission system, realize the maximum the common interest of environmental and economic benefits, contribute to mitigating climate change and solving environmental problems, and finally continue to facilitate the establishment of a low-carbon-oriented society.
