
Energy Use and Its Key Factors in Hotel Chains


Abstract
1. Introduction
2. Literature Review
2.1. Energy Use in Hotels
2.2. GRI Adoption
3. Materials and Methods
3.1. Data Collection
3.2. Multiple Regression Model
4. Results
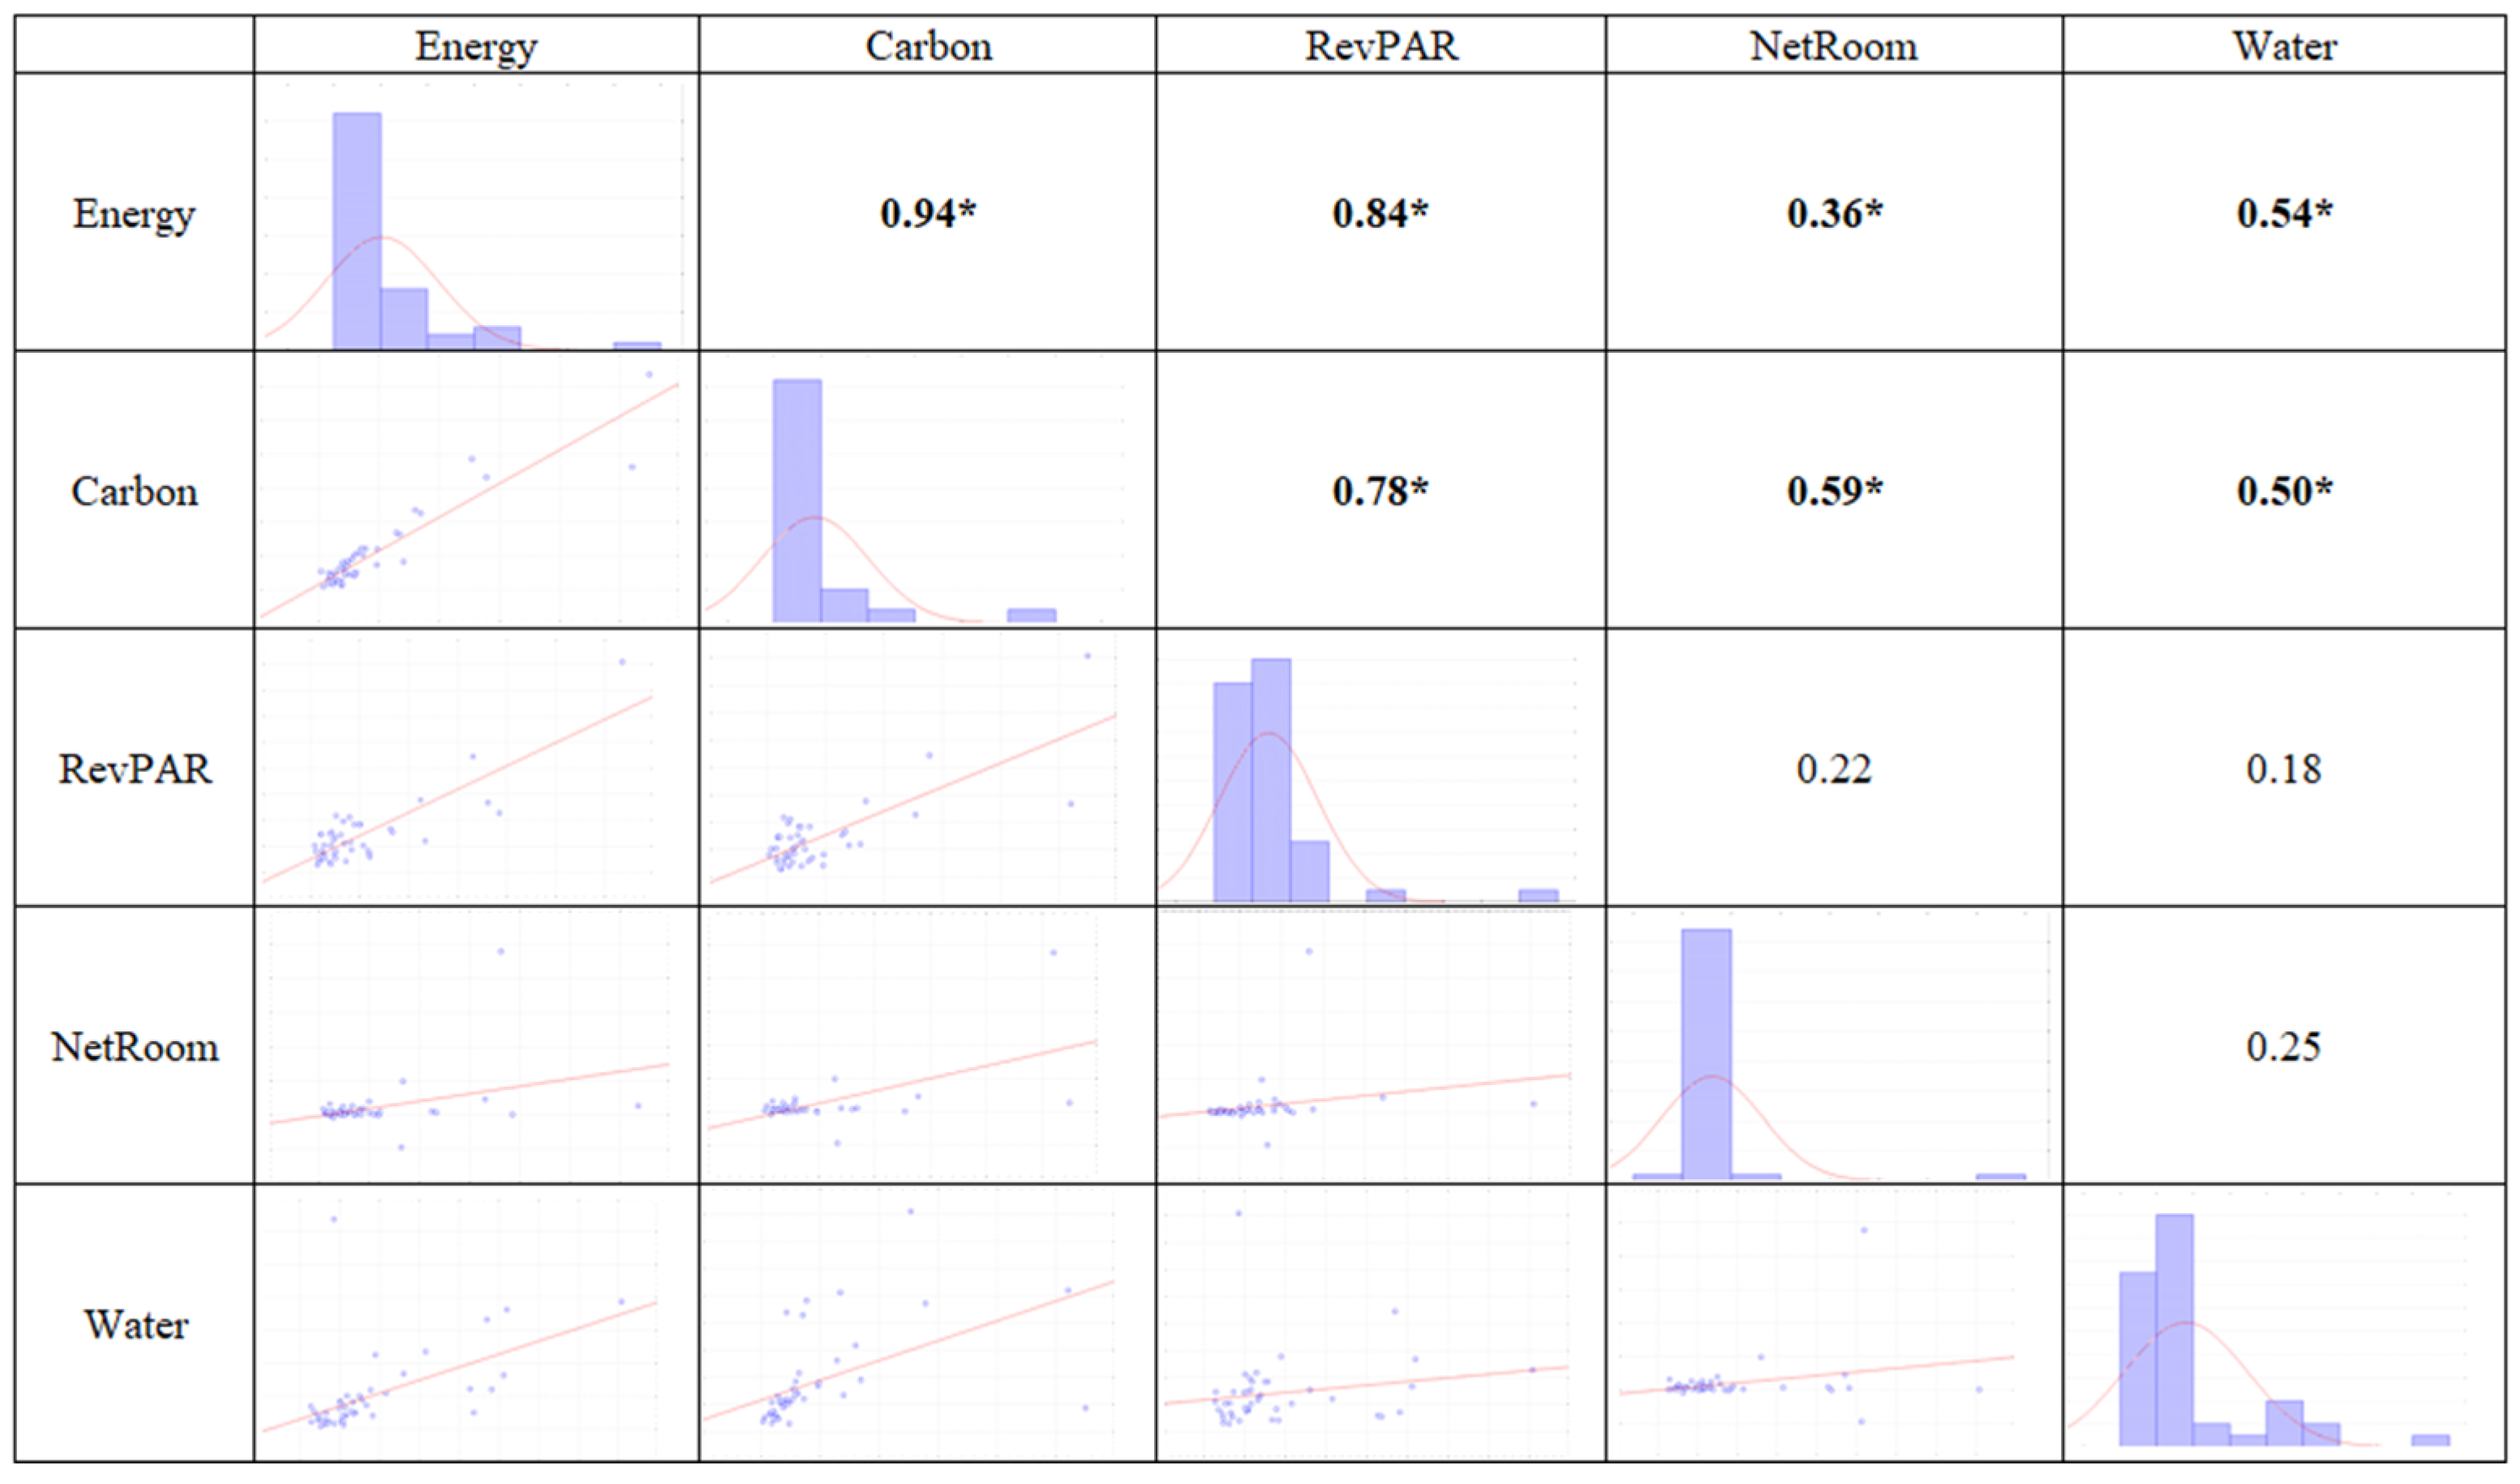
4.1. Dispersion Matrix
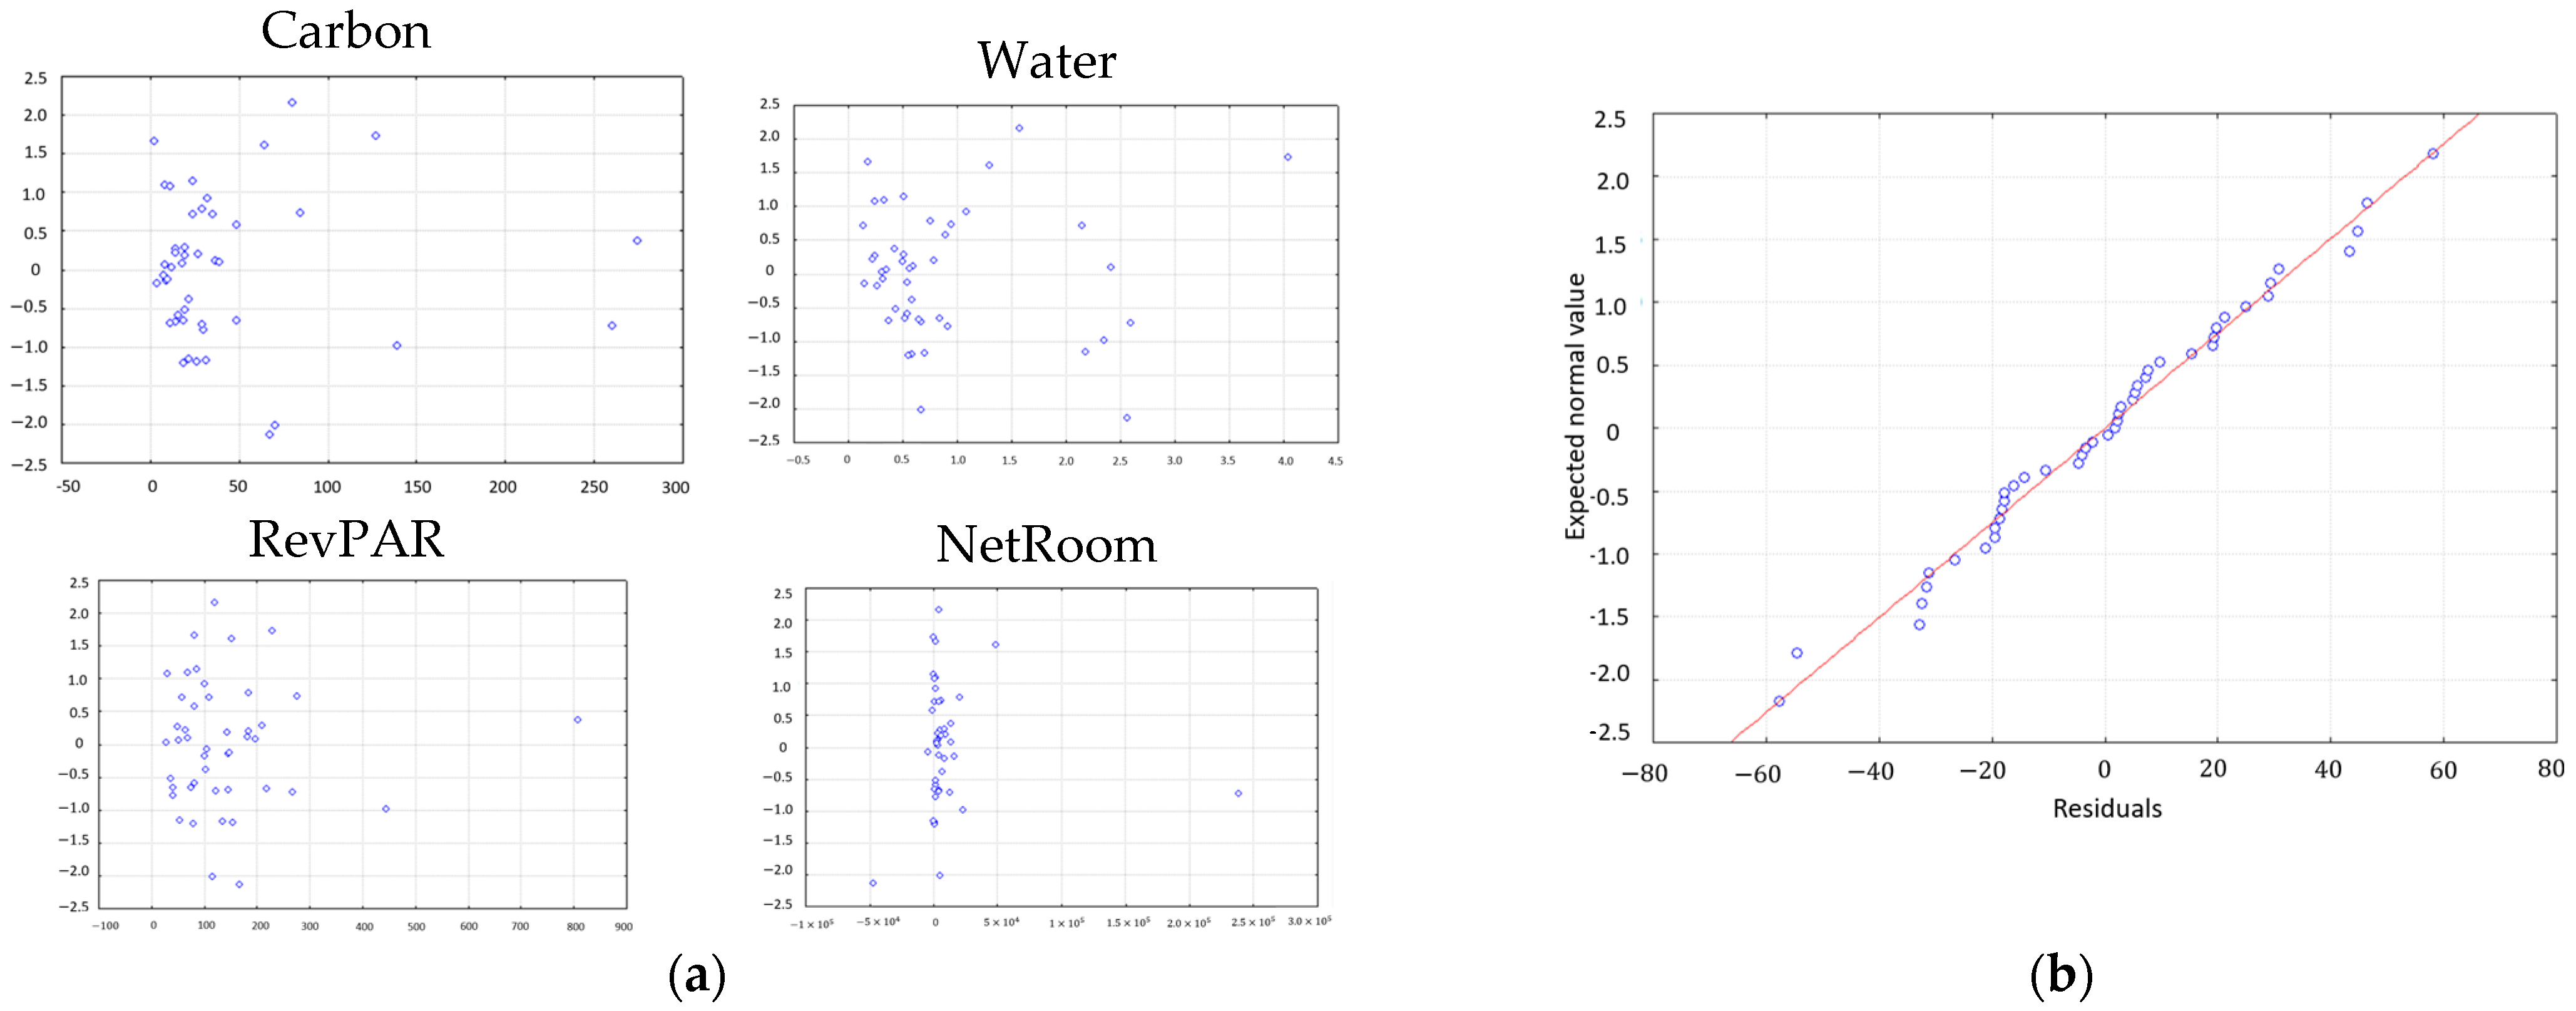
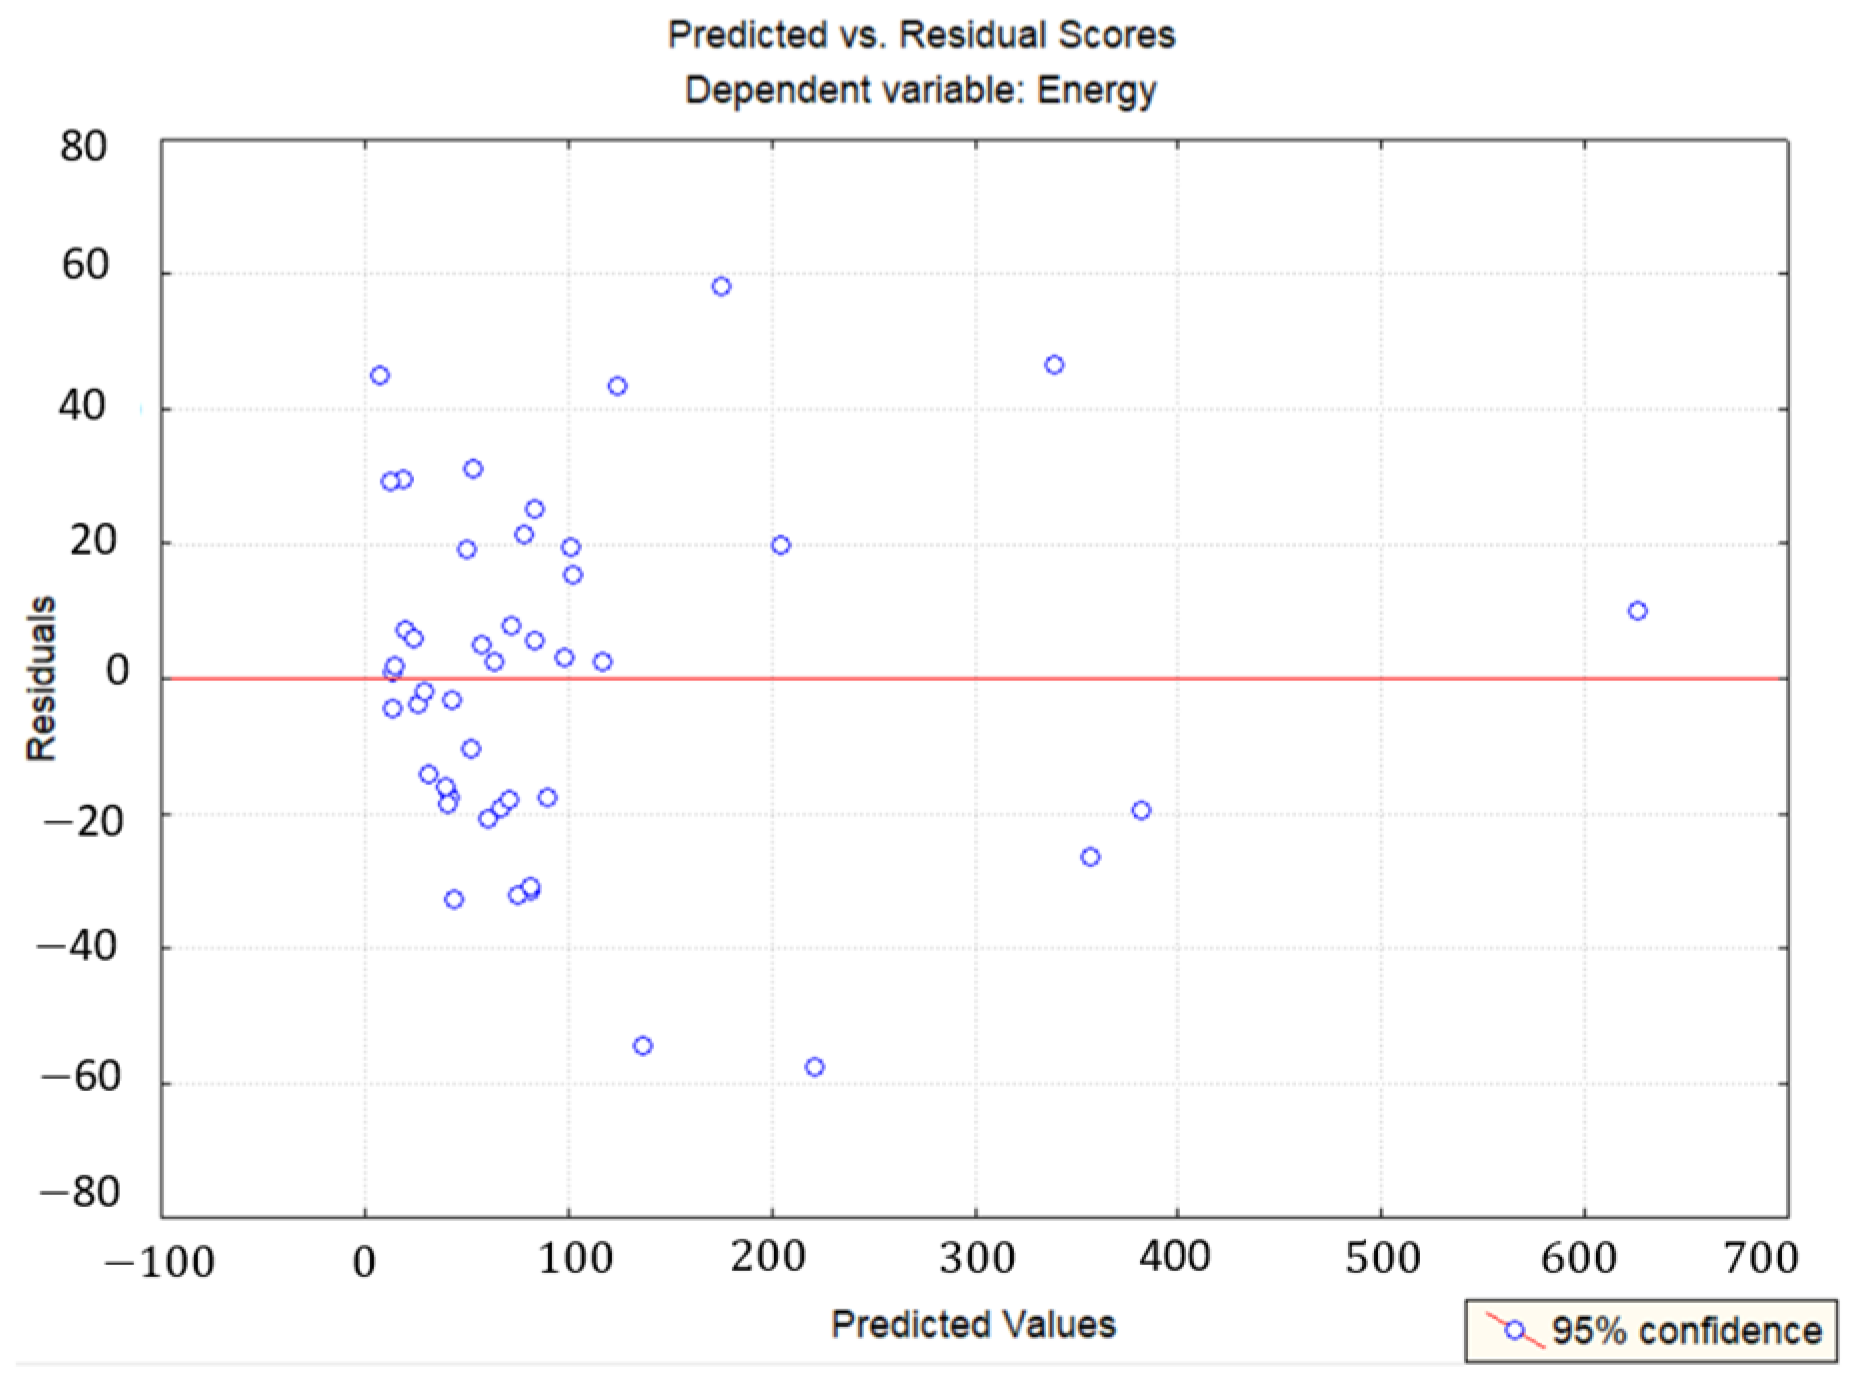
4.2. Multiple Regression—First Model
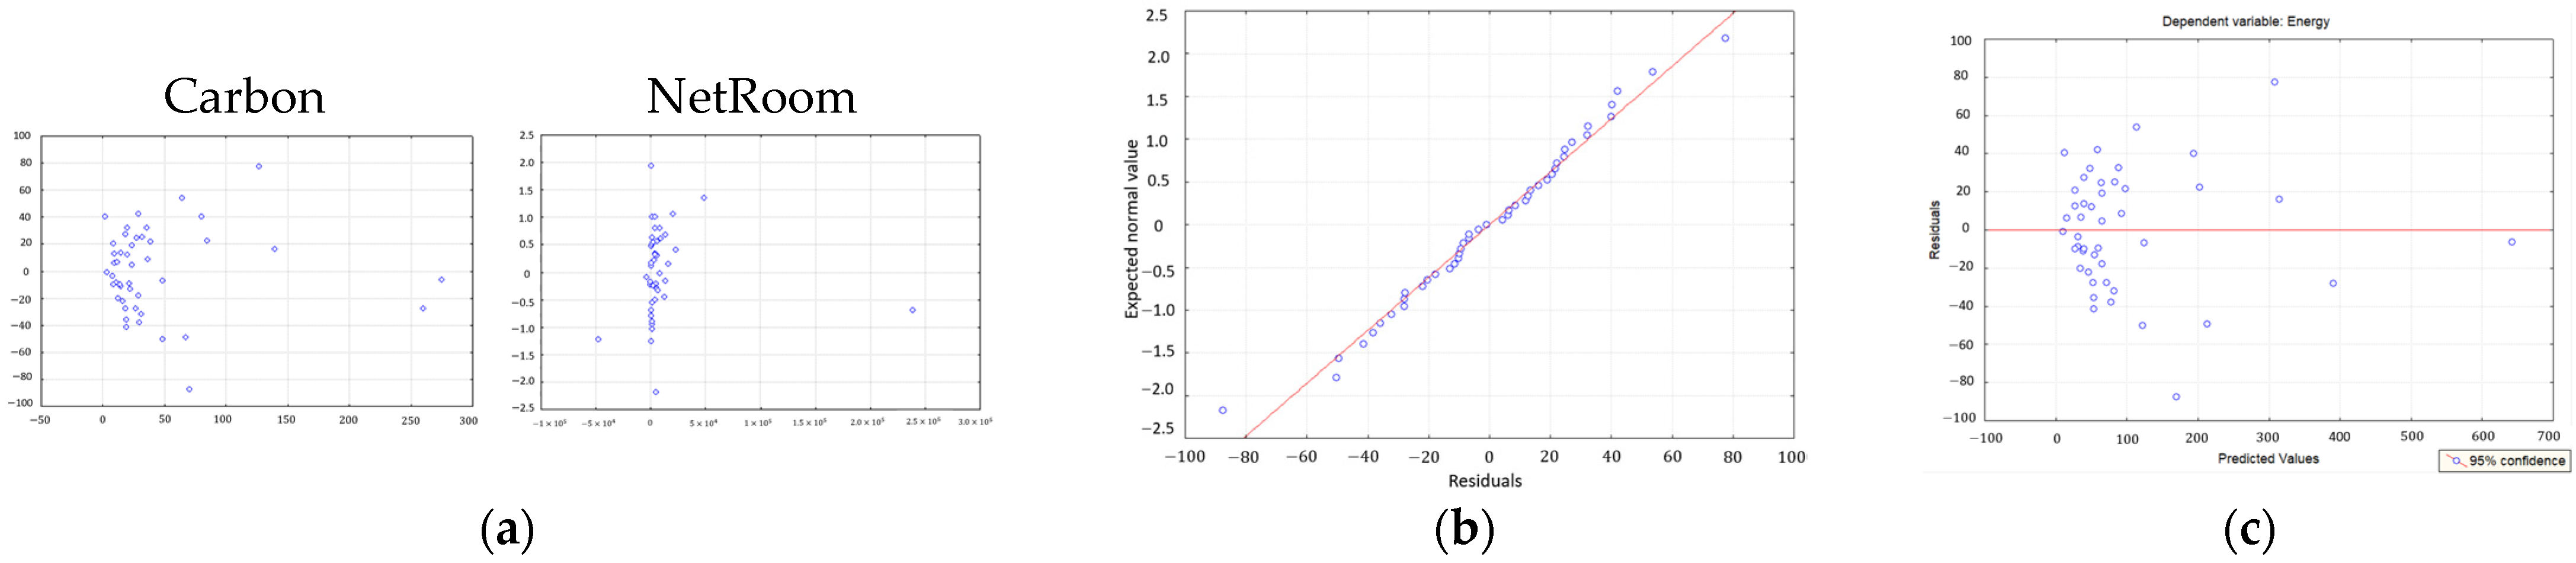
4.3. Multiple Regression—Second Model
5. Discussion
6. Conclusions
Author Contributions
Funding
Institutional Review Board Statement
Informed Consent Statement
Data Availability Statement
Conflicts of Interest
Appendix A

| Yi | Net Profit | RevPAR | Energy | Water | Carbon |
|---|---|---|---|---|---|
| H.1 | 22,878.30 | 444.28 | 331.34 | 2.35 | 139.44 |
| H.2 | 5774.09 | 276.00 | 225.35 | 0.95 | 84.73 |
| H.3 | 921.85 | 134.60 | 50.15 | 0.70 | 31.28 |
| H.4 | 4899.54 | 49.85 | 27.66 | 0.24 | 14.49 |
| H.5 | 6432.72 | 102.83 | 42.24 | 0.59 | 22.04 |
| H.6 | 713.02 | 154.00 | 43.79 | 0.58 | 26.60 |
| H.7 | 916.79 | 75.00 | 24.63 | 0.52 | 18.60 |
| H.8 | 1135.02 | 79.38 | 11.83 | 0.55 | 19.00 |
| H.9 | 3111.59 | 64.72 | 30.23 | 0.22 | 14.29 |
| H.10 | 1699.31 | 81.78 | 23.83 | 0.54 | 16.10 |
| H.11 | 3785.45 | 28.57 | 14.87 | 0.31 | 12.40 |
| H.12 | 909.50 | 41.64 | 72.22 | 0.84 | 48.40 |
| H.13 | 372.36 | 227.95 | 385.83 | 4.05 | 127.20 |
| H.14 | 1253.55 | 41.11 | 40.41 | 0.92 | 29.81 |
| H.15 | 3379.30 | 183.00 | 101.22 | 0.60 | 36.74 |
| H.16 | 9510.91 | 183.46 | 89.29 | 0.79 | 27.33 |
| H.17 | 15,864.20 | 146.00 | 22.45 | 0.15 | 9.31 |
| H.18 | 911.73 | 109.65 | 69.52 | 0.14 | 23.97 |
| H.19 | 303.39 | 85.41 | 84.30 | 0.51 | 23.81 |
| H.20 | 1828.67 | 67.77 | 48.38 | 0.33 | 8.42 |
| H.21 | 1504.88 | 80.90 | 53.18 | 0.18 | 1.96 |
| H.22 | 5730.57 | 144.51 | 62.65 | 0.50 | 19.83 |
| H.23 | 20,119.99 | 183.60 | 100.64 | 0.75 | 29.06 |
| H.24 | 4160.77 | 120.09 | 234.29 | 1.58 | 80.20 |
| H.25 | 238,718.90 | 266.70 | 362.50 | 2.60 | 260.27 |
| H.26 | 1863.48 | 101.61 | 108.66 | 1.08 | 32.30 |
| H.27 | −47,272.73 | 166.50 | 163.99 | 2.56 | 67.22 |
| H.28 | 471.24 | 30.71 | 42.58 | 0.24 | 11.41 |
| H.29 | 8238.21 | 210.65 | 80.46 | 0.51 | 19.89 |
| H.30 | 8524.15 | 101.85 | 9.29 | 0.26 | 3.69 |
| H.31 | 12,614.36 | 122.98 | 47.83 | 0.67 | 29.00 |
| H.32 | 13,247.55 | 808.62 | 636.18 | 0.43 | 274.83 |
| H.33 | 2762.43 | 69.85 | 120.00 | 2.41 | 38.90 |
| H.34 | 3955.69 | 217.42 | 53.17 | 0.65 | 14.41 |
| H.35 | −3979.84 | 104.27 | 28.31 | 0.32 | 7.85 |
| H.36 | 4311.40 | 148.00 | 40.37 | 0.54 | 9.47 |
| H.37 | 1614.62 | 37.41 | 17.71 | 0.44 | 19.28 |
| H.38 | 49,037.36 | 153.00 | 167.76 | 1.30 | 64.57 |
| H.39 | 4398.52 | 58.46 | 121.44 | 2.14 | 35.60 |
| H.40 | 121.75 | 54.43 | 51.11 | 2.19 | 21.70 |
| H.41 | 4564.21 | 145.34 | 22.80 | 0.37 | 11.14 |
| H.42 | −587.73 | 82.26 | 118.16 | 0.89 | 48.80 |
| H.43 | 2664.17 | 52.16 | 17.29 | 0.35 | 8.57 |
| H.44 | 13,458.34 | 196.08 | 66.95 | 0.57 | 18.31 |
| H.45 | 5124.64 | 115.84 | 82.27 | 0.67 | 70.23 |
References
- WTTC Economic Impact Reports. Available online: https://wttc.org/Research/Economic-Impact (accessed on 2 December 2021).
- Xuchao, W.; Priyadarsini, R.; Siew Eang, L. Benchmarking Energy Use and Greenhouse Gas Emissions in Singapore’s Hotel Industry. Energy Policy 2010, 38, 4520–4527. [Google Scholar] [CrossRef]
- Lai, J.H.K. Energy Use and Maintenance Costs of Upmarket Hotels. Int. J. Hosp. Manag. 2016, 56, 33–43. [Google Scholar] [CrossRef]
- Santiago, D.E. Energy Use in Hotels: A Case Study in Gran Canaria. Int. J. Low-Carbon Technol. 2021, 16, 1264–1276. [Google Scholar] [CrossRef]
- Rauf, A.; Ozturk, I.; Ahmad, F.; Shehzad, K.; Chandiao, A.A.; Irfan, M.; Abid, S.; Jinkai, L. Do Tourism Development, Energy Consumption and Transportation Demolish Sustainable Environments ? Evidence from Chinese Provinces. Sustainability 2021, 13, 12361. [Google Scholar] [CrossRef]
- Huang, Z.; Chen, X.; Wang, K.; Zhou, B. Air Conditioning Load Forecasting and Optimal Operation of Water Systems. Sustainability 2022, 14, 4867. [Google Scholar] [CrossRef]
- Khanal, A.; Rahman, M.M. Are Tourism and Energy Consumption Linked ? Evidence from Australia. Sustainability 2021, 13, 10800. [Google Scholar] [CrossRef]
- De Las Casas, A.L.; Mirkova, I.; Ramos-Real, F.J. Stakeholders’ Perceptions of the Possible Energy Sustainability Solutions in the Hotels of the Canary Islands. Sustainability 2021, 13, 6943. [Google Scholar] [CrossRef]
- Wang, J.C.; Huang, K.T. Energy Consumption Characteristics of Hotel’s Marketing Preference for Guests from Regions Perspective. Energy 2013, 52, 173–184. [Google Scholar] [CrossRef]
- Wong, A.K.F.; Kim, S.; Lee, S.; Elliot, S. An Application of Delphi Method and Analytic Hierarchy Process in Understanding Hotel Corporate Social Responsibility Performance Scale. J. Sustain. Tour. 2021, 29, 1153–1179. [Google Scholar] [CrossRef]
- de Grosbois, D.; Fennell, D.A. Determinants of Climate Change Disclosure Practices of Global Hotel Companies: Application of Institutional and Stakeholder Theories. Tour. Manag. 2022, 88, 104404. [Google Scholar] [CrossRef]
- Mechri, H.E.; Amara, S. Investigation and Analysis of Energy and Water Use of Hotel Buildings in Tunisia. Energy Build. 2021, 241, 110930. [Google Scholar] [CrossRef]
- Bohdanowicz, P.; Martinac, I. Determinants and Benchmarking of Resource Consumption in Hotels-Case Study of Hilton International and Scandic in Europe. Energy Build. 2007, 39, 82–95. [Google Scholar] [CrossRef]
- Wang, J.C. A Study on the Energy Performance of Hotel Buildings in Taiwan. Energy Build. 2012, 49, 268–275. [Google Scholar] [CrossRef]
- Tang, M.; Fu, X.; Cao, H.; Shen, Y.; Deng, H.; Wu, G. Energy Performance of Hotel Buildings in Lijiang, China. Sustainability 2016, 8, 780. [Google Scholar] [CrossRef]
- Bhattacharyya, A.; Yang, H. Biodiversity Disclosure in Australia: Effect of GRI and Institutional Factors. Australas. J. Environ. Manag. 2019, 26, 347–369. [Google Scholar] [CrossRef]
- Lai, J.H.K. Carbon Footprints of Hotels: Analysis of Three Archetypes in Hong Kong. Sustain. Cities Soc. 2015, 14, 334–341. [Google Scholar] [CrossRef]
- Hua, N.; Wei, W.; DeFranco, A.L.; Wang, D. Do Loyalty Programs Really Matter for Hotel Operational and Financial Performance? Int. J. Contemp. Hosp. Manag. 2018, 30, 2195–2213. [Google Scholar] [CrossRef]
- Hair, J.F.; Black, B.; Babin, B.; Anderson, R.E.; Tatham, R.L. Multivariate Data Analysis; Pearson: London, UK, 2006. [Google Scholar]
- Xu, X.; Yan, Z. Probabilistic Load Flow Calculation with Quasi-Monte Carlo and Multiple Linear Regression. Electr. Power Energy Syst. 2017, 88, 1–12. [Google Scholar] [CrossRef]
- Ibrahim, S.; Daut, I.; Irwan, Y.M.; Irwanto, M.; Gomesh, N.; Farhana, Z. Linear Regression Model in Estimating Solar Radiation in Perlis. Energy 2012, 18, 1402–1412. [Google Scholar] [CrossRef]
- Singh, R.; Umrao, R.K.; Ahmad, M.; Ansari, M.K.; Sharma, L.; Singh, T.N. Prediction of Geomechanical Parameters Using Soft Computing and Multiple Regression Approach. Measurement 2017, 99, 108–119. [Google Scholar] [CrossRef]
- Babatunde, A.A.; Abbasoglu, S. Predictive Analysis of Photovoltaic Plants Specific Yield with the Implementation of Multiple Linear Regression Tool. Environ. Prog. Sustain. Energy 2019, 38, 1–9. [Google Scholar] [CrossRef]
- Da Silva, E.V.; Jacobi, L.F. Regressão Linear e Não Linear Aplicado Ao Estudo de Casos de AIDS Na Região Norte Do Brasil. Ciênc. Nat. 2020, 42, e27. [Google Scholar] [CrossRef]
- Jacobi, L.F.; Souza, A.M.; da Silva Pereira, J.E. Gráfico de Controle de Regressão Aplicado Na Monitoração de Processos. Production 2002, 12, 46–59. [Google Scholar] [CrossRef][Green Version]
- Kularatne, T.; Wilson, C.; Mansson, J.; Hoang, V.; Lee, B. Do Environmentally Sustainable Practices Make Hotels More Efficient? A Study of Major Hotels in Sri Lanka. Tour. Manag. 2019, 71, 213–225. [Google Scholar] [CrossRef]
- Benavides-Velasco, C.A.; Quintana-García, C.; Marchante-Lara, M. Total Quality Management, Corporate Social Responsibility and Performance in the Hotel Industry. Int. J. Hosp. Manag. 2014, 41, 77–87. [Google Scholar] [CrossRef]


| Authors | Sample and Period | Region | Dependent Variable(s) | Independent Variable(s) | Significant Result(s) |
|---|---|---|---|---|---|
| [2] | 29 hotels—2004 | Singapore | Energy use | Star rating Worker density Last retrofit | Star rating (−) Worker density (+) |
| [3] | 30 hotels—2013 | Hong Kong | Energy use | Building age Floor area Guestroom Occupancy rate Maintenance costs | Floor area (+) |
| [4] | 6 hotels—2019/2020 | Gran Canaria | Energy use | Overnight stays Number of diners Number of workers Number of rooms RevPAR Pool volume Number of guests per room | RevPAR (+) Number of diners (+) Pool volume (+) Number of guests per room (+) |
| [9] | 73 hotels—2010 | Taiwan | Energy use | Foreign individual travelers (FIT) Number of group guests | FIT (+) Group guests (+) |
| [12] | 55 hotels—2018 | Tunisia | Energy use and water use | Floor area Number of beds Number of guests rooms Number of guests-nights Occupancy rate Floor area (guestrooms) | Floor area (guestrooms) (+) Number of guests-nights (+) |
| [4] | 6 hotels—2019/2020 | Gran Canaria | Energy use | Overnight stays Number of diners Number of workers Number of rooms RevPAR Pool volume Number of guests per room | RevPAR (+) Number of diners (+) Pool volume (+) Number of guests per room (+) |
| [13] | 184 hotels—2004 | Europe | Energy and water use | Floor area Guest-nights sold Food cover sold laundry washed on-site On-site health club | Floor area (+) Guest-nights sold (+) Food cover sold (+) |
| [14] | 200 hotels—2010 | Taiwan | Energy use | Floor area Number of rooms Number of buildings Number of workers Occupancy rate ADR Total revenue Number of guests | Floor area (+) Number of rooms (+) ADR (+) Total revenue (+) Occupancy rate (+) |
| [15] | 24 hotels—2013 | Lijiang, China | Energy use | Floor area Number of guests rooms Star rating Occupancy rate Room revenue Number of workers Floor area (guestrooms) | Star rating (+) Occupancy rate (+) |
| Variable | Valid n | Mean | Minimum | Maximum | Std. Deviation |
|---|---|---|---|---|---|
| NetRoom (USD) | 45 | 9821.5 | −47,272.7 | 238,718.9 | 36,788.6 |
| RevPAR (USD) | 45 | 141.1 | 28.6 | 808.6 | 129.0 |
| Energy (KWh/occupied room) | 45 | 101.0 | 9.3 | 636.2 | 121.3 |
| Water (m3/occupied room) | 45 | 0.9 | 0.1 | 4.0 | 0.8 |
| Carbon (kgCO2e/occupied room) | 45 | 42.9 | 2.0 | 274.8 | 57.2 |
| Panel A—Regression Summary | |||
| Variable | Coefficient | t-Statistic | p-Value |
| Intercept | −17.8615 | −2.2049 | 0.033 |
| NetRoom | −0.0006 | −3.8490 | <0.001 |
| RevPAR | 0.2437 | 3.7953 | <0.001 |
| Water | 23.6850 | 3.7234 | <0.001 |
| Carbon | 1.6201 | 8.3709 | <0.001 |
| Panel B—Analysis of Variance | |||
| F-Statistic | 212.86 | ||
| p-value | <0.001 | ||
| R2 Adjusted | 0.9506 | ||
| Panel A—Regression Summary | |||
| Variable | Coefficient | t-Statistic | p-Value |
| Intercept | 9.6675 | 1.5907 | 0.119 |
| NetRoom | −0.0010 | −5.9775 | <0.001 |
| Carbon | 2.3502 | 22.5844 | <0.001 |
| Panel B—Analysis of Variance | |||
| F-Statistic | 295.10 | ||
| p-value | <0.001 | ||
| R2 Adjusted | 0.9304 | ||
Publisher’s Note: MDPI stays neutral with regard to jurisdictional claims in published maps and institutional affiliations. |
© 2022 by the authors. Licensee MDPI, Basel, Switzerland. This article is an open access article distributed under the terms and conditions of the Creative Commons Attribution (CC BY) license (https://creativecommons.org/licenses/by/4.0/).
Share and Cite
Arenhart, R.S.; Souza, A.M.; Zanini, R.R. Energy Use and Its Key Factors in Hotel Chains. Sustainability 2022, 14, 8239. https://doi.org/10.3390/su14148239
Arenhart RS, Souza AM, Zanini RR. Energy Use and Its Key Factors in Hotel Chains. Sustainability. 2022; 14(14):8239. https://doi.org/10.3390/su14148239
Chicago/Turabian StyleArenhart, Rodrigo Schons, Adriano Mendonça Souza, and Roselaine Ruviaro Zanini. 2022. "Energy Use and Its Key Factors in Hotel Chains" Sustainability 14, no. 14: 8239. https://doi.org/10.3390/su14148239
APA StyleArenhart, R. S., Souza, A. M., & Zanini, R. R. (2022). Energy Use and Its Key Factors in Hotel Chains. Sustainability, 14(14), 8239. https://doi.org/10.3390/su14148239